basic income as a policy option: can it add up? · 60% 80% 100% per-capita benefit spending social...
TRANSCRIPT
Basic Income
as a policy option:
Can it add up? Workshop on the Future of Social Protection
Berlin, 12 June 2017
Herwig Immervoll
Jobs and Income, OECD
[email protected] Follow us on Twitter, via @OECD_Social

2
Universal Basic Income Lots of interest, but also unanswered questions
Proposals for a BI are much in the news
• Several pilots are underway or soon to be: – Finland (only national pilot so far)
– A number of municipalities or regions: eg, Oakland, CA; Livorno, Italy; three districts in Ontario, Canada
– Concrete proposals discussed or prepared in Québec and France, but also a decisive “no” vote in the Swiss referendum
• Idea appears popular in principle – Eg, 68% support in a recent survey of EU-28…
– …but evidence that support fades when people are shown details of feasible benefit amounts or of the tax rises needed to finance it
What is a Basic Income?
• Debates are sometimes about related, but different, reform ideas (e.g., integrating fragmented assistance benefits)
To fix ideas: What could a BI look like in practice?
Costs
Distributional effects: who would gains or lose?

3
Existing cash support can be patchy and is
not always tightly targeted to the poor
Transfers received by working-age individuals in low and high-income groups, 2013 or latest year available
Ages 18-65 (18-62 in France). Public social cash transfers at the household level. OECD Income Distribution Database.
0
50
100
150
200
250% of average transfer Poorest 20% Richest 20%

Inefficient targeting “gains for the rich”, “pay with one hand, receive with the other”
High budgetary costs
No automatic stabiliser unconditional benefits cannot be counter cyclical
Negative effects on employment erosion of work incentives? “Why would anyone still work?”
Engaging jobseekers in active labour-market policies difficult once the link between benefits and active job search is broken
Further downward pressure on wages would employers “pocket” a new Basic Income by lowering wages?
Concerns are often plausible and justified
Yet most are also frequently voiced about existing social protection
In practice, costs / benefits are empirical question, vary by country 4
Basic Income
Criticisms, potential downsides

5
Notes: poverty threshold at 50% of median disposable income. Spending on “working-age” benefits includes expenditures on all public cash transfers minus old-age and survivors categories. Social assistance amounts exclude support for rented accommodation. Sources: OECD Social Expenditure (www.oecd.org/social/expenditure.htm) and Income Distribution (oe.cd/idd) databases.
0%
20%
40%
60%
80%
100%
per-capita benefit spending social assistance for single person
Relative poverty line
Current benefit spending is not enough to finance a
BI close to the poverty line
BI amount that would be equivalent to current spending on working-age benefits 2014, in % of a (low) relative poverty line

6
Notes: poverty threshold at 50% of median disposable income. “non-elderly” benefits is total spending on public cash transfers minus old-age and survivors categories. Social assistance amounts exclude support for rented accommodation. Sources: OECD Social Expenditure (www.oecd.org/social/expenditure.htm) and Income Distribution (oe.cd/idd) databases, OECD tax-benefit models (www.oecd.org/social/benefits-and-wages.htm).
0%
20%
40%
60%
80%
100%
per-capita benefit spending GMI for single person
Relative poverty line
Current benefit spending is not enough to finance a
BI close to the poverty line
BI amount that would be equivalent to current spending on working-age benefits 2014, compared to poverty cut-off and to current minimum-income benefit (GMI) amounts

7
A hypothetical scenario: Basic Income as main form of social protection for the non-elderly
BI design features
Individual or household based? Individual, different
amount for adults and children
Replace or keep existing benefits? Replace most
working-age benefits (except housing and disability)
What amount? budgetary
neutral, anchored on level of existing minimum-income
benefits
Who receives it? Unconditional: All below
normal statutory retirement age
Tax changes? All zero-tax
bands abolished
8
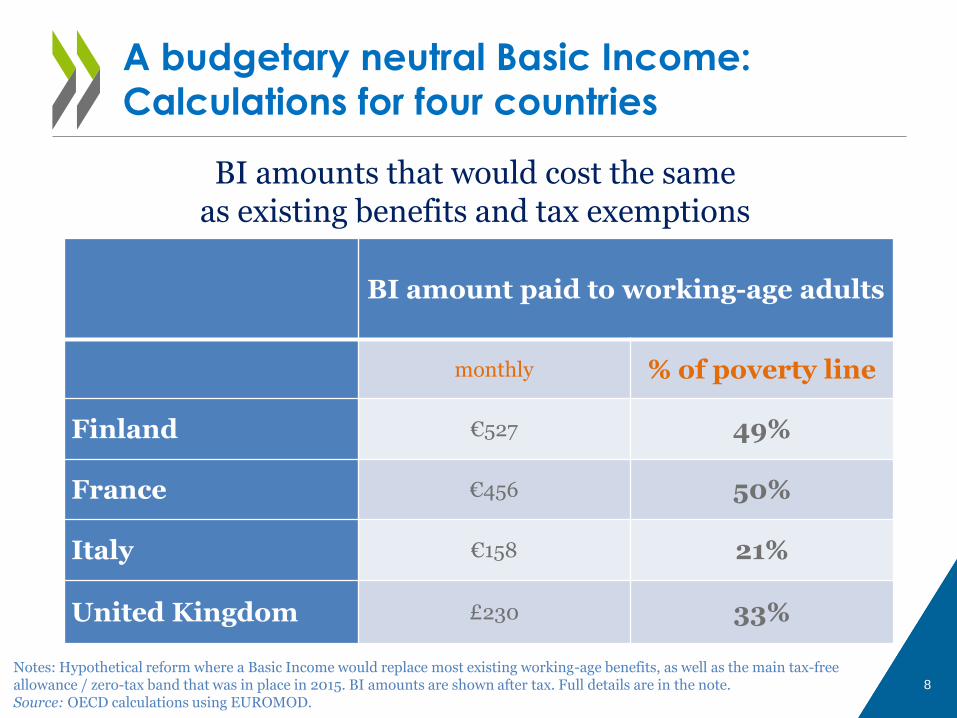
A budgetary neutral Basic Income: Calculations for four countries
Notes: Hypothetical reform where a Basic Income would replace most existing working-age benefits, as well as the main tax-free allowance / zero-tax band that was in place in 2015. BI amounts are shown after tax. Full details are in the note. Source: OECD calculations using EUROMOD.
BI amount paid to working-age adults
monthly % of poverty line
Finland €527 49%
France €456 50%
Italy €158 21%
United Kingdom £230 33%
BI amounts that would cost the same as existing benefits and tax exemptions
9
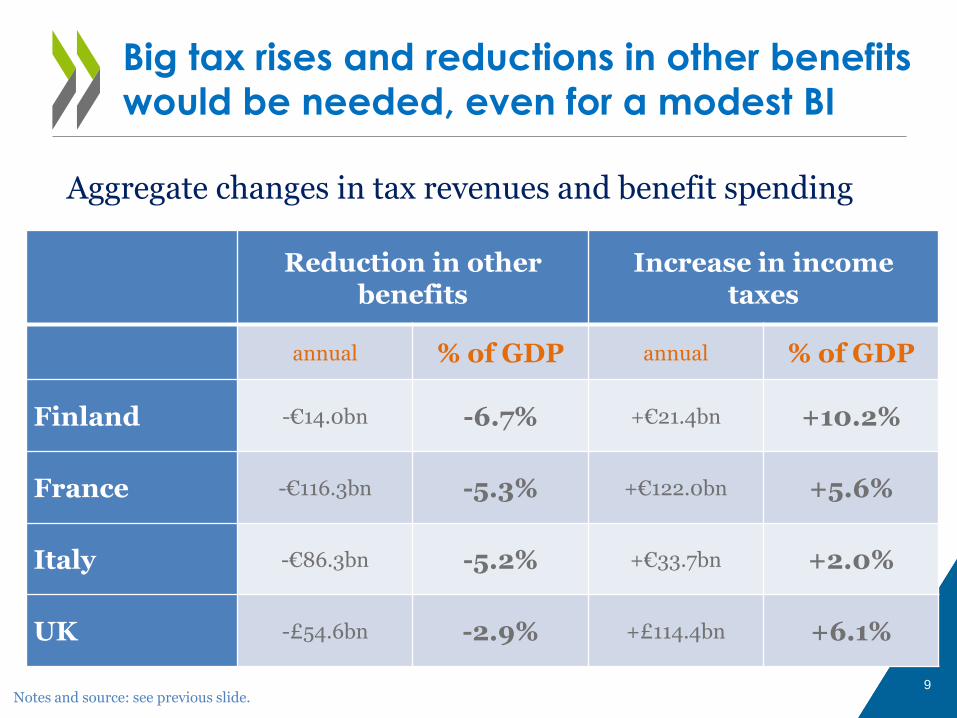
Big tax rises and reductions in other benefits would be needed, even for a modest BI
Notes and source: see previous slide.
Reduction in other benefits
Increase in income taxes
annual % of GDP annual % of GDP
Finland -€14.0bn -6.7% +€21.4bn +10.2%
France -€116.3bn -5.3% +€122.0bn +5.6%
Italy -€86.3bn -5.2% +€33.7bn +2.0%
UK -£54.6bn -2.9% +£114.4bn +6.1%
Aggregate changes in tax revenues and benefit spending

10
Gains and losses: Few people would see their incomes unaffected
Number of gainers and loser, % of all BI recipients
0%
20%
40%
60%
80%
100%
Finland France Italy UK
Gain more than 10%
Gain 5-10%
Gain 1-5%
Within 1%
Lose 1-5%
Lose 5-10%
Lose more than 10%
Notes and source: see previous slide.

11
Early retirees would lose out when existing
benefits are replaced with a modest BI
% losing, by age
0
10
20
30
40
50
60
70
Notes and source: see previous slide.
12
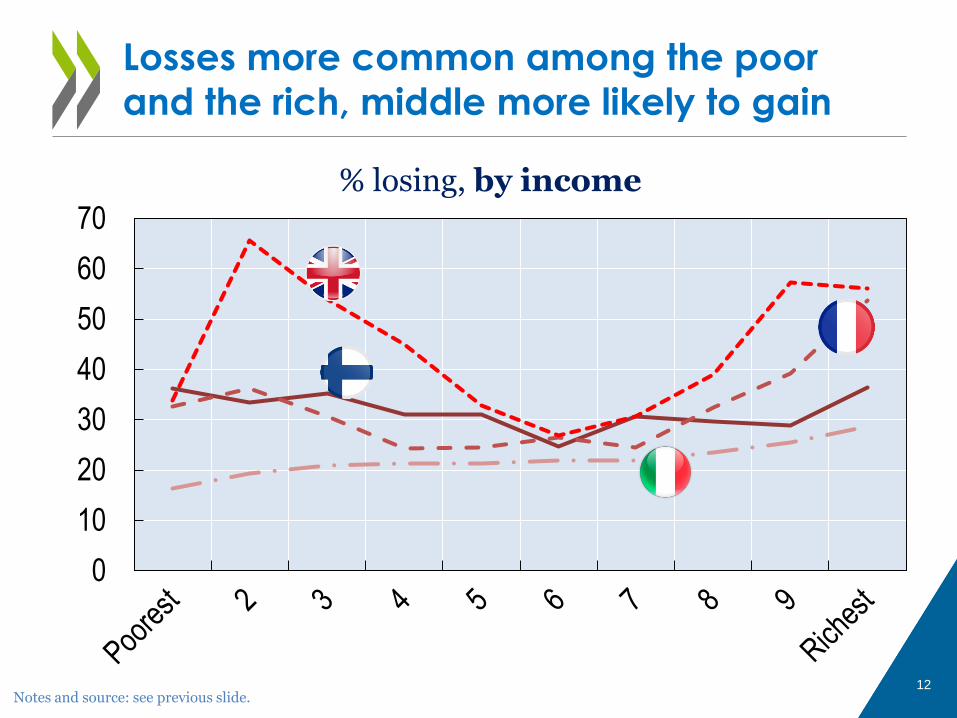
Losses more common among the poor
and the rich, middle more likely to gain
% losing, by income
0
10
20
30
40
50
60
70
Notes and source: see previous slide.
13
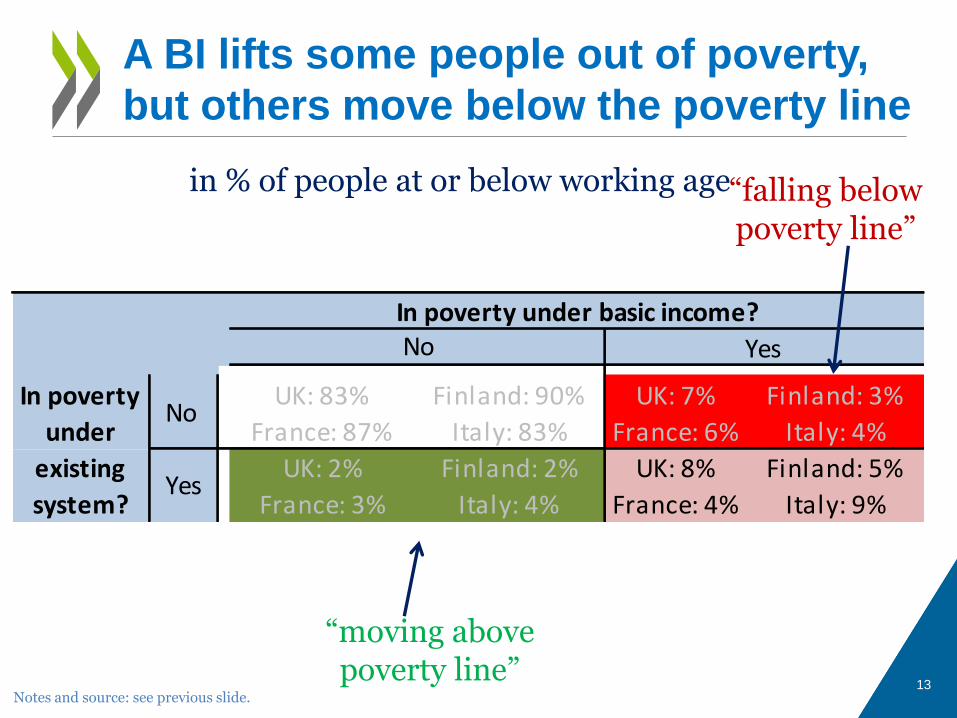
UK: 83% Finland: 90% UK: 7% Finland: 3%
France: 87% Italy: 83% France: 6% Italy: 4%
UK: 2% Finland: 2% UK: 8% Finland: 5%
France: 3% Italy: 4% France: 4% Italy: 9%
No
Yes
In poverty under basic income?No Yes
In poverty
under
existing
system?
“moving above poverty line”
“falling below poverty line”
A BI lifts some people out of poverty,
but others move below the poverty line
in % of people at or below working age
Notes and source: see previous slide.
Budget-neutral BI for individuals below normal retirement age requires
a modest BI level, set significantly below the poverty line
abolishing most existing benefits
substantial additional tax revenues
BI debate usefully shines light on gaps in social protection systems, and universal benefits alleviate coverage problems
But without targeting, or much higher spending, poverty risks can increase as current benefit recipients lose out, especially for
countries with comprehensive existing social protection
older working-age individuals if early retirement is common
recipients of unemployment insurance benefits
some families with children (eg, lone parents) 14
Summary: Budget and distributional effects
of a comprehensive Basic Income
Instead of introducing a BI, make existing benefits more accessible?
Instead of replacing existing benefits, introduce BI as an additional transfer?
An (even) lower Basic Income amount?
Lower recipient numbers by tying BI to (mild) conditions? e.g., “Participation Income”
Lower initial costs and losses through a gradual roll-out of BI? e.g. to new cohorts of young adults
Limit duration? e.g., BI available for a certain number of years during lifetime, perhaps with restrictions 15
A “partial” Basic Income instead?
16
Thank you [email protected]
Sources and references
• “Basic income as a policy option: Can it add up?” via www.oecd.org/employment/future-of-work.htm
• OECD databases:
Income Distribution Dbase oe.cd/idd
Social Expenditure Dbase www.oecd.org/social/expenditure.htm
Social Benefit Recipients Dbase www.oecd.org/social/recipients.htm
• Immervoll, Jenkins, Königs (2015), “Are recipients of
social assistance ‘benefit dependent’?”
via dx.doi.org/10.1787/5jxrcmgpc6mn-en
• Immervoll (2009), “Minimum-income benefits in OECD
countries: Policies and challenges” via dx.doi.org/10.1787/218402763872

Additional results
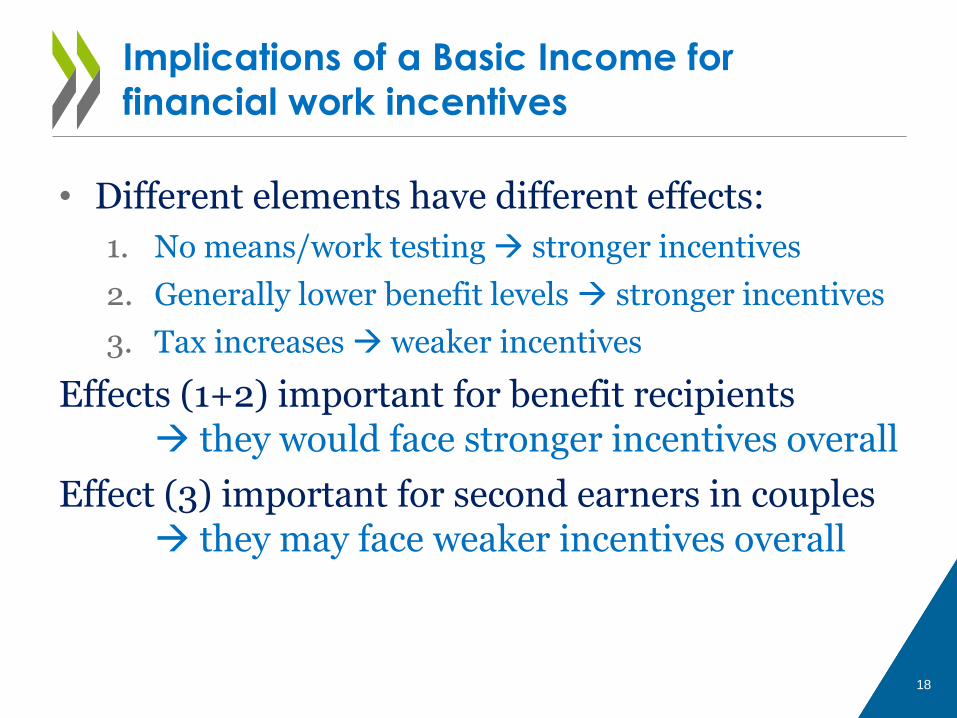
• Different elements have different effects:
1. No means/work testing stronger incentives
2. Generally lower benefit levels stronger incentives
3. Tax increases weaker incentives
Effects (1+2) important for benefit recipients they would face stronger incentives overall
Effect (3) important for second earners in couples they may face weaker incentives overall
18
Implications of a Basic Income for
financial work incentives

19
Thank you [email protected]
Sources and references
• “Basic income as a policy option: Can it add up?” via www.oecd.org/employment/future-of-work.htm
• OECD databases:
Income Distribution Dbase oe.cd/idd
Social Expenditure Dbase www.oecd.org/social/expenditure.htm
Social Benefit Recipients Dbase www.oecd.org/social/recipients.htm
• Immervoll, Jenkins, Königs (2015), “Are recipients of
social assistance ‘benefit dependent’?”
via dx.doi.org/10.1787/5jxrcmgpc6mn-en
• Immervoll (2009), “Minimum-income benefits in OECD
countries: Policies and challenges” via dx.doi.org/10.1787/218402763872