growth dynamics and the evolution of cooperation in ... · growth dynamics and the evolution of...
TRANSCRIPT

Growth dynamics and the evolution of cooperation in
microbial populations
Jonas Cremer, Anna Melbinger & Erwin Frey
Arnold Sommerfeld Center for Theoretical Physics (ASC) and Center for
NanoScience (CeNS), Department of Physics, Ludwig-Maximilians-Universitat
Munchen, Theresienstrasse 37, D-80333 Munchen, Germany
Abstract
Microbes providing public goods are widespread in nature despite running the risk
of being exploited by free-riders. However, the precise ecological factors supporting
cooperation are still puzzling. Following recent experiments, we consider the role
of population growth and the repetitive fragmentation of populations into new
colonies mimicking simple microbial life-cycles. Individual-based modeling reveals
that demographic fluctuations, which lead to a large variance in the composition of
colonies, promote cooperation. Biased by population dynamics these fluctuations
result in two qualitatively distinct regimes of robust cooperation under repetitive
fragmentation into groups. First, if the level of cooperation exceeds a threshold,
cooperators will take over the whole population. Second, cooperators can also
emerge from a single mutant leading to a robust coexistence between cooperators
and free-riders. We find frequency and size of population bottlenecks, and growth
dynamics to be the major ecological factors determining the regimes and thereby
the evolutionary pathway towards cooperation.
1
arX
iv:1
203.
5863
v1 [
q-bi
o.PE
] 2
7 M
ar 2
012
One pivotal question in evolutionary biology is the emergence of cooperative traits and
their sustainment in the presence of free-riders (Axelrod and Hamilton, 1981; Frank, 1998;
Hamilton, 1964; Maynard-Smith and Szathmary, 1995; Nowak, 2006; West and Gardner,
2010). By providing a public good, cooperative behavior of every single individual would
be optimal for the entire population. However, non-contributing free-riders may take evo-
lutionary advantage by saving the costs for providing the benefit and hence jeopardize the
survival of the whole population. In evolutionary theory kin selection (Foster et al., 2006;
Hamilton, 1964; Michod, 1982; West et al., 2007), multi-level selection (Hamilton, 1975;
Nowak et al., 2010; Okasha, 2006; Wilson, 1975), and reciprocity (Trivers, 1971) have been
found to provide conceptual frameworks to resolve the dilemma (Frank, 1998; Nowak, 2006;
West and Gardner, 2010). For higher developed organisms, stable cooperation is generally
traced back to specific mechanisms like repeated interaction (Axelrod and Hamilton, 1981;
Trivers, 1971), punishment (Fehr and Fischbacher, 2003; Yamagishi, 1986), and kin discrim-
ination (Hamilton, 1964; Queller et al., 2003; West and Gardner, 2010; West et al., 2006).
But how can cooperation emerge in the first place and be maintained without abilities like
memory or recognition? Answering this question is especially important within the ex-
panding field of biofilm formation (Keller and Surette, 2006; Nadell et al., 2009; Rainey and
Rainey, 2003; Stewart and Franklin, 2008; Velicer, 2003; Xavier, 2011). There, a successfully
cooperating collective of microbes runs the risk to be undermined by non-producing strains
saving the metabolically costly supply of biofilm formation (Nadell et al., 2009; Velicer,
2003; West et al., 2006; Xavier, 2011). Sophisticated social behavior cannot be presumed
to explain the high level of cooperation observed in nature and experiments (Ackermann
et al., 2008; Buckling et al., 2007; Chuang et al., 2010, 2009; Gore et al., 2009; Griffin et al.,
2004; Kummerli et al., 2009; Rainey and Rainey, 2003; Velicer, 2003; West et al., 2006;
Xavier, 2011). Instead, different forms of limited dispersal, such as spatial arrangements,
or fragmentation into groups are essential to resolve the dilemma of cooperation among
such microbial organisms (Hamilton, 1964; Maynard Smith, 1964; Nowak and May, 1992).
Indeed, in nature microbes typically life in colonies and biofilms. Remarkable, although
details strongly differ from species to species, most microbial populations follow a life cycle
of colony initiation, maturation, maintenance and dispersal leading to new initiation, see
e.g. (Costerton et al., 1987; Hall-Stoodley et al., 2004; McDougald et al., 2011; O’Toole
et al., 2000; Xavier, 2011). Well-studied examples include Pseudomonas aeruginosa (Sauer
2
et al., 2002), Escherichia coli (Beloin et al., 2008), Bacillus subtilis(Lemon et al., 2008) and
Myxococcus xanthus (Velicer and Vos, 2009). Even though such a life-cycle is often com-
plexly regulated e.g. by environmental impacts and including collective behavior of colonies,
populations bottlenecks alternating with growth phases are essential components of most
microbial life-cycles. Employing simplified setups, recent experiments address the role of
population bottlenecks and growth by studying structured microbial populations of cooper-
ators and free-riders (Buckling et al., 2007; Chuang et al., 2010, 2009; Griffin et al., 2004;
Kummerli et al., 2009). In these setups small founder colonies differing in composition were
cultivated in separate habitats. For example, Chuang et al. (Chuang et al., 2009) used 96-
well plates as structured environment with a dilution of synthetically designed E.coli strains
where the cooperative strain is producer of a public good provoking antibiotic resistance.
A microbial life-cycle was generated in the lab by regularly mixing all colonies after a cer-
tain time and inoculating new cultures. Under these conditions, an increase in the overall
level of cooperation was observed even though free-riders have a growth advantage within
every colony. However, the precise conditions under which cooperation is favored are sub-
tle (Chuang et al., 2010; Foster et al., 2006; Killingback et al., 2006; Maynard Smith, 1964;
Motro, 1991; Nowak et al., 2010; Pfeiffer et al., 2001; Szathmary and Demerter, 1987; Sza-
thmary, 1993; Traulsen, 2009; Traulsen and Nowak, 2006; West et al., 2007; Wilson, 1975;
Wilson and Wilson, 2007). A possible theoretical explanation for the observed increase in
cooperation is the antagonism between two levels of selection, as widely discussed in the
literature (Okasha, 2006). Here, these levels, intra- and inter-group evolution, arise as pop-
ulation dynamics alternates between independent evolution in subpopulations (groups) and
global competition in a merged well-mixed population. Due to the dilemma of cooperation,
free-riders are always better off than cooperators within each group (intra-group evolution).
In contrast, on the inter-group level, groups with a higher fraction of cooperators are favored
over groups with a lower one.
In this article, we study the interplay between the dynamics at the intra- and inter-group
evolution and how it may provoke the maintenance or even the emergence of cooperation. We
propose a generic individual-based model which includes three essential elements: a growth
disadvantage of cooperators within each group, an advantage of groups incorporating more
cooperative individuals, and regularly occurring regrouping events; cf. Fig. 1. Well-known
from the theories of kin (Hamilton, 1964; Michod, 1982; Traulsen, 2009; West et al., 2007)
3
and multi-level selection (Chuang et al., 2009; Okasha, 2006; Price, 1970; Traulsen, 2009),
cooperation can increase in principle: While, within a group i, the fraction of cooperators, ξi,
decreases, groups also change their size, νi, such that the fraction of cooperators in the total
population, given by the weighted average, x =∑
i νi ξi /∑
i νi, may still increase. Such an
increase is an example of Simpson’s paradox (Chuang et al., 2009). To occur, a decreasing
fraction of cooperators, ξi, within groups must be compensated by changing weights, νi/N , in
the total population of size N =∑
i νi, i.e. by a sufficiently high positive correlation between
a group’s size and its fraction of cooperators (Price, 1970). Here we want to go beyond stating
this mathematical fact and reveal the ecological factors underlying these correlations. To
this end the full stochastic dynamics at the intra- and inter-group level will be analyzed. A
key element will be the intricate coupling between the dynamics of the composition and the
dynamics of the overall size of a group. This applies in particular to microbial populations
where the reproduction rate of microbes strongly depends on environmental conditions and
thereby also on the composition of the population (Monod, 1949). Therefore, a proper
theoretical formulation has to account for a dynamics in the group size (Cremer et al., 2011;
Melbinger et al., 2010) rather than assuming it to be constant as in most classical approaches
(Fisher, 1930; Moran, 1964; Wright, 1931). Such a dynamic formulation will allow us to
investigate ecological mechanisms for the evolution and maintenance of cooperation.
Motivated by microbial life-cycles (Costerton et al., 1987; Hall-Stoodley et al., 2004;
McDougald et al., 2011; O’Toole et al., 2000; Xavier, 2011) and the aforementioned experi-
ments (Buckling et al., 2007; Chuang et al., 2010, 2009; Griffin et al., 2004; Kummerli et al.,
2009), we consider a population of cooperators and free-riders and its evolution in a repet-
itive cycle consisting of three consecutive steps (Maynard Smith, 1964), cf. Fig. 1. In the
group formation step, the total population with a fraction of cooperators, x0, is divided into
a set of M groups by an unbiased stochastic process such that the group size and the fraction
of cooperation vary statistically with mean values n0 and x0, respectively. Subsequently, the
groups evolve independently (group evolution step). In each group, both the fraction of
cooperators and the group size vary dynamically and change over time. Independent of the
specific details, the groups’ internal dynamics has the following characteristic features: First,
because of the costs for providing the benefit, cooperators have a selection disadvantage, s,
compared to cheaters in the same group. In particular, cooperators reproduce slower than
cheaters and hence the fraction of cooperators decreases within each group (intra-group
4
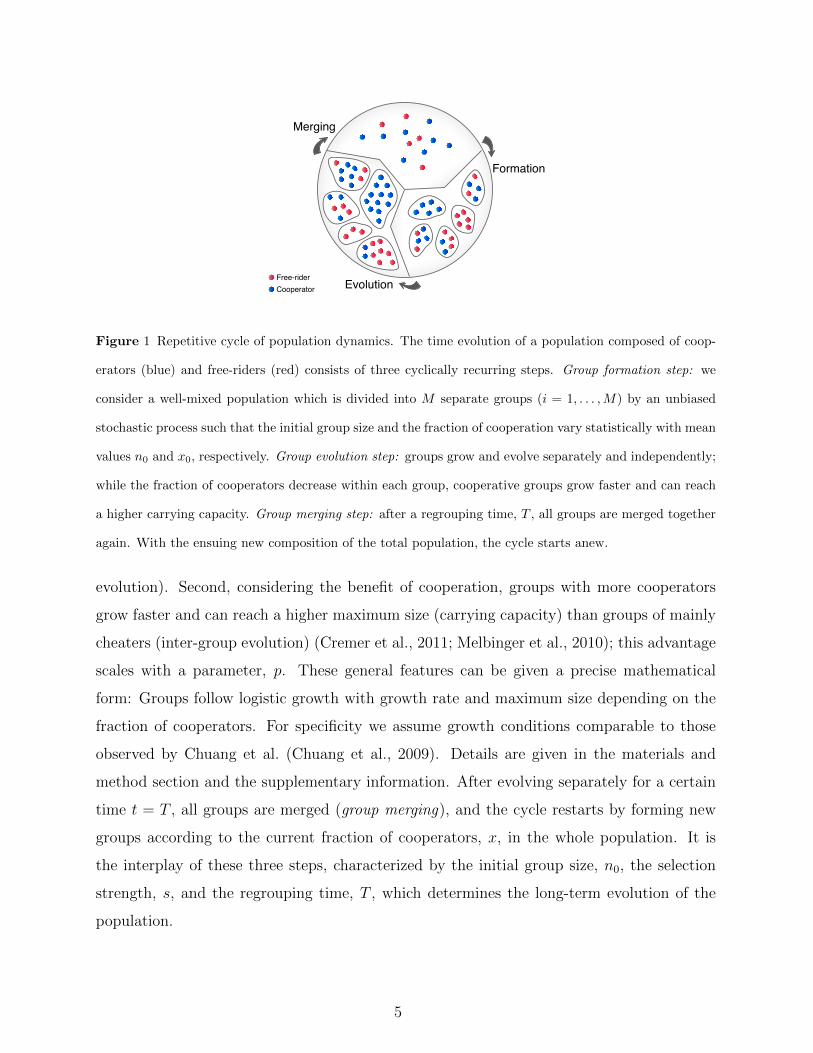
Merging
CooperatorFree-rider
Formation
Evolution
Figure 1 Repetitive cycle of population dynamics. The time evolution of a population composed of coop-
erators (blue) and free-riders (red) consists of three cyclically recurring steps. Group formation step: we
consider a well-mixed population which is divided into M separate groups (i = 1, . . . ,M) by an unbiased
stochastic process such that the initial group size and the fraction of cooperation vary statistically with mean
values n0 and x0, respectively. Group evolution step: groups grow and evolve separately and independently;
while the fraction of cooperators decrease within each group, cooperative groups grow faster and can reach
a higher carrying capacity. Group merging step: after a regrouping time, T , all groups are merged together
again. With the ensuing new composition of the total population, the cycle starts anew.
evolution). Second, considering the benefit of cooperation, groups with more cooperators
grow faster and can reach a higher maximum size (carrying capacity) than groups of mainly
cheaters (inter-group evolution) (Cremer et al., 2011; Melbinger et al., 2010); this advantage
scales with a parameter, p. These general features can be given a precise mathematical
form: Groups follow logistic growth with growth rate and maximum size depending on the
fraction of cooperators. For specificity we assume growth conditions comparable to those
observed by Chuang et al. (Chuang et al., 2009). Details are given in the materials and
method section and the supplementary information. After evolving separately for a certain
time t = T , all groups are merged (group merging), and the cycle restarts by forming new
groups according to the current fraction of cooperators, x, in the whole population. It is
the interplay of these three steps, characterized by the initial group size, n0, the selection
strength, s, and the regrouping time, T , which determines the long-term evolution of the
population.
5
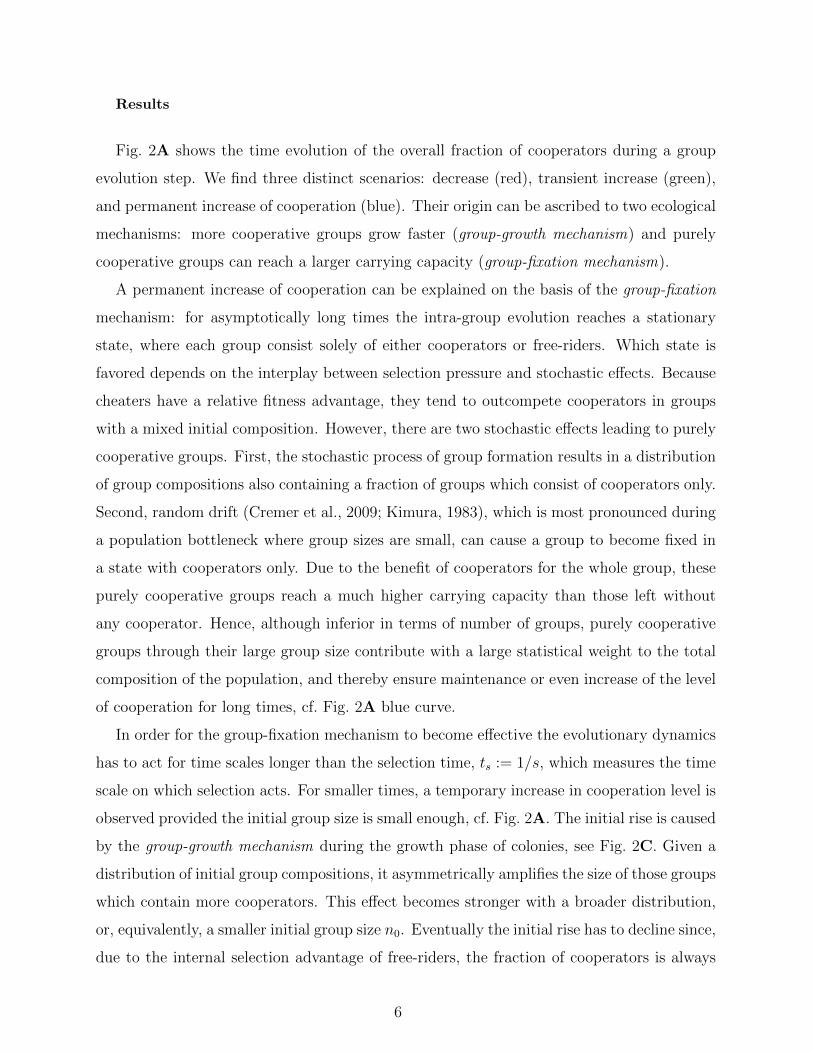
Results
Fig. 2A shows the time evolution of the overall fraction of cooperators during a group
evolution step. We find three distinct scenarios: decrease (red), transient increase (green),
and permanent increase of cooperation (blue). Their origin can be ascribed to two ecological
mechanisms: more cooperative groups grow faster (group-growth mechanism) and purely
cooperative groups can reach a larger carrying capacity (group-fixation mechanism).
A permanent increase of cooperation can be explained on the basis of the group-fixation
mechanism: for asymptotically long times the intra-group evolution reaches a stationary
state, where each group consist solely of either cooperators or free-riders. Which state is
favored depends on the interplay between selection pressure and stochastic effects. Because
cheaters have a relative fitness advantage, they tend to outcompete cooperators in groups
with a mixed initial composition. However, there are two stochastic effects leading to purely
cooperative groups. First, the stochastic process of group formation results in a distribution
of group compositions also containing a fraction of groups which consist of cooperators only.
Second, random drift (Cremer et al., 2009; Kimura, 1983), which is most pronounced during
a population bottleneck where group sizes are small, can cause a group to become fixed in
a state with cooperators only. Due to the benefit of cooperators for the whole group, these
purely cooperative groups reach a much higher carrying capacity than those left without
any cooperator. Hence, although inferior in terms of number of groups, purely cooperative
groups through their large group size contribute with a large statistical weight to the total
composition of the population, and thereby ensure maintenance or even increase of the level
of cooperation for long times, cf. Fig. 2A blue curve.
In order for the group-fixation mechanism to become effective the evolutionary dynamics
has to act for time scales longer than the selection time, ts := 1/s, which measures the time
scale on which selection acts. For smaller times, a temporary increase in cooperation level is
observed provided the initial group size is small enough, cf. Fig. 2A. The initial rise is caused
by the group-growth mechanism during the growth phase of colonies, see Fig. 2C. Given a
distribution of initial group compositions, it asymmetrically amplifies the size of those groups
which contain more cooperators. This effect becomes stronger with a broader distribution,
or, equivalently, a smaller initial group size n0. Eventually the initial rise has to decline since,
due to the internal selection advantage of free-riders, the fraction of cooperators is always
6

Time, t
Coo
p. f
ract
ion,
x
0.2
0.5
0.8
2 4 0 T
A
0
0.2
0.4
0.6
0.8
1
0 4 8 12 16 0
100
200
300
400
500
0 4 8 12 16
Aver
. gro
up s
ize,
n
B C
tc
Figure 2 Evolution while individuals are arranged in groups (group-evolution step). A Population average
of cooperator fraction, x, as a function of time t. Depending on the average initial group size, n0, three
different scenarios arise: decrease of cooperation (red line, n0 = 30), transient increase of cooperation (green
line, n0 = 6, increase until cooperation time tc) and permanently enhanced cooperation (blue line, n0 = 4).
These three scenarios arise from the interplay of two mechanisms. While the group-growth mechanism, due
to faster growth of more cooperative groups, can cause a maximum in the fraction of cooperators for short
times, the group-fixation mechanism, due to a larger maximum size of purely cooperative groups, assures
cooperation for large times. Both mechanisms become less efficient with increasing initial group sizes and
are not effective in the deterministic limit (dashed black line, solution of Eq. S7). B The strength of the
group-growth mechanism decreases with an increasing initial fraction of cooperators. This is illustrated by
comparing the time evolution for three different initial fractions of cooperators and a fixed initial group
size n0 = 5. After a fixed time, here t = 3.03, the fraction of cooperators is larger than the initial one
for x0 = 0.2, equal to it for x0 = 0.5, and eventually becomes smaller than the initial value, as shown
for x0 = 0.8. C Change of the average group size, n =∑
i νi/M . At the beginning the groups grow
exponentially, while they later saturate to their maximum group size. As this maximum size depends on
the fraction of cooperators, the average group size declines with the loss in the level of cooperation (n0 = 6,
green line). The deterministic solution (dashed black line) describes this behavior qualitatively. s = 0.1,
p = 10.
decreasing within each mixed group. As a consequence, the overall benefit of cooperators
through faster growth of more cooperative groups is only transient. After a certain time,
the cooperation time, tc, the fraction of cooperators, x(t), falls again below its initial value,
x0, unless the group-fixation mechanism is strong enough to ensure a permanent increase.
Finally, if group-internal selection is too strong compared with the growth advantage of
cooperative groups, the level of cooperation cannot increase even transiently, cf. Fig. 2A,
7
red curve.
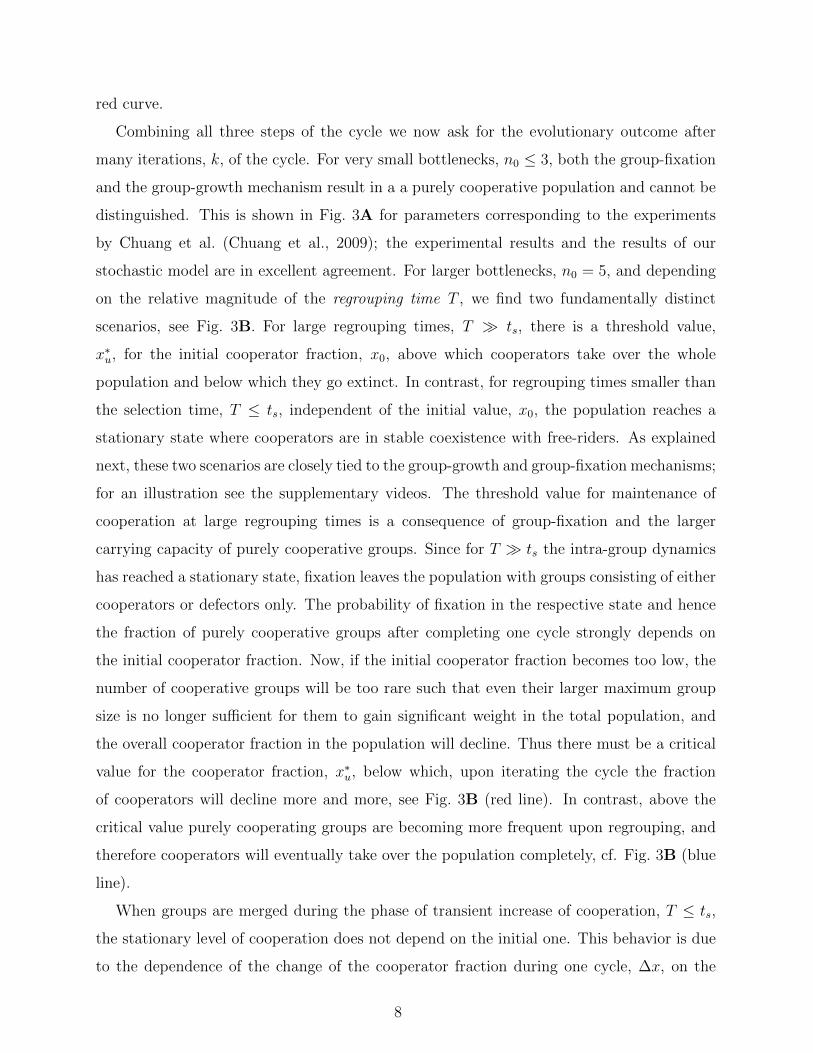
Combining all three steps of the cycle we now ask for the evolutionary outcome after
many iterations, k, of the cycle. For very small bottlenecks, n0 ≤ 3, both the group-fixation
and the group-growth mechanism result in a a purely cooperative population and cannot be
distinguished. This is shown in Fig. 3A for parameters corresponding to the experiments
by Chuang et al. (Chuang et al., 2009); the experimental results and the results of our
stochastic model are in excellent agreement. For larger bottlenecks, n0 = 5, and depending
on the relative magnitude of the regrouping time T , we find two fundamentally distinct
scenarios, see Fig. 3B. For large regrouping times, T � ts, there is a threshold value,
x∗u, for the initial cooperator fraction, x0, above which cooperators take over the whole
population and below which they go extinct. In contrast, for regrouping times smaller than
the selection time, T ≤ ts, independent of the initial value, x0, the population reaches a
stationary state where cooperators are in stable coexistence with free-riders. As explained
next, these two scenarios are closely tied to the group-growth and group-fixation mechanisms;
for an illustration see the supplementary videos. The threshold value for maintenance of
cooperation at large regrouping times is a consequence of group-fixation and the larger
carrying capacity of purely cooperative groups. Since for T � ts the intra-group dynamics
has reached a stationary state, fixation leaves the population with groups consisting of either
cooperators or defectors only. The probability of fixation in the respective state and hence
the fraction of purely cooperative groups after completing one cycle strongly depends on
the initial cooperator fraction. Now, if the initial cooperator fraction becomes too low, the
number of cooperative groups will be too rare such that even their larger maximum group
size is no longer sufficient for them to gain significant weight in the total population, and
the overall cooperator fraction in the population will decline. Thus there must be a critical
value for the cooperator fraction, x∗u, below which, upon iterating the cycle the fraction
of cooperators will decline more and more, see Fig. 3B (red line). In contrast, above the
critical value purely cooperating groups are becoming more frequent upon regrouping, and
therefore cooperators will eventually take over the population completely, cf. Fig. 3B (blue
line).
When groups are merged during the phase of transient increase of cooperation, T ≤ ts,
the stationary level of cooperation does not depend on the initial one. This behavior is due
to the dependence of the change of the cooperator fraction during one cycle, ∆x, on the
8

Regrouping steps, k
Coop. take over
Coop. go extinct
Coexistence
Coo
p.fra
ctio
n,x
C
0
0.2
0.4
0.6
0.8
1
0 5 10 15 20 25
Sta
t. co
op. l
evel
,x∗
Regrouping time, T
unstable x stable x
TlongTshort
Pure
Coo
pera
tion
Coex
iste
nce
Bist
abili
ty
Inte
rmed
iate
∗∗ us
0 2 4 6 8 10 12 14 0 2 4 6
0.2
0.4
0.6
0.8
1BA
Chuang et al.
n0 = 3n0 = 2.5
Figure 3 Evolution of the overall cooperator fraction under repeated regrouping. After many iterations, k,
of the evolutionary cycle, a stationary level of cooperation is reached. A For small population bottlenecks,
n0 ≤ 3, group-growth and group-fixation mechanisms are effective and lead to purely cooperative popula-
tions. Growth parameters, bottleneck size and the regrouping time are chosen according to the experiments
by Chuang et al. (Chuang et al., 2009), see supplementary information. Without any fitting parameters, our
simulation results (colored lines) are in good agreement with the experimental data (black points). B For
larger bottlenecks, n0 = 5, and depending on the relative efficiency of the group-growth and group-fixation
mechanism, two qualitatively different regimes can be distinguished. While the group-growth mechanism
leads to stable coexistence of cooperators and free-riders (green lines), the group-fixation mechanism can lead
to a pure state of either only cheaters (red line) or only cooperators (blue line). The relative impact of these
mechanisms depends strongly on the regrouping time T . For short regrouping times (Tshort = 2.5 < ts, green
lines), the group-growth mechanism is effective, while for sufficiently long regrouping times (Tlong = 20 > ts,
blue and red lines) the group-fixation mechanism acts more strongly. C With parameters equal to B, the
detailed interplay of the group-growth and group-fixation mechanisms is summarized in a bifurcation dia-
gram showing the stationary levels of cooperation as a function of the regrouping time T . Depending of the
relative efficiency of both mechanism, four different regimes arise: pure cooperation, coexistence, interme-
diate, and bistability. The times Tshort and Tlong correspond to the green and red/blue lines shown in B.
Parameters are x0 = 0.086, T = 3.1, s = 0.05 and p = 6.6 in A; see also supplementary information. In B,
x0 = {0.1 (green), x0 = 0.9 (green)} and x0 = {0.5 (red), x0 = 0.6 (blue)} for Tshort = 2.5 and Tlong = 20,
respectively. s = 0.1 and p = 10 in B/C.
9

initial fraction, x0 as discussed in the following; see also Fig. 2B. As we have already eluded
to in the discussion of the group-growth mechanism, stochasticity during group formation
and during the initial neutral phase of the group evolution dynamics results in a broad dis-
tribution of group compositions. The evolutionary dynamics is acting on this distribution in
an antagonistic fashion. While, due to the higher growth rate of more cooperative groups,
the distribution develops a positive skew leading to an increase in the average overall co-
operation, the group-internal selection pressure is counteracting this effect by reducing the
cooperator fraction within each group. The relative strength of the former effect is largest
for small initial cooperator fraction since this allows the largest positive skew to develop.
Hence, for a given regrouping time, if the change in overall cooperator fraction ∆x is posi-
tive for small x0 it must become negative for sufficiently large x0, as illustrated in Fig. 2B.
For a more detailed mathematical discussion of these effects we refer to the supplementary
information. As a consequence, in populations with a small initial fraction of defectors, the
defectors increase in frequency. At the same time, when the initial fraction of cooperators
is low, they also increase in number, finally leading to stable coexistence of cooperators and
defectors at some fraction x∗s. This stationary fraction of cooperators is independent of the
starting fraction and solely determined by the parameters of the evolutionary dynamics.
The interplay of both the group-growth and group-fixation mechanism leads, depending
on the regrouping time, to different scenarios for the levels of cooperation. These are sum-
marized in the bifurcation diagram Fig. 3C, where the stable and unstable fixed points of
the regrouping dynamics, x∗s and x∗u, are shown as functions of the regrouping time. The
scenarios can be classified according to their stability behavior under regrouping as follows:
For large regrouping times, T � ts, the group-fixation mechanism leads to bistable behavior.
With decreasing T , the fixation mechanism loses ground while the group-growth mechanism
becomes more prominent. There is a intermediate scenario: the dynamics is bistable with
full cooperation as well as coexistence as stable fixed points. For even smaller times, only the
group-growth mechanism remains effective and the rare strategy here always outperforms
the common one such that each strategy can invade but not overtake the other: coexistence.
Finally, for T � ts, cooperators always take over the population, effectively leading to purely
cooperative populations.
10

Discussion
In this article, we have studied the influence of population dynamics and fluctuations
on the evolution and maintenance of cooperation. We specifically account for alternating
population bottlenecks and phases of microbial growth. Thereby, our model serves as a
null-model for cooperation in rearranging populations (Buckling et al., 2007; Chuang et al.,
2010, 2009; Griffin et al., 2004; Kummerli et al., 2009), e.g. during microbial and parasitic
life-cycles (Dronamraju and Arese, 2006; Strassmann et al., 2000; Velicer and Vos, 2009;
Wilson, 1977; Xavier, 2011), and bacterial biofilm formation (Costerton et al., 1987; Hall-
Stoodley et al., 2004; McDougald et al., 2011; O’Toole et al., 2000; Xavier, 2011). The
final outcome of the dynamics depends on the interplay between the time evolution of size
and composition of each subpopulation. While a growth advantage of more cooperative
groups favors cooperators, it is counteracted by the evolutionary advantage of free-riders
within each subpopulation. We have investigated the stochastic population dynamics and
the ensuing correlations between these two opposing factors. Depending on whether groups
are merged while they are still exponentially growing or already in the stationary phase,
two qualitatively different mechanisms are favored, the group-growth and the group-fixation
mechanism. Importantly, our analysis identifies demographic noise as one of the main de-
terminants for both mechanisms. First, demographic noise during population bottlenecks
creates a broad distribution in the relative abundance of cooperators and free-riders within
the set of subpopulations. The growth advantage of more cooperative subpopulations implies
an asymmetric amplification of fluctuations and possibly yields to an increase of coopera-
tion in the whole population (group-growth mechanism). Our analysis shows that this can
enable a single cooperative mutant to spread in the population which then, mediated by the
dynamics, reaches a stationary state with coexisting cooperators and free-riders. Second, if
the founder populations contain only very few individuals, demographic fluctuations strongly
enhance the fixation probability of each subpopulation which then consists of cooperators
or free-riders only. Purely cooperative groups can reach a much higher carrying capacity.
However, only if the relative weight of purely cooperative groups is large enough, this ef-
fect leads to an increase in the level of cooperation in the whole population (group-fixation
mechanism). From our theoretical analysis of the population dynamics we conclude this to
be the case only if the initial fraction of cooperators is above some threshold value.
11

As shown by comparison with experiments by Chuang et al. (Chuang et al., 2009) the
proposed model is able to describe microbial dynamics quantitatively. Moreover, our model
makes predictions how the evolutionary outcome varies depending on population dynamics
and bottlenecks, and how the discussed mechanisms can provoke cooperation. These pre-
dictions can be tested experimentally by new experiments similar to those of Chuang et al.
and others (Buckling et al., 2007; Chuang et al., 2010, 2009; Griffin et al., 2004; Kummerli
et al., 2009): For example, by varying easily accessible parameters like the bottleneck size
n0 or the regrouping time T , the relative influence of both mechanisms can be tuned. Then
the resulting level of cooperation and the ensuing bifurcation diagrams can be quantitatively
compared with our theoretical predictions.
As we assume the worst case scenario for cooperators, e.g randomly formed groups and no
additional assortment, our findings are robust: The discussed pathways towards cooperation
based on a growth-advantage of more cooperative groups and restructuring are expected to
stay effective when accounting also for other biological factors like positive assortment,
spatial arrangements of groups, mutation, or migration1.
Shown by our analysis, a regular life-cycle favors cooperation. Besides better nutrient
exploitation, this advantage for cooperation might be one reason for the evolution of more
complex, controlled life-cycles including collective motion of microbes, local lysis, and sporu-
lation (Costerton et al., 1987; Hall-Stoodley et al., 2004; McDougald et al., 2011; O’Toole
et al., 2000; Xavier, 2011).
Methods
We used a stochastic, individual-based model where each individual is either a cooperator
or a free-rider. In the group formation step groups are formed at random. The initial group
size, ν0,i, is Poisson distributed (with mean n0). Given this size, the fraction of cooperators
ξ0,i follows by a binomial distributed number of cooperators. During the evolution step, each
individual is subject to random birth and death events. The dynamics is given by a time-
continuos Markov process where the change of the probability, ∂tP (νi, ξi; t), is given by a
master equation. In detail, the basal per capita birth rate of each individual depends linearly
1 publication in preparation
12

on the group level of cooperation ξi, while the per capita death rate increases linearly with
the group size νi the individual belong to. In addition, free-riding individuals have a higher
birth-rate where the strength of selection s measures the advantage of free-riding individuals.
Full details are given in the supplementary information. The time scale is such that a small
population of only free-riders initially grows exponentially with the average size νi,0 exp t.
To investigate the dynamics and both evolutionary mechanisms we performed extensive
computer simulations by employing the Gillespie algorithm (Gillespie, 1976). Group size is
M = 5 · 103 in Fig. 2, and M = 5 · 104 in Fig. 3.
References
M. Ackermann, B Stecher, N E Freed, P Songhet, W Hardt, and M Doebeli. Self-destructive
cooperation mediated by phenotypic noise. Nature, 454:987–990, 2008.
R Axelrod and WD Hamilton. The evolution of cooperation. Science, 211:1390–1396, 1981.
C Beloin, A Roux, and J M Ghigo. Escherichia coli biofilms. Current topics in microbiology and
immunology, 322:249–289, 2008.
A Buckling, F Harrison, M Vos, M A Brockhurst, A Gardner, S A West, and A Griffin. Siderophore-
mediated cooperation and virulence in Pseudomonas aeruginosa. FEMS Microbiol. Ecol., 62(2):
135–141, 2007.
J S Chuang, O Rivoire, and S Leibler. Cooperation and Hamilton’s rule in a simple synthetic
microbial system. Molec. Syst. Biol., 6:398, 2010.
J S Chuang, O Rivoire, and S Leibler. Simpson’s paradox in a synthetic microbial system. Science,
323(5911):272–275, 2009.
J W Costerton, K J Cheng, G G Geesey, T I Ladd, J C Nickel, M Dasgupta, and T J Marrie.
Bacterial biofilms in nature and disease. Annual Review Of Microbiology, 41:435–464, 1987.
J Cremer, T Reichenbach, and E Frey. The edge of neutral evolution in social dilemmas. New J.
Phys., 11:093029, 2009.
J Cremer, A Melbinger, and E Frey. Evolutionary and population dynamics: A coupled approach.
Phys. Rev. E, 84:051921, Nov 2011.
K R Dronamraju and P Arese. Malaria: Genetic and Evolutionary Aspects. Springer, 2006.
E Fehr and U Fischbacher. The nature of human altruism. Nature, 425:785–791, 2003.
13
R A Fisher. The Genetical Theory of Natural Selection. Oxford University Press, Oxford, 1930.
K R Foster, T Wenseleers, and F L W Ratnieks. Kin selection is the key to altruism. Trends Ecol.
Evol., 21(2):57–60, 2006.
S A Frank. Foundations of Social Evolution. Princeton University Press, 1998.
D Gillespie. A general method for numerically simulating the stochastic time evolution of coupled
chemical reactions. Journal of Computational Physics, 22(4):403–434, 1976.
J Gore, H Youk, and A van Oudenaarden. Snowdrift game dynamics and facultative cheating in
yeast. Nature, 459:253–256, 2009.
A S Griffin, S A West, and A Buckling. Cooperation and competition in pathogenic bacteria.
Nature, 430:1024–1027, 2004.
L Hall-Stoodley, J W Costerton, and P Stoodley. Bacterial biofilms: From the natural environment
to infectious diseases. Nat. Rev. Micro., 2:95–108, 2004.
W Hamilton. Biosocial Anthropology, chapter Innate social aptitudes of man: an approach from
evolutionary genetics, pages 129–151. Wiley, 1975.
W D Hamilton. The genetical evolution of social behaviour. I+II. J. Theor. Biol., 7:1–52, 1964.
L Keller and M G Surette. Communication in bacteria: an ecological and evolutionary perspective.
Nat. Rev. Micr. Biol., 4:249–258, 2006.
T Killingback, J Bieri, and T Flatt. Evolution in group-structured populations can resolve the
tragedy of the commons. Proc. R. Soc. B, 273:1477–1481, 2006.
M Kimura. The Neutral Theory of Molecular Evolution. Cambridge University Press, Cambridge,
1983.
R Kummerli, A Gardner, S West, and Ashleigh S. Griffin. Limited dispersal, budding dispersal,
and cooperation: an experimental study. Evolution, 63:939–949, 2009.
K P Lemon, A M Earl, H C Vlamakis, C Aguilar, and R Kolter. Biofilm development with an
emphasis on Bacillus subtilis. Current topics in microbiology and immunology, 322:1–16, 2008.
J Maynard Smith. Group selection and kin selection. Nature, 201:1145–1147, 1964.
J Maynard-Smith and E Szathmary. The Major Transitions in Evolution. Oxford University Press,
Oxford, 1995.
D McDougald, S A Rice, N Barraud, P D Steinberg, and S Kjelleberg. Should we stay or should we
go: mechanisms and ecological consequences for biofilm dispersal. Nature reviews Microbiology,
10(1):39–50, 2011.
14
A Melbinger, J Cremer, and E Frey. Evolutionary game theory in growing populations. Phys. Rev.
Lett., 105:178101, 2010.
R E Michod. The theory of kin selection. Ann. Rev. Ecol. Syst., 13:23–55, 1982.
J Monod. The growth of bacterial cultures. Annu. Rev. Microbiol., 3:371–394, 1949.
P A Moran. The Statistical Processes of Evolutionary Theory. Clarendon Press Oxford, Oxford,
1964.
U Motro. Co-operation and defection: Playing the field and the ess. Journal of Theoretical Biology,
151(2):145 – 154, 1991.
C D Nadell, J B Xavier, and K R Foster. The sociobiology of biofilms. FEMS Microbiol. Rev., 33
(1):206–224, 2009.
M A Nowak. Five rules for the evolution of cooperation. Science, 314:1560–1563, 2006.
M A Nowak and R M May. Evolutionary games and spatial chaos. Nature, 359:826–829, 1992.
M A Nowak, C E Tarnita, and E O Wilson. The evolution of eusociality. Nature, 466:1057–1065,
2010.
S Okasha. Evolution and the Levels of Selection. Oxford University Press, Oxford, 2006.
G O’Toole, HB Kaplan, and R Kolter. Biofilm formation as microbial development. Annual Review
Of Microbiology, 54:49–79, 2000.
T Pfeiffer, S Schuster, and S Bonhoeffer. Cooperation and competition in the evolution of ATP-
producing pathways. Science, 292:504–507, 2001.
G R Price. Selection and covariance. Nature, 227:520–521, 1970.
D Queller, E Ponte, S Bozzaro, and J E Strassmann. Single-gene greenbeard effects in the social
amoeba dictyostelium discoideum. Science, 299:105–106, 2003.
P B Rainey and K Rainey. Evolution of cooperation and conflict in experimental bacterial popu-
lations. Nature, 425:72–74, 2003.
K Sauer, A K Camper, G D Ehrlich, J W Costerton, and D G Davies. Pseudomonas aeruginosa
displays multiple phenotypes during development as a biofilm. Journal Of Bacteriology, 184(4):
1140–1154, 2002.
P S Stewart and M J Franklin. Physiological heterogeneity in biofilms. Nat. Rev. Microbiol., 6:
199–210, 2008.
J E Strassmann, Y Zhu, and D C Queller. Altruism and social cheating in the social amoeba
dictyostelium discoideum. Nature, 408(6815):965–967, Jan 2000.
15

E Szathmary and L Demerter. Group selection of early replicators and the origin of life. J. Theo.
Biol., 128(4):463–486, 1987.
E Szathmary. Co-operation and defection: Playing the field in virus dynamics. Journal of Theo-
retical Biology, 165(3):341 – 356, 1993.
A Traulsen. Mathematics of kin- and group-selection: Formally equivalent? Evolution, 64:316–323,
2009.
A Traulsen and M A Nowak. Evolution of cooperation by multilevel selection. Proc. Natl. Acad.
Sci. USA, 103(29):10952–10955, 2006.
R L Trivers. The evolution of reciprocal altruism. Quart. Rev. Biol., 46:35–57, 1971.
G J Velicer. Social strife in the microbial world. Trends Microbiol., 11(7):330–337, 2003.
G J Velicer and M Vos. Sociobiology of the myxobacteria. Annu. Rev. Microbiol., 63:599–623,
2009.
S A West, A S Griffin, and A Gardner. Evolutionary explanations for cooperation. Curr. Biol.,
24:661–672, 2007.
S A West and A Gardner. Altruism, spite, and greenbeards. Science, 327(5971):1341–1344, 2010.
S A West, A S Griffin, A Gardner, and S P Diggle. Social evolution theory for microorganisms.
Nat. Rev. Microbiol., 4(8):597–607, 2006.
D S Wilson. Theory of group selection. Proc. Natl. Acad. Sci. USA, 72(1):143–146, 1975.
D Wilson. How nepotistic is the brain worm? Behavioral Ecology and Sociobiology, 2(4):421–425,
1977.
D S Wilson and E O Wilson. Rethinking the theoretical foundation of sociobiology. Quart. Rev.
Soc. Biol., 82(4):327–348, 2007.
S Wright. Evolution in mendelian populations. Genetics, 16:97–159, 1931.
J B Xavier. Social interaction in synthetic and natural microbial communities. Molecular Systems
Biology, 7(483):1–11, 2011.
T Yamagishi. The provision of a sanctioning system as a public good. J. Pers. Soc. Psychol., 51:
110–116, 1986.
Acknowledgments
We thank Jan-Timm Kuhr and Matthias Lechner for helpful discussions. Financial support
16
by the Deutsche Forschungsgemeinschaft through the SFB TR12 “Symmetries and Univer-
salities in Mesoscopic Systems” is gratefully acknowledged.
Author contributions
J.C., A.M., and E.F. designed the research. J.C., and A.M. performed the stochastic simu-
lations and analyzed the data. J.C., A.M., and E.F. wrote the manuscript.
Additional information
Competing Financial Interests The authors declare no competing financial interests.
17

Supplementary InformationGrowth dynamics and the evolution of cooperation in group-structured populations
Jonas Cremer,1 Anna Melbinger,1 Erwin Frey1∗
1 Arnold Sommerfeld Center for Theoretical Physics (ASC) and Center for NanoScience
(CENS), Department of Physics, Ludwig-Maximilians-Universitat Munchen, Theresien-
strasse 37, D-80333 Munchen, Germany
∗To whom correspondence should be addressed; E-mail: [email protected].
In this supplementary text, we give a more detailed discussion of our model and the group-
growth mechanism. Furthermore we show comparisons of our analysis with experiments by
Chuang et al. (Chuang et al., 2009).
I. THE MODEL
Here, we give details on the consecutive steps of the ”life-cycle” of the meta-population.
We first specify the group formation step before considering the dynamics within groups
(group evolution step).
A. The Group Formation Step
Starting with an initial fraction of cooperators x0 in the population, M groups are formed.
Both, group size and group composition, are randomly distributed. Each group i ∈ [1,M ]
initially consists of ν0, i individuals. If the population from which the groups are formed is
much larger than Mn0, ν0, i follows a Poisson distribution2,
P (ν0, i) =nν0, i0
ν0, i!exp (−n0) , (S1)
2 This holds for typical conditions of small population bottlenecks as observed in bacterial life-cycles.
18
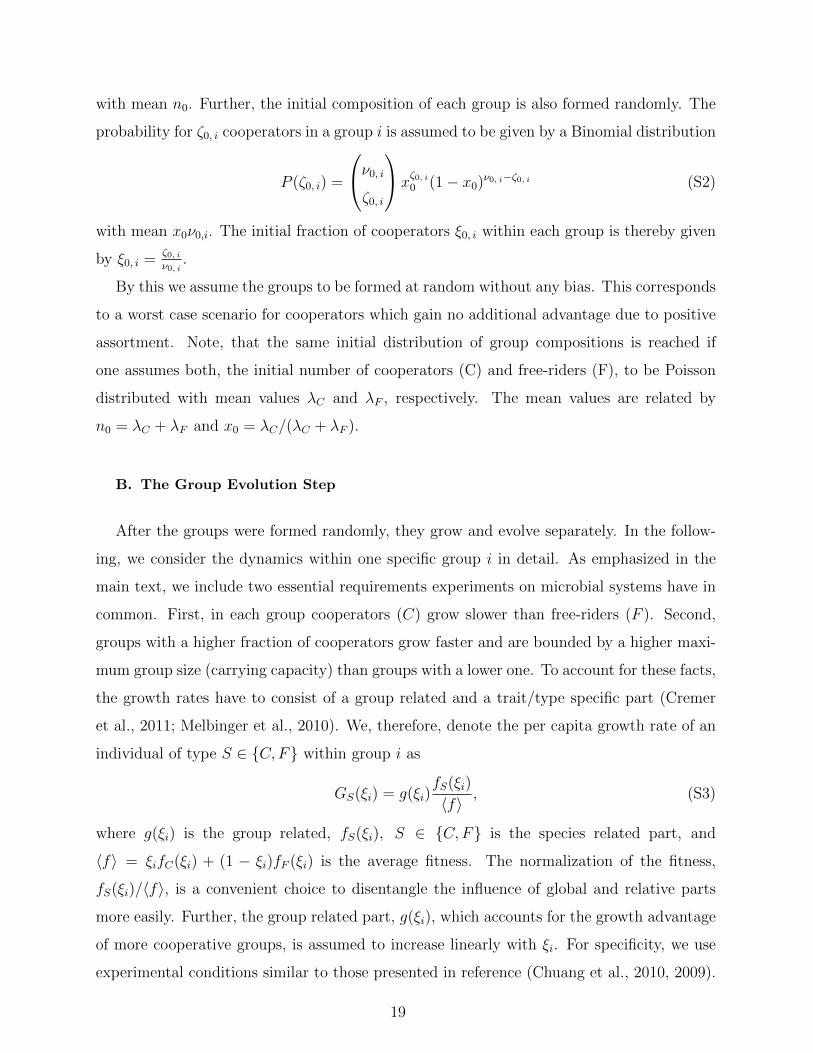
with mean n0. Further, the initial composition of each group is also formed randomly. The
probability for ζ0, i cooperators in a group i is assumed to be given by a Binomial distribution
P (ζ0, i) =
ν0, iζ0, i
xζ0, i0 (1− x0)ν0, i−ζ0, i (S2)
with mean x0ν0,i. The initial fraction of cooperators ξ0, i within each group is thereby given
by ξ0, i =ζ0, iν0, i
.
By this we assume the groups to be formed at random without any bias. This corresponds
to a worst case scenario for cooperators which gain no additional advantage due to positive
assortment. Note, that the same initial distribution of group compositions is reached if
one assumes both, the initial number of cooperators (C) and free-riders (F), to be Poisson
distributed with mean values λC and λF , respectively. The mean values are related by
n0 = λC + λF and x0 = λC/(λC + λF ).
B. The Group Evolution Step
After the groups were formed randomly, they grow and evolve separately. In the follow-
ing, we consider the dynamics within one specific group i in detail. As emphasized in the
main text, we include two essential requirements experiments on microbial systems have in
common. First, in each group cooperators (C) grow slower than free-riders (F ). Second,
groups with a higher fraction of cooperators grow faster and are bounded by a higher maxi-
mum group size (carrying capacity) than groups with a lower one. To account for these facts,
the growth rates have to consist of a group related and a trait/type specific part (Cremer
et al., 2011; Melbinger et al., 2010). We, therefore, denote the per capita growth rate of an
individual of type S ∈ {C,F} within group i as
GS(ξi) = g(ξi)fS(ξi)
〈f〉 , (S3)
where g(ξi) is the group related, fS(ξi), S ∈ {C,F} is the species related part, and
〈f〉 = ξifC(ξi) + (1 − ξi)fF (ξi) is the average fitness. The normalization of the fitness,
fS(ξi)/〈f〉, is a convenient choice to disentangle the influence of global and relative parts
more easily. Further, the group related part, g(ξi), which accounts for the growth advantage
of more cooperative groups, is assumed to increase linearly with ξi. For specificity, we use
experimental conditions similar to those presented in reference (Chuang et al., 2010, 2009).
19

In these experiments, a purely cooperating population growth to an about ten times higher
population size than a purely defecting one. In our model, the maximum population size
scales with g and therefore we set
g(ξi) = r(1 + pξi). (S4)
Here r determines the overall time scale for growth and defines our units of time, i.e. it is
set to one unless specified otherwise. In the main text we have used p = 10 for specificity;
see also section III where we compare with the experimental data by Chuang et a. (Chuang
et al., 2009).
Note, however, that the qualitative findings, especially both evolutionary mechanisms,
do not depend on the exact form of g(ξi) but only on the fact that g(ξi) is monotonically
increasing with the fraction of cooperators. The trait specific part, fS(ξi), includes the
different growth rates of cooperators and free-riders within group i. We here employ the
standard formulation of evolutionary game theory and assume it to be given by the payoff
matrix of a Prisoner’s dilemma game (Hofbauer and Sigmund, 1998; Nowak et al., 2004).
The trait specific parts are given by
fC(ξi) =1 + s [bξi − c] ,
fF (ξi) =1 + sbξi, (S5)
and the fitness advantage of free-riders ∆f = fF (x) − fC(x) = −sc is frequency indepen-
dent. For specificity, we set b = 3 and c = 1. Thereby, the selection strength s is the only
free parameter controlling the fitness difference, ∆f , which corresponds to the advantage
of free-riders within each group. In the experiments (Chuang et al., 2010, 2009), the selec-
tion strength was of the order s ∼ 0.05. In our manuscript, we set s = 0.1 as an upper
approximation of this value.
To model growth bounded by restricted resources we further introduce per capita death
rates which increase linearly with the number of individuals in a group,
DS(νi) =νiK. (S6)
These are independent of the specific type S and lead to logistic-like growth within each
group. K sets the scale of the maximum group size (Verhulst, 1838). In detail, for purely
defecting groups the carrying capacity is K while it is (1 + 10)K for purely cooperating
20

ones. For the discussed results, only the ratio of group sizes and not their absolute values
are important. Hence, for numerical convenience, we set K to a constant value, K = 100.
The full stochastic dynamics follows a master equation which can be derived by the
per capita growth and death rates, Eqs. (S3) and (S6). This master equation gives the
temporal evolution of P (ξ i; νi; t), the probability for group i to consist of νi individuals with
a fraction of ξi cooperators at time t. We use the Gillespie algorithm to perform stochastic
simulations (Gillespie, 1976).
While fluctuations strongly affect the dynamics, it is still instructive to look at the deter-
ministic description where fluctuations during the group-evolution step are neglected. This
deterministic dynamics within each group, i, is then given by rate equations for the fraction
of cooperators ξi and the total group size νi:
∂tξi = −s(1 + 10ξi)ξi(1− ξi),
∂tνi = (1 + 10ξi − νi/K)νi. (S7)
Thus, in a deterministic manner, intra-group evolution is described by a replicator-like
dynamics while the size of each group follows logistic growth (with a ξi dependent growth
rate and carrying capacity). We illustrate this dynamics in Fig. SS4 for three different initial
conditions.
II. THE GROUP-GROWTH MECHANISM
As stated in the main text, the group-growth mechanism relies on the faster growth of
more cooperative groups. Even though cooperators reproduce slower compared to free-riders
in the same group, the positive effect on group-growth can outbalance this disadvantage.
For an illustration, see the specific example given in Table S1.
Here, we quantify the growth advantage of more cooperative groups. For this, we consider
only short times t� 1/s. Then, and in the limit of weak selection, s� 1, the deterministic
time evolution, given by Eqs. (S7), is
ξi =ξ0,i
νi =ν0,i exp [g(ξ0,i)t] .
21

0
0.2
0.4
0.6
0.8
1
Time t
Coo
p.fra
ctio
n
0
200
400
600
800
1000
1200
Time t
Gro
upsi
zen
ξ
A B
0 5 10 15 0 5 10 15
Figure S4 Dynamics in single groups. A Evolution of cooperation. For a mixed group (green), the
fraction of cooperators declines due to the fitness advantage of free-riders while it stays constant
for purely cooperating (blue) or defecting (red) groups. B Logistic like growth of the group size.
For pure groups, the group-related advantage of more cooperative groups is most visible. Purely
cooperating groups (blue) grow faster and reach a larger maximum carrying capacity than groups
of only free-riders (red). A mixed group (green) grows faster than a group of only free-riders at
the beginning. However also in the initially mixed group only free-riders can remain in the long
run, and the carrying capacities of both groups become the same. The simulation average over
different realizations of only one group. Parameters are n0 = 6 and s = 0.1, ξ0 is equal to 0 (red),
0.5 (green), and 1 (blue).
TABLE S1 Per capita growth rates of cooperators and free-riders in two groups
group 1 group 2
fraction of cooperators ξi 3/4 1/4
per capita growth rate cooperators, g(ξi)fC(ξi)/〈f〉 8.31 3.33
per capita growth rate free-riders, g(ξi)fF (ξi)/〈f〉 9.05 3.58
Two groups, i = 1 and i = 2 in comparison. While the per capita growth rates of cooperators are
smaller than the per capita growth rates of free-riders within every group, the per capita growth
rate of cooperators in the more cooperative group 1 strongly exceeds the per capita growth rate
of free-riders in the less cooperative group 2 due to the group related fitness g(ξi). The strength
of selection is given by s = 0.1.
22
×4
×3
×2
×1
∆x =1
42
∆x =1
18
x =5
6
x =1
6x =
2
9
x =18
21
growth factor
0
0
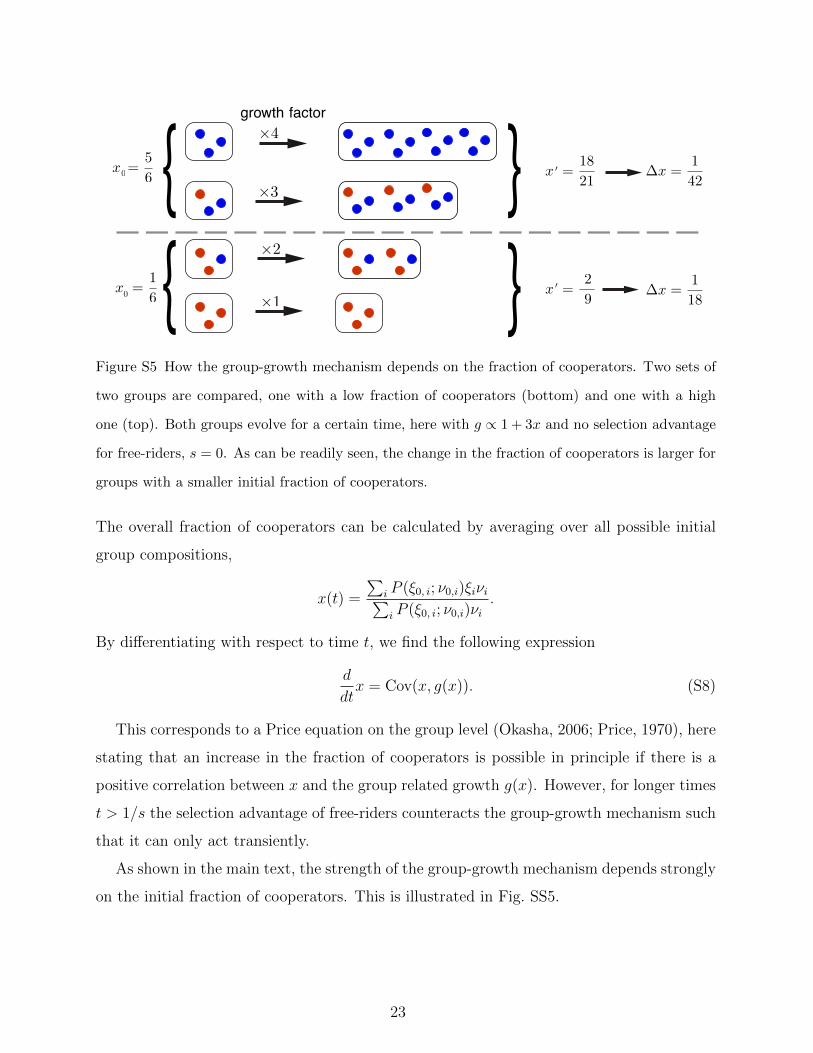
Figure S5 How the group-growth mechanism depends on the fraction of cooperators. Two sets of
two groups are compared, one with a low fraction of cooperators (bottom) and one with a high
one (top). Both groups evolve for a certain time, here with g ∝ 1 + 3x and no selection advantage
for free-riders, s = 0. As can be readily seen, the change in the fraction of cooperators is larger for
groups with a smaller initial fraction of cooperators.
The overall fraction of cooperators can be calculated by averaging over all possible initial
group compositions,
x(t) =
∑i P (ξ0, i; ν0,i)ξiνi∑i P (ξ0, i; ν0,i)νi
.
By differentiating with respect to time t, we find the following expression
d
dtx = Cov(x, g(x)). (S8)
This corresponds to a Price equation on the group level (Okasha, 2006; Price, 1970), here
stating that an increase in the fraction of cooperators is possible in principle if there is a
positive correlation between x and the group related growth g(x). However, for longer times
t > 1/s the selection advantage of free-riders counteracts the group-growth mechanism such
that it can only act transiently.
As shown in the main text, the strength of the group-growth mechanism depends strongly
on the initial fraction of cooperators. This is illustrated in Fig. SS5.
23

III. COMPARISON WITH EXPERIMENTS ON SYNTHETIC MICROBIAL SYS-
TEM BY CHUANG, RIVOIRE AND LEIBLER
We have compared our theoretical analysis with recent experiments by Chuang et al.
(Chuang et al., 2009) on a synthetic microbial model system. They have studied regrouping
populations with initial population size n0 in the range between 2 and 3, an initial cooperator
fraction of x0 = 0.086, and a regrouping time T = 12− 13 h. Other model parameters were
estimated as follows. The inherent fitness advantage of free-riders relative to cooperators
was observed to be in the range between 1.04 and 1.05. In our model this translates to
fC = 1 , (S9)
fD = 1.05 , (S10)
where in contrast to equation (S3) we did not normalize the species related part, i.e. 〈f〉 ≡ 1.
The growth curves for different compositions of the population (see Fig.S3 in (Chuang et al.,
2009)) give access to the overall growth rate and its frequency dependence. From Fig.S3 in
(Chuang et al., 2009) we estimate:
r = 6.8× 10⁻⁴ min−1 , (S11)
p = 6.6 . (S12)
Employing these parameters in our model we have simulated the regrouping dynamics and
find good agreement with the experimental results, cf. Fig. S6a. Since the population
dynamics is still within the exponential growth phase at the regrouping time, we interpret
the observed increase of cooperation as a group-growth mechanism. However, because of
the particular set of experimental parameters, the resulting stationary cooperator fraction
is very close to one which makes it difficult to observe coexistence between cooperators and
free-riders. We can now use our theoretical model to explore the effects of an increase in the
regrouping time. Changing the regrouping time from T = 12.5 h to T = 375 h we find that
the time evolution of the cooperator fraction remains qualitatively similar, despite the fact
that now cooperation increases because of the group-fixation mechanism, cf. Fig. S6b. Thus
even by changing the regrouping time these small values of n0 do not allow to distinguish
between the two mechanisms. However, as discussed in the main text, larger values of n0
(in the range of 4 − 6) give a clear signature of each of the mechanisms upon varying the
regrouping time.
24
0
0.2
0.4
0.6
0.8
1
0 2 4 6 8 10 0
0.2
0.4
0.6
0.8
1
0 2 4 6 8 10
coop
erat
ion,
Regrouping steps,
Chuang et al.x0
k
coop
erat
ion,
x0
Regrouping steps, k
A B
T = 12.5h T = 375h
n 0 = 3n 0 = 2.5
n 0 = 3n 0 = 2.5n 0 = 2
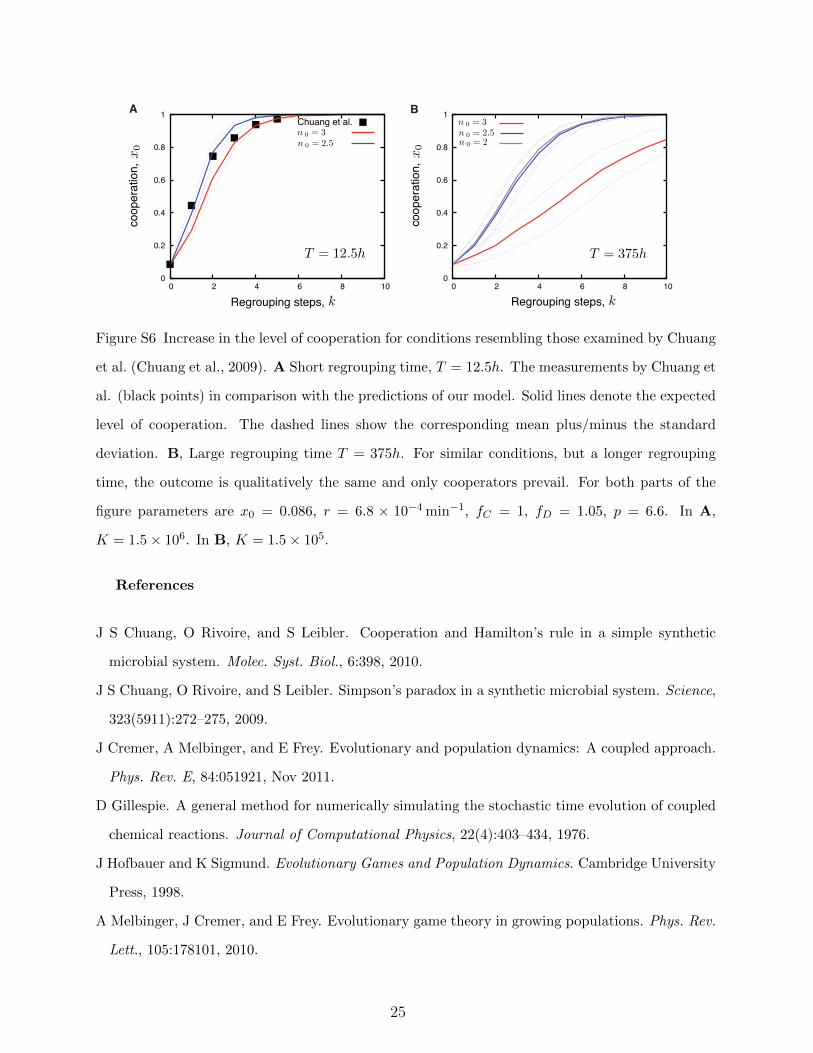
Figure S6 Increase in the level of cooperation for conditions resembling those examined by Chuang
et al. (Chuang et al., 2009). A Short regrouping time, T = 12.5h. The measurements by Chuang et
al. (black points) in comparison with the predictions of our model. Solid lines denote the expected
level of cooperation. The dashed lines show the corresponding mean plus/minus the standard
deviation. B, Large regrouping time T = 375h. For similar conditions, but a longer regrouping
time, the outcome is qualitatively the same and only cooperators prevail. For both parts of the
figure parameters are x0 = 0.086, r = 6.8 × 10⁻⁴ min−1, fC = 1, fD = 1.05, p = 6.6. In A,
K = 1.5× 10⁶. In B, K = 1.5× 10⁵.
References
J S Chuang, O Rivoire, and S Leibler. Cooperation and Hamilton’s rule in a simple synthetic
microbial system. Molec. Syst. Biol., 6:398, 2010.
J S Chuang, O Rivoire, and S Leibler. Simpson’s paradox in a synthetic microbial system. Science,
323(5911):272–275, 2009.
J Cremer, A Melbinger, and E Frey. Evolutionary and population dynamics: A coupled approach.
Phys. Rev. E, 84:051921, Nov 2011.
D Gillespie. A general method for numerically simulating the stochastic time evolution of coupled
chemical reactions. Journal of Computational Physics, 22(4):403–434, 1976.
J Hofbauer and K Sigmund. Evolutionary Games and Population Dynamics. Cambridge University
Press, 1998.
A Melbinger, J Cremer, and E Frey. Evolutionary game theory in growing populations. Phys. Rev.
Lett., 105:178101, 2010.
25

M A Nowak, A Sasaki, C Taylor, and D Fudenberg. Emergence of cooperation and evolutionary
stability in finite populations. Nature, 428:646–650, 2004. ISSN 0028-0836.
S Okasha. Evolution and the Levels of Selection. Oxford University Press, Oxford, 2006.
G R Price. Selection and covariance. Nature, 227:520–521, 1970.
P F Verhulst. Notice sur la loi que la population pursuit dans son accroissement. Corresp. Math.
Phys., 10:113–121, 1838.
26