group coordination and decision-making during foraging in ... · group coordination and...
TRANSCRIPT

Zurich Open Repository andArchiveUniversity of ZurichMain LibraryStrickhofstrasse 39CH-8057 Zurichwww.zora.uzh.ch
Year: 2017
Group Coordination and Decision-Making during Foraging in Meerkats(Suricata suricatta)
Gall, Gabriella
Abstract: Some animal species live in stable social groups and scientists have long wondered how suchgroups are organized in space and how these groups maintain cohesion and make decisions. Groupliving animals need to trade-off the costs and benefits of close proximity to many conspecifics. Benefitscan be increased, and costs reduced by preferentially choosing specific locations within a group, or bypreferentially associating with specific group members. In many species, vocal communication also playsa key role in mitigating the compromises between individuals which lead to shared consensus decisions.Some animals using vocal communication to stay in contact, change their call rate depending on theirlocation within the group and can thereby influence the movement of other group members. In thisthesis, I addressed questions on group coordination and decision-making in wild meerkats (Suricatasuricatta), small mongooses with a strict dominance hierarchy and a heterogeneous group composition,e.g. members varying in their needs and preferences. Meerkats live in an arid environment fluctuatingin prey availability, which can influence group coordination and decision-making. Most previous researchfocused on decisions preceding changes in group activity. Little work has focused on coordination when‘on the move’, on decision-making under time constraints, and on the effect of harsh environmentalconditions on group coordination and decision-making. Here I used data from natural observationsand an experiment, to shed light on the spatial organisation of foraging meerkat groups, their cohesionmechanism and the limits thereof under challenging environmental conditions, as well as their decisionsto stop foraging and to return to their sleeping burrow. My results suggest that the cost or benefitsassociated with specific spatial locations are small, at least during the afternoon, as meerkats showed nopreference for specific locations within the group. Individuals of the same litter and different dominancestatus were less likely to be within close proximity of each other, suggesting that competition might playan important role for the spatial organization of a group. During foraging, meerkats emit contact callsdepending on their location within the group and follow ‘vocal hotspots’, areas with many calls. Whenconditions deteriorate, as during a drought, individuals vocalized independent of their spatial locationwithin the group. The increase of the number of group splits during the drought suggests that the callpattern used for coordination is not maintained on a global level and that the cohesion mechanism ofmeerkats is disrupted. Data from natural observations indicate that the decision of meerkat groups tostop foraging and to return to the burrow is shared between group members. Both the decision to returnand the speed of the group at the return seem to depend on the urgency, as decisions were less sharedand groups moved faster, when meerkats were far from their burrow and sunset was imminent. Mythesis presents different aspects of group coordination and shows that group coordination and decision-making in meerkats is affected by environmental constraints. Whereas all meerkats seem to contribute tocoordination and decision-making processes, the amount of sharing seems to be strongly affected by timeconstraints. In addition, while meerkats seem to be able to flexible adjust their coordination mechanismsto changes in the environment, coordination breaks down under extreme conditions. These observationsindicate the importance of changes in the environment on group coordination and likely the evolution ofsociality.
Posted at the Zurich Open Repository and Archive, University of ZurichZORA URL: https://doi.org/10.5167/uzh-138436DissertationOther
Originally published at:Gall, Gabriella. Group Coordination and Decision-Making during Foraging in Meerkats (Suricata suri-catta). 2017, University of Zurich, Faculty of Science.
2

Group Coordination and Decision-Making during Foraging in Meerkats
(Suricata suricatta)
_________________________________________________________
Dissertation
zur
Erlangung der naturwissenschaftlichen Doktorwürde
(Dr. Sc. Nat.)
vorgelegt der
Mathematisch-naturwissenschaftlichen Fakultät
der
Universität Zürich
von
Gabriella Eva Cristina Gall
aus
Deutschland
Promotionskommission
Prof. Dr. Marta Manser (Vorsitz und Leitung)
Prof. Dr. Ross Stuart Purves
Dr. Erik Willems
Zürich, 2017

ii
iii
ACKNOWLEDGEMENTS
First and foremost, I would like to thank Marta Manser for her continued support and the opportunity
to be part of her great research group. Marta supported me even when after my second year I still did
not have any usable data and she even joined in my ‘Dance your PhD Project’ which would not have
been the same without her! I would also like to thank my other committee members, Ross Purves and
Erik Willems, for staying supportive after all the failures of the first two years.
Many thanks also to Tim Clutton-Brock as well as the Kalahari Research Trust for allowing me
to use the long-term data of the Kalahari Meerkat Project (KMP) and the opportunity to do my research
at the KMP. Many thanks also to the neighbouring farmers to allow me to work on their land. Thanks
also to the Mammal Research Institute in Pretoria for the permission to get a research visa to stay in
South Africa.
I had the great pleasure to do my field work at the KMP during three amazing field seasons,
involving lots of meerkats and a lot of help from different people. Special thanks to Ramona, Lyndsey,
Dave, Bruce, Denise and Pauline, my field assistants during the seasons. I’m also very grateful to all the
volunteers I had the chance to meet and work with during this time and who happily helped me to
habituate the meerkats to a point that I managed to collar a few of them without any need of
anaesthesia. Great thanks also to all those volunteers and researchers whom I did not meet, providing
the long-term data I used in two of my chapters. I would also like to thank all the managers who
organized the rota, made sure that everything was working well and took care of all basic problems:
Lewis Howell, Sky Bisschoff-Mattson, Lyndsey Marris, Dave Gaynor, Nanine Gaynor as well as the
Zurich assistants, who took good care of all Zurich equipment, helped with data collection and more:
Cleo, Lyndsey, Teja and Pauline. My gratitude goes also to Alta, Anna, Cristina, Mina, for cooking great
dinners and keeping us all well fed, as well as Hendrik, Karel and Tim for all their hard work with all
the maintenance and repairs! While I was in the Kalahari to collect my data, I would not have been able
to keep my sanity when all my attempts at collecting data failed and my stay would for sure not have
been as fun without the presence of Ramona, Lyndsey, Christina, Rita, Vanessa, Rachael, Robin, Becca,
Dave, Debbie, Selin, Jamie, Alex, Rob, Philippe, Markus, Miquel, Adam, Teja, Sky, Sara, Nino, Chrissie,
Gisela, Michael, Jasmin, Tanja, Tim, Peter, Bruce, Jack, Dom, Rute, Erin, Rachel, Helen, Sean, Jess,
Phaedra, Sabse, Elisa, Sam and many more!
During my stay in Zurich I got to know a lot of very nice people who helped me face the lowest
points during my PhD as well as making a good day even better. Special thanks for continuous input,
nice discussions, good mood, general fun (i.e. table-football, game nights, dancing, hiking, going for
drinks, chatting, etc.) to Manuela, Sabse, Denise, Andri, Andreas, Christophe, Yannic, Inês, Simon,
Anna, Barbara, Marianne, Jari, Sandy, Sofia, Jelena, Christina, Juliet, Jamie, Ramona, Nicola, Katie,
Patricia, Sally, Fred, Max, Jobran, Chelsea, Chantal, Lara, Zina, Akos, Alejandra, Homayoun, Tugce,
Natasha, Debbie, Juan, Hedwig, Nino, Gabriele, Tina, Kasia, Jan, Bruce, Bart, Megan, Paul, Ari, Vlad and
many more (sorry if I forgot someone).
Special thanks to Marianne Köpfler and all the administrative staff of the university to make
my stay such an easy one and always helping with the paper work!
iv
Many, many thanks also to Jamie, Manu, Sabse, Bart and Ari for all their stats advice. I also
thank Bart and Ari for always being a great source of input and R-advice and my office mates Denise,
Jamie, Ramona, Vlad and for short times also Paul for the great chats and general good times in the
office!
Very special thanks to Bruce for keeping me sane at all times and making my days so much
better as well as my family and all my other friends for being supportive, understanding, fun and simply
family and friends!

v
SUMMARY
Some animal species live in stable social groups and scientists have long wondered how such groups
are organized in space and how these groups maintain cohesion and make decisions. Group living
animals need to trade-off the costs and benefits of close proximity to many conspecifics. Benefits can
be increased, and costs reduced by preferentially choosing specific locations within a group, or by
preferentially associating with specific group members. In many species, vocal communication also
plays a key role in mitigating the compromises between individuals which lead to shared consensus
decisions. Some animals using vocal communication to stay in contact, change their call rate depending
on their location within the group and can thereby influence the movement of other group members.
In this thesis, I addressed questions on group coordination and decision-making in wild
meerkats (Suricata suricatta), small mongooses with a strict dominance hierarchy and a heterogeneous
group composition, e.g. members varying in their needs and preferences. Meerkats live in an arid
environment fluctuating in prey availability, which can influence group coordination and decision-
making. Most previous research focused on decisions preceding changes in group activity. Little work
has focused on coordination when ‘on the move’, on decision-making under time constraints, and on
the effect of harsh environmental conditions on group coordination and decision-making. Here I used
data from natural observations and an experiment, to shed light on the spatial organisation of foraging
meerkat groups, their cohesion mechanism and the limits thereof under challenging environmental
conditions, as well as their decisions to stop foraging and to return to their sleeping burrow.
My results suggest that the cost or benefits associated with specific spatial locations are small,
at least during the afternoon, as meerkats showed no preference for specific locations within the group.
Individuals of the same litter and different dominance status were less likely to be within close
proximity of each other, suggesting that competition might play an important role for the spatial
organization of a group. During foraging, meerkats emit contact calls depending on their location
within the group and follow ‘vocal hotspots’, areas with many calls. When conditions deteriorate, as
during a drought, individuals vocalized independent of their spatial location within the group. The
increase of the number of group splits during the drought suggests that the call pattern used for
coordination is not maintained on a global level and that the cohesion mechanism of meerkats is
disrupted. Data from natural observations indicate that the decision of meerkat groups to stop foraging
and to return to the burrow is shared between group members. Both the decision to return and the
speed of the group at the return seem to depend on the urgency, as decisions were less shared and
groups moved faster, when meerkats were far from their burrow and sunset was imminent.
My thesis presents different aspects of group coordination and shows that group coordination
and decision-making in meerkats is affected by environmental constraints. Whereas all meerkats seem
to contribute to coordination and decision-making processes, the amount of sharing seems to be
strongly affected by time constraints. In addition, while meerkats seem to be able to flexible adjust their
coordination mechanisms to changes in the environment, coordination breaks down under extreme
conditions. These observations indicate the importance of changes in the environment on group
coordination and likely the evolution of sociality.

vi
vii
ZUSAMMENFASSUNG
Manche Tierarten leben in stabilen sozialen Gruppen und Wissenschaftler wundern sich seit langem
wie sich diese Gruppen im Raum bewegen, wie sie den Zusammenhalt bewahren und wie die Mitglieder
dieser Gruppen gemeinsam Entscheidungen treffen. In Gruppen lebende Tiere, müssen die Kosten und
Nutzen eines engen Zusammenlebens mit Artgenossen abwägen. Dabei können Vor- und Nachteile die
durch den Aufenthalt an bestimmten Orten innerhalb der Gruppe oder den Anschluss an ausgewählte
Gruppenmitglieder entstehen, maximiert bzw. reduziert werden. Tiere, die vokale Kommunikation für
den Zusammenhalt der Gruppe nutzen, ändern häufig ihre Rufrate abhängig von ihrem Standort
innerhalb der Gruppe. Dadurch können sie teilweise auch Einfluss auf die Bewegung anderer
Gruppenmitglieder nehmen. In vielen Arten spielt vokale Kommunikation während
Entscheidungsprozessen, wo sie der Kompromissfindung dient und so zu einem Konsens zwischen den
Gruppenmitgliedern führt, eine zentrale Rolle.
In dieser Dissertation behandle ich Fragen zur Gruppenkoordination und
Entscheidungsfindung in wilden Erdmännchen (Suricata suricatta), einer kleinen Mangustenart mit
gemeinschaftlicher Jungenaufzucht. Erdmännchengruppen haben eine strenge Hierarchie und eine
heterogene Gruppenzusammensetzung, wobei sich die Tiere nicht nur in ihrem Alter und Status
sondern auch in ihren Bedürfnissen und Präferenzen unterscheiden. Das Habitat von Erdmännchen ist
arid und fluktuiert in der Regenmenge und dem Nahrungsangebot. Dies kann negative Konsequenzen
auf die Koordination und die Entscheidungsprozesse einer Gruppe haben. Ein Großteil der Literatur
beschreibt in erster Linie die Entscheidungen einer Gruppe zur Änderung einer Aktivität. Nur ein
kleiner Teil der bisherigen Forschung thematisiert die Koordination während Gruppenbewegungen
oder die Entscheidungsfindung von Gruppen unter Zeitdruck. Noch weniger wurde untersucht, wie
Koordinations- und Entscheidungsprozesse von harten klimatischen Bedingungen beeinflusst werden.
Für meine Arbeit nutze ich sowohl Daten von Beobachtungen im Feld als auch Daten die durch
Experimente erhoben wurden. Konkret analysiere ich die räumliche Anordnung von Erdmännchen in
der Gruppe, den Mechanismus für den Zusammenhalt der Gruppe sowie die Entscheidungen einer
Gruppe die Nahrungssuche zu beenden und zum Bau umzukehren.
Meine Ergebnisse deuten darauf hin, dass die Kosten und Nutzen bestimmter Standorte
innerhalb der Gruppe zumindest am Nachmittag ausgeglichen sein könnten, da Erdmännchen keine
Präferenz für bestimmte Standorte zeigten. Tiere des gleichen Wurfes oder unterschiedlichem Status
mieden einander, was nahe legt, dass Konkurrenz zwischen bestimmten Gruppenmitgliedern während
der Nahrungssuche eine wichtige Rolle für die räumliche Anordnung der Gruppe haben könnte.
Während der Nahrungssuche geben Erdmännchen abhängig von ihrem Ort innerhalb der Gruppe viele
oder wenige Kontaktrufe und bewegen sich auf ‚vokale Hotspots‘ – Bereiche mit besonders vielen Rufen
– zu. Während einer Dürre, riefen Erdmännchen mehr und das unabhängig von ihrem Standort in der
Gruppe. Dabei weist die erhöhte Anzahl von Gruppenspaltungen während der Dürre darauf hin, dass
der auf Kontaktrufen basierende Zusammenhalt der Gruppe während Extremsituationen nicht
aufrecht erhalten werden kann. Daten aus Beobachtungen im natürlichen Lebensraum legen nahe, dass
alle Gruppenmitglieder zur Entscheidung die Nahrungssuche zu beenden und zur Schlafstelle
zurückzukehren, beitragen können. Allerdings scheinen sowohl der Entscheidungsprozess selbst, sowie
die Geschwindigkeit der Gruppe bei der Rückkehr zum Bau von der Dringlichkeit der Situation

viii
abzuhängen, da weniger Tiere zur Entscheidung beitrugen und sich die Gruppe schneller bewegte, je
weiter der Weg zum Bau war und je weniger Zeit zum Sonnenuntergang blieb.
Meine Dissertation behandelt verschiedene Aspekte von Gruppenkoordination und zeigt, das
Koordinations- und Entscheidungsprozesse durch die Umwelt eingeschränkt werden können.
Während alle Erdmännchen zur Koordination der Gruppe und zur Entscheidunsgfindung beitragen
können, scheinen beide Prozesse stark von Zeitdruck abzuhängen. Hinzu kommt, dass obwohl
Erdmännchen ihre Rufrate flexibel an unterschiedliche Umweltbedingungen anpassen können, der
Zusammenhalt der Gruppe unter extremen Bedingungen nicht aufrecht erhalten werden konnte. All
diese Ergebnisse deuten auf die Wichtigkeit von Umwelteinflüssen auf die Koordination von Gruppen
und vermutlich auch auf die Evolution von sozialen Systemen hin.

ix
CONTENTS
Acknowledgements iii
Summary v
Zusammenfassung vii
General Introduction 2
Chapter I 12
1. SPATIAL ASSORTMENT OF FORAGING MEERKAT GROUPS IS MAINLY SHAPED BY SOCIAL COMPETITION 14
Introduction 14
Methods 16
Results 19
Discussion 22
Appendix to Chapter I 26
Chapter II 28
2. GROUP COHESION IN FORAGING MEERKATS: FOLLOW THE MOVING ‘VOCAL HOT SPOT’ 30
Introduction 30
Methods 31
Results 33
Discussion 33
Chapter III 38
3. THE EFFECT OF CHALLENGING ENVIRONMENTAL CONDITIONS ON GROUP COHESION IN MEERKATS
(SURICATA SURICATTA) 40
Introduction 40
Methods 42
Results 44
Discussion 49
Chapter IV 52
4. AS DUSK FALLS: SHARED CONTROL OF THE RETURN TO SLEEPING SITES IN KALAHARI MEERKATS 54
Introduction 54
Methods 56
Results 59
Discussion 62
Appendix to Chapter IV 66
General Discussion 70
Bibliography 80

1
2
General Introduction

3

4
GENERAL INTRODUCTION
Costs and benefits of group living
In the broadest sense, an animal group can be characterized as an association of at least two individuals
from the same species over a given amount of time, which interact with each other to a greater degree
than with other conspecifics (1). An important aspect is that individuals do not only co-occur in time and
space, but that they are also socially attracted to each other (2). In nature, animal groups can take many
different shapes, from small family groups to large herds, shoals or flocks (2). Being part of a group can
have multiple advantages for an individual, ranging from a reduction in predation risk through cumulative
vigilance (2, 3) or dilution effects (4, 5), to a reduction of heat loss (6, 7) or an increase in food acquisition
(2, 8). While most of the benefits of grouping are influenced by the size of a group, they can be outweighed
by costs to each individual when group size is above the optimum (2). This can lead to groups forming
only temporarily or groups splitting when conditions are suboptimal (2). The size of groups and
subgroups depends on the trade-offs between costs and benefits, for example in spotted hyenas (Crocuta
crocuta), where subgroup size increases with increasing risk from predators or competitors (9). Group or
subgroup size can also be influenced by social preferences, kinship or the avoidance of aggression (9, 10).
Differences in group composition can have important implications for the cost and benefit trade-offs faced
by each individual in a group (2, 11, 12). For instance, in rabbits (Oryctolagus cuniculus) the life time
reproductive success of females was negatively influenced by the presence of same sexed conspecifics (13).
Furthermore, individual differences can have negative or positive effects on the group as a whole, for
example predators often preferentially target ‘odd’ individuals, differing in morphological and/or
behavioural traits (14). Therefore, groups including such individuals are more likely targeted than other
groups. Different spatial locations within the group can also be associated with different risks or benefits.
Hamilton predicted that if a predator always attacked the nearest prey, individuals at the periphery of a
group should be at higher risk than individuals located toward the centre (4). This may be reflected in the
spatial distribution of group members, with dominant individuals monopolising more central and
therefore safer positions (15–17).
Group decision-making
For group living animals, group decisions are essential to regulate or synchronise the behaviours and
actions of each group member into an integrated and harmonious group activity (18–20). Two
conceptually different types of group decisions have been described, namely ‘combined’ decisions and
‘consensus’ decisions (21). In combined decisions, each individual within a group chooses between
different options, depending on the behaviour of other group members and the combined result of these
individual decisions affects the whole group (20, 21). For example, in eusocial insect communities,
individuals perform specific tasks, such as foraging or nursing larvae, according to the current need for
either of the options (22). In contrast to consensus decisions, combined decisions do not require a group
to remain cohesive and this type of decision-making is therefore common in fission-fusion societies (21,
23). However, when group members need to synchronize in order to maintain the benefits of group living
(2), they need to come to a consensus about the type and timing of group activities in order to avoid group
fragmentation (19, 24, 25). This can lead to conflicts of interest, when activities are mutually exclusive,
such as foraging and resting, and when individuals differ in their preferences for the optional activities or

5
the timing of these. Therefore, consensus decisions are invariably connected to ‘consensus costs’ to each
group member where the outcome of the decision is suboptimal (11, 19, 21, 26).
Different numbers of group members can be involved in consensus decisions. When a single
individual decides for the whole group and thereby emerges as the leader, the decision is referred to as
‘unshared consensus decision’, while decisions with multiple or all group members participating in the
decision-making process are referred to as ‘partially shared consensus decisions’ and ‘equally shared
consensus decisions’ respectively (21). Shared consensus decisions have been suggested to be more
beneficial to each individual in a group than unshared decisions, as the fitness costs to most individuals
and the group as a whole, are reduced by finding a compromise between preferred options and by
reducing the likelihood of extreme outcomes (19, 27). Certain circumstances are predicted to favour the
evolution of shared consensus decision-making. For example, when grouping benefits are small, groups
can split to avoid the fitness costs associated with following a despotic leader. Therefore to maintain group
cohesion, shared consensus decisions should be favoured (27). Similarly, in a situation of high conflict,
where costs associated with the different options available are large and vary extensively for members of
the same group, individuals should have a strong incentive to participate in the decision-making process
(27). In addition to improving the cost-benefit ratio for each individual, shared consensus decisions have
been shown in some cases to enhance the accuracy of a decision, such as in honeybees (Apis mellifera) or
house hunting ants (Leptothorax albipennis), where groups chose higher quality nest sites, when more
individuals share the decision (28–30). While equally or partially shared consensus decisions seem to be
more common in nature (20, 31, 32), there are nevertheless circumstances, in which it might be more
beneficial to follow a despotic leader. Theoretical models suggest that unshared decisions are only likely
to arise in small groups and when the leading individual has much greater knowledge about the different
options than the other group members (19, 21, 33). In such situations individuals would incur less fitness
costs when following the despotic leader, than when following their own decision. For example, bottlenose
dolphins (Tursiops sp.) benefit from following the most informed individual in their group, when deciding
where to move for foraging (34) and African elephants (Loxodonta africana) follow the matriarch, the
oldest and most experienced female in the herd (35). In addition, it has been suggested, that less shared
or completely unshared consensus decisions might be favoured when a group of animals is time
constrained and decisions need to be taken fast (28, 29, 36).
There are different ways how individuals can make decisions or participate in the decision-
making process. Couzin and his colleagues (37) proposed a model of collective movement with simple
interaction rules, leading to efficient decision-making in the absence of explicit signals or complex
mechanisms for the exchange of information. In this mechanism, used in some circumstances by fish (38),
baboons (39) and humans (40), leadership can emerge, as group members respond spontaneously to
highly informed individuals, rather than leadership being invoked through differences in individual traits
such as dominance or age. Some decision-making mechanisms rely on positive and negative feedbacks in
order to improve the accuracy or the speed of a decision (41). For instance, ant workers of the species
Monomorium pharaonic, deposit pheromones on the route between a newly found resource and their
nest, in order to attract additional foragers. Each ant moving along the trail will add additional
pheromones according to the quality of the resource. High amounts of pheromones associated with high
quality will recruit a higher number of helpers, resulting a positive feedback loop, while few pheromones
indicate low quality or a depleted resource and recruit little to no help (42). When the trail gets crowded
Lasius niger ants have been shown to decrease the amount of pheromones they deposit, thereby leading

6
to a negative feedback and reducing the number of additional recruits (43). Thus, these feedback
mechanisms lead to an efficient distribution of the workforce and an efficient resource acquisition. In the
above mentioned examples, leadership is passive and emerges as a property of the group. However animal
groups can have active leadership, where potential leaders actively signal their intention and group
members can then decide to follow or to ignore the leading attempt (44). In these cases individuals can
‘vote’ to settle for one option, by communicating their preferred decision to their conspecifics (45). A
number of species, such as honey bees (46), ants (29), fish (47, 48) and meerkats (Suricata suricatta) (49)
have been shown to use a quorum rule to choose between options. A quorum is the minimum number of
group members needed to be in favour of one option in order for the rest of the group to also choose that
particular option (47, 49). Quorums thereby allow for information transfer and more accurate decision-
making while reducing the time spent deciding and the consensus costs to each group member (41, 47).
Group coordination through vocal communication
The interactions between animals can be mediated by the use of communication, where a signal is defined
as being directed from a sender to an attentive receiver who changes its behaviour as a result of the signal
(50). Animals can use different modalities to communicate with each other over different temporal or
spatial scales, such as olfactory, visual, acoustic or electric signals (50–52). The acoustic modality offers
great advantages as it allows individuals to share information locally, only within close range, as well as
globally, with every group member, and with little influence of physical barriers (50, 52). Most mammal
species have call repertoires of individually distinct calls with specific functions (53). Many different types
of calls have been described, differing in their acoustic structure, the context in which they are produced
and the response they elicit from a receiver (50). One of the most extensively studied call types are contact
calls, ‘affiliative’ calls, used between conspecifics with affiliative relationships, for example group members
(53). In the context of group coordination, contact calls play a major role and can encode various types of
information. For instance, contact calls of many bird and mammal species contain information about the
identity of the caller, which can be used by receivers to identify their social partner or group membership
(53). Soft, close range contact calls, termed ‘close calls’, mainly function to regulate spacing between group
members and/or the maintenance of group cohesion (54, 55), important for the stability of groups during
locomotion and foraging. For instance, Japanese macaques (Macaca fuscata) have been shown to change
the structure of their close calls when visibility is poor (56) while for example squirrel monkeys (Saimiri
oerstedi) and ring tailed lemurs (Lemur catta) increase their call rate when group dispersion is increased
(57, 58).
Aims of research
Most work on decision making of wild populations focuses on collective movement, when individuals have
to decide where to move and when. These studies mostly focus on the pre-departure period of group
travel or before changes in the activity of a group (31). In contrast, relatively little work has focused on
group coordination during group movement, and how wild animal groups make decisions under time
constraints. A so far neglected aspect has been how coordination and decision-making processes are
affected by extremely harsh environmental conditions, when for example food resources become
extremely scarce. As a consequence, group members will have to disperse much further to find prey which
will have a negative influence on group cohesion and group decision-making. Here I aim to investigate
how a wild population of meerkats coordinates activities and group cohesion, and how group coordination

7
is affected by time constraints and a long-lasting drought. In contrast to previous studies, I specifically
investigate group coordination during times when animals are moving continuously rather than during
pre-departure periods This is when coordination is more difficult as individuals can be more or less
synchronized and information transfer might only be local rather than global.
Study species
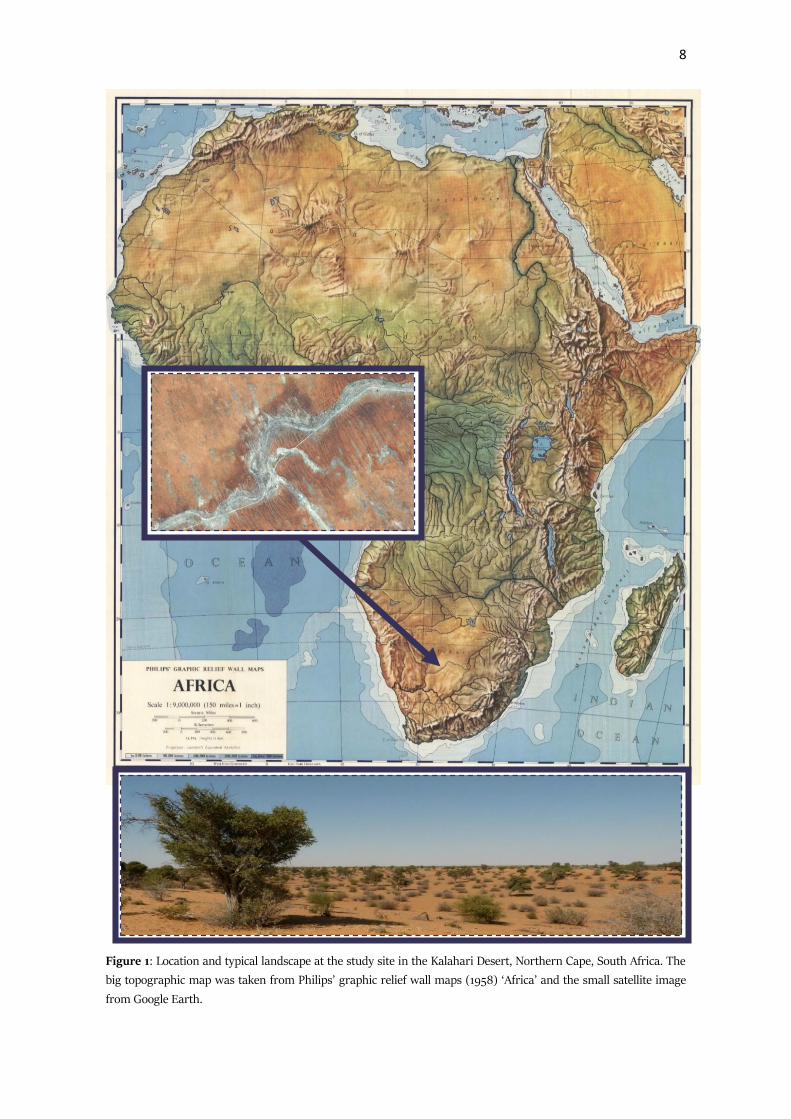
Meerkats are a small, social carnivore belonging to the family of the Herpestidae. They occur in the
southern part of Africa (Figure 1) and live in hierarchically organized groups of on average 15 individuals,
ranging from 3 to 50 (59). Meerkats are cooperative breeders, meaning that all group members help to
rear the offspring (59) and all adult females, not only the offspring’s mother, nurse young (Figure 2,
bottom right) (60). The dominant female, in general the oldest and heaviest female in the group, makes
most breeding attempts (around 80%), and the dominant male fathers most of her offspring (61, 62).
During day time meerkats forage as a cohesive group and move through their home range. At night, they
sleep in underground burrows, which they change on a regular basis (63). These burrows are commonly
used as birth places for offspring, and meerkat groups remain at the birth burrow for the first three to
four weeks in the life of the new litter (64). During this time mainly subordinate individuals take turns in
babysitting the pups, enduring prolonged times of fasting (64). When pups reach about four weeks of age,
they join the rest of the group to forage and all group members help to provide them with food until they
can forage independently at about 3 months of age (Figure 2, centre right) (65).
In this species males are the dispersing sex, starting to ‘rove’ from their natal group when they
are about 1 year old (59). However, while females are generally philopatric, subordinate females are
frequently evicted during the breeding season by the dominant female and are either readmitted into the
group at a later time or can form new groups with roving males (66). While groups are highly social and
individuals engage in many affiliative social interactions within their group (Figure 2, top left), groups are
highly territorial, with territories ranging between 2 – 4 km2 (63). Territorial borders are maintained
through scent marking (67) and are defended in inter group encounters, where groups ‘war dance’ against
potential intruders (Figure 2, bottom left).
Meerkats forage as a cohesive unit, each individual scrabbling head down for small prey living in
the sand (Figure 2, centre left) (68). Typical prey includes invertebrates such as millipedes, larvae or
scorpions as well as more rarely small vertebrates (geckos, lizards, small snakes, or rodents) (68). As each
individual is searching for prey with its head mostly below ground, individual vigilance and visual
communication between group members is reduced, and this might have led to the evolution of their
sentinel and complex vocal system (69). During foraging group members take turns as sentinels, going
on ‘raised guard’ and announcing the presence of potential predators (Figure 2, top right) (70), such as
eagles or snakes. Meerkats can produce more than 30 different call types, some distinct and others being
part of a graded system based on urgency, such as their alarm calls (71, 72). Most calls are only emitted in
a specific context and some can help to mediate decision-making processes or help to coordinate group
activities (70, 73).
8
Figure 1: Location and typical landscape at the study site in the Kalahari Desert, Northern Cape, South Africa. The
big topographic map was taken from Philips’ graphic relief wall maps (1958) ‘Africa’ and the small satellite image
from Google Earth.
9
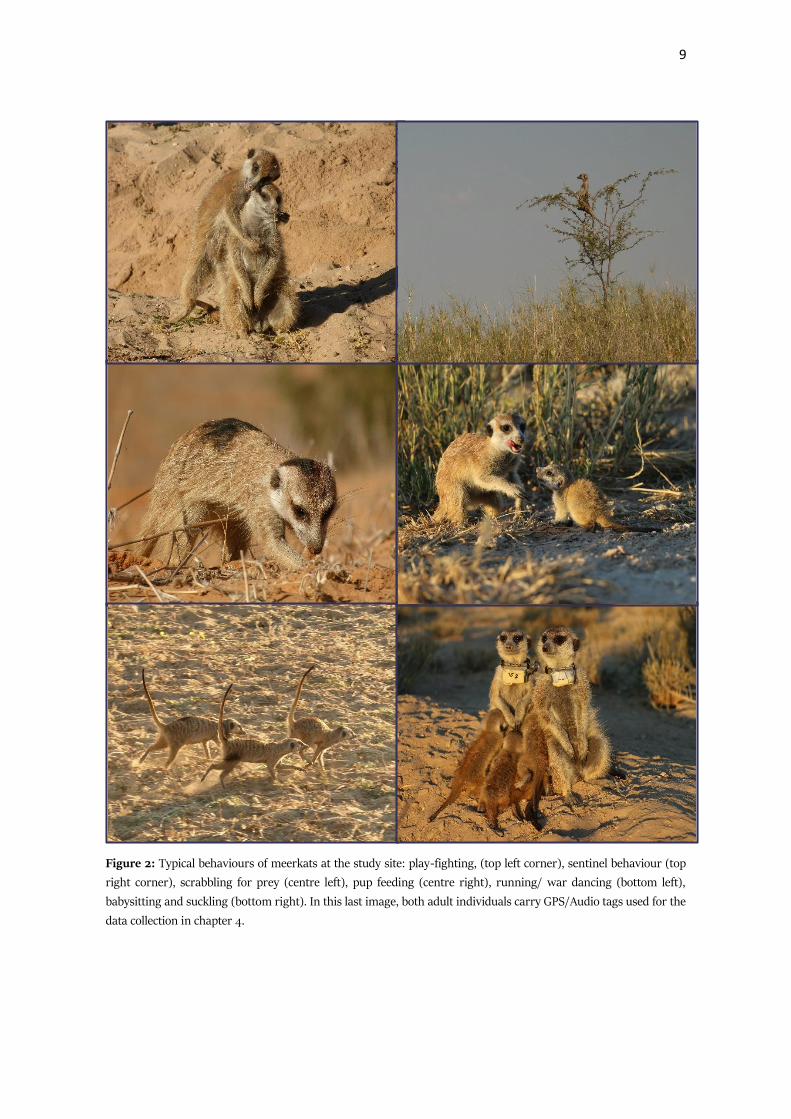
Figure 2: Typical behaviours of meerkats at the study site: play-fighting, (top left corner), sentinel behaviour (top
right corner), scrabbling for prey (centre left), pup feeding (centre right), running/ war dancing (bottom left),
babysitting and suckling (bottom right). In this last image, both adult individuals carry GPS/Audio tags used for the
data collection in chapter 4.

10
Study site and population
The data for this study was collected at the Kalahari Meerkat Project, Kuruman River Reserve, in the
Northern Cape of South Africa (Figure 1). Being located within the Kalahari Desert, the study site has an
arid climate with less than 220 mm annual rainfall, and is characterized by its sandy soil and a vegetation
including different grasses, shrubs and multiple species of acacia (61). For this thesis, we included long-
term data collected by the project over the last 14 years on more than 70 meerkat groups, ranging from 2
to 49 individuals (mean ± SD = 15.1 ± 7.6), as well as experimental data and high resolution GPS and
acoustic data collected between January and March 2015 on eight meerkat groups, ranging from 9 to 22
individuals (mean ± SD = 15.6 ± 3.5). We further used vocal data recorded between October 2014 -
January 2015 on 12 groups, ranging from 6 to 23 individuals (mean ± SD = 15.2 ± 5.5) and between
October 2015 - January 2016 on 11 groups, ranging from 3 to 21 individuals (mean ± SD = 13.8 ± 4.4).
Data of the long-term data set provided by the project were collected by visiting each of the groups on
approximately three days per week in the morning for 3 hours, the evening for 1.5-2 hours or both. The
groups were located by tracking VHF (very high frequency) radio collars fitted around the neck of one
group member (67, 74). All animals within the groups were habituated to close human observation within
less than 1 m and could be identified through individual dye mark combinations (67).
Outline of thesis
In this thesis, I investigate different aspects of group coordination in foraging meerkats, especially the the
mechanism used to maintain cohesion and other decision-making processes. As the spatial location of an
individual can reflect the trade-offs faced by each group member and these in turn have important
implications for coordination, Chapter 1 is concerned with the spatial structure of foraging meerkat
groups. In particular, I investigate whether the spatial location of each meerkat within a group depends
on environmental factors such as predation risk or foraging success, and/or social preferences or
competition. In Chapter 2 I investigate the mechanism used by meerkat groups to maintain cohesion.
This mechanism relies on vocal communication, in particular the use of close calls. Therefore, use data
from a playback experiment to investigate how receivers use close calls emitted by others to keep in
contact. In Chapter 3 I examine how the coordination mechanism based on close calls, which I study in
Chapter 2, is affected by extreme environmental conditions such as a drought. To investigate this, I use
long-term data collected by the Kalahari Meerkat Project as well as focal recordings from a severe drought
year (Oct 2015 - Jan 2016) and the preceding non-drought year (Oct 2014 - Jan 2015). Finally, in Chapter
4 I examine how meerkats decide how and when to return to their sleeping burrow in the evening and
whether this decision is monopolized by a single dominant individual. For this I use both high-resolution
GPS data and continuous audio recordings for the same time frame, as well as long-term data collected
by the Kalahari Meerkat Project. Overall this thesis addresses gaps in group coordination literature, in
particular the importance of vocal communication, environmental pressures and time constraints for
group coordination and decision making.

11

12
Chapter I

13
14
SPATIAL ASSORTMENT OF FORAGING MEERKAT GROUPS IS MAINLY SHAPED BY SOCIAL
COMPETITION
Gabriella E. C. Gall, Tim H. Clutton-Brock & Marta B. Manser
Submitted to Behavioral Ecology and Sociobiology
ABSTRACT
Group living animals need to trade-off the benefits and the costs of close proximity to many conspecifics.
Benefits can be increased, and costs reduced, by preferentially choosing specific locations within a group,
best adjusted to an individual’s needs or by associating with specific group members and/or avoiding
others. Here we investigated the spatial structure of foraging meerkat (Suricata suricatta) groups during
afternoon foraging session and examined whether the spatial structure was shaped by predation risk,
foraging success, social factors such as affiliation or aggression among group members, or a mix of these
different factors. Using social network analyses, we found no correlation between specific within-group
spatial locations and an individual’s dominance status, sex or age. However, we found evidence of
avoidance among individuals of the same dominance status or litter, suggesting that competition between
individuals plays an important role. Young individuals were more strongly connected at close proximity
than older individuals and this relative connectedness remained stable over the period of the foraging
session. We conclude that predation risk and foraging success were of minor importance during the period
of data collection and that social affiliation and competition were the main driver of the spatial structure
of foraging meerkat groups.
INTRODUCTION
The costs and benefits of group living are unevenly distributed as a function of individual traits,
within-group spatial location and the mobility of a group (2). However, most studies focus either on the
relative location of individuals within a group to assess differences in predation risk or foraging success,
or they focus on the association between individuals, in order to draw conclusions on the social structure.
Here we try to disentangle the impact of these different aspects on the spatial structure of a group.
Theoretical models and empirical studies suggests that in stationary groups both predation risk (4, 15–17,
75, 76) and foraging success increase toward a group’s periphery (15, 77, 78). In contrast, in mobile groups
not only individuals at the edge of the group, but especially those at the front or the rear of the group’s
progression are at higher risk of predation, depending on the mobility of the predator (2, 79–81). Similarly,
foraging success increases toward the front of the group as the individuals located there are the first to
reach a food source (77, 82).
Variation in the costs of close proximity to group members are often dependent on an individual’s
traits and the traits of its surrounding group members, such as rank, sex or age, and can vary in time and
space, leading to the emergence of non-random spatial distributions of phenotypes within a group (2, 83,
1

15
84). Through further non-random association or avoidance of particular conspecifics, each individual can
increase the benefits of grouping or decrease its costs to an even greater extent. For example, individuals
with the same sex or age might associate more often than random (85), and subordinate or sub-adult
individuals might avoid encounters with dominant or older group members and therefore avoid central
positions or they might be actively excluded from these locations (85, 86). Such processes could drive
patterns of assortativity (preference for alike) or disassortativity (preference for different individuals) in
the spatial positioning of individuals.
Meerkats (Suricata suricatta) provide a great study organism to investigate the spatial structure
of foraging groups and to identify the trade-offs faced by individuals in their choice of spatial location
within a group. Meerkats are a cooperatively breeding mongoose species populating the southern part of
Africa and living in groups of 2-50 individuals (87). They have a despotic hierarchy, with a dominant
breeding pair and subordinate helpers (61). Individuals compete for dominance status and reproductive
opportunity within a sex (59) leading to a hierarchy in subordinate individuals (88) as well as the
temporary expulsion of some individuals from the group (89). Meerkats already face competition early in
life, competing for access to helpers providing them with food as pups (90–92) and adjusting their growth
when at risk of being outcompeted by their littermates (93). The dominant female is the most aggressive
individual within the group and also highly competitive for food, especially when her dietary requirements
increase, as during the breeding season (94). Meerkats forage cohesively and move continuously in search
of mainly small prey scattered in the sand (68). During foraging, meerkats are at high risk of predation
by terrestrial and aerial predators (61) which has led to the evolution of a coordinated sentinel system
(95) and a sophisticated vocal system (69)
Here we investigated whether the spatial structure of foraging meerkat groups is influenced by
the potential predation risk or foraging success related to within group spatial location, social competition,
or all of these factors. If foraging meerkat groups are structured based on predation pressure or their
nutritional needs, we expect individual differences in location relative to the front of the group based on
dominance status, sex and age. In particular, we expect the older and dominant individuals to be more
likely located toward the centre-front of the group, where foraging success is likely the highest. In contrast,
we expect younger individuals, who lack knowledge and experience in searching for prey, toward the
centre-back where they can benefit from additional vigilance by their conspecifics, as they will take more
time to find and extract prey and as a result have less time to be vigilant themselves. Moreover, we expect
similar individuals, e.g. litter mates, to occupy similar spatial locations as they face similar trade-offs (2).
However, if social competition among individuals plays the most important role, then we expect instead
to see individuals avoiding their strongest competitors, potentially leading to occupying specific positions,
e.g. less rewarding and more risky locations, relative to the whole group. In meerkats we expect the
highest competition between subordinate and dominant individuals but also between individuals of the
same sex or litter (88). These different aspects are not exclusive, therefore if multiple factors are important
we expect to find a combination of these patterns, i.e. an age and dominance related distribution toward
the front and rear as well as an avoidance pattern between similar individuals and the avoidance of
dominant individuals by subordinates.
16
METHODS
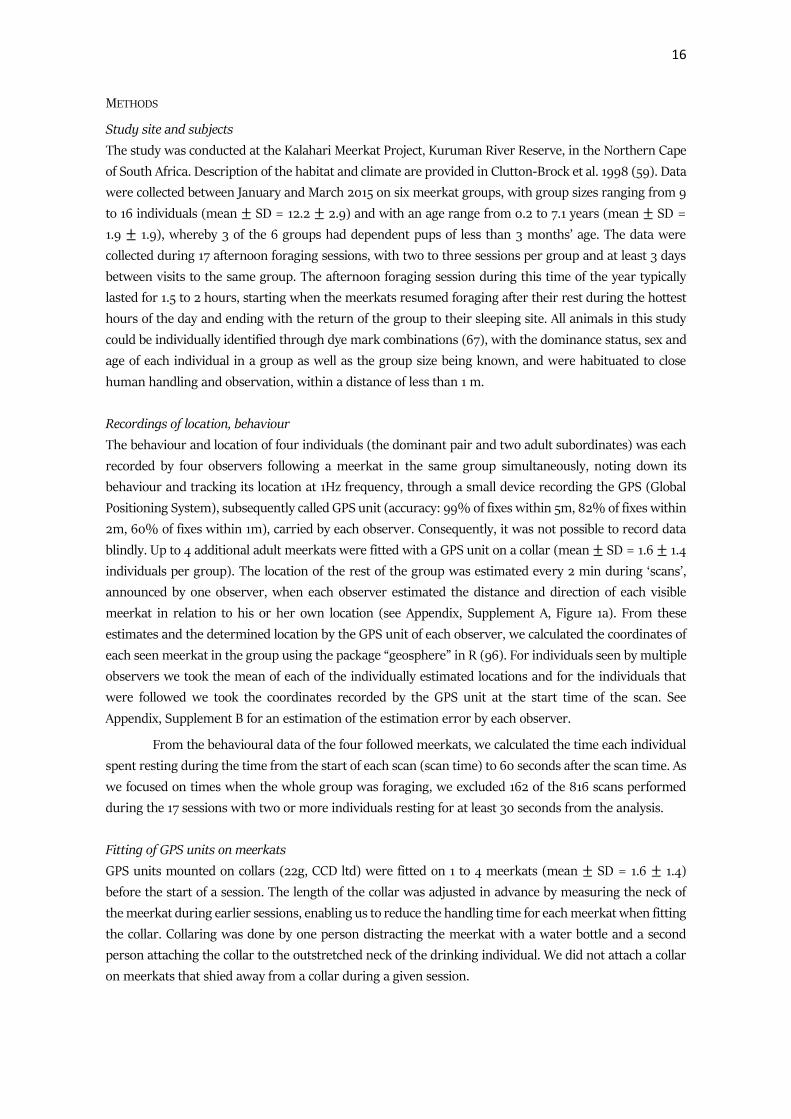
Study site and subjects
The study was conducted at the Kalahari Meerkat Project, Kuruman River Reserve, in the Northern Cape
of South Africa. Description of the habitat and climate are provided in Clutton-Brock et al. 1998 (59). Data
were collected between January and March 2015 on six meerkat groups, with group sizes ranging from 9
to 16 individuals (mean ± SD = 12.2 ± 2.9) and with an age range from 0.2 to 7.1 years (mean ± SD =
1.9 ± 1.9), whereby 3 of the 6 groups had dependent pups of less than 3 months’ age. The data were
collected during 17 afternoon foraging sessions, with two to three sessions per group and at least 3 days
between visits to the same group. The afternoon foraging session during this time of the year typically
lasted for 1.5 to 2 hours, starting when the meerkats resumed foraging after their rest during the hottest
hours of the day and ending with the return of the group to their sleeping site. All animals in this study
could be individually identified through dye mark combinations (67), with the dominance status, sex and
age of each individual in a group as well as the group size being known, and were habituated to close
human handling and observation, within a distance of less than 1 m.
Recordings of location, behaviour
The behaviour and location of four individuals (the dominant pair and two adult subordinates) was each
recorded by four observers following a meerkat in the same group simultaneously, noting down its
behaviour and tracking its location at 1Hz frequency, through a small device recording the GPS (Global
Positioning System), subsequently called GPS unit (accuracy: 99% of fixes within 5m, 82% of fixes within
2m, 60% of fixes within 1m), carried by each observer. Consequently, it was not possible to record data
blindly. Up to 4 additional adult meerkats were fitted with a GPS unit on a collar (mean ± SD = 1.6 ± 1.4
individuals per group). The location of the rest of the group was estimated every 2 min during ‘scans’,
announced by one observer, when each observer estimated the distance and direction of each visible
meerkat in relation to his or her own location (see Appendix, Supplement A, Figure 1a). From these
estimates and the determined location by the GPS unit of each observer, we calculated the coordinates of
each seen meerkat in the group using the package “geosphere” in R (96). For individuals seen by multiple
observers we took the mean of each of the individually estimated locations and for the individuals that
were followed we took the coordinates recorded by the GPS unit at the start time of the scan. See
Appendix, Supplement B for an estimation of the estimation error by each observer.
From the behavioural data of the four followed meerkats, we calculated the time each individual
spent resting during the time from the start of each scan (scan time) to 60 seconds after the scan time. As
we focused on times when the whole group was foraging, we excluded 162 of the 816 scans performed
during the 17 sessions with two or more individuals resting for at least 30 seconds from the analysis.
Fitting of GPS units on meerkats
GPS units mounted on collars (22g, CCD ltd) were fitted on 1 to 4 meerkats (mean ± SD = 1.6 ± 1.4)
before the start of a session. The length of the collar was adjusted in advance by measuring the neck of
the meerkat during earlier sessions, enabling us to reduce the handling time for each meerkat when fitting
the collar. Collaring was done by one person distracting the meerkat with a water bottle and a second
person attaching the collar to the outstretched neck of the drinking individual. We did not attach a collar
on meerkats that shied away from a collar during a given session.

17
Statistical Analysis
We used R statistical software version 3.3.0 (96) to prepare and analyse the spatial location data.
Specifically we used the packages ‘psych’ (97) to inspect the data, ‘maptools’ (98), ‘geosphere’ (99), ‘move’
(100) and ‘NISTunits’ (101) to calculate the locations of the scanned individuals, as well as the distances
and turning angles for each individual and time step. Furthermore, we used the packages ‘sna’ (102),
‘asnipe’ (103), ‘assortnet’ (104) and ‘igraph’ (105) for the social network analysis and ‘lme4’ (106),
‘lmerTest’ (107) and ‘ICC’ (108) for the statistical analysis.
a) Generating spatial networks for each group
As a group’s dispersion can change over time, affecting the appropriate distances used for the calculation
of the association network, we first tested whether there were substantial changes in group spread over
time. For this we calculated the average nearest neighbour distance during each scan for each session. We
than tested, using a linear mixed effects model (LMM), whether the average nearest neighbour distance
changed toward the evening and depended on group size and. We therefore included the interaction
between scan number and group size as explanatory variables and added the session nested in the group
as random factor. Average nearest neighbour distance ranged from 0.3 m to 1.0 m (mean ± sd = 0.9 ±
0.1 m) in each group and decreased during the session (LMM: Estimate [2.5%, 97.5%] = 0.003 [-0.006,
-0.003], t-value = -2.19, P = 0.03) and with increasing group size (Estimate [2.5%, 97.5%] = 0.01 [0.00,
0.01], t-value = 2.07, P = 0.04). However, as the effective decrease with group size was small, we
calculated a close range ‘1 m network’ for each group, where two individuals were regarded as in contact
when they were within 1 m of each other. As meerkats are highly vocal and communicate constantly via
close calls during foraging (109), we calculated a second ‘5 m network’ for each group where individuals
counted as being in contact when they were within 5 m of each other. This distance threshold is based on
playback results (73) showing that meerkats adjust their close call rate depending on their neighbours
within approximately this range. The edge weights between a dyad was defined as the fraction of time the
two individuals were seen within the given range (1 m or 5 m) divided by the total number of scans in
which at least one of the two individuals was observed. For the analysis of the association patterns we
calculated these weighted networks for all sessions per group combined. To investigate the stability of the
associations between individuals, we also calculated the weighted networks for each foraging session per
group separately, henceforth called 1 m session network and 5 m session network respectively.
b) Association patterns
We used the 1 m and 5 m networks to investigate whether meerkats associate preferentially with similar
individuals based on their dominance status, sex, age class or litter affiliation. Based on the methods
discussed by Farine and Whitehead (110) we calculated the sum of the edge weights between individuals
of the same status vs. individuals of different status, same sex vs. individuals of different sex, individuals
of the same age class vs. individuals of different age classes, and individuals of the same litter vs.
individuals of different litters. For the last analysis, we only included individuals where at least one
littermate was present in the group. While we calculated the sum of the edge weights over the network of
each group, we calculated the test-statistics for the networks of all groups combined and tested the
significance of the difference based on 1000 node permutations of each network (110) (Appendix,
Supplement A, Figure 2). For the test statistics of each of the 4 comparisons, we fitted linear mixed effects
models comparing the strength of connection between individuals of the same attribute (dominance

18
status, sex, age class or litter) vs. the strength of connections between individuals of different attributes,
by including the sum of the edge weights as the response variable, the type of the connection (same vs.
different attribute) as the explanatory variable and the group as a random effect. We then compared the
coefficient of the observed network with the distribution of coefficient of the randomized networks. We
used a Bonferroni-correction to account for multiple testing, adjusting the α level to 0.0125 and give the
adjusted p-values in the results section.
c) Network strength and individual repeatability
To test whether the strength (sum of edge weights; a measure of local social density) of an individual
within a group is dependent on the dominance status, sex, or age class of an individual, we fitted two
LMMs with the strength, for the 1 m network and the 5 m network respectively, as the response variable;
with dominance status, sex, and age class as explanatory variables, and with the individual identity nested
in group as a random factor. Again, we controlled for multiple testing using a Bonferroni correction. We
then calculated the proportion of the variance explained by individual identity, and tested whether the
individual strength was repeatable across different sessions. For this we fitted the same two models again
without the individual in the random term and compared them with a log likelihood ratio test.
d) Location of individuals within the group
To examine whether individuals preferentially use specific locations within the group, we first calculated
the group’s centroid (mean x, y position across all individuals) for each scan, and then the mean distances
to the centroid for each individual and session. We then fitted a LMM with the distance from the group
centroid to the individual centroid as the response variable, dominance status, sex, age class and the
strength of both the 1 m and the 5 m session networks as explanatory variables and the individual identity
nested in the group as random factor. Furthermore, we calculated the magnitude of the individual vector
when projected on the group vector (see Appendix, Supplement A, Figure 1b), indicating the order of
individuals within the group in the direction of group movement, and fitted another LMM again with
dominance status, sex, age in years and the strength of both the 1 m and 5 m session networks as
explanatory variables as well as the individual identity nested in the group as random factors. We used a
Bonferroni correction to account for multiple testing, adjusting the α level to 0.025.
e) Comparison of alarm call events in the morning and afternoon
The results from these previous sections (a-d) differ from previous studies by Bousquet (111) and Barnard
(112). As the data from these previous studies were collected during the morning sessions, while the data
for the current study where collected during the afternoon sessions, we investigated whether predation
pressure might change throughout the day, explaining the differences found between the studies. For this,
we used data collected by the KMP on the alarms given by groups between June 2013 and June 2016. We
calculated the frequency of alarm events for each group for each session and standardized the frequency
by the duration of each session, as the afternoon session is generally shorter than the morning session.
We square root transformed the standardized frequency of alarm events given and fitted it as the response
variable in a LMM. We fitted the session as explanatory variable and the group as random term.

19
RESULTS
Association patterns
When we compared whether meerkats were more frequently in the proximity of group members of the
same dominance status, sex, age class or litter, we found a difference between the association of
individuals within close proximity, i.e. the 1 m network (Table 1), and the 5m network which includes also
individuals at larger distances to each other. In the 1 m network, we found that individuals of the same
dominance status associated more with each other than individuals of different dominance status (Figure
1a). However, we found that individuals of the same sex (Figure 1b) and litter (Figure 1d) were significantly
less likely to be within 1 m of each other. Furthermore, individuals of the same age class (Figure 1c) were
as likely to associate with each other as individuals of different age. For the 5 m network (Table 1), we
found no difference in association between individuals of the same dominance status, sex or age class
compared to individuals of differing dominance status (Figure 1e), sex (Figure 1f) or age class (Figure 1g).
However, similar to the 1 m network, individuals of the same litter were less likely to be within 5 m of
each other than animals of different litters (Figure 1h).
Table 1: Results of the association patterns between individuals according to their trait. The networks were
permutated 1000 times and a LMM was fitted to the original data and each of the permutations. The coefficients of
the observed network were compared with the distribution of coefficients of the randomized networks. We used a
Bonferroni-correction to account for multiple testing, adjusting the α level to 0.0125 and give the adjusted p-values
in the table. Estimates and confidence intervals were calculated for the real data.
Network type Individual trait Estimate Confidence Intervals
[2.5%, 97.5%]
P value
1 m network Same dominance status 0.09 [0.07, 0.11] 0.004
Same sex -0.02 [-0.03, -0.01] 0.10
Same age -0.02 [-0.03, -0.00] 0.38
Same litter -0.10 [-0.12, -0.08] 0.004
5 m network Same dominance status 0.51 [0.37, 0.65] 1.00
Same sex -0.10 [-0.17, -0.03] 0.06
Same age -0.04 [-0.17, -0.09] 1.00
Same litter -0.90 [-0.98, -0.81] < 0.001

20
Figure 3: Strength (connectivity) of an individual, i.e. the sum of the edge weights, in the 1 m network (a – d) and
the 5 m network (e – h) respectively, in relation to whether the connected nodes were the same dominance status
(a, e), sex (b, f), age (c, g) or from the same litter (d, h), as well as the distribution of the permutated coefficients and
the coefficient of the observed networks (black line) for each of the different comparisons. The error bars show the
standard deviation and the asterisks indicate significant differences (* p ≤ 0.05; ** p ≤ 0.01; *** p ≤ 0.001).
Network strength and individual repeatability
In the 1 m network, strength (the sum of the edge weights) was best explained by age, with younger
individuals being better connected than older individuals (Figure 2a), while dominance status and the sex
of an individual did not significantly affect network strength (Table 2). In the 5 m network, neither
dominance status, nor sex or age (Figure 2b) had a significant influence on the individual strength (Table
2). Individual identity accounted for 2% of the total variance in the 1 m network and strength was
repeatable between different sessions (Log likelihood = -58, 01, DF=1, AIC = 130.12, BIC = 153.42, χ2 =
186.96, P < 0.001). In the 5 m network individual identity accounted for 5% of the total variance but
strength was not repeatable between different sessions (Log likelihood = -151.38, DF=1, AIC = 316.77, BIC
= 349.07, χ2 = 0.32, P = 0.57).
Location of individuals within the group
The distance of an individual in relation to the group’s centroid was not significantly affected by
dominance status, sex or age class of the individual nor by the strength within the 1 m network. However,
an individual’s strength in the 5 m network predicted its location, with strongly connected individuals
being significantly closer to the group centroid than less strongly connected individuals (Table 3). We
found similar results for the order of individuals within the group progression, where again dominance
status, sex and age class as well as the strength within the 1 m network did not affect the location, while
the strength in the 5 m network significantly affected the order within the group, with more strongly
connected individuals being located toward the front of the group’s progression.

21
Figure 2: Strength of an individual in the 1 m network (a) and 5 m network (b) against the age of the individual.
The lines indicate the linear regression.
Table 2: Results of the LMMs to test which individual traits affect the strength of an individual in the 1m and 5m
network respectively connectedness of an individual. The strength is the sum of the edge weights of a network and
a measure of relative connectedness.
Response
Variable
Explanatory
Variables
Estimate Confidence Intervals
[2.5%, 97.5%]
SE DF t value P value
Strength
in 1 m
network
Intercept
Dominance: Sub
Sex: M
Age
0.81
-0.04
0.00
-0.05
[0.60, 1.03]
[-0.21, 0.12]
[-0.09, 0.09]
[-0.08, -0.01]
0.11
0.09
0.05
0.02
42
60
65
62
7,32
-0.52
0.02
-2.63
< 0.001
0.60
0.99
0.01
Strength
in 5 m
network
Intercept
Dominance: Sub
Sex: M
Age
2.06
-0.28
-0.07
-0.03
[-3.70, -0.29]
[-0.44, 1.37]
[-0.19, 0.25]
[0.16, 1.31]
0.19
0.14
0.08
0.03
34
56
60
58
11.05
-2.00
-0.73
-0.91
< 0.001
0.05
0.47
0.37
Table 3: Results of the LMMs to test for special location preferences dependent on network strength or individual
attributes (i.e. dominance status. sex and age). Distance stands for the distance to the centroid, while the order stands
for the magnitude of the projected individual vector on the group vector (see Figure 1b).
Response
Variable
Explanatory
Variables
Estimate Confidence Intervals
[2.5%, 97.5%]
SE DF t value P value
Distance Intercept
1 m: Strength
5 m: Strength
Dominance: Sub
Sex: M
Age
11.74
0.79
-1.97
0.58
-0.25
0.23
[8.90, 14.59]
[-0.57, 2.16]
[-2.87, -1.12]
[-0.91, 2.06]
[-1.08, 0.58]
[-0.08, 0.53]
1.45
0.70
0.44
0.76
0.42
0.16
48
198
199
195
196
197
8.09
1.14
-4.48
0.76
-0.59
1.47
< 0.001
0.51
< 0.001
0.90
1.00
0.29
Order Intercept
1 m: Strength
5 m: Strength
Dominance: Sub
Sex: M
Age
-1.99
0.46
0.74
0.36
-0.11
0.03
[-3.70, -0.29]
[-0.44, 1.37]
[0.16, 1.31]
[-0.74, 1.46]
[-0.71, 0.50]
[-0.19, 0.25]
0.87
0.46
0.29
0.56
0.31
0.11
106
200
200
62
64
63
-2.29
1.00
2.52
0.64
-0.34
0.25
0.05
0.64
0.03
1.00
1.00
1.00
22
Comparison of alarm events in the morning and afternoon
When comparing the frequency of alarm events between the morning and afternoon sessions, we found
a median of 2.3 alarm events per hour (range 1-10.5) of foraging during the morning session and 1.5 alarm
events per hour (range 1-15) for the afternoon session. (Estimate [2.5%, 97.5%] = --0.20 [-0.21, -0.18],
SE = 0.008, DF=9726, t value = -24.78, P value < 0.001).
DISCUSSION
We examined the spatial structure of foraging meerkat groups. We calculated networks based on the time
spent within two categories of spatial distance between individuals, 1 m and 5 m. We found no correlation
between specific locations within foraging meerkat groups and individual traits. However, we did find
correlates of local density, with young individuals, between 2 to 6 months, having the strongest
connections within the 1 m network, with low variation between the different sessions. In the 5 m
network, individual strengths varied between sessions and did not depend on the dominance status, sex
or age class of an individual, but individual strength in the 5 m network was correlated to centrality in the
group. In addition, we investigated the assortment between group members and whether it dependent on
individual traits. We found that meerkats associated less frequently with their littermates, within both 1
m and 5 m, but associated more within 1 m with individuals of the same dominance status. Alarm call rate
was reduced in the afternoon compared to the morning, indicating a possible reduction in predation
pressure in the afternoon.
The lack of any correlation between individual traits, such as dominance status, sex, age or litter
affiliation, and within group location suggests that the spatial structure of foraging meerkat groups is
predominantly based on social affiliation or aggression, and only to a lesser degree on differences in
predation risk or foraging success. Social competition in meerkats occurs mainly between individuals of
different dominance status within the same sex, and to a lesser extent between individuals of the same
litter (59, 88, 93). Nevertheless, competition between littermates seems to affect the spatial organisation
of meerkat groups at a larger spatial scale than competition between individuals of different dominance
status. Littermates compete from early on, and ‘loosing’ individuals at pup age avoid the winner directly
after aggressive interactions (91). However, as the age of litters in our study ranged from 0.2 to 6.1 years,
it is unlikely that this effect is solely driven by dependent pups and juveniles (14 individuals < 6 months
of age out of total 76 individuals in all groups combined) spreading out to beg for food from different
adults. Littermates of the same sex seem to pay attention to each other’s condition and adjust their food
uptake accordingly (93). Moreover, the relatedness between littermates is generally higher than between
siblings of different litters or between a natal individual and an immigrant to the group (113). Therefore,
the spatial avoidance during foraging might reduce the competition for resources between highly related
individuals, as the prey of meerkats consists mainly of small invertebrates, which they do not share among
the independently foraging group members. The competition among littermates might also reflect the
‘arms race’ between highly related and similar individuals benefiting from the same conditions from early
on.
The avoidance of dominant individuals seen in meerkats seems to be a common strategy to reduce
the costs of close proximity to very competitive conspecifics and confirms studies in both invertebrates
and vertebrates (17, 85, 86). The dominant female is the most aggressive individual within the group and
highly competitive for food, especially when her dietary requirements increase as during the breeding

23
season (94). Physical aggression is mostly initiated or received at very close proximity to another
individual. It therefore makes sense that individuals avoid very close proximity (within 1 m) to other
individuals of higher dominance status, i.e. the dominant pair, but will associate without preference within
a 5 m range. An alternative explanation for the avoidance of dominant individuals by subordinates in our
study is potential mate guarding behaviour by the dominant male over the dominant female. We collected
our data during the breeding season, when dominant males commonly mate guard (unpublished data
KMP), leading to an increased likelihood of the dominant pair being within very close proximity of each
other. This behaviour also reduces the likelihood of finding other subordinate males within close
proximity of the dominant pair and might be an additional driver of the effect found in our results with
dominant individuals being avoided at very close proximity but not at larger distances.
Although we find no evidence that meerkats have a preference to be near individuals of similar
age, younger meerkats were more strongly connected within 1 m than older individuals, and strength of
these connections was stable over multiple sessions. During the study period, some of the groups had
pups or juveniles foraging with the group. Therefore our result is not surprising as young individuals,
especially pups, stay in very close proximity to their older helpers (90) and are likely the driver for this
effect.
We investigated whether the spatial structure of foraging meerkat groups is in line with the
predictions for moving animal groups under predation risk, namely that animals at the front and edge of
the group are at the highest risk of predation (2, 79, 80). As foraging success is likely to be highest at the
front of the group’s progression (2) we expected older and dominant individuals to be more likely located
there and younger individuals at the safer group centre. In addition, we would expect similar individuals
more likely associating with each other, as they face similar trade-offs. However, we found no such spatial
preferences or associations. Different factors might lead to the lack of spatial assortment by individual
group members. One possibility is, that the level of satiation between group members, changes at different
rates. For instance, at the time of data collection in the afternoon, older more experienced foragers might
be more satiated than younger inexperienced foragers. As a consequence, young individuals might be
more likely located toward the front of the group’s progression having to fear less competition from older
individuals. Another possibility explaining the lack of spatial preferences based on individual traits is that
raised guards might reduce individual risk and allow all individuals to forage at any spatial location, even
when predation pressure might be high, However, during data collection a raised guard was observed
only once for a couple of minutes (CG personal observation) and it is therefore unlikely, that sentinel
vigilance played an important role for the spatial structure of the observed groups. Finally, as meerkats
emitted fewer alarm calls in the afternoon, predation pressure at the time of data collection was likely
low. Thus, meerkats do not necessarily face a trade-off between foraging success and predation risk and
we would expect all individuals having the same probability to be located at the front.
Our results differ from previous findings by Bousquet on the same meerkat population, and a
study by Barnard including in addition a second population. Both studies found adult or more dominant
individuals to be more likely located toward the front of the group and young individuals more likely in
central locations. These differences might be due to differences in predation pressure. The study by
Barnard included data from in total 6 meerkat groups from both the Kalahari Gemsbok National Park and
the Kuruman River Reserve, with the predation risk, especially from terrestrial predators being much
higher at the National Park than at the Reserve (61). However, this was not the case for the study of
Bousquet which included only data collected at the Kuruman River Reserve. All, the current study and

24
the studies by Barnard and Bousquet were conducted during the breeding season and the groups in the
different studies were of similar size. However, while the data by Barnard and Bousquet was collected in
the morning, the data in this study was collected in the afternoon. As we found the rate of alarm calls of
meerkats to be lower during the afternoon sessions compared to the mornings, differences in predation
pressure between the different studies may explain the difference in the spatial structure of foraging
meerkat groups. This suggests that meerkats flexibly adjust their behaviour to the level of predation
pressure, with young and subordinate meerkats staying closer to the centre of the group than older and
more dominant individuals when predation pressure is high. However, a systematic comparison is needed
to confirm this hypothesis.
Most studies focus either on the relative location of individuals within a group to assess
differences in predation risk or foraging success, or on the association between individuals, in order to
draw conclusions on the social structure. Here we tried to disentangle the impact of all these different
aspects on the spatial structure. Our results suggest that the spatial pattern of foraging meerkat groups
was mainly based on social preference and competition, while spatial differences in predation pressure or
foraging success were of minor importance. Nevertheless, it is likely that meerkats flexibly adjust their
location within the group to changes in predation risk. It has been argued that the ‘gambit of the group’
can lead to miss-interpretations of the social structure of animal groups, as animals might be closely
connected socially, while being spatially separate (114). However, our findings on a highly social species
suggest that the spatial and social structure of a cohesive group can overlap and that in some cases the
observed spatial pattern can be used to infer the social structure of these groups.
Ethical note
All data collection adhered to ASAB guidelines. All research was conducted under the permission of the
ethical committee of Pretoria University (EC031-13) and the Northern Cape Conservation Service, South
Africa (Permit number: FAUNA 192/2014).
Author’s Contributions
Gabriella E. C. Gall (GG) and Marta B. Manser (MBM) collected the data with the help of three field
assistants and GG analysed the data. The article was written by both GG and MBM. Both authors gave
final approval for publication.
Acknowledgements
We thank the Kalahari Research Trust for permission to work at the Kuruman River Reserve, and the
neighboring farmers to use their land. We also thank Tim Clutton-Brock, and Dave Gaynor for the
organisation of the field site and their input on the field work, and the managers and volunteers of the
Kalahari Meerkat Project (KMP) for maintaining the habituation and basic data collection on the meerkats.
Furthermore, we thank Bruce Boatman, Denise Camenisch and Pauline Toni for their assistance with focal
recordings, Bart Kranstauber for helpful discussions and Ariana Strandburg-Peshkin and Damien Farine
for comments on the paper. This paper has relied on records of individual identities and/or life histories
maintained by the KMP, which has been supported by the European Research Council (Grant No 294494
to T.H. Clutton-Brock since 1/7/2012), the University of Zurich and the Mammal Research Institute at the
University of Pretoria. We thank the Northern Cape Department of Environment and Nature Conservation

25
for permission to conduct the research. This study was funded by the Swiss National Science Foundation
(Grant No PDFMP3_141768 to MBM).

26
APPENDIX TO CHAPTER 1
(A) Schematics of data collection and analysis
Figure 1: a) Example of a scan estimation on the spatial distribution of the foraging meerkats for two observers. The
dots indicate the meerkats, the white striped and the black dot are meerkats followed by an observer. The dashed
line indicates all the meerkats the striped observer has “scanned”, the solid lines all the meerkats the black observer
has “scanned”. B) Projection of the individual position vector 𝑎 on the group direction vector 𝑔, leading to 𝑎1 (grey
dashed line) the magnitude of the individual vector when projected on the group vector.
Figure 2: Schematic highlighting the different steps used to investigate whether meerkats associate preferentially
with similar individuals based on their dominance status, age class, sex or litter affiliation.

27
(B) Accuracy of the estimation of the locations of meerkats by observers
In order to estimate the accuracy of the distance estimates, we calculated the distance between the gps
location (GPSDist) of each observer and the distance between the estimated locations of the observers and
their gps location (EstDist) (see Figure 3). We log transformed GPSDist and fitted a linear mixed effects
model (LMM) with the log of GPSDist as response variable, the estimated distance and the scan number
as explanatory variables as well as the observer as a random effect.
We found a significant correlation between both the scan number and GPSDist (Estimate [0.25,
0.75] = 0.01[0.00, 0.01], DF = 262, t value = 2.21, P = 0.03) and EstDist and GPSDist (Estimate [0.25,
0.75] = 0.06 [0.05, 0.06], DF = 262, t value = 16.27, P <0.001).
Figure 3: Estimated distances against the calculated distances between GPS points. (a) Zoomed in section of the
whole plot (b). The striped line shows the correlation between the estimation of the distances and the calculated
distances line for all observers put together (r = 0.81) and the yellow line where the estimation would be the same
as the calculated distances (r = 1). All the other colours stand for the different observers, each coloured line shows
the correlation between the estimation of the distances and the calculated distances for each observer (r = 0,69;
0.79; 0.83 and 0.86 respectively). Here we do not account for the error of the GPS tags themselves.
28
Chapter II

29

30
GROUP COHESION IN FORAGING MEERKATS: FOLLOW THE MOVING ‘VOCAL HOT SPOT’
Gabriella E. C. Gall & Marta B. Manser
Published in
Royal Society Open Science 4.4 (2017): 170004.
ABSTRACT
Group coordination when ‘on the move’ or when visibility is low, is a challenge faced by many social living
animals. While some animals manage to maintain cohesion solely through visual contact, the mechanism
of group cohesion through other modes of communication, a necessity when visual contact is reduced, is
not yet understood. Meerkats (Suricata suricatta) a small, social carnivore, forage as a cohesive group
while moving continuously. While foraging, they frequently emit “close calls”, soft close-range contact
calls. Variations in their call rates based on their local environment, coupled with individual movement,
produce a dynamic acoustic landscape with a moving ‘vocal hotspot’ of the highest calling activity. We
investigated whether meerkats follow such a vocal hotspot by playing back close calls of multiple
individuals to foraging meerkats from the front and back edge of the group simultaneously. These two
artificially induced vocal hotspots caused the group to spatially elongate and split into two subgroups. We
conclude that meerkats use the emergent dynamic call pattern of the group to adjust their movement
direction and maintain cohesion. Our study describes a highly flexible mechanism for the maintenance of
group cohesion through vocal communication, for mobile species in habitats with low visibility, and where
movement decisions need to be adjusted continuously to changing environmental conditions.
INTRODUCTION
Members of cohesively foraging groups must stay within close range of their group mates (2, 45) to
achieve the benefits of group living. The mechanisms to reach group cohesion vary between species and
are usually based on simple interaction rules such as attraction, repulsion and alignment between
individuals, often achieved through visual cues, such as described for fish schools (37, 115). However,
different mechanisms are needed in moving animal groups in structured habitats, when the location of
an individual is highly dynamic and visual contact is limited. In these cases, other modalities of
communication between individual group members become important to maintain group cohesion. Many
bird and mammal species use vocalizations to reduce the risk of separation, especially during foraging
(116, 117). ‘Close calls’, soft close-range contact calls, are frequently produced during group movement,
and are thought to function primarily to maintain group cohesion (54, 116–118). When visibility is low,
individuals often change the structure of their calls (119) or their call rate with increasing separation risk
(54, 116). Most research has focused on changes in the vocal behaviour of individuals based on their
relative spatial location to other group members (54, 116, 117, 119), but has not addressed the specific
mechanisms by which contact calls lead to group cohesion. Here we investigated whether foraging
2
31
meerkats (Suricata suricatta) use the distribution of close calls in the group (given by number of
individuals and their call rate at a specific location) and follow in the direction of ‘vocal hotspots’, areas
with many closely aggregated individuals calling at high rates (73), to maintain cohesion during
movement.
Meerkats, cooperatively breeding mammals, live in social groups of up to 50 individuals (61) which forage
cohesively, typically 1 to 10 m next to each other (73). Individuals search for prey in the sand with their
heads orientated downward (61), thus impairing visual communication. They instead rely on an array of
vocal signals to coordinate their activities (71). During foraging, close calls are the most frequently emitted
vocalisation and are thought to maintain group cohesion (71, 73). Meerkats adjust their call rates
depending on their social environment (73, 120, 121) with call rates decreasing with increasing distance
to their closest neighbour, and increasing toward the front of the group, relative to the direction of
movement (73). Thus, a spatial pattern of calls, areas with few individuals calling at low rates and areas
with many individuals calling at high rates (vocal hotspot), emerges with a vocal hotspot typically toward
the centre-front of the group (73). Here we hypothesise that meerkats use the vocal hotspot to determine
where most group members are located relative to their own spatial location, thus guiding each
individual’s future movement toward them. To test this hypothesis, we manipulated the distribution of
close calls in the group. We played back calls of multiple individuals from two sides, the front and the back
edge of the group (Figure 1), creating two artificial vocal hotspots, and moved them into opposite
directions. If meerkats are guided by the distribution of close calls in the group in their future movement
direction, we would expect individuals to follow the closest artificially induced vocal hotspot. Thus we
predict the group to elongate and/or split into two subgroups, as individuals at the front and back end of
the group perceive two different vocal hot spots.
METHODS
The study was conducted at the Kalahari Meerkat Project, Kuruman River Reserve, in the Northern Cape
of South Africa. Data were collected from January to March 2015 on eight groups, ranging from 9 to 22
individuals (mean ± SD = 16 ± 4) during the morning foraging session. During the period of data
collection, daily temperatures ranged from 10 to 42 °C and daily rainfall from 0.0 to 30.0 𝑚𝑚
𝑚2 (with a
median daily rainfall of 3.1 𝑚𝑚
𝑚2 on a total of 16 days during the 3 month of data collection). A more detailed
description of the climate and habitat are provided by Clutton-Brock et al 1998 (59). In contrast to winter
when meerkats mostly forage continuously for the whole day, in summer meerkats forage for a couple of
hours, starting just after dawn and in the evening before sunset, and rest during the hottest part of the
day. All animals were visually identifiable through dye mark combinations (67) and were habituated to
close human observation within less than 1 m.
Recordings and playbacks of close calls
To test whether meerkats follow areas with a high number of close calls, we performed a playback
experiment, inducing two artificial vocal hotspots, areas with the highest calling rate. Calls, used in the
playback sound files were recorded using a directional microphone (Sennheiser ME66 with K6 powering
module) connected to a recorder (Marantz PMD660, sampling frequency 44.1 kHz, 16bit) at a distance of
0.3 - 1.5 m to the individual. Playback sound files were created for each group in Cool Edit Pro 2.0

32
(Syntrillium Software Corporation) by selecting high quality calls from the recordings of the same group,
where the playbacks were performed.
We created two 20 min playback tracks for each group with close calls of four adult subordinate
group members. The call rate of each individual on the track reflected its ‘natural’ call rate, observed
during previous foraging sessions and was the same for both playback tracks. However, to avoid playing
exactly the same sound files back simultaneously from both loud speakers, we randomized the order of
calls of recorded individuals within each track, by assigning two random numbers to each call, one for the
time within the playback and one for the call itself. We played these close call sound files as test condition
to eight meerkat groups from the front and back edges of the group simultaneously. As a control, we
played background noise, recorded in the group’s home range when no meerkats were present, with the
same setup. We played both conditions to a group during the same morning session (starting 30 minutes
after the onset of foraging to midday), to avoid confounding time effects due to possible changes in habitat
and climate between sessions. The sound files were played from a Marantz recorder connected to a
speaker (X-Mini Uno XAM14) attached to the leg of the observers at about 15 cm above ground. The order
in which we played the close calls (test condition) and the background noise (control condition) was
counter balanced, with at least 15 min between conditions.
Figure 1: Diagram of the experimental setup: The length (blue dashed line) and width (green line) of a group (grey
points) in the direction of movement (black arrow) as estimated in our data. The black squares indicate the location
of the speakers in relation to the group during each playback.
During the playback, observers with the speakers stood at the edge of the group, maintaining a
constant distance of three meters to the closest meerkat. Hence, when meerkats moved toward the
speaker, the speaker was slowly moved away from the group to maintain a constant distance. Throughout
the playback, the observers recorded the behaviour of the group on a video camera (Sony Handycam
3.3MPXL). Every two minutes (time steps) we estimated the spatial width of the group as the distance
between the furthest two animals at an angle of 90° to the direction of group movement. We also
estimated the length of a group as the distance between the first and the last meerkat in the direction of
group movement (Figure 1). We further recorded the occurrence of subgroups, i.e. sub-clusters of at least
three animals, as well as the distance (gap size) between the edges of these subgroups. To account for
variation in overall group dispersion, we normalized the gap size by subtracting the average distance
between neighbouring meerkats.
33
Statistical Analysis
Statistical tests were carried out using R (version 3.3.1.) (96). In order to investigate whether groups split
more likely when playing back close calls, compared to background noise, we fitted three linear mixed
effects models (LMMs) (106) with the gap size, the length and the width of the group as responses, and
the interaction between the playback condition and the time steps within each playback as explanatory
variables. The time steps refer to the 2 min intervals at which we documented the length and width of the
group and the gap size between subgroups. The intercept of the model represents the predicted values for
the control playback of background noise at time step zero. The coefficients of the model (‘Estimate’ in
Table 1) gives the difference in the mean of the levels of a categorical explanatory variable and the slope
for continuous variables. It also indicates the direction of the effect of a factor (positive or negative) on the
response variable. Gap size was log transformed before fitting the model to ensure the normal distribution
of the data. We included the identity of the group as a random factor and accounted for multiple testing
using a Bonferroni correction.
RESULTS
When artificially inducing two vocal hot spots by playbacks of close calls at the front and back edge in
meerkat groups, individuals followed the nearby speaker, i.e. the closest location with the highest calling
rate. Thus, the groups spatially elongated in the direction of the speakers, and the gap between subgroups
became significantly larger when playing back close calls compared to background noise from the two
opposite sides of the group (Table 1, Figure 2a, 2b).
However, subgroups reunited toward the end of the playback (Figure 2a 2b). Groups did not widen based
on playback condition (Table 1, Figure 2c). The time steps within each playback caused an elongation of
groups, but it did not influence the gap size, nor the width of the group. We found no interaction between
the time step within each playback and the playback condition (Table 1, Figure 2).
DISCUSSION
Our experiment reveals that meerkats use close calls, constantly emitted by their group members
while foraging, to make decisions about their own movement direction. Creating two artificial vocal
hotspots of highest call rates by playing back close calls of several individuals at opposite sides of the group
resulted in an increase in group elongation and a higher probability of splitting into two subgroups. This
effect decreased after some time into the playback, likely due to individual meerkats of most groups
realized that they were getting separated and started to produce alert calls, causing the two subgroups to
reunite (pers. obs. GG).
Two different mechanisms might lead to groups splitting: individuals might orientate and follow
toward the closest speaker, as the closest vocal hotspot, or individuals at the back of the group might move
more slowly due to hearing many calls around them, but follow a general movement direction given by
individuals in the front or being determined as commonly used foraging route. Given that not only the
observer at the front of the group, but both observers slowly moved apart from each other and away from
the closest meerkats, the first option is more likely. Meerkats followed the speakers carried by the
observers, who decided on the movement direction (pers. obs. GG). Whether the movement direction of
animals at the front of the group might have coincided with the direction chosen by the group is impossible
to tell. However, the individuals in the back turned around to follow the speaker in the opposite direction.

34
Thus, if we had played the calls from both sides instead of the front and back of a group, we would expect
the same results. Following a moving vocal hot spot allows each individual to constantly direct towards
the part of the moving group where likely several members aggregate, and ensures group cohesion even
if visual contact is restricted due to vegetation and topographical barriers, and no general foraging
direction or route governs a group’s movement.
Table 1: Results of the LMMs testing how the length, width and the formation of subgroups was affected by the
playback of close calls and the playback of background noise. Significant effects are highlighted in bold. Due to the
Bonferroni correction for multiple testing, the α level was reduced from 0.05 to 0.017 to account for multiple testing.
The time steps are the 2 min intervals within the playback at which the length, width and gap size were estimated.
The intercept of the model represents the predicted values for the control playback of background noise at time step
0. The coefficients of the model (‘Estimate’) gives the difference in the mean of the levels of a categorical explanatory
variable and the slope for continuous variables. It also indicates the direction of the effect of a factor (positive or
negative) on the response variable.
Response
variable
Explanatory variables
Estimate
Confidence Intervals
[0.025, 0.975]
SE
DF
t value
p value
Length Intercept 16.84 [12.60, 21.09] 2.17 13 7.77 <0.001
(in m) Playback ‘cc’ 7.84 [4.43, 11.25] 1.74 162 4.51 <0.001
Time step 0.33 [0.12, 0.54] 0.11 162 3.09 0.002
Playback ‘cc’ : Time step -0.26 [-0.56, 0.03] 0.15 162 -1.76 0.080
Gap size Intercept 0.39 [-0.17, 0.94] 0.28 33 1.36 0.183
(in m) Playback ‘cc’ 0.90 [0.27, 1.53] 0.32 162 2.78 0.006
Time step 0.00 [-0.04, 0.04] 0.02 162 -0.13 0.898
Playback ‘cc’ : Time step 0.01 [-0.05, 0.06] 0.03 162 0.28 0.778
Width Intercept 23.58 [ 19.07, 28.10] 2.30 23 10.24 <0.001
(in m) Playback ‘cc’ -1.58 [-6.27, 3.12] 2.40 162 -0.66 0.511
Time step -0.05 [-0.33, 0.24] 0.15 162 -0.31 0.755
Playback ‘cc’ : Time step 0.15 [-0.26, 0.55] 0.21 162 0.71 0.479
Group coordination has mainly been studied in the context of movement initiation, however, how
social animals coordinate movement while moving with restricted visual contact has been more
challenging to investigate. Meerkats adjust their close call rate based on their own relative spatial location
within the group as well as their social environment, calling less with increasing distance to the closest
neighbour, and at higher rates toward the front of the group as well as when in close proximity to
dominant individuals (73, 120). By following the emergent vocal hotspot, meerkats thus adjust their
movement direction presumably to avoid losing contact with their group. Our results support the findings
for wild sooty mangabeys (Cerocebus atys) (122) that an individual’s movement is influenced by its social
environment and the call rates of other group members. Sooty mangabeys change their movement speed
and potentially their direction depending on the call rate of their own subgroup and call rates of other
primate species frequently associating with them. Nevertheless, it is unclear how individual mangabeys
adjust their own call rate to their surroundings and contribute to the movement of others through their
own vocal behaviour.

35
Figure 2: The mean (points) and standard deviation (whiskers) of a group’s length (a), the gap size between
subgroups (b), and its width (c) during the playback of background noise (grey) and the playback of close calls
(black), measured in two minute intervals throughout the experiment.
Based on prior knowledge and the results of this experimental study we can integrate our
understanding on both the production (73) and the receiver side of a moving vocal hotspot, defined as the
location of the highest call rate within a group, and suggest it as a highly flexible coordination mechanism
enabling to adjust to fast changing movement decisions. This mechanism shows similarities to cliff
swallow “squeak calls” used to attract conspecifics to moving insect swarms (123). In a more general
context the locations with highest densities of vocal signals function similar to ant pheromone trails to
recruit and direct other group members to a specific location, though in the case of ants with stationary
destinations (124). This suggests that signal hotspots, consisting of vocalisations or signals of other
modalities, provide a robust and flexible way for individuals to track the core of the group and maintain
cohesion during foraging. Previous studies show that close call rate increases toward the front of the
groups progression (73), suggesting that individuals located at the front might actively increase their call
rate. Furthermore, meerkats are able to distinguish between close calls of different individuals (121) and
might therefore take the identity of the callers into account when following a signal hotspot. Whether
these potentially more informed individuals can ‘lead’ the group [19, 20] by affecting the location of the

36
signal hotspot with an increase of their own call rate, thereby influencing the movement of others, is yet
to be explored.
Ethical note
All data collection adhered to ASAB guidelines. All research was conducted under the permission of the
ethical committee of Pretoria University (Permit number: EC011-10) and the Northern Cape Conservation
Service, (FAUNA 1020/2016), South Africa.
Data accessibility
Data is available via Dryad: doi:10.5061/dryad.qb562
Author contributions
GG and MM designed the experiment and data collection; GG carried out the experiment, collected and
analysed the data. The article was written by both GG and MM and both gave final approval for
publication.
Funding
This study was funded by the Swiss National Science Foundation (Grant No PDFMP3_141768 to MM).
This paper has relied on records of individual identities and/or life histories maintained by the Kalahari
Meerkat Project (KMP), which has been supported by the European Research Council (Grant No 294494
to T.H. Clutton-Brock since 1/7/2012), the University of Zurich and the Mammal Research Institute at the
University of Pretoria.
Acknowledgements
We thank the Kalahari Research Trust for permission to work at the Kuruman River Reserve, and the
neighbouring farmers to use their land. We also thank Tim Clutton-Brock and Dave Gaynor for the
organisation of the field site and their input on the field work, and the managers and volunteers of the
KMP for maintaining the habituation and basic data collection on the meerkats. Many thanks to Bruce
Boatman for his assistance with the playback experiments and Ariana Strandburg-Peshkin for comments
on the Manuscript.

37

38
Chapter III

39

40
THE EFFECT OF CHALLENGING ENVIRONMENTAL CONDITIONS ON GROUP COHESION IN
MEERKATS (SURICATA SURICATTA)
Pauline Toni*, Gabriella E. C. Gall* & Marta B. Manser
*shared first author
To be submitted
ABSTRACT
The need for group living animals to coordinate their activities in order to benefit from group living,
increases in environmentally challenging conditions, such as during a drought. Here, we study how
meerkat (Suricata suricatta) group coordination is affected by drought and how individuals adjust their
calling behaviour to drastic changes in their environment. During the drought, individual body condition
and foraging success was reduced. In addition, movement speed increased, possibly as a response to
scarcely distributed food. While we expected group dispersion to increase during the drought, meerkats
seemed to avoid each other only at close proximity. We investigated whether individual meerkats changed
their close calling behaviour in response to the drought and found a significant increase in close call rate
during the drought. However, while call rate depended on an individual’s distance to its nearest neighbour
during non-drought periods, meerkats called at high rates independent of the distance to their nearest
neighbour during the drought. Finally, our results show a significant increase in the number of group
splits during the drought compared to the non-drought. We suggest that, as each individual increases its
call rate, the call pattern meerkats typically use for movement coordination is not maintained and the
cohesion mechanism of meerkats is disrupted, resulting in an increase in temporary group splits. This
indicates a breakdown in the cooperation between group members, and suggests that cooperative species
might be more fragile when conditions turn extreme
INTRODUCTION
In order to maintain cohesion and to preserve the benefits of group living, individuals in mobile animal
groups need to coordinate their activities (2, 45). Spacing between group members during foraging in
highly cohesive species, typically depends on the availability and distribution of food (2, 125, 126),
predation pressure (126) and the transmission range of signals (50). Various group living animals
maintain group cohesion through visual contact (115, 127), while others, primarily animals in
environments with low visibility or with individual group members dispersing over greater distances, use
different modalities to remain in contact, such as olfactory (124) or acoustic communication (54, 116, 117).
Detailed coordination mechanisms based on the latter have been described for some mammal species,
such as sootey mangabeys (Cerocebus atys) and meerkats (Suricata suricatta) where an individual’s
movement is influenced by its immediate social environment and the call rate of other group members
(73, 120, 122, 128, 129).
These coordination mechanisms which depend on the behaviour of each member, can be very
fragile with respect to changes in the environment. For instance, water shortages associated with
3

41
droughts, lead to a reduction in plant primary productivity and thereby to a reduction in available food
resources (plants or prey) for most animal species (130–132). As resources become more scarcely
distributed, group members need to spread out over a larger area (133, 134), impeding optimal signal
transmission (50). Thus, the relative number of individuals within receiving range of a signal decreases
with increasing inter-individual distances between group members (50), leading to an increased risk of
temporary group fission (2, 135, 136). Furthermore, scarcely distributed resources can lead to a higher
travel speed of each group member and the group as a whole (137), and as individuals move faster out of
each other’s contact range, the risk of group fission increases even more. Nevertheless, group living
animals exposed to extreme conditions may adjust their behaviour in order to facilitate cohesion and
ultimately survival (130). For instance individuals maintaining vocal contact might increase their call rate
with increasing risk of separation from their conspecifics (54, 116, 138). Using meerkats as our model
system, we investigate for the first time, whether and how individual group members responded to an
increased risk of separation caused by a severe drought, representing extreme ecological conditions
extending the usual seasonal variation.
Meerkats are obligate group living, cooperative breeders inhabiting the southern part of Africa.
Their groups, ranging from 3 to 50 and averaging 15 individuals, have a despotic hierarchy with a
dominant pair reproducing and subordinate individuals helping to rear offspring (59). Meerkats forage as
a cohesive unit and their foraging behaviour is characterised by constant movement mostly with the head
directed downwards, in search for mainly invertebrate prey in the sand (139). As invertebrate abundance
is greatly dependent on precipitation (139), meerkats are highly susceptible to food shortages during
longer lasting droughts. During foraging, soft, short range contact calls, termed close calls are the most
frequently emitted vocalization, functioning to maintain cohesion (73, 129). Each individual changes its
close call rate according to its location within the group, its distance to and the identity of its nearest
neighbour (73, 120, 128). Through these changes in each individual’s call rate, a call pattern emerges that
is marked by vocal hotspots, areas with a high call rate and a higher density of individuals (129). By tracing
the call pattern and moving to where most calls are heard from, meerkats are able to stay within close
contact to their group members while in constant movement (129). However, when pups are present,
meerkats reduce their close call rate (140), potentially to avoid the attention from begging pups, or
information redundancy, by being able to use the louder pup vocalizations to maintain cohesion towards
the centre of the foraging group [ref].
With meerkats relying on vocal exchanges to sustain cohesion and with the drought likely
affecting the spatial distribution of a group (133, 134), we expect drought to have a negative effect on
group coordination. To verify our predictions that (i) individuals are in worse body condition and whose
foraging success is lower during the drought, we used long term data collected by the Kalahari Meerkat
Project and investigated changes in each individuals’ morning weight and its daily weight gain. To
investigate our hypothesis that (ii) the travel speed of groups increases during the drought we used GPS
data collected by the Meerkat Project. We predicted (iii) an increase in nearest neighbour distances as a
direct response to more scarcely distributed prey during drought conditions as well as (iv) an increase in
individual call rate in order to minimise separation risk. We used focal recordings collected during the
non-drought and the drought period to investigate how much time individuals spent within different
distance categories to their nearest neighbour during the different periods, in addition to investigating the
effects of drought on an individual’s close call rate. As meerkats reduce their call rate substantially when
pups are present, we also tested for a difference in effect of the presence of pups during the drought
42
compared to the non-drought. Finally, we predicted (v) a higher frequency of group splits during the
drought compared to a non-drought year as result of individuals struggling to maintain cohesion and
tested this again using long term data.
METHODS
The data for this study were collected at the Kalahari Meerkat Project, Kuruman River Reserve, in the
Northern Cape Province, inSouth Africa. Descriptions of the climate and habitat are provided by Clutton-
Brock et al. 1998 (59). Data were collected between October 2014 - January 2015 (non-drought) and
October 2015 - January 2016 (drought). In the non-drought year daily rainfall ranged from 0.0 to 9.2 𝑚𝑚
𝑚2 ,
while in the drought year daily rainfall ranged from 0.0 to 3.2 𝑚𝑚
𝑚2 and the long term average over 14 years
ranges from 0.0 to 18.53 𝑚𝑚
𝑚2 . All animals in the population were habituated to close human observation
up to 1 m and could be identified through individual dye mark combinations (67).
Weights data: calculation of body condition and foraging success
As part of the general protocol of the Kalahari Meerkat Project, each meerkat is weighed by climbing onto
electronic balances where it is rewarded with a small amount of boiled egg or water. Meerkats are weighed
at each visit to a group, in the morning before the group starts foraging, again after about three hours of
foraging, and in the evening before meerkats go below into their sleeping burrow (63). For our analysis,
we only included adult subordinate individuals (a total of 135 adult subordinate meerkats, 53 during the
non-drought and 97 during the drought) and used the morning weights as a measure of body condition.
Furthermore, we estimated an individual’s daily foraging success by calculating its daily weight gain. For
this we calculated the difference between an individual’s evening weight and its morning weight and
standardizing it by the time between the morning weight and the evening weight for each individual.
Positive values indicate an individual having gained weight, while at values below zero an individual lost
weight.
Travel speed of a foraging group
Observers following a meerkat group take a GPS (global positioning system) fix from the centre of a group
every 15 min (accuracy: 95% of fixes within 5 m; eTrex 10, Garmin International Inc., Olathe, KS, USA).
GPS fixes are taken in the morning when the group starts foraging until the end of the observation session
(about 3 h after the start of foraging), and in the evening from the start of the session until the group
reaches its sleeping burrow (about 1.5h after the start of the session). From data of a total of 19 different
meerkat groups, 18 groups during the non-drought and 15 groups during the drought, we calculated the
distance a group travelled between two consecutive GPS fixes and the average speed of a group for every
day the group had been visited during the non-drought and drought period.
Focal recordings
In order to investigate whether the cohesion mechanism of meerkats is affected by extreme drought, we
collected vocal and spatial information on a total of 71 meerkats of 12 groups, ranging from 6 to 23
individuals (mean ± SD = 15.2 ± 5.5), including between 1 and 7 pups (mean ± SD = 3.39 ± 1.69), per
group during the non-drought and on 63 meerkats of 11 groups ranging from 3 to 21 individuals (mean
± SD = 13.8 ± 4.4), including between 1 and 7 pups (mean ± SD = 3.25 ± 1.42), per group during the

43
drought. In total, we conducted 154 focal recordings during the non-drought and 148 recordings during
the drought. Vocalizations of the focal were recorded using a directional microphone (Sennheiser ME66
with K6 powering module) at a distance of 0.3-1.5 m to the individual, while simultaneously documenting
the nearest neighbour identity and nearest neighbour distances (Marantz PMD661 professional, sampling
frequency 48 kHz, 16 bit). The length of each recording was determined by the number of close calls
emitted by the focal within the first 5 min of the recording: if less than 10 close calls were emitted, the
recording was extended until 10 calls were recorded or after at maximum 10 min recording time. The
sound files were analysed using Cool Edit Pro 2.0 (Syntrillium Software Corporation) and the data was
processed further in R (version 3.3.1.) (96). We divided the nearest neighbour distances into the following
categories: “0-2 m”, “2-5 m”, “5-10 m” and “>10 m”. Furthermore, we calculated the overall number of
close calls emitted by the focal during each recording as well as the close call rate per minute, and the call
rate per minute of the focal for each nearest neighbour distance category. Finally, we calculated the
proportion of time each focal spent within each specific distance categories.
Frequency of group splits
To investigate the frequency of group splits during the drought compared to the non-drought year, we
used data collected by the Kalahari Meerkat Project on a total of 19 different meerkat groups, 17 groups
during the non-drought and 16 groups during the drought. Each meerkat group at the project is visited
three to four days each week in the morning and/or, the evening. During each group visit, observers
record if a group split has occurred, with group splits being defined as a group temporarily splitting into
two or more mixed sex subgroups being further than 100 m apart from each other for at least 15 min,
with sub-groups showing distinct behavioural changes. Such changes can, for example, be characterised
by animals emitting lost calls or ‘war dancing’ toward other subgroups (unpublished data KMP). For our
analysis, we only included the visits to the group during the four non-drought month and the four drought
months, specified above.
Statistical analysis
Statistical tests were carried out using R (version 3.3.1.). We tested whether meerkats where in worse
body condition during the drought than during the non-drought by fitting a linear mixed effects model
(LMM) (106) with an individual’s morning weight as response variable, period as explanatory variable
and the individual per season nested in group as random effect. We included individual per period, as
most individuals while present multiple times in our data set, are mostly only present during one period,
either the drought or the non-drought.
We did a stepwise model reduction, where the full model was compared to all lower level models.
The models were ranked based on their corrected Akaike information criterion (AICc) and we used the
model with the lowest value as the model with the best fit. If the difference between models was within 2
delta AICc, we chose the one with the lower number of degrees of freedom as the best model. We used a
log likelihood ratio test to assess the significance of each of the fixed effects in the final model. The same
process was also used for each of the following analysis which used linear or generalized linear mixed
effects models. To investigate whether the foraging success of meerkats was lower in the drought, we
fitted a second LMM with the standardized daily weight gain as response variable and period as
explanatory variable and individual nested within group as response variable. In order to test whether
meerkat groups moved faster during the drought than the non-dought, we square root transformed the

44
daily mean speed of a group and fitted a LMM with period as explanatory variable and group identity as
random term. We examined whether meerkats spent a higher proportion of time further away from their
nearest neighbour during the drought compared to the non-drought, using a Dirichlet regression (141).
We used a matrix of the different time proportions within each distance category as a response, and period
as explanatory variable. In order to investigate whether the call rate changed depending on the period,
the distance to the nearest neighbour or the presence of pups, we fitted a LMM. We used the number of
close calls emitted by a focal when in a specific distance category from its nearest neighbour as the
response variable and added an offset of the logarithm of the total recording time. As explanatory
variables, we included the interaction between the period and the distance category. We controlled for the
group identity, the recording date, and the identity of a focal in the random term, as most of the individuals
were recorded multiple times and most group members were recorded on the same date. In order to
correct for over dispersion, we fitted an observation-level random term (142). To analyse the propensity
for groups to split into subgroups in the drought compared to the non-drought as well as whether the
drought influences the group size at which groups split. For this we used a generalised linear mixed effects
model (GLMM) with a binomial link function, with the presence or absence of a split as the response
variable and the interaction between group size and season as explanatory variables and group identity
as random term.
RESULTS
Drought affected the foraging behaviour and the cohesion of the groups substantially in
comparison to non-drought conditions. As expected, both the morning weight, taken as index of body
condition (Log likelihood ratio test: χ2 = 121.39, P value < 0.001, Figure 1a), and the foraging success (Log
likelihood ratio test: χ2 = 91.34, P value < 0.001; Figure 1b) of meerkats was significantly lower during
the drought than during the non-drought. In the drought period, foraging meerkat groups also travelled
significantly faster than the non-drought period (Log likelihood ratio test: (square root transformed
speed) χ2 = 24.19, P value <0.001, Figure 1c). Opposed to our predictions individuals did not spend more
time very far from their nearest neighbour during the drought. Meerkats decreased the proportion of time
they spent within 0-2 m to their nearest neighbour, and significantly increased in the proportion of time
they spent within 2-5 m to their nearest neighbour. However, there was no significant difference in the
proportion of time individuals spent within 5-10 m and further than 10m from their nearest neighbour
(Table 1, Figure 2). In line with our predictions meerkats increased their close calls rate during the drought
in comparison to the non-drought period. We found a significant interaction between the season and the
distance to the nearest neighbour (Log likelihood ratio test: χ2 = 374.7, P value <0.001; Table 2), with
meerkats emitting more close calls during the drought than the non-drought and emitting less calls with
increasing distance to the nearest neighbour during the non-drought but not during the drought (Figure
3). In the best model the presence of pups had no significant effect on close call rate (Log likelihood ratio
test: χ2 = 2.44, P value = 0.30; Table 2) and we found no significant effect of the interaction between the
presence of pups and the study period (Log likelihood ratio test: χ2 = 0.05, P value = 0.83; Table 2).

45
Figure 1: (a) Mean morning weight; (b) mean weight gain of individuals (53 during the non-drought, 97 during the
drought); (c) mean speed of meerkat groups (18 during the non-drought, 15 during the drought) during the non-
drought and the drought. Points show means and error bars the standard deviation.
Figure 2: Percentage of time individuals (71 during the non-drought, 63 during the drought) spent in each nearest
neighbour distance category during the non-drought (black circle) and the drought (white triangle). Mean indicated
by point and standard deviation by error bars.

46
Table 1: Results of the Dirichlet model, comparing the proportion of time an individual spent within a specific
distance category to its nearest neighbour between the drought vs. non-drought.
Distance
category
Explanatory
variable
Estimate Confidence interval
[2.5%, 97.5%]
Std. error z value p value
0-2 m Intercept 0.10 [-0.08, 0.29] 0.09 1.13 0.26
Drought -0.26 [-0.51, -0.00] 0.13 -1.98 0.047
2-5 m Intercept -0.69 [-0.86, -0.52] 0.09 -8.16 <0.001
Drought 0.26 [0.02, 0.50] 0.12 2.15 0.032
5-10 m Intercept -1.60 [-1.76, -1.44] 0.08 -19.65 <0.001
Drought 0.19 [-0.04, 0.41] 0.12 1.59 0.112
> 10 m Intercept -1.79 [-1.95, -1.63] 0.08 -22.01 <0.001
Drought 0.03 [-0.20, 0.26] 0.12 0.25 0.802
Figure 3: Close call rates of 107 adult meerkats, 71 during the non-drought and 63 during the drought (a) Mean
(point) and standard deviation (error bars) of the close call rate per minutes against the distance to the nearest
neighbour distance in meters during the non-drought (black circle) and the drought (white triangle); (b) Interaction
plot showing the effects of period (non-drought vs. drought) and nearest neighbour distance category (‘0-2 m’, ‘2-5
m’, ‘5-10 m’, ‘>10 m’) on the close call rate of an individual.
b)

47
Table 2: Model summary statistics comparing close call rate between drought vs. non-drought (Period), the distance to the nearest neighbour (Dist (m)) and the presence of pups
(Pups). The close call rate was used as response variable in a LMM. Models within 2 AICc units of the best model are highlighted in bold and were used to calculate averaged effect sizes
(*standardised on two standard deviations following Gelman (2008)[54]). Abbreviations: df: degrees of freedom; w: relative model weights.
Intercept Dist (m) Period Pups Dist (m): Period Pups: Period df LogLik AICc ΔAICc w
Model 1 2.67 + + + + 12 -7874.06 15772.4 0.00 0.43 Model 2 2.51 + + + 11 -7875.20 15772.6 0.24 0.38
Model 3 2.60 + + + + + 13 -7873.88 15774.1 1.69 0.19
Model 4 -3.50 + + + + 12 -7966.11 15956.5 184.11 0.00
… Averaged parameters 2-5 5-10 >10 2-5 5-10 >10
Estimate* 2.59 -0.74 -2.18 -4.85 0.55 -0.27 0.45 0.89 2.08 -0.26
Unconditional SE 0.20 0.03 0.06 0.21 0.22 0.24 0.04 0.07 0.22 0.43
Upper 95%CI 2.99 -0.68 -2.07 -4.44 0.98 0.28 0.55 1.02 2.52 0.36
Lower 95%CI 2.19 -0.81 -2.30 -5.27 0.12 -0.62 0.40 0.76 1.64 -0.46 Relative importance 1.00 1.00 1.00 0.62 0.19
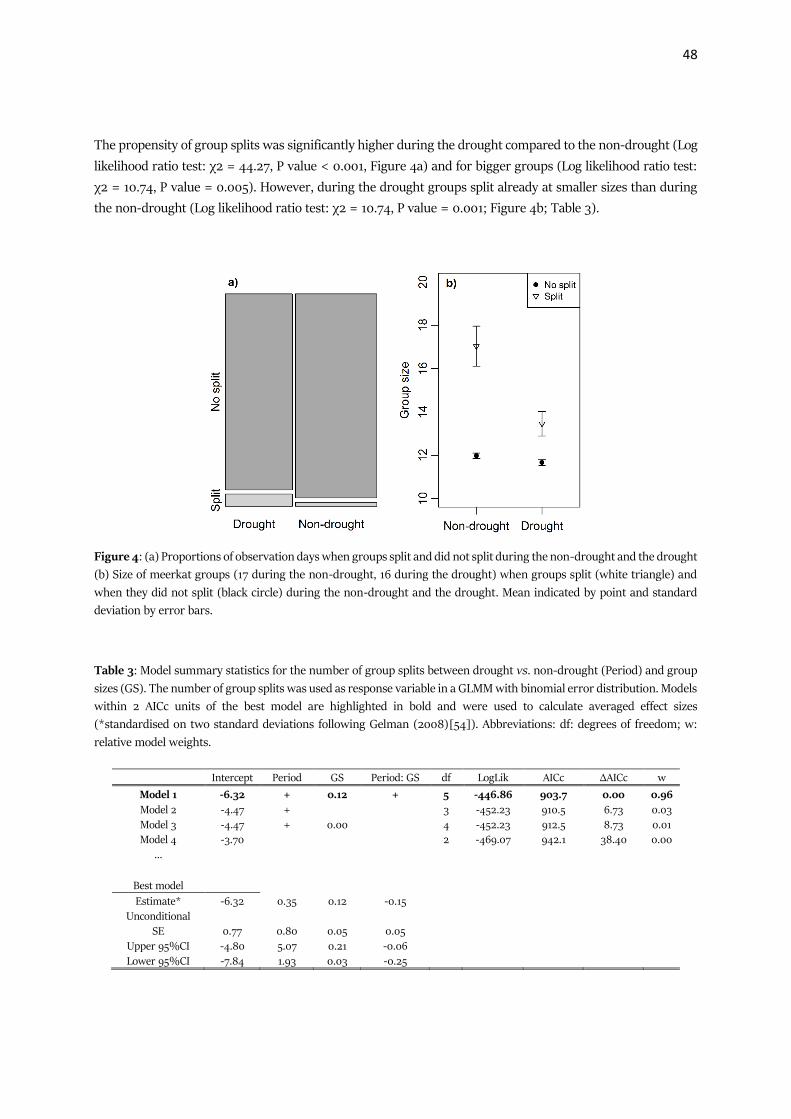
48
The propensity of group splits was significantly higher during the drought compared to the non-drought (Log
likelihood ratio test: χ2 = 44.27, P value < 0.001, Figure 4a) and for bigger groups (Log likelihood ratio test:
χ2 = 10.74, P value = 0.005). However, during the drought groups split already at smaller sizes than during
the non-drought (Log likelihood ratio test: χ2 = 10.74, P value = 0.001; Figure 4b; Table 3).
Figure 4: (a) Proportions of observation days when groups split and did not split during the non-drought and the drought
(b) Size of meerkat groups (17 during the non-drought, 16 during the drought) when groups split (white triangle) and
when they did not split (black circle) during the non-drought and the drought. Mean indicated by point and standard
deviation by error bars.
Table 3: Model summary statistics for the number of group splits between drought vs. non-drought (Period) and group
sizes (GS). The number of group splits was used as response variable in a GLMM with binomial error distribution. Models
within 2 AICc units of the best model are highlighted in bold and were used to calculate averaged effect sizes
(*standardised on two standard deviations following Gelman (2008)[54]). Abbreviations: df: degrees of freedom; w:
relative model weights.
Intercept Period GS Period: GS df LogLik AICc ΔAICc w
Model 1 -6.32 + 0.12 + 5 -446.86 903.7 0.00 0.96
Model 2 -4.47 + 3 -452.23 910.5 6.73 0.03
Model 3 -4.47 + 0.00 4 -452.23 912.5 8.73 0.01 Model 4 -3.70 2 -469.07 942.1 38.40 0.00
…
Best model
Estimate* -6.32 0.35 0.12 -0.15
Unconditional SE 0.77 0.80 0.05 0.05
Upper 95%CI -4.80 5.07 0.21 -0.06
Lower 95%CI -7.84 1.93 0.03 -0.25

49
DISCUSSION
Our study indicates that the mechanism of meerkats to maintain cohesion deteriorates under extreme
environmental conditions such as a long-lasting drought. As body condition and foraging success declined and
group travel speed increased during the drought compared to the non-drought period, our results give strong
support for the substantial impact of the drought on individual meerkats as well as meerkat groups. Meerkats
spent less time within very close proximity and more time further away from their nearest neighbour during
the drought. In addition, close call rate, which was not affected by the presence of pups, increased during the
drought, when meerkat groups were significantly more likely to split. While call rates during the non-drought
decreased with increasing distance to the nearest neighbour as described previously in the literature (73), call
rates were similarly high for all nearest neighbour distance categories during the drought.
In contrast to our predictions, nearest neighbour distances did not increase significantly during the
drought. Although individuals spent less time within 0-2 m and more time within 2-5 m to their nearest
neighbour during the drought, we found no significant effect on the time an individual spent at the higher
distance categories (5-10 m and >10 m) to the nearest neighbour. Even though maintained close proximity to
their nearest neighbours, it is possible that group dispersion did increase during the drought. The reduced
time spent at very close proximity to group members is likely due to meerkats trying to avoid foraging
competition from their conspecifics and searching for more scattered and scarce food items.
The best fitting model did not include the presence of pups. This is very likely the case because pups
were present during all of the non-drought period and the first part of the drought period. While no pups
were born or survived in the second part of the drought period, the number of recordings during this time is
comparably small. Therefore, it is likely that while pups have an effect on close call rate the sample size with
no pups, present was to small in order to detect the difference. This is supported by the relative importance
of the presence of pups calculated for the averaged models is high, even though the factor was excluded from
the best model.
The cohesion mechanism of meerkats based on close calls was highly affected by the extreme drought.
As predicted meerkats increased their close call rate during the drought compared to the non-drought. The
presence of pups did not significantly affect close call rate, likely due to similar numbers of pups being present
during both the non-drought and the drought period. However, while the changes in call rate of an individual
in the non-drought was in line with earlier findings described in literature (73), namely that call rate decrease
with increasing distance to the nearest neighbour, an individual’s call rate during the drought did not follow
this pattern. The mechanism of meerkats to maintain cohesion functions by meerkats calling differently based
on their nearest neighbour distances and by individuals following the direction where most calls are heard
from (129). During the drought when travel speed increases, the number of individuals within contact range
might decrease. Therefore, an individual might increase its call rate to keep its neighbours within close
proximity without having to move toward the rest of the group, thereby losing possible foraging time. In
addition, with each individual being in bad condition and foraging success being low, the motivation for
individuals to lead might increase (143), resulting in an increase in call rate independent from the distance to
the nearest neighbour. Consequently, when multiple or all group members increase their call rate, multiple
vocal hotspots emerge. While cohesion with the nearest neighbours might be maintained, small subgroups
will emerge, the global cohesion mechanism of the group as a whole starts breaking down and the group will
begin to split. This is in line with our finding that groups were indeed significantly more likely to split during
the drought than the non-drought. During the drought, groups split also at smaller sizes, which can probably
be explained by the average group size being smaller during the drought as groups bred less successfully
(unpublished data).

50
It is important to notice that changes in close call rate do not have to be the cause for the increase in
temporary group splits during the drought. For instance, meerkats might manage to maintain a higher degree
of cohesion by calling more. Accordingly, we might have recorded a lower number of group splits than
possible, because meerkats called at higher rates. However, this explanation is not very likely, as individuals
did not only increase their call rate but did also call independently of the distance to their nearest neighbour.
As a result, meerkats would be more likely to move to areas with few group members calling at high rates,
rather than to the area with many individuals calling at high rates and this would increase the risk of the
group splitting, rather than reducing it.
Another possibility is that the increased frequency of temporary group splits is independent of close
calls and entirely driven by the scarcity of potential prey and the increased dispersion between group
members. However, we found only a small increase in nearest neighbour distances and it is difficult to assess
how strongly this affected group dispersion and the risk for temporary group splits. In order to disentangle
the importance of food scarcity alone, experimental methods and theoretical approaches would be necessary,
as they would allow to simulate different degrees of resource availability while controlling for close call rate.
If temporary group splits were independent of close calls, the question remains why meerkats
increase their close call rate independent of their nearest neighbour distance. Call rate might be affected by
the difference in group dispersion as mentioned previously, but there is a further possibility: close calls might
allow to distribute vigilance between all group members while individuals cannot afford to go on sentinel duty
as often anymore (144). Under normal conditions, the least hungry individual might go on sentinel instead of
foraging, allowing its group members to reduce individual vigilance and to spend more time foraging (95).
Sentinels emit different call types to give a graded warning about predators. ‘Calming’ calls inform group
members about the absence of predators and lead to group members decreasing individual vigilance, while
‘warning’ calls lead to an increase of individual vigilance (145). A study conducted during the same period as
the current study (144), found that meerkats responded in the same way to close calls as to warning calls
during the drought, namely reducing individual vigilance in response to close calls, while vigilance behaviour
was not affected in response to close calls during non-drought conditions. Therefore, meerkats might increase
their close call as part of their individual vigilance effort during the drought. Meerkats have two different types
of close calls, the normal foraging close calls and the vigilance close call (146). Vigilance close calls are emitted
by individuals who were on bipedal vigilance and return to forage. In our study, we did not differentiate
between the different types of close calls and we do not have any information on vigilance of individuals. If
meerkats increased the amount of individual vigilance, this could lead to an increase in close call rate
independent of the location of the individual within the group.
However, it is unlikely that the increase in temporary group splits is completely independent of close
calls, as the function of close calls is to maintain group cohesion and thereby to reduce the likelihood to split.
It is much more likely that each individual, desperately in search for food and for contact to its group members
will increase its call rate, which in turn would lead slightly more dispersed meerkats to follow in the ‘wrong’
direction. Nevertheless, it is likely that meerkats also increase the rate of vigilance and vigilance close calls,
which can then in turn be used by their surrounding group members to regulate their own vigilance effort.
To conclude, we suggest a breakdown of the vocal coordination mechanism due to the extreme
environmental pressure. Whether this is an indicator for a collapse in cooperation between group members,
a cooperative effort to distribute vigilance and/or a desperate measure to maintain cohesion remains unclear
and experimental and theoretical approaches combined will be necessary to fully assess the impact of extreme
environmental conditions on group coordination and cooperation more generally. Learning how group living
animals respond to these challenging conditions, will help us understand how sensitive cooperative species

51
are to these extreme environmental changes. While it has been stated that sociality and cooperation allow
animals to expand their habitat to areas they could never survive in when solitary (147), species relying on
cooperation to survive, might be more fragile than solitary species when environments turn even harsher. We
strongly encourage future investigations into the stability of coordination mechanisms and cooperation in
general in order to better understand the evolution of sociality.
Ethical note
All data collection adhered to ASAB guidelines. All research was conducted under the permission of the ethical
committee of Pretoria University (Permit number: EC011-10) and the Northern Cape Conservation Service,
(FAUNA 1020/2016), South Africa.
Author Contributions
The long-term data was collected by the Kalahari Meerkat Project and the focal recordings were conducted by
PT and field assistants. The data was analysed by GG and the article was written by GG, PT and MM. All
authors gave final approval for publication.
Funding
PT and GG were funded by the Swiss National Science Foundation (Grant No PDFMP3_141768 to MM). The
long-term field site Kalahari Meerkat Project (KMP) was financed by Cambridge University, and Zurich
University. This paper has relied on data collected and maintained by the KMP, which has been supported by
the European Research Council (Research Grant No 294494 to T.H. Clutton-Brock since 1/7/2012), the
University of Zurich and the Mammal Research Institute of the University of Pretoria.
Acknowledgements
We thank the Kalahari Research Trust for the permission to work at the Kalahari Meerkat Project and the
neighbouring farmers to work on their farms. Further, thank Tim Clutton-Brock, and Dave Gaynor, Tim Vink
for the organisation of the field site and their input on the field work, and the managers Chris Duncan, Laura
Meldrum and all the present and former volunteers of the Kalahari Meerkat Project (KMP) for maintaining
the habituation and basic long-term data collection on the meerkats. and Inês Gonçalves as well as Denise
Camenisch or their assistance in collecting the vocal recordings. Finally, we thank Sabrina Engesser, Elisabeth
Gall and Bart Kranstauber, for comments on earlier versions of the manuscript.

52
Chapter IV

53

54
AS DUSK FALLS: COLLECTIVE DECISIONS ABOUT THE RETURN TO SLEEPING SITES IN MEERKATS
Gabriella E. C. Gall, Ariana Strandburg-Peshkin, Tim H. Clutton-Brock & Marta B. Manser
Accepted in Animal Behaviour
ABSTRACT
Social animal groups often make consensus decisions about when to return to a sleeping site after a day of
foraging. These decisions can depend on extrinsic as well as intrinsic factors, and can range from unshared to
shared. Here we investigate how decisions of meerkats (Suricata suricatta) to return to their burrows are
coordinated, whether they are shared or monopolised by dominant individuals, and what factors influence
the timing and speed of return. Individual meerkats can initiate group movements using ‘lead’ calls, and
groups can change foraging patches using ‘move’ calls in a quorum response. We found that both call types
can be emitted during the return to the burrow, with the probability of move calls increasing as sunset
approaches, and the probability of lead calls increasing with greater distance to the burrow when sunset is
imminent. Dominant and subordinate individuals did not differ significantly in move and lead call rate.
Further, the time of return was better predicted by the foraging success of all subordinates in the group (with
the group returning later when success was low) than by the foraging success of the dominant individuals.
This suggests that decisions to return are shared rather than controlled by dominants. The speed of return
depended both on extrinsic factors, such as the presence of pups, the time until sunset, and the distance to the
burrow, and on intrinsic factors such as satiation. Our results indicate that both the speed and timing of the
return depend on urgency, and the higher incidence of lead calls when groups are far away from the burrow
near dark suggests a possible change of the decision-process from shared to unshared as urgency increases.
Our study highlights the impact of time constraints during decision-making processes and in particular on
the level of decision sharing.
INTRODUCTION
Consensus decisions are necessary when individuals within a group must synchronize their activities in order
to maintain the benefits of group living (2). As group members may differ in their preferences for the type
and timing of activities, consensus decisions are typically connected to consensus costs to individuals for whom
the decision outcome is suboptimal (19, 26). Consensus decisions can range from ‘shared’, when all or many
individuals join in the decision-making process, to ‘unshared’ when only one or few individuals emerge as
leaders (21). Evidence from laboratory experiments (29, 148, 28, 149) and theoretical models (150) shows that
collective decision-making processes are greatly affected by time constraints (36) and can as a consequence
shift from highly shared to less shared decisions within the same overall context (29). However, evidence from
group living species in their natural environment on how time constraints influence group decisions is
currently lacking.
Many social mammal groups in the wild need to reach collective decisions about when to leave on
daily foraging trips, where to go, when to return, and where to spend each night. Previous analyses have
mostly examined the departure for daily foraging trips, and have shown that in some species leadership is
4
55
determined by the social rank of an individual (151, 152). Furthermore, energetic demands can drive variation
in leadership, with the most hungry individuals being the most likely to initiate group departure (Fischhoff et
al., 2007; King & Sueur, 2011; Furrer, Kunc & Manser 2012). If the needs of an individual are not entirely
satisfied after a decision is taken, it can adjust its behaviour by allocating its time differently, e.g. instead of
spending the time vigilant or resting it may forage, thereby reducing consensus costs (154). However, when
time is the limiting factor, as for diurnal species when dusk is approaching, individuals are often unable to
compensate for unsatisfactory decisions. This can lead to an increase in the consensus costs to each individual
and therefore greater conflicts of interest over the timing of a change in group activity. Theoretical models
suggest that shared decision processes are likely to evolve in decisions about activity synchronisation under a
wide variety of circumstances, but particularly when individuals differ strongly in their requirements and
consensus costs are high (26, 27). This is because in contrast to decisions on fixed destinations where
individuals have to decide for either alternative, group members can compromise and average the timing of
decisions, thereby lowering the consensus costs to all individuals (26, 27). Following this argument further,
we predict that decisions about the timing of an activity will be less shared when conflicts of interest are low
and the costs of delaying a decision are high, i.e. in situations with time constraints.
Decision-making can be investigated on different levels, as individual level processes emerge into
group level outcomes. In decisions about the timing of an activity, the change in travel speed or the arrival
time at a destination can give insight about the underlying trade-offs and decision processes. For example, the
timing of return to a sleeping site is likely influenced by the satiation level of group members, with groups
returning later when their members are not fully satiated due to low foraging success, and earlier when
foraging success was high. Here the differences in foraging success by each member may explain the variation
in the type of consensus, namely whether the decision is shared or unshared. Specifically, we expect that if
decisions are monopolized by a high-ranking leader, the group would return earlier when this leading
individual is fully satiated, independent of the satiation level of its group members. Furthermore, the decision-
making process can depend on the ‘urgency’ of a situation, i.e. how fast a decision needs to be taken. House-
hunting ants (Leptothorax albipennis) lower their quorum threshold to decide between multiple nest sites
when their previous nest was destroyed, compared to conditions when their old nest site remained intact and
the decision time was less of a concern (29). When determining the return time to a sleeping site in groups of
diurnal species, the urgency of a situation might depend on the distance still to be covered during the
remaining time of daylight. Groups can adjust their travel speed and their directness of their route toward
their target destination, or as with the ant example, they might adjust the decision-making process in order
to save time.
Meerkats (Suricata suricatta), an obligate group living and social mongoose species, offer an ideal
opportunity to study the decision-making process underlying the timing of collective returns to sleeping sites.
Meerkat groups have a despotic social structure with a dominant pair breeding and subordinate individuals
helping to rear the offspring (155). While meerkats usually change their sleeping burrow every couple of days,
they stay at the same burrow for up to four weeks when they have very young pups, not yet foraging with the
group (155). When the pups start joining the group on the daily foraging trips, subordinate individuals in
particular contribute to feeding and guarding them (156). In meerkats, a single individual can initiate group
departure from the burrow (157) often mediated through ‘lead calls’, whereby lead calling individuals are
more frequently followed than individuals that silently depart (157). When foraging, all individuals can
contribute in decisions to change the foraging patch using ‘move calls’ (49). These calls are used in a quorum
mechanism, whereby a minimum number of individuals must be in favour of a change in activity or
destination in order to be followed by the rest of the group (49, 47). Move and lead calls are part of a
continuous graded call system with move calls on one end and lead calls on the other end of the acoustic

56
spectrum (unpublished data) and both call types have been observed to be emitted in the evening shortly
before the return of a group to its sleeping site (GG, MM personal observation). Groups can return to their
sleeping burrow in two different ways, which can be broadly categorized as slow (foraging until they reach
their sleeping burrow) or fast (interrupting their foraging to run back to a sleeping burrow, often emitting
move and lead calls) (GG, MM personal observation)).
As yet, few studies have explored the decisions groups have to make at the end of each foraging day,
and those that have focused on the selection of sleeping sites (158, 159). Despite the fact that collective returns
represent critical consensus decisions that occur daily in the lives of many social animals, to our knowledge
there is no study regarding decisions about the timing of return to sleeping sites. Here we analysed long term,
low resolution (~1 fix / 15 minutes) GPS (Global Positioning System) data of meerkat groups combined with
high resolution (1 fix / sec) GPS data and continuous audio recordings on specific individuals, collected over a
short period of time. Specifically, we investigated the ranging behaviour of wild meerkat groups to identify (1)
how group movements are coordinated; (2) whether the dominant individuals or all group members control
the time of the return; and what factors affect the (3) timing, (4) speed and (5) directness of the return.
METHODS
Study site and population
For this study, we used long-term data collected by the Kalahari Meerkat Project over the 13 years from 2002
to 2015 on more than 60 groups, as well as acoustic and high resolution tracking data collected between
January and March 2015 on 6 meerkat groups. The project is situated at the Kuruman River Reserve, in the
Northern Cape of South Africa (26° 58’ S, 21° 49’ E). Details on the habitat and population are provided
elsewhere (155). All animals in the population could be identified through individual dye mark combinations
(67) and were habituated to close human handling and observation within less than 1 m.
Data collection
Long-term data
Data on each group, ranging from 2 to 49 individuals, were collected on approximately three days per week
in the morning, the evening or both. Morning observation sessions start at dawn and end after roughly 3h of
foraging. The evening observation session starts when meerkats resume foraging after resting during the
hottest hours of the day, and ends after 1.5 to 2h, when the group has returned to their sleeping burrow at
sunset. The location of the morning and evening sleeping burrow, the number of individuals present in the
group and the presence of pups (at the sleeping burrow or joining the foraging group), were recorded during
each session. Furthermore, the observers following the group during each session took a GPS fix from the
centre of the group every 15 min (accuracy: 95% of fixes within 5 m; eTrex H, Garmin International Inc.,
Olathe, KS, USA). Each meerkat was trained to climb onto electronic balances for a small reward of boiled egg
or water at the start and end of the morning sessions as well as at the end of the evening sessions. This allowed
us to calculate the difference between an individual’s evening and morning weight providing a measure of an
individual’s daily foraging success.
Acoustic data and high resolution tracking data
Data were collected between January and March 2015 on six meerkat groups, with group sizes ranging from
9 to 16 individuals (mean ± SD = 12.2 ± 2.9), during 17 evening sessions (described above), with two to three
sessions per group and at least 3 days between visits to a group. The vocalizations and position of four

57
individuals (the dominant pair and two subordinates) was recorded by each of four observers. Vocalizations
were recorded using a directional microphone (Sennheiser ME66 with K6 powering module) connected to a
recorder (Marantz PMD660, sampling frequency 44.1 kHz, 16bit) at a distance of 0.3 m to 1.5 m to the
individual. The position of each followed individual was inferred through the location of each observer,
carrying a small device (22g, CCD ltd) that recorded the GPS track at 1Hz frequency (accuracy: 99% of fixes
within 5m, 82% of fixes within 2m) and sound continuously (sampling frequency 48 kHz, saved in mp3:
bitrate = 160 kBit/s), subsequently called GPS/audio unit. Up to 4 additional meerkats (mean ± SD = 1.6 ±
1.4 individuals per group) were fitted with a GPS/audio collar before the start of each session. One person
distracted the meerkat with water from a water bottle and another person attached the collar to the
outstretched neck of the drinking meerkat. The length of the collar was adjusted in advance by measuring the
neck of the meerkat during earlier sessions, in order to reduce the handling time for each individual. If a
meerkat shied away from the collar, we did not attach a collar to the animal in question during this session.
Data analysis
Long term data
For the analysis of long-term data, we only included groups that had been observed in both the morning and
evening for a minimum of 10 times. This left us with 34 groups (group size: mean ± sd = 14.89 ± 7.01) over
the full study period. For the remaining data, we calculated the distance between GPS fixes as well as the
distance between each fix and the evening sleeping burrow, using the packages ‘move’ (100) and ‘geosphere’
(160) in R (version 3.3.0.) (96). From the distance between each GPS fix we calculated the total length of the
foraging route throughout the whole day, standardized by the total time the group spent foraging. From each
GPS fix in the afternoon session we calculated the distance to the evening sleeping burrow as well as the speed
of the group during the 15 min time intervals between each GPS fix and from that the change in speed from
one time-interval to the next. If the time between the last GPS point before arrival at the sleeping burrow and
the time of arrival was shorter than 10 min we excluded the distance information of this time step from the
analysis. We determined the mean daily weight gain of the group by first calculating the difference in weight
between the morning and the evening session for each individual, and then taking the mean for the whole
group. Furthermore, we calculated the mean weight gain of the subordinate individuals as well as the weight
gain of the dominant female and the dominant male of each group. To investigate the influence of pups
(defined as dependent individuals up to the age of 90 days) on the change in speed during as well as on the
timing of the return, we divided the presence of pups into three sub categories: 1) no pups present, 2) pups at
the sleeping burrow, and 3) pups foraging with the group. Finally, we calculated the time of sunset for each
session, as meerkats generally return to their sleeping burrows around this time.
Acoustic data and high resolution tracking data
For the analysis of the acoustic data, we excluded three sessions due to the meerkats returning early because
of stormy weather or due to an intergroup interaction during the session. For the other 14 sessions, we
calculated the centroid of the group (mean x, y location of all observers and additional meerkats with
GPS/audio units) as well as the time until sunset for each time step (1 Hz). We binned the vocalization data
into 5 min time intervals, from the end of a session until the start of the session and in relation to the time of
sunset. For each bin, we calculated the mean per capita call rates for both move and lead calls. We further
calculated the call rate for the dominant female and the dominant male, as well as the mean call rate of
subordinate meerkats. For the same time bins we scored the presence and absence of calls, which we used for
the statistical analysis. Furthermore, we calculated the distance of the group’s centroid to the sleeping burrow
at the start of each of the time bins.

58
Statistical Analysis
Acoustic data and high resolution tracking data
Statistical analysis was carried out using R (version 3.3.0.). To investigate whether move calls and lead calls
were more likely to be emitted when the group was far away from the burrow or when it was getting late, we
fitted two generalized linear mixed effects models (GLMM; Bates, Maechler, Bolker, & Walker, 2015) with the
presence / absence of either move calls or lead calls as the response variable. As the data were highly zero
inflated, we used presence / absence of calls as the response variable rather than absolute number, and
assumed a binomial error distribution. This solved any problems with overdispersion (Overdispersion test
(161): Observed Variance / Theoretical Variance = 0.49, Statistic = 139.43, p-value = 1). We included distance
to the sleeping burrow, time until sunset, and the interaction between these two predictors as fixed effects
and controlled for the session nested in group by fitting them in the random term. The explanatory variables
where checked for collinearity and z-transformed by first calculating the mean and standard deviation for
each variable and then for each variable subtracting the mean and dividing by the standard deviation. We
found no significant autocorrelation in the call rates of either move or lead calls. To assess the importance of
each explanatory variable, we used multi-model inference, fitting models containing all possible combinations
of predictors (using the dredge function in the MuMIn package in R), and then computing their weighted AIC
scores using the importance function. All models were ranked based on their corrected Akaike information
criterion (AICc) and we present all models within 2 delta AICc of the top-ranked model. Models within 2 AICc
units of the best model were also used to calculate averaged effect sizes (*standardised on two standard
deviations following Gelman (2008)). We used a log likelihood ratio test to assess the significance of each of
the fixed effects in the top-ranked model. The same process was used for all models described in the following
and therefore will not be described in detail again below.
To determine whether dominant individuals called more than subordinate individuals we subset the
data and included only time bins when at least one call (either move or lead call) was emitted. We then log
transformed the call rate and fitted a linear mixed effects model (LMM) with the log transformed call rate as
response variable, the dominance status and sex of an individual, namely the dominant female, dominant
male or subordinate female, subordinate male, as explanatory variable and the session nested in group as
random effects. Again, we found no collinearity between the explanatory variables or autocorrelation in any
of the models. We used multi-model inference to assess the importance of each explanatory variable.
Long term movement data
To investigate whether the time of return was affected by internal or external factors as well as whether the
decision on the timing was a shared or a unshared decision, we fitted a LMM with the time of return, i.e. the
remaining time until sunset, as response variable and after checking for collinearity, the group size, the total
length of the daily foraging route, as well as the interaction between route length and the presence of pups at
the sleeping burrow and finally the interaction between the mean weight gain of the subordinate group
members and the dominant female’s and dominant male’s weight gain respectively as explanatory variables,
with group as random term. As above described we used multi-model inference to infer the relative
importance of the different predictors, and used model averaging to estimate the strength and direction of
each effect.
To test whether the mean speed of a meerkat group depended on extrinsic factors such as the length
of the foraging route, the distance to the sleeping burrow, the group size and the remaining time until dusk
or on the intrinsic state of meerkats indicated by their foraging success, we fitted a LMM with mean speed as
the response variable and the number of non-pup group members, the mean weight gain, the interaction
between the presence of pups at the sleeping burrow and the length of the daily foraging route, as well as the
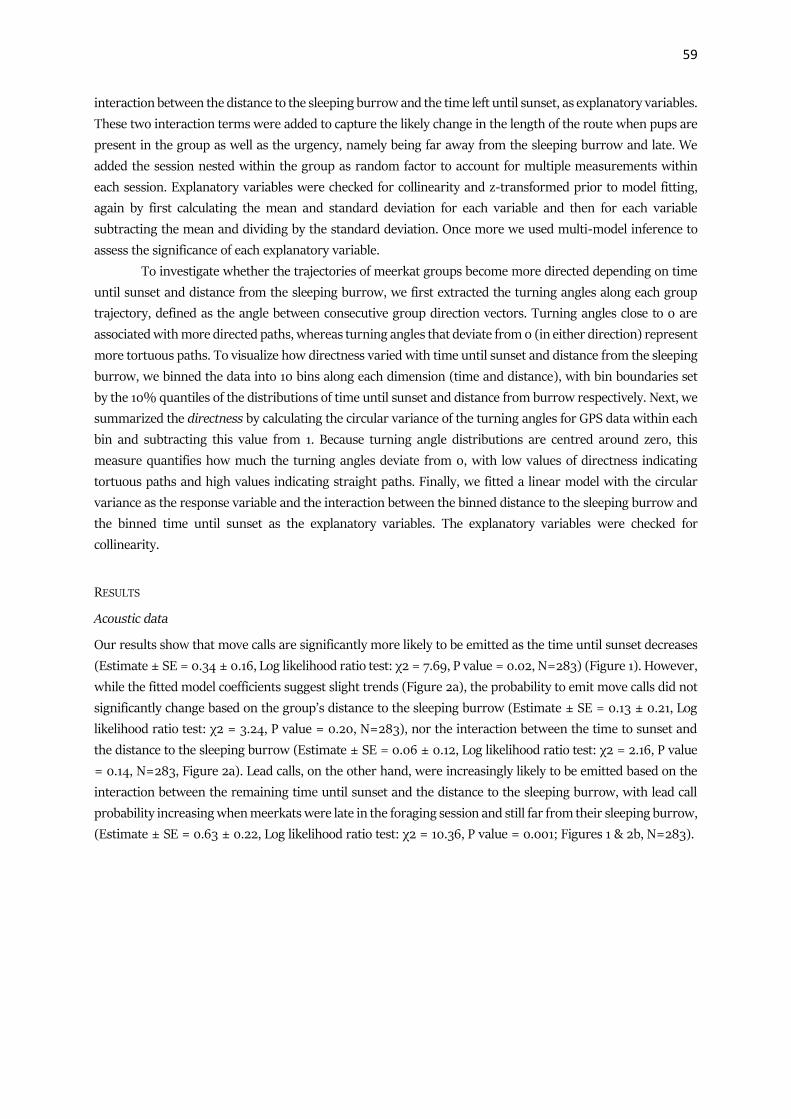
59
interaction between the distance to the sleeping burrow and the time left until sunset, as explanatory variables.
These two interaction terms were added to capture the likely change in the length of the route when pups are
present in the group as well as the urgency, namely being far away from the sleeping burrow and late. We
added the session nested within the group as random factor to account for multiple measurements within
each session. Explanatory variables were checked for collinearity and z-transformed prior to model fitting,
again by first calculating the mean and standard deviation for each variable and then for each variable
subtracting the mean and dividing by the standard deviation. Once more we used multi-model inference to
assess the significance of each explanatory variable.
To investigate whether the trajectories of meerkat groups become more directed depending on time
until sunset and distance from the sleeping burrow, we first extracted the turning angles along each group
trajectory, defined as the angle between consecutive group direction vectors. Turning angles close to 0 are
associated with more directed paths, whereas turning angles that deviate from 0 (in either direction) represent
more tortuous paths. To visualize how directness varied with time until sunset and distance from the sleeping
burrow, we binned the data into 10 bins along each dimension (time and distance), with bin boundaries set
by the 10% quantiles of the distributions of time until sunset and distance from burrow respectively. Next, we
summarized the directness by calculating the circular variance of the turning angles for GPS data within each
bin and subtracting this value from 1. Because turning angle distributions are centred around zero, this
measure quantifies how much the turning angles deviate from 0, with low values of directness indicating
tortuous paths and high values indicating straight paths. Finally, we fitted a linear model with the circular
variance as the response variable and the interaction between the binned distance to the sleeping burrow and
the binned time until sunset as the explanatory variables. The explanatory variables were checked for
collinearity.
RESULTS
Acoustic data
Our results show that move calls are significantly more likely to be emitted as the time until sunset decreases
(Estimate ± SE = 0.34 ± 0.16, Log likelihood ratio test: χ2 = 7.69, P value = 0.02, N=283) (Figure 1). However,
while the fitted model coefficients suggest slight trends (Figure 2a), the probability to emit move calls did not
significantly change based on the group’s distance to the sleeping burrow (Estimate ± SE = 0.13 ± 0.21, Log
likelihood ratio test: χ2 = 3.24, P value = 0.20, N=283), nor the interaction between the time to sunset and
the distance to the sleeping burrow (Estimate ± SE = 0.06 ± 0.12, Log likelihood ratio test: χ2 = 2.16, P value
= 0.14, N=283, Figure 2a). Lead calls, on the other hand, were increasingly likely to be emitted based on the
interaction between the remaining time until sunset and the distance to the sleeping burrow, with lead call
probability increasing when meerkats were late in the foraging session and still far from their sleeping burrow,
(Estimate ± SE = 0.63 ± 0.22, Log likelihood ratio test: χ2 = 10.36, P value = 0.001; Figures 1 & 2b, N=283).
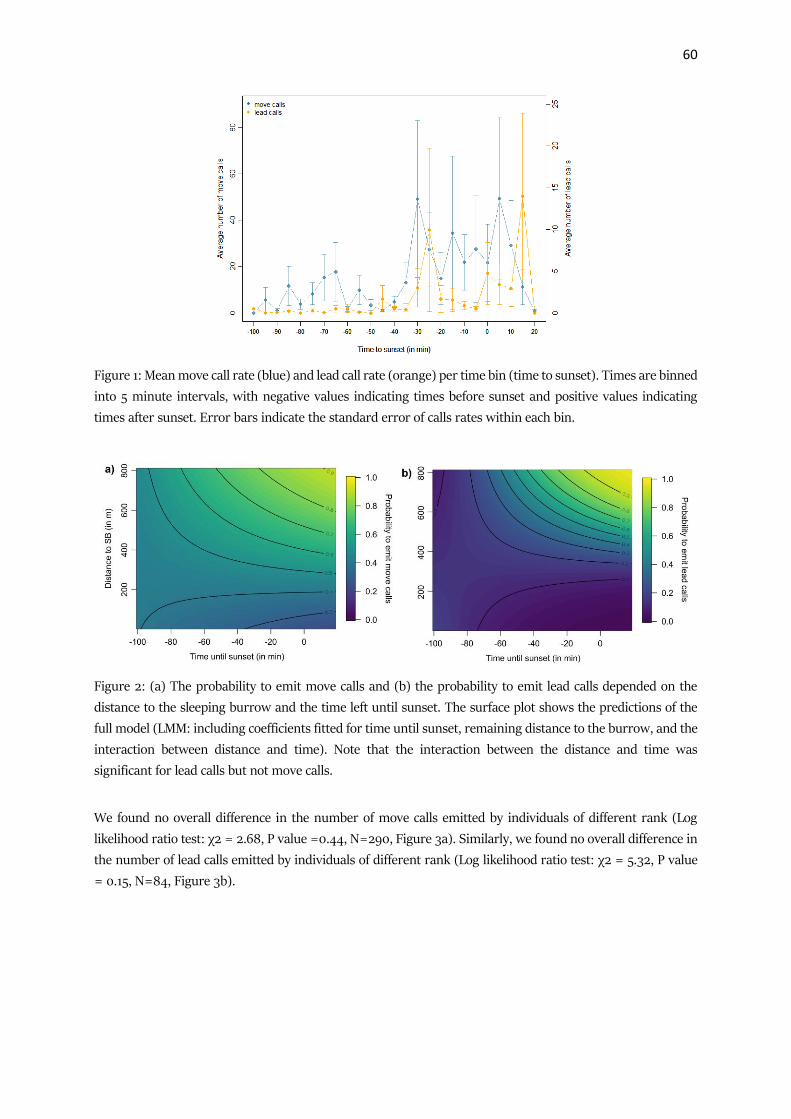
60
Figure 1: Mean move call rate (blue) and lead call rate (orange) per time bin (time to sunset). Times are binned
into 5 minute intervals, with negative values indicating times before sunset and positive values indicating
times after sunset. Error bars indicate the standard error of calls rates within each bin.
Figure 2: (a) The probability to emit move calls and (b) the probability to emit lead calls depended on the
distance to the sleeping burrow and the time left until sunset. The surface plot shows the predictions of the
full model (LMM: including coefficients fitted for time until sunset, remaining distance to the burrow, and the
interaction between distance and time). Note that the interaction between the distance and time was
significant for lead calls but not move calls.
We found no overall difference in the number of move calls emitted by individuals of different rank (Log
likelihood ratio test: χ2 = 2.68, P value =0.44, N=290, Figure 3a). Similarly, we found no overall difference in
the number of lead calls emitted by individuals of different rank (Log likelihood ratio test: χ2 = 5.32, P value
= 0.15, N=84, Figure 3b).

61
Figure 3: Mean (point) and standard error (error bars) of the log transformed number of (a) move calls and
(b) lead calls per 5 min time interval for each dominance and sex category. (df = dominant female; dm =
dominant male; sf = subordinate female; sm = subordinate male)
Long term data
The speed and timing of meerkats’ return to their sleeping site depended on the foraging success of the group
as well as the distance to the sleeping burrow and the remaining time until sunset (Figure 4a). In particular,
the mean speed of a group in the afternoon session was associated with the interaction between the distance
to the evening sleeping burrow and the time until sunset (Appendix Figure 1 & Table 1), with groups increasing
their speed when they were far away and sunset was imminent. Speed was also affected by foraging success,
with groups moving at higher speed when the mean weight gain of the group was higher (Appendix Table 1).
We found no significant interaction between the presence of pups and the length of the daily foraging route.
Larger groups moved at greater speed than smaller groups (Appendix Table 1).
Figure 4: Importance scores from the multi-model inference on (a) the speed of the return to the burrow and
(b) the time of the return to the burrow. Light grey bars stand for a negative coefficient and dark grey for a
positive coefficient (see Appendix Table 1 & 2). The explanatory variables are dist (distance to the sleeping
burrow), route (the total length of the daily foraging route), tss (time remaining until sunset), the interactions
between dist and tss, pup (presence/absence of pups at the burrow and pups foraging with the group), gs
(group size), mw (mean weight gain of the group), the interaction between pup and route, sw (the mean

62
weight gain of subordinate group members), dfw (the dominant female’s weight gain), dmw (the dominant
male’s weight), and the interaction between dmw and sw and dfw and sw respectively.
Meerkats also arrived significantly later at their sleeping burrow when the daily foraging route was long, when
the group size was small, when pups were present, and when the mean weight gain of subordinate group
members was low (Figure 4b, Appendix Table 2). We found no significant effect of the dominant female’s and
dominant male’s weight gain on the timing of the return (Appendix Table 2). The circular variance of turning
angles was significantly affected by the time until sunset (Log likelihood ratio test: F = 18.54, P value < 0.001,
N=100) and the distance to the sleeping burrow (Log likelihood ratio test: F = 8.99, P value < 0.001, N=100),
but not the interaction between the two (Log likelihood ratio test: F = 0.04, P value = 0.85, N=100), with
groups becoming more directed the further they were from the burrow and the less time remaining until dusk
(Figure 5).
Figure 5: Directness (i.e. 1 - circular variance in turning angles) of meerkat groups as a function of time until
dusk and distance from the sleeping burrow. Bins represent 10% quantiles of times and distances respectively,
and point sizes indicate the amount of data in each bin (log scale). The points are plotted at the median of
each bin, e.g. the last distance bin ranges from approximately 430m to 1000m distance to the sleeping burrow,
with the median being at 540 m. The red dashed line indicates the time of sunset. Negative values give the
times before sunset in minutes, positive numbers show the time after sunset.
DISCUSSION
Here we investigated how the decision to return to the sleeping burrow in meerkats was coordinated, whether
it was shared among group members, and what factors affected the timing, speed, and directness of return.
Meerkats used two call types when initiating the return to the sleeping site. We found that move calls were
more likely to be emitted as dusk approached (with no significant effect of the distance to the burrow), while
the production of lead calls depended on the interaction between the time until sunset and the distance to the
burrow, with the highest lead call rates occurring when dusk was imminent and the meerkats were far from
their sleeping burrow. Call rate did not depend on the rank or sex of an individual, with subordinate
63
individuals emitting similar numbers of move and lead calls as the dominant pair, suggesting that the decision
to return is not monopolized by dominant individuals. The speed of the group at the return changed depending
on the distance of the group to the sleeping burrow, the time until sunset, the mean daily weight gain of a
group, group size, the length of the foraging route, and the presence of pups. This shows that the type of
return (slow vs. fast) is affected by both intrinsic and extrinsic factors. Furthermore, groups moving faster the
further they were from the burrow and the later it was, indicates that the type of the return is based on the
urgency for the group to return. The movement of meerkat groups became more directed (smaller turning
angles) the further away they were from their burrow, and the less time remaining until nightfall. Meerkats
returned later to their burrow when group size was small, when pups were present (either at the sleeping
burrow or foraging with the group), when their daily foraging route was long, and when the mean weight
gain of subordinates was low. The weight gain of the dominant female and the dominant male had lower
importance (based on multi-model inference) in affecting the timing of the return compared to the weight
gain of subordinates. This is in line with our hypothesis that the return time is affected by the intrinsic state
of an individual, measured as its daily foraging success. In addition, it suggests that the decision to return is
shared among multiple individuals rather than being monopolized by dominant individuals.
The dominant pair are the social leaders of the group and it has previously been shown that the
dominant female is the most likely individual to initiate group departure from the burrow when her energetic
demands are increased due to pregnancy or lactation periods (157). In contrast, our results are more in line
with the hypothesis that the decision to return to the burrow is shared. If either of the dominant individuals
controlled the decision to return, we would expect their weight gain to be more important in predicting the
group’s return time than the weight gain of subordinates. However, we found that the mean weight gain of
subordinates was more important in the model predictions, with the group returning later when the weight
gain of subordinate group members was low. In addition, the finding that subordinate meerkats gave similar
numbers of move and lead calls as the dominant pair supports the hypothesis that the decision to return is
shared. However, this does not exclude that group members might be more likely to follow calls given by
dominant rather than subordinate individuals. Furthermore, the current study does not test whether
individuals may still vary in their propensity to give move and lead calls or to be followed independent of
dominance. Experiments will be necessary to confirm the hypothesis of shared decision-making. For example,
move and lead calls from different individuals within the group should be played and the movement response
of the group recorded.
For many diurnal species, predation risk increases with the approach of dusk, as predator detection
decreases (163, 164) and dropping temperatures after sunset can lead to an increased heat loss for each
individual (6). These factors increase the costs for each individual substantially as night falls, probably leading
to an increase in the urgency for the group to return to its sleeping site. This suggests that the speed of return
and the directness of a group are urgency based, with groups increasing their speed and moving in a more
directed fashion shortly before sunset and when they are far away from their burrow. The use of move and
lead calls may also be based on urgency, as the probability to emit move calls depended only on the remaining
time until sunset, but the probability to emit lead calls depended on both the time and the distance to the
burrow. Move calls have been shown to be used during quorum decisions (49) while lead calls were shown to
be followed when produced by a single individual (157), indicating a potential change from a shared decision
to an unshared decision (though not necessarily led by the dominant individual) with an increase in urgency.
This would be similar to house-hunting ants, shown to adjust their decision time by decreasing their quorum
threshold when in an urgent situation (29). However, to fully understand how the decision-making process
of meerkats is affected by urgency, controlled experiments will be needed.

64
Our results show that the type and the timing of the return depend on the intrinsic state of group
members, here measured through daily weight gain. When the foraging success of the group is low (low mean
daily weight gain), individuals might compensate by increasing the time searching for food and returning
later, thereby moving faster when returning at the last possible moment. This is also consistent with the idea
that when the daily foraging route is very long, groups have to move at greater speeds in order to return to
the burrow before dark. Similarly, when pups are at the burrow or join the foraging group, the energetic
demands of group members increase (156, 165–167) and individuals might therefore prolong their foraging
time to satisfy these energetic demands. In general meerkats do not change their sleeping site while they have
pups at their burrow (155), and this will affect their foraging success and their choice of foraging routes, e.g.
groups might stay closer to the babysitting burrow while foraging patches are still available and might travel
further away when foraging patches are depleted. While bigger groups seem to generally move faster, smaller
groups returned later. This could be due to the increased need for each individual to be vigilant in smaller
groups (95) and the ensuing reduction in time spent foraging.
The timing and the speed of return also depended on extrinsic factors such as the distance to the
sleeping burrow and the remaining daylight. This is to be expected, as when the group is far from a burrow
and it is getting dark, it needs to cover larger distances in a short amount of time. If the decision about the
timing of return were solely based on the remaining distance to the burrow, we would expect meerkats to
return at the same speed independent of distance to their burrow. This is because the decision to return would
be taken earlier when the group is far away and later when the group is very close. It follows that the actual
decision on the timing of the return might depend mainly on intrinsic states, e.g. level of satiation related to
the foraging success, while the type of return, i.e. slow vs. fast, might be based on extrinsic factors, such as
the remaining time of daylight and the distance to the burrow.
In conclusion, our results provide evidence that the decision about the timing of the return is shared
among multiple group members, and suggest that the speed of the group and the use of vocalizations are
based on urgency. This raises the possibility that the underlying decision-process changes from shared to
unshared depending on time constraints, as suggested by the fact that lead calls are given more often when
the group is far from its burrow when dark is falling. Furthermore, we demonstrate that the timing of the
return to the burrow is dependent on the internal state of group members, whereas the travel speed at the
return is also influenced by external factors. While we find parallels to initiation processes from resting to
foraging, the decision-making process in the evening, which initiates a change from foraging to resting, is
more likely to be shared, whereas decisions from resting to foraging have been shown to be unshared in
meerkats (157). Our study highlights the importance of time constraints during decision-making processes
and its impact on the level of decision sharing in natural systems. Fully understanding how animal groups
make consensus decisions will require additional studies of the initiation of changes in group activities under
time constraints, including experimental manipulations, across different contexts.
ETHICAL NOTE
All data collection adhered to ASAB guidelines. All research was conducted under the permission of the ethical
committee of Pretoria University (Permit number: EC011-10) and the Northern Cape Conservation Service,
(FAUNA 1020/2016), South Africa.

65
AUTHOR CONTRIBUTIONS
The long-term data was collected by the Kalahari Meerkat Project organised by TCB and MM, and the vocal
and high-resolution GPS data by GG and MM. The data was analysed by GG and ASP and the article written
by GG, ASP, TCB and MM. All authors gave final approval for publication.
FUNDING
This study was funded by the Swiss National Science Foundation (grant no. PDFMP3_141768) to MM. The
long-term field site Kalahari Meerkat Project (KMP) was financed by Cambridge University, and Zurich
University. This paper has relied on data collected and maintained by the KMP, which has been supported by
the European Research Council (Research Grant No 294494 to T.H. Clutton-Brock since 1/7/2012), the
University of Zurich and the Mammal Research Institute of the University of Pretoria.
ACKNOWLEDGEMENTS
We thank the Kalahari Research Trust for the permission to work at the Kalahari Meerkat Project and the
neighbouring farmers to work on their land. We also thank Dave Gaynor for the organisation of the field site
and his input on the field work, and the managers and volunteers of the KMP for maintaining the habituation
and basic data collection on the meerkats. Further, we thank Bruce Boatman, Pauline Toni and Denise
Camenisch for their assistance in collecting the vocal and high-resolution GPS data, and two anonymous
reviewers for comments on earlier versions of the manuscript.
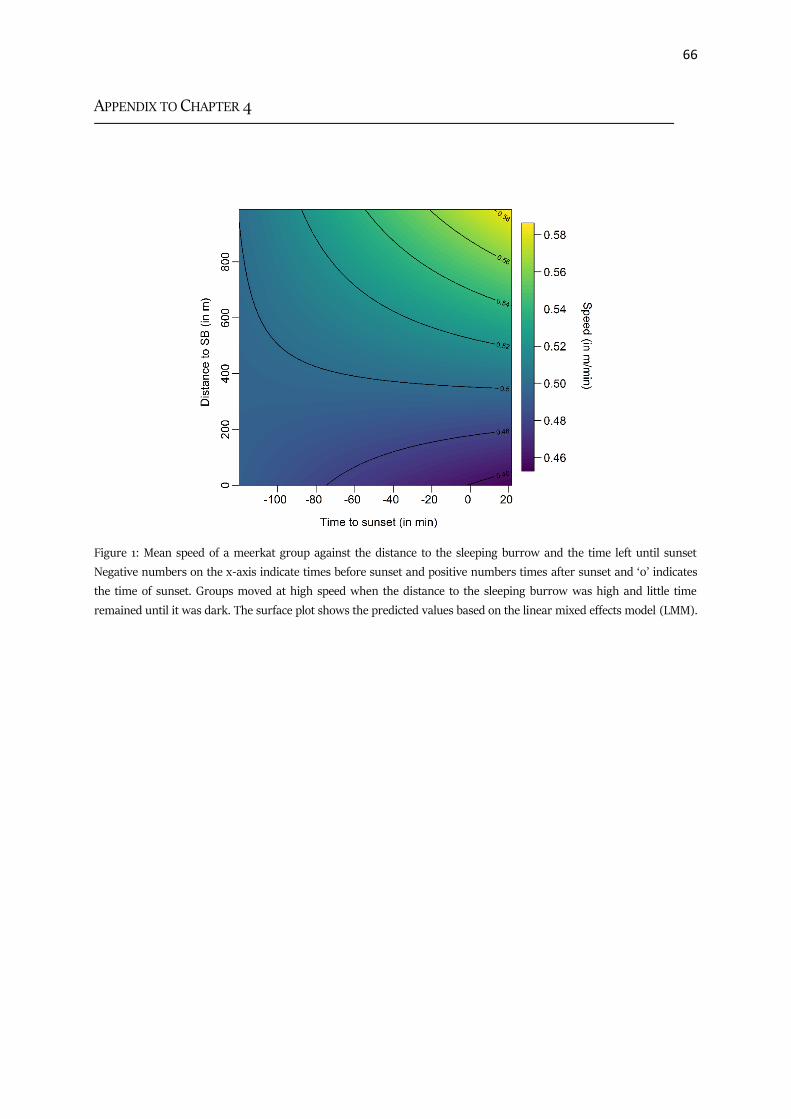
66
APPENDIX TO CHAPTER 4
Figure 1: Mean speed of a meerkat group against the distance to the sleeping burrow and the time left until sunset
Negative numbers on the x-axis indicate times before sunset and positive numbers times after sunset and ‘0’ indicates
the time of sunset. Groups moved at high speed when the distance to the sleeping burrow was high and little time
remained until it was dark. The surface plot shows the predicted values based on the linear mixed effects model (LMM).

67
Table 1: Model summary statistics for the effects of different explanatory factors on mean speed of the group using data calculated from N = 1880 sessions. The mean speed of the group was
used as response variable in a LMM. Models within 2 AICc units of the best model are highlighted in bold and were used to calculate averaged effect sizes (*standardised on two standard
deviations following Gelman (2008)[54]. Factors included are: dist (distance to the sleeping burrow), mw (mean weight gain of the group), gs (group size), pup (absence of pups, presence
of pups at the burrow and pups foraging with the group), route (the total length of the daily foraging route), tss (time remaining until sunset) and the interactions between dist and tss and
pup and route respectively. (df: degrees of freedom; w: relative model weights)
Intercept dist mw gs pup route tss dist*tss pup*route df LogLik AICc ΔAICc w
Model 1 0.085 0.012
0.00
2
0.00
3 +
0.02
4
0.02
7 0.015 12 12605.64 -25187.2 0.00 0.53
Model 2 0.085 0.012
0.00
2
0.00
3 +
0.02
4
0.02
7 0.015 + 14 12607.38 -25186.7 0.52 0.41
Model 3 0.085 0.012 0.003 + 0.024 0.027 0.015 11 12601.66 -25181.3 5.94 0.03
Model 4 0.085 0.012 0.003 + 0.023 0.027 0.015 + 13 12603.64 -25181.2 5.99 0.03
…
Averaged parameters
Estimate* 0.085 0.012 0.002 0.003 -0.009 -0.009 0.024 0.023 0.015 0.002 0.000
Unconditional SE 0.001 0.001 0.001 0.001 0.003 0.001 0.001 0.001 0.001 0.003 0.001
Upper 95%CI 0.087 0.014 0.003 0.004 -0.004 -0.006 0.026 0.028 0.016 0.007 0.003
Lower 95%CI 0.082 0.010 0.001 0.002 -0.015 -0.011 0.022 0.025 0.014 -0.003 -0.002
Relative importance 1.00 0.97 1.00 1.00 1.00 1.00 1.00 0.46
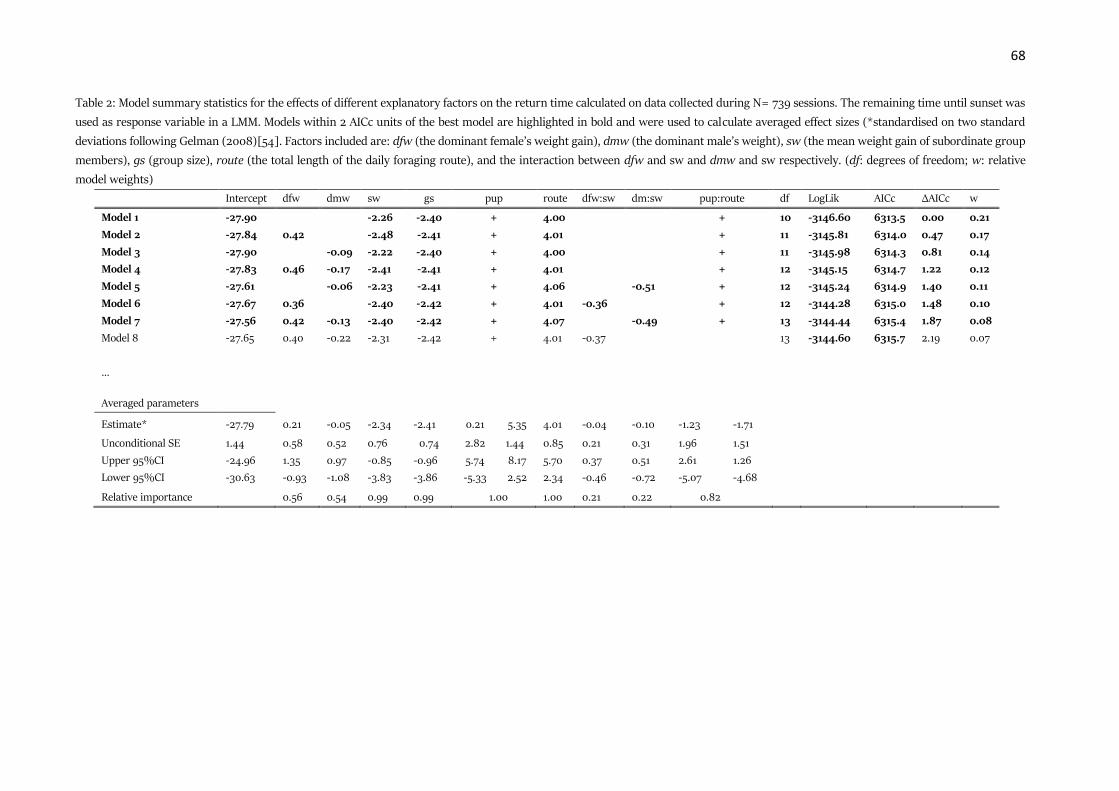
68
Table 2: Model summary statistics for the effects of different explanatory factors on the return time calculated on data collected during N= 739 sessions. The remaining time until sunset was
used as response variable in a LMM. Models within 2 AICc units of the best model are highlighted in bold and were used to calculate averaged effect sizes (*standardised on two standard
deviations following Gelman (2008)[54]. Factors included are: dfw (the dominant female’s weight gain), dmw (the dominant male’s weight), sw (the mean weight gain of subordinate group
members), gs (group size), route (the total length of the daily foraging route), and the interaction between dfw and sw and dmw and sw respectively. (df: degrees of freedom; w: relative
model weights)
Intercept dfw dmw sw gs pup route dfw:sw dm:sw pup:route df LogLik AICc ΔAICc w
Model 1 -27.90 -2.26 -2.40 + 4.00 + 10 -3146.60 6313.5 0.00 0.21
Model 2 -27.84 0.42 -2.48 -2.41 + 4.01 + 11 -3145.81 6314.0 0.47 0.17
Model 3 -27.90 -0.09 -2.22 -2.40 + 4.00 + 11 -3145.98 6314.3 0.81 0.14
Model 4 -27.83 0.46 -0.17 -2.41 -2.41 + 4.01 + 12 -3145.15 6314.7 1.22 0.12
Model 5 -27.61 -0.06 -2.23 -2.41 + 4.06 -0.51 + 12 -3145.24 6314.9 1.40 0.11
Model 6 -27.67 0.36 -2.40 -2.42 + 4.01 -0.36 + 12 -3144.28 6315.0 1.48 0.10
Model 7 -27.56 0.42 -0.13 -2.40 -2.42 + 4.07 -0.49 + 13 -3144.44 6315.4 1.87 0.08
Model 8 -27.65 0.40 -0.22 -2.31 -2.42 + 4.01 -0.37 13 -3144.60 6315.7 2.19 0.07
…
Averaged parameters
Estimate* -27.79 0.21 -0.05 -2.34 -2.41 0.21 5.35 4.01 -0.04 -0.10 -1.23 -1.71
Unconditional SE 1.44 0.58 0.52 0.76 0.74 2.82 1.44 0.85 0.21 0.31 1.96 1.51
Upper 95%CI -24.96 1.35 0.97 -0.85 -0.96 5.74 8.17 5.70 0.37 0.51 2.61 1.26
Lower 95%CI -30.63 -0.93 -1.08 -3.83 -3.86 -5.33 2.52 2.34 -0.46 -0.72 -5.07 -4.68
Relative importance 0.56 0.54 0.99 0.99 1.00 1.00 0.21 0.22 0.82

69
70
General Discussion

71
72
GENERAL DISCUSSION
Two of the main questions in the field of collective animal behaviour are how moving animal groups
coordinate and how they make decisions. Group coordination can be strongly affected by environmental
factors and offers a unique opportunity to study the influence of changes in the environment on social
interactions and cooperation among group members. Previous studies mainly focused on the social
interactions and constraints leading to the emergence of shared or unshared group decision-making, often
neglecting the impact the environment might have on the decision-making and coordination processes.
In this thesis, I tried to bridge the gap, according to the two main questions mentioned above; by
investigating the spatial distribution of animals within a foraging group; investigating the cohesion
mechanism of meerkats (Suricata suricatta) and how it is affected by extreme environmental conditions,
and the decision-making process by which meerkat groups stop foraging and return to their burrow.
In the first part of this discussion, I will focus on the importance of an individual’s spatial location
on group cohesion and discuss the effect possible changes in individual spatial location might have on
coordination. Moreover, I will briefly discuss the importance of environmental pressures on the level of
decision sharing in animal groups. In the second part I will examine the effect of extreme changes in the
environment on group coordination and its implications for the evolution of sociality. Lastly, I will
combine all of the findings discussed previously to draw some final conclusions. With data gathered
mainly through observations these thoughts will necessarily be speculative but they might nevertheless
help to shed some light as well as encourage a more experimental approach for future research.
Importance of an individual’s spatial location as well as urgency on group coordination
As small mammals, meerkats are at high risk of predation, and they therefore benefit from staying within
close contact to their conspecifics (71). Meerkats use close calls (close range contact calls) to maintain
cohesion during foraging. Group members call at different rates based on their own age and rank, with
young individuals calling at higher rates than older individuals (120, 128). Each member adjusts its call
rate to the identity, and age (120, 121), as well as the distance to its nearest neighbour. In addition,
individuals alter their call rate depending on their own spatial location within the group, calling less when
located at the edge and more when located toward the centre of a subgroup or group (73). Thereby, close
call rates have been shown to be highest at the centre-front of the group’s progression (73, 128). From
this differential calling behaviour, a call pattern emerges which contains areas with a high number of
animals and high close call rates, termed ‘vocal hotspots’, and areas with few animals calling at lower
rates. Thus, each individual can trace the vocal hotspots and move toward the area where most calls are
heard from, and where most of its group members are located (Chapter 2). This means that individuals,
which associate with each other or are predominantly located at specific spatial locations, for example at
the front of the group, likely have a greater influence on the cohesion mechanism than others.
The spatial structure of meerkat groups did not show a correlation between any individual trait
and a specific location within the group (Chapter 1). Instead, the dominant individuals were closely
associated with each other and individuals of the same litter were less likely to be within close range of
each other, indicating a strong influence of social affiliation and competition on the spatial association of
group members. The lack of an association between specific locations (edge vs. centre) and specific

73
individual traits (dominance, age, sex) suggests that in principle all group members have a similar
influence on group cohesion and on the direction of group movement during foraging. However, note that
dominant females are more likely to lead the group away from the burrow in the morning when they are
pregnant or lactating (157). While we collected the data of the spatial organisation of the group during the
breeding season, only some of the dominant individuals were lactating at the time and we did not test
whether differences in breeding status of the dominant or subordinate females have an effect on the
spatial organisation and the according influence of group members on group coordination. To test this
significantly more data would be necessary controlling for different breeding stages of the dominant or
subordinate individuals. We also did not find a spatial association among individuals according to their
age. An association of many young individuals would lead to an area with especially high close call rates -
i.e. a vocal hotspot - and an aggregation of mainly older individuals would lead to areas with especially
low call rates. I found no evidence for either scenario in the analysis (Chapter 1), suggesting that
individuals of the all age classes have a similar influence on vocal hotspots and thereby the cohesion and
coordination of foraging meerkat groups.
While all individuals seem equally important for the maintenance of group cohesion during
foraging in general, at any given moment in time, only part of the group seems to actively influence the
direction of group movement. Close call rate is highest toward the front-centre of the group (73, 128),
even though the individuals located in that position do not necessarily have the highest baseline call rate.
Individuals at the front of the group’s progression thus seem to actively increase their call rate. As
meerkats move toward vocal hotspots (Chapter 2), individuals at the front might exert a greater influence
on the direction of group movement than individuals at the centre or back of the group. Thus, meerkats
moving at the front of the group might be actively leading the group in a preferred direction. Meerkats
can identify group members based on the acoustic signatures of their close calls (121) and this ability might
allow potential followers to assess whether following a specific individual is beneficial or not. For example,
older individuals might not follow the direction of very young, inexperienced foragers even though call
rates might be high. Instead, we might expect young individuals to move in the direction of older, more
experienced individuals. The avoidance of close proximity between litter mates (Chapter 1), likely due to
high competition, also highlights the importance of individual identity. It is likely that littermates might
not follow in the direction where only their littermate is calling but would require at least one additional
individual to follow. To really show that individuals respond differently to group members with specific
traits, playback experiments are necessary.
The importance of certain individuals on the coordination of group movement during foraging is
likely to change throughout the day. An individual’s motivation and inner state changes during the
foraging session and accordingly its motivation to lead or to follow. In the morning, all individuals are
likely to be very hungry, and the incentive to lead might be high for all individuals. However, as older
individuals are the most experienced foragers, probably knowing in more detail where to find food, they
are the most likely individuals to be followed during foraging in the morning, even though all individuals
are able to lead the group in a given direction (168). In the afternoon, young and inexperienced foragers
are likely less satiated than older individuals, making them the individuals with the highest incentive to
lead the group to different foraging patches. These predictions are in line with differences in the spatial
structure found between the study (Chapter 1) and two previously published studies (111, 112), which
found that dominant and older individuals were more likely located toward the front of the groups
progression and younger individuals more likely at the centre of the group. The different studies differ

74
mainly in the time of data collection, with the data in Chapter 1, having been collected during afternoon
sessions, while the previous studies’ data were collected during the morning sessions (111, 112). Therefore,
if none of the previous results are a false positive or false negative finding, which can happen when
datasets are very small (169), these differences point toward the individual influence on group movement
being highly flexible and dependent on time of day.
These differences in spatial structure may be due to a higher predation pressure in the morning
than the afternoon (Chapter 1). The influence of older and dominant individuals might therefore be higher
under high predation risk (111, 112) and coordination may be more evenly shared when predation risk is
lower (Chapter 1). This would be similar to the decisions to return to the sleeping burrow in the evening
(Chapter 4). The decision to return to the sleeping burrow is less shared when the urgency to return is
higher, specifically the less time remains until sunset and the higher the predation risk. In situations in
which decisions become less shared, it is likely that older or dominant individuals take the lead, as they
are more experienced and are likely to have more information on the location of good and safe foraging
patches or of a good shelter and the best route to this shelter.
An urgency-based change in the amount of decision sharing has previously only been shown in
house hunting ants (Leptothorax albipennis), who, when given the choice between two new nest sites,
reduced the quorum threshold to settle on a given new nest when their old nest was destroyed compared
to when their old nest remained intact (29). In this case, the ants not only changed their quorum threshold,
but also the accuracy of their nest choice, as the ants chose the lesser quality nest more frequently under
the time constrained condition than under normal conditions. This trade-off between the speed and
accuracy in decision-making is a common pattern and has been shown in a range of species (28, 148, 149,
170, 171). In many cases a high degree of decision-sharing can lead to more accurate decisions, as several
individuals can both pool their personal information and eliminate individual errors (172–174), indicating
a strong relation between the amount of decision sharing and the speed-accuracy trade-off during decision
making processes. While not all animals living in groups seem to face a speed and accuracy trade-off, and
there seem to be some mechanisms like quorum responses allowing efficient information pooling as well
as fast decisions (150), the above example in ants shows that under risky conditions or time constraints,
the amount of decision-sharing can be adjusted. Changes in the amount of decision sharing can also be
seen in human societies. For instance governments in many countries can declare a state of emergency
and rule by decree (175). The rule by decree allows a single person to create laws, bypassing the
presumably non-functioning parliament, institutions to enforce shared decision and in this case law-
making. In democratic states, this reduction in the amount of decision sharing is mostly enforced under
extreme and urgent conditions, when decisions need to be taken fast. Therefore, it is likely that the ability
observed in meerkats and previously described in ants and humans, to adjust the amount of decision
sharing to the risks and urgency of a given situation, is a common but understudied pattern shared by
many other group-living animals.
The impact of extreme environmental conditions on group cohesion
It has previously been suggested that harsh environmental conditions select for cooperation in animal
species (147, 176). For instance cooperative breeding birds (177) and mammals (178) mainly occur in areas
with fluctuating and harsh environments. Natural observations and experiments support this hypothesis,
for example, a usually solitary marsupial, the brush-tailed phascogale (Phascogale tapoatafa), has been
found to share nests in an especially hard winter (179) and pied flycatchers (Ficedula hypoleuca) were

75
more likely to cooperate with their neighbours to mob a predator in areas with high perceived predation
pressure (180). Smaldino et al. (2013) investigated the theoretical underpinnings of this hypothesis (176)
by modelling an environment where interacting with a co-operator is essential for survival. They found
that, while in the short run defectors did better than co-operators, as they managed to retain more
resources, co-operators did better in the long run, as only groups with a sufficient number of co-operators
survived.
Meerkats as a highly cooperative species, cooperate with other group members throughout the
day in both reproductive and non-reproductive contexts. During foraging and under normal conditions,
i.e. climatic conditions falling within the boundary of the long-term average, individuals benefit from
moving in the direction of vocal hotspots, areas with many close calls, as they indicate the area where
most meerkats are located, and therefore help each group member to maintain group cohesion. This
cohesion mechanism relies on each group member calling according to its location within the group and
the distance to its nearest neighbours, namely calling at high rates when located toward the centre, and
at lower rates when located toward the edge of the group and when the distance to the nearest neighbour
is high. Thus, when individuals increase their call rate independent of their location within the group, as
observed during the extreme drought (Chapter 3) these individuals might in a way be regarded as less
cooperative. These high close calls rates are likely driven by food scarcity, leading to an increased distance
between group members and the need for each individual to focus on foraging. High close call rates by an
individual are likely to shift the location of vocal hotspots toward the location of the caller. It has previously
been shown, that hungry individuals are the most likely individuals to emerge as leaders (143), and
accordingly very hungry individuals are more likely to increase their close call rate in order to lead their
group members. These leading individuals are likely to benefit from leading rather than following, as they
can keep contact with their group members who follow them, without having to disrupt their current
activity. As long as the number of hungry leaders is relatively small, the group will still be able to maintain
cohesion and the risk of separation from the group will be small. However, once the number of these
hungry leaders is very large, receivers might not be able to perceive one global vocal hotspot, but might
follow toward local hotspots created by the high call rates of especially hungry conspecifics. Following in
the direction of these local vocal hotspots might in turn will lead to an increase in group splits as observed
in Chapter 3 which can in turn have negative effects on survival (2).
Nevertheless, other processes could also generate the observed pattern. It is possible that during
the drought meerkats have to call at high rates in order to avoid losing contact with the entire group, as
an individual at the edge might be so far from the rest of the group that the only possibility to be heard is
calling at high rates. Therefore, while the number of group splits we found during the drought was
increased, it is potentially less high than if individuals would have called at normal rates, even though
inter individual distances increased. If this is the case, individuals are not defecting. Instead the system
breaks down, because individuals have to change the system of how frequently to call, and call at high
rates independently of their location, while maintaining the system of where to follow, namely toward
vocal hotspots, areas with many calls. Similarly, if the close call rate is increased solely by an increase in
vigilance, the observed pattern might be created without individuals defecting. Meerkats differentiate
between guarding and foraging close calls (146). Guarding close calls are given after an individual was on
bipedal vigilance and can be used by other group members to change their own vigilance behaviour (146).
One question that arises is whether meerkats can change the volume of their calls. While we did not
investigate this in Chapter 3 and therefore have no information about it in this specific context, meerkats

76
in general were shown to be able to adjust the volume of their calls to changes in the amount of noise in
the environment such as increased wind (unpublished data). Personal observations (pers. comm MM) on
close call amplitude suggest that in high grass, where visibility is extremely low and background noise is
likely higher, meerkats call louder and calls are longer. Therefore, meerkats might have increased the
volume or the length of their calls in response to changes in group dispersion, however this is very
speculative and would have to be investigated in more detail.
During the extreme drought meerkats not only lost contact with their group members while
foraging, but body condition was substantially reduced. As meerkats reproduced less and fewer pups
survived, the population collapsed (unpublished data). This example indicates that in species such as
meerkats, where group members are highly dependent on each other across contexts, cooperation can be
highly beneficial for survival under ‘non-drought’ harsh conditions. However, cooperation can have
devastating side effects when conditions change in an extreme way, as during drought periods. Under
these extreme conditions, dependence on other group members increases the costs for individual survival,
thereby putting not only each individual but the whole group at risk. One can speculate that if the drought
would have lasted even longer, it might have wiped out the whole population, as more and more meerkats
would have died of starvation, predation or disease while at the same time raising pups would not have
been possible. The effectiveness of cooperation therefore depends on the general reliance on cooperation
from group members and the flexibility of the mechanisms used to coordinate the cooperative effort (here
the maintenance of cohesion).
Concluding remarks
Meerkats use vocal signals to maintain cohesion and to make decisions during foraging. While all group
members are involved in the coordination process, some individuals are likely to have a greater influence
than others. Furthermore, environmental factors likely play a critical role in driving and constraining
group coordination. Meerkats pay attention to changes in their environment and share less in the decision-
making process when situations are more urgent (Chapter 4). Possibly they also adjust their spatial
location to changes in predation pressure and foraging success (Chapter 1). In more general terms, this
thesis clearly indicates that an individual’s preferences and motivation constantly change and that these
changes strongly influence group coordination and the amount of decision sharing. Individual preferences
can be influenced by many different factors, such as an individual’s satiation, breeding status or illness,
and it can in turn strongly affect the amount of signalling, leadership, etc. Changes in an individual’s
internal state will be especially strong in wild animals, where the environment is more variable. However,
the data necessary to investigate these changes are notoriously difficult to collect in the wild.
Previous studies suggest that the level of satiation of each group member plays a significant role
in determining who emerges as a leader (143, 168, 181) or who changes its current behaviour in other
group activities that require coordination, such as guarding (95, 182, 183) or babysitting (64). These
studies compare the relative satiation between individuals and do usually not account for temporal
variation within each individual and its effect on group coordination. The internal state of individuals can
vary on many different temporal scales, and in the case of the satiation level, the daily pattern might be
quite different from a seasonal pattern influenced by general resource availability. To understand both
levels, long term studies are necessary, which are rare for group living animals living in the wild.

77
Group coordination can be strongly affected by the breeding status of each group member, and
depending on the life history of each species the effect on each group will be different. For instance,
marsupials and most mammals can carry their offspring within their womb rather than having to
incubate or look after their eggs laid in a specific location, such as many birds, reptiles, amphibians, fish
or insects. In many mammalian species, it is further quite common, that the offspring can follow the group
within a couple of hours of being born, either by being carried, as in primates, or by being able to walk,
as in antelopes. In these species group decision-making is less influenced by each individuals’ breeding
decision, compared to groups where specific parts of breeding reduce the mobility of groups, potentially
leading to group splits or to aggregations of usually non-group living animals into breeding groups (184).
In mammals, the impact of an individual’s breeding status on group coordination has mostly been studied
with respect to these individuals’ increased/decreased dietary requirements and according changes in
preferred activity (11, 185). However, with changing hormone levels, associated with changes in breeding
status, individual preferences will change beyond the need for more food. In animals living in stable social
groups year round, with high individual costs connected to group fission, the reduction in mobility due to
individual breeding attempts might be one factor leading to the evolution of cooperative behaviours
connected to reproduction. To fully understand this, it will be essential to investigate in more detail how
an individual’s breeding decisions affect other group members and the movement and coordination of the
group as a whole.
Illness is another important factor leading to changes in an animals behaviour (186, 187). Sickness
has been shown to impact an individual’s social network (188) and it is clear that this is another important
factor to take into consideration when studying group decision-making. As some diseases can lead to very
obvious symptoms and in some cases sickness behaviour can be induced, without the animal being
actually ill (188), it might offer a good opportunity to investigate its effect on group coordination and
decision-making in the laboratory and potentially also in the wild. Many wild populations suffer from
diseases and could be used as an opportunity to investigate the effect of disease on an individual’s
preferences, its ability to coordinate with others and the resulting changes in group coordination and
decision-making. For example, many meerkats at the Kalahari Meerkat Project suffer from Tuberculosis
caused by Mycobacterium suricattae, with symptoms including big lumps on the neck and changes in the
behaviour of disease ridden animals (189). Understanding the impact of diseases on an animals’
preferences and choices has also implications for human societies. We humans frequently suffer from
diseases and so it is to be expected that our ability to make decisions and coordinate with others might
similarly suffer during periods of illness. Of course different diseases will have different effects. However,
understanding how different epidemics such as cholera, plague or influenza affected decisions taken by
individuals and groups might help to further elucidate our own history.
Animals are likely to signal their changes in preferences to their group members. Bringing
together the study of communication and collective behaviour will be of key importance in order to
understand decision-making processes and group coordination. Linking group coordination to changes in
the environment will further help to elucidate the effect of changing individual needs and preferences on
coordination. New technological advances make it possible to collect high resolution data on the
environment as well as animals, namely measuring energy expenditure, heart rates and other
physiological metrics as well as vocalizations or other signal modalities. and allow to start tackling this
problem not only in the lab but also in wild organisms.

78
In my thesis, I focused on the behavioural aspects of group coordination and decision-making.
And while studying how different environmental conditions affect a given behaviour helps to understand
which factors might have led to the evolution of said behaviour, we will only ever understand the full
evolutionary process when we account for physiological constraints and the genetic basis of a behaviour.
Genetic tools become more accessible as the genome of more and more species is being sequenced and it
is time to use these tools to investigate the ultimate causes in more detail which led to the evolution of the
varied decision-making and coordination processes we can observe around us.
I sincerely hope that while this discussion is very speculative it will provide some fruit for thought
and further investigations into this fascinating subject.

79

80
BIBLIOGRAPHY
1. Wilson EO (1975) Sociobiology - The new synthesis (Harward University Press, Harward).
2. Krause J, Ruxton GD (2002) Living in groups (Oxford University Press, Oxford).
3. le Roux A, Cherry MI, Gygax L, Manser MB (2009) Vigilance behaviour and fitness consequences: comparing a solitary foraging and an obligate group-foraging mammal. Behav Ecol Sociobiol 63(8):1097–1107.
4. Hamilton WD (1971) Geometry of the selfish herd. J Theor Biol 31(2):295-.
5. Foster WA, Treherne JE (1981) Evidence for the dilution effect in the selfish herd from fish predation on a marine insect. Nature 293(5832):466–467.
6. Terrien J, Perret M, Aujard F (2011) Behavioral thermoregulation in mammals: a review. Front Biosci 16:1428–1444.
7. Gilbert C, Robertson G, Le Maho Y, Naito Y, Ancel A (2006) Huddling behavior in emperor
penguins: Dynamics of huddling. Physiol Behav 88(4–5):479–488.
8. Ward P, Zahavi A (1973) The importance of certain assemblages of birds as “information-centres” for food finding. Ibis (Lond 1859) 115(4):517– 534.
9. Smith JE, Kolowski JM, Graham KE, Dawes SE, Holekamp KE (2008) Social and ecological determinants of fission-fusion dynamics in the spotted hyaena. Anim Behav 76(3):619–636.
10. Carter KD, Seddon JM, Frere CH, Carter JK, Goldizen AW (2013) Fission-fusion dynamics in wild giraffes may be driven by kinship, spatial overlap and individual social preferences. Anim Behav
85(2):385–394.
11. Ruckstuhl KE, Neuhaus P (2002) Sexual segregation in ungulates: a comparative test of three hypotheses. Biol Rev 77(1):77–96.
12. van Noordwijk MA, van Schaik CP (1999) The effects of dominance rank and group size on female
lifetime reproductive success in wild long-tailed macaques, Macaca fascicularis. Primates 40(1):105–130.
13. Cowan DP (1987) Group living in the european rabbit (Oryctolagus cuniculus) - mutual benefit or resource localization. J Anim Ecol 56(3):779–795.
14. Landeau L, Terborgh J (1986) Odity and the confusion effect in predation. Anim Behav 34:1372–
1380.
15. Rayor LS, Uetz GW (1990) Trade-offs in foraging success and predation risk with spatial position in colonial spiders. Behav Ecol Sociobiol 27(2):77–85.
16. Patterson MR (1984) Patterns of whole colony prey capture in the octocoral, Alcyonium-siderium.
Biol Bull 167(3):613–629.
17. Rayor LS, Uetz GW (1993) Ontogenic shifts within the selfish herd - predation risk and foraging trade-offs change with age in colonial web-building spiders. Oecologia 95(1):1–8.
18. King AJ, Cowlishaw G (2009) All together now: behavioural synchrony in baboons. Anim Behav 78(6):1381–1387.
19. Conradt L, Roper TJ (2003) Group decision-making in animals. Nature 421(6919):155–158.
20. Conradt L, List C (2009) Group decisions in humans and animals: a survey. Philos Trans R Soc B-Biological Sci 364(1518):719–742.

81
21. Conradt L, Roper TJ (2005) Consensus decision making in animals. Trends Ecol Evol 20(8):449–456.
22. Duarte A, Weissing FJ, Pen I, Keller L (2011) An evolutionary perspective on self-organized division of labor in social insects. Annu Rev Ecol Evol Syst 42(1):91–110.
23. Deneubourg JL, Lioni A, Detrain C (2002) Dynamics of aggregation and emergence of cooperation. Biol Bull 202(3):262–267.
24. Kerth G (2010) Group decision-making in fission-fusion societies. Behav Processes 84(3):662–663.
25. Sueur C, et al. (2011) Collective decision-making and fission-fusion dynamics: A conceptual framework. Oikos 120(11):1608–1617.
26. Conradt L, Roper TJ (2009) Conflicts of interest and the evolution of decision sharing. Philos Trans R Soc B-Biological Sci 364(1518):807–819.
27. Conradt L, Roper TJ (2007) Democracy in animals: the evolution of shared group decisions. Proc
R Soc B-Biological Sci 274(1623):2317–2326.
28. Chittka L, Skorupski P, Raine NE (2009) Speed-accuracy tradeoffs in animal decision making. Trends Ecol Evol 24(7):400–407.
29. Franks NR, Dornhaus A, Fitzsimmons JP, Stevens M (2003) Speed versus accuracy in collective
decision making. Proc R Soc B-Biological Sci 270(1532):2457–2463.
30. Passino KM, Seeley TD (2006) Modeling and analysis of nest-site selection by honeybee swarms: The speed and accuracy trade-off. Behav Ecol Sociobiol 59(3):427–442.
31. King AJ, Sueur C (2011) Where next? Group coordination and collective decision making by
primates. Int J Primatol 32(6):1245–1267.
32. Pyritz LW, King AJ, Sueur C, Fichtel C (2011) Reaching a consensus: terminology and concepts used in coordination and decision-making research. Int J Primatol 32(6):1268–1278.
33. List C (2004) Democracy in animal groups: A political science perspective. Trends Ecol Evol
19(4):168–169.
34. Lusseau D, Conradt L (2009) The emergence of unshared consensus decisions in bottlenose dolphins. Behav Ecol Sociobiol 63(7):1067–1077.
35. McComb K, Moss C, Durant SM, Baker L, Sayialel S (2001) Matriarchs act as repositories of social knowledge in African elephants. Science (80- ) 292(5516):491–494.
36. Conradt L (2011) When it pays to share decisions. Nature 471:40–41.
37. Couzin ID, Krause J, Franks NR, Levin SA (2005) Effective leadership and decision-making in animal groups on the move. Nature 433(7025):513–516.
38. Reebs S (2000) Can a minority of informed leaders determine the foraging movements of a fish shoal? Anim Behav 59(2):403–409.
39. Strandburg-Peshkin A, Farine DR, Couzin ID, Crofoot MC (2015) Shared decision-making drives collective movement in wild baboons. Science (80- ) 348(6241):1358–1361.
40. Dyer JRG, et al. (2008) Consensus decision making in human crowds. Anim Behav 75(2):461–470.
41. Sumpter DJT (2006) The principles of collective animal behaviour. Philos Trans R Soc B-Biological
Sci 361(1465):5–22.
42. Sumpter DJT, Beekman M (2003) From nonlinearity to optimality: pheromone trail foraging by ants. Anim Behav 66:273–280.
43. Czaczkes TJ, Grüter C, Ratnieks FLW (2013) Negative feedback in ants: crowding results in less

82
trail pheromone deposition. J R Soc Interface 10(81):20121009.
44. King AJ, Johnson DDP, Van Vugt M (2009) The origins and evolution of leadership. Curr Biol 19(19):R911–R916.
45. Boinski S, Garber PA eds. (2000) On the move: How and why animals travel in groups (Chicago University Press, Chicago).
46. Seeley TD, Visscher PK, Passino KM (2006) Group decision making in honey bee swarms. Am Sci 94(3):220–229.
47. Ward AJW, Sumpter DJT, Couzin LD, Hart PJB, Krause J (2008) Quorum decision-making facilitates information transfer in fish shoals. Proc Natl Acad Sci U S A 105(19):6948–6953.
48. Ward AJW, Krause J, Sumpter DJT (2012) Quorum Decision-Making in Foraging Fish Shoals. PLoS One 7(3):8.
49. Bousquet CAH, Sumpter DJT, Manser MB (2011) Moving calls: a vocal mechanism underlying quorum decisions in cohesive groups. Proc R Soc B-Biological Sci 278(1711):1482–1488.
50. Bradbury JW, Vehrencamp SL (1998) Principles of Animal Communication (Sinauer, Sunderland,
Massachusetts).
51. Espmark Y, Amundsen T, Rosenqvist G (2000) Animal signals: signalling and signal design in animal communication (Tapir Academic Press).
52. D’Ettorre P, Hughes DP eds. (2008) Sociobilogy of Communication (Oxford University Press, Oxford).
53. Kondo N, Watanabe S (2009) Contact calls: Information and social function. Jpn Psychol Res 51(3):197–208.
54. Fichtel C, Manser MB (2010) Vocal communication in social groups. Animal Behaviour: Evolution & Mechanisms, ed Kappeler P (Springer, Heidelberg, Berlin), pp 29–54.
55. Radford AN, Ridley AR (2008) Close calling regulates spacing between foraging competitors in the group-living pied babbler. Anim Behav 75(2):519–527.
56. Sugiura H (2007) Effects of Proximity and Behavioral Context on AcousticVariation in the Coo
Calls of Japanese Macaques. Am J Primatol 69(11):1412–1424.
57. Boinski S (1991) The coordination of spatial position - a field study of the vocal behavior of adult female squirrel monkeys. Anim Behav 41(1):89–102.
58. Oda R (1996) Effects of contextual and social variables on contact call production in free-ranging ringtailed lemurs (Lemur catta). Int J Primatol 17(2):191–205.
59. Clutton-Brock TH, et al. (1998) Costs of cooperative behaviour in suricates (Suricata suricatta). Proc R Soc B-Biological Sci 265(1392):185–190.
60. MacLeod KJ, Nielsen JF, Clutton-Brock TH (2013) Factors predicting the frequency, likelihood and duration of allonursing in the cooperatively breeding meerkat. Anim Behav 86(5):1059–1067.
61. Clutton-Brock TH, et al. (1999) Predation, group size and mortality in a cooperative mongoose, Suricata suricatta. J Anim Ecol 68(4):672–683.
62. Clutton-Brock TH, et al. (2001) Cooperation, control, and concession in meerkat groups. Science (80- ) 291(5503):478–481.
63. Manser MB, Bell MB (2004) Spatial representation of shelter locations in meerkats, Suricata suricatta. Anim Behav 68:151–157.
64. Clutton-Brock TH, et al. (2000) Individual contributions to babysitting in a cooperative mongoose, Suricata suricatta. Proc R Soc B-Biological Sci 267(1440):301–305.

83
65. Clutton-Brock TH, Russell AF, Sharpe LL (2003) Meerkat helpers do not specialize in particular activities. Anim Behav 66:531–540.
66. Stephens PA, et al. (2005) Dispersal, eviction, and conflict in meerkats (Suricata suricatta): An evolutionarily stable strategy model. Am Nat 165(1):120–135.
67. Jordan NR, Cherry MI, Manser MB (2007) Latrine distribution and patterns of use by wild meerkats: implications for territory and mate defense. Anim Behav 73:613–622.
68. Doolan SP, Macdonald DW (1996) Diet and foraging behaviour of group-living meerkats, Suricata suricatta, in the southern Kalahari. J Zool 239:697–716.
69. Manser MB, et al. (2014) Vocal complexity in meerkats and other mongoose species. Advances in the Study of Behavior, Vol 46, Advances in the Study of Behavior., eds Naguib M, et al. (Elsevier Academic Press Inc, San Diego), pp 281–310.
70. Manser MB (1999) Response of foraging group members to sentinel calls in suricates, Suricata suricatta. Proc R Soc B-Biological Sci 266(1423):1013–1019.
71. Manser MB (1998) The evolution of auditory communication in suricates (Suricata suricatta). PhD thesis, Univ Cambridge, Cambridge, UK.
72. Manser MB (2001) The acoustic structure of suricates’ alarm calls varies with predator type and the level of response urgency. Proc R Soc B-Biological Sci 268(1483):2315–2324.
73. Engesser S (2011) Function of “close” calls in a group foraging carnivore, Suricata suricatta. MSc thesis, Univ Zurich, Zurich, CH.
74. Golabek KA, Jordan NR, Clutton-Brock TH (2008) Radiocollars do not affect the survival or
foraging behaviour of wild meerkats. J Zool 274(3):248–253.
75. Di Bitetti MS, Janson CH (2001) Social foraging and the finder’s share in capuchin monkeys, Cebus apella. Anim Behav 62:47–56.
76. Teichroeb JA, White MMJ, Chapman CA (2015) Vervet (Chlorocebus pygerythrus) intragroup
spatial positioning: dominants trade-off predation risk for increased food acquisition. Int J
Primatol 36(1):154–176.
77. Hirsch BT (2007) Costs and benefits of within-group spatial position: A feeding competition model. Q Rev Biol 82(1):9–27.
78. Hansen MJ, Schaerf TM, Krause J, Ward AJW (2016) Crimson Spotted Rainbowfish (Melanotaenia
duboulayi) change their spatial position according to nutritional requirement. PLoS One 11(2):17.
79. Bumann D, Krause J, Rubenstein D (1997) Mortality risk of spatial positions in animal groups: the danger of being in the front. Behaviour 134(13):1063–1076.
80. Krause J, Ruxton GD, Rubenstein D (1998) Is there always an influence of shoal size on predator
hunting success? J Fish Biol 52(3):494–501.
81. Di Blanco Y, Hirsch BT (2006) Determinants of vigilance behavior in the ring-tailed coati (Nasua nasua): the importance of within-group spatial position. Behav Ecol Sociobiol 61(2):173–182.
82. Sterck EHM, Watts DP, vanSchaik CP (1997) The evolution of female social relationships in
nonhuman primates. Behav Ecol Sociobiol 41(5):291–309.
83. Croft DP, et al. (2005) Assortative interactions and social networks in fish. Oecologia 143(2):211–219.
84. Ruckstuhl K, Neuhaus P (2005) Sexual segregation in vertebrates: ecology of two sexes (Cambridge University Press, Cambridge).
85. Hirsch BT (2011) Within-group spatial position in ring-tailed coatis: balancing predation, feeding competition, and social competition. Behav Ecol Sociobiol 65(2):391–399.

84
86. Hall CL, Fedigan LM (1997) Spatial benefits afforded by high rank in white-faced capuchins. Anim Behav 53:1069–1082.
87. Clutton-Brock TiH, Manser MB (2016) Meerkats: cooperative breeding in the Kalahari (Cambridge University Press, Cambridge).
88. Thavarajah NK, Fenkes M, Clutton-Brock TH (2014) The determinants of dominance relationships among subordinate females in the cooperatively breeding meerkat. Behaviour 151(1):89–102.
89. Young AJ, et al. (2006) Stress and the suppression of subordinate reproduction in cooperatively breeding meerkats. Proc Natl Acad Sci 103(32):12005–12010.
90. Hodge SJ, Flower TP, Clutton-Brock TH (2007) Offspring competition and helper associations in cooperative meerkats. Anim Behav 74(4):957–964.
91. Hodge SJ, Thornton A, Flower TP, Clutton-Brock TH (2009) Food limitation increases aggression in juvenile meerkats. Behav Ecol 20(5):930–935.
92. Madden JR, Kunc HP, English S, Manser MB, Clutton-Brock TH (2009) Calling in the gap:
competition or cooperation in littermates’ begging behaviour? Proc R Soc B-Biological Sci 276(1660):1255–1262.
93. Huchard E, English S, Bell MB V, Thavarajah N, Clutton-Brock T (2016) Competitive growth in a cooperative mammal. Nature 533(7604):532–536.
94. Kutsukake N, Clutton-Brock TH (2006) Aggression and submission reflect reproductive conflict between females in cooperatively breeding meerkats Suricata suricatta. Behav Ecol Sociobiol 59(4):541–548.
95. Clutton-Brock TH, et al. (1999) Selfish sentinels in cooperative mammals. Science (80- ) 284(5420):1640–1644.
96. R core team (2016) R: A language and environment for statistical computing.
97. Revelle W (2016) Procedures for personality and psychological research v. 1.6.7. Available at:
http://www.personality-project.org/r/psych-manual.pdf.
98. Bivand R, Lewin-Koh N (2016) maptools: Tools for reading and handling spatial objects. R Package version 0.8-39. Available at: https://cran.r-project.org/package=maptools.ln.
99. Hijmans RJ (2015) geosphere: Spherical Trigonometry. R package version 1.5-1. Available at: https://cran.r-project.org/package=geosphere.
100. Kranstauber B, Smolla M (2016) move: visualizing and analyzing animal track data. R package
version 1.6.541.
101. Gama J (2014) NISTunits: Fundamental physical constants and unit conversions from NIST.
102. Butts CT (2014) sna: Tools for social network analysis. R package version 2.3-2.
103. Farine D (2016) asnipe: Animal social network inference and permutations for ecologists. R package version 0.91. Available at: https://cran.r-project.org/package=asnipe. In.
104. Farine D (2016) assortnet: Calculate the assortativity coefficient of weighted and binary networks. R package version 0.12. Available at: https://cran.r-project.org/package=assortnet. In.
105. Csardi G, Nepusz T (2006) The igraph software package for complex network research. InterJournal Complex Syst 1695.
106. Bates D, Maechler M, Bolker B, Walker S (2015) Fitting Linear Mixed-Effects Models Using lme4. J Stat Softw 67(1):1–48.
107. Kuznetsova A, Brockhoff PB, Christensen RHB (2016) lmerTest: Tests in Linear Mixed Effects Models. R package version 2.0-30. Available at: https://cran.r-project.org/package=lmerTest
2016.

85
108. Wolak ME, Faribairn DJ, Paulsen YR (2012) Guidelines for estimating repeatability. Methods Ecol Evol 3:129–137.
109. Townsend SW, Hollen LI, Manser MB (2010) Meerkat close calls encode group-specific signatures, but receivers fail to discriminate. Anim Behav 80(1):133–138.
110. Farine DR, Whitehead H (2015) Constructing, conducting and interpreting animal social network analysis. J Anim Ecol 84(5):1144–1163.
111. Bousquet C (2011) Group decision-making in meerkats ( Suricata suricatta ) - PhD thesis Group Decision-Making in Meerkats ( Suricata suricatta ). (OCTOBER 2011).
112. Barnard JA (2000) Foraging behaviour and social organisation in a cooperative mongoose, Suricata suricatta. Dissertation (PhD Thesis, University of Cambridge, Cambridge).
113. Griffin AS, et al. (2003) A genetic analysis of breeding success in the cooperative meerkat (Suricata suricatta). Behav Ecol 14(4):472–480.
114. Bode NWF, Wood AJ, Franks DW (2015) Group movement and animal social networks. Animal
Social Networks, eds Krause J, James R, Franks DW, Croft DP (Oxford Univ Press, New York), pp 73–83.
115. Couzin ID, Krause J, James R, Ruxton GD, Franks NR (2002) Collective memory and spatial sorting in animal groups. J Theor Biol 218(1):1–11.
116. Koda H, Shimooka Y, Sugiura H (2008) Effects of caller activity and habitat visibility on contact call rate of wild Japanese Macaques (Macaca fuscata). Am J Primatol 70(11):1055–1063.
117. Uster D, Zuberbühler K (2001) The functional significance of Diana monkey “clear” calls.
Behaviour 138:741–756.
118. Kondo N, Watanabe S (2009) Contact calls: Information and social function. Jpn Psychol Res 51(3):197–208.
119. Trillmich J, Fichtel C, Kappeler PM (2004) Coordination of group movements in wild Verreaux’s
sifakas (Propithecus verreauxi). Behaviour 141:1103–1120.
120. Wolf C (2014) Acoustic cues to hierarchical social structures in subordinate female meerkats. MSc thesis, Ernst Moritz Arndt Univ Greifswald, Greifswald,.
121. Reber SA, Townsend SW, Manser MB (2013) Social monitoring via close calls in meerkats. Proc R Soc B-Biological Sci 280(1765). doi:10.1098/rspb.2013.1013.
122. Neuman C, Zuberbühler K (2016) Vocal correlates of individual sooty mangabey travel speed and
direction. PeerJ 4:e2298.
123. Brown CR, Bomberger Brown M, Shaffer ML (1991) Food-sharing signals among socially foraging cliff swallows. Anim Behav 42(4):551–564.
124. Jackson DE, Ratnieks FLW (2006) Communication in ants. Curr Biol 16(15):R570–R574.
125. Bernstein RA (1975) Foraging strategies of ants in response to variable food density. Ecology
56(1):213–219.
126. Ryer CH, Olla BL (1996) Social behavior of juvenile chum salmon, Oncorhynchus keta, under risk of predation: The influence of food distribution. Environ Biol Fishes 45(1):75–83.
127. Couzin ID, Krause J (2003) Self-organization and collective behavior in invertebrates. Adv Study Behav 32:1–75.
128. Mausbach J (2013) Does the production of close calls in meerkats correlate to glucocorticoids and life history traits? MSc thesis, Univ Zurich, Zurich, CH.
129. Gall GEC, Manser MB (2017) Group cohesion in foraging meerkats: follow the moving “vocal hot
spot.” R Soc Open Sci:in review.
86
130. Rymer TL, Pillay N, Schradin C (2016) Resilience to droughts in mammals: a conceptual framework for estimating vulnerability of a single species. Q Rev Biol 91(2):133–176.
131. Vander Wall SB (2008) Foraging success of granivorous rodents : effects of variation in seed and soil water on olfaction. Ecology 79(1):233–241.
132. Gaines KF, Bryan L, Dixon PM (2000) The effects of drought on foraging habitat selection of breeding wood storks in coastal georgia. Waterbirds 23(1):64–73.
133. Janson C (1985) Aggressive competition and individual food consumption in wild brown capuchin monkeys (Cebus apella). Behav Ecol Sociobiol 18(2):125–138.
134. Berenstein L (2010) Responses of Long-Tailed Macaques to drought and fire in eastern Borneo : a preliminary report. Biotropica 18(3):257–262.
135. Lehmann J, Korstjens AH, Dunbar RIM (2007) Fission-fusion social systems as a strategy for coping with ecological constraints: a primate case. Evol Ecol 21(5):613–634.
136. Doran D (1997) Influence of seasonality on activity patterns, feeding behavior, ranging, and
grouping patterns in Tai chimpanzees. Int J Primatol 18(2):183–206.
137. Henzi SP, Byrne RW, Whiten A (1992) Patterns of movement by baboons in the Drakensberg mountains: Primary responses to the environment. Int J Primatol 13(6):601–629.
138. Rendall D, et al. (2000) Proximate factors mediating contact calls in adult female baboons (Papio
cynocephalus ursinus) and their infants. J Comp Psychol 114(1):36–46.
139. Doolan SP, Macdonald DW (1999) Co-operative rearing by slender-tailed meerkats (Suricata suricatta) in the southern Kalahari. Ethology 105(10):851–866.
140. Wyman MT, Rivers PR, Muller C, Toni P, Manser MB Adult meerkats modify close call rate in the
presence of pups. Curr Zool (in Press.
141. Maier MJ (2014) DirichletReg : Dirichlet Regression for compositional data in R. (January):13.
142. Harrison X (2014) Using observation-level random effects to model overdispersion in count data in ecology and evolution. PeerJ 2:616.
143. Conradt L, Krause J, Couzin ID, Roper TJ (2009) “Leading according to need” in self-organizing
groups. Am Nat 173(3):304–312.
144. Rauber R, Clutton-Brock TH, Manser MB Too hungry to cooperate - the influence of drought on sentinel behaviour and vocal coordination in meerkats. (in prep).
145. Rauber R, Manser MB (2017) Discrete call types referring to predation risk enhance the efficiency of the meerkat sentinel system. Sci Rep 7(November 2016):44436.
146. Townsend SW, Zöttl M, Manser MB (2011) All clear? Meerkats attend to contextual information in close calls to coordinate vigilance. Behav Ecol Sociobiol 65(10):1927–1934.
147. Clutton-Brock TH (2016) Mammal Societies (Wiley Blackwell).
148. Franks NR, Dechaume-Moncharmont FX, Hanmore E, Reynolds JK (2009) Speed versus accuracy in decision-making ants: expediting politics and policy implementation. Philos Trans R Soc B-Biological Sci 364(1518):845–852.
149. Ward AJW, Herbert-Read JE, Sumpter DJT, Krause J (2011) Fast and accurate decisions through collective vigilance in fish shoals. Proc Natl Acad Sci U S A 108(6):2312–2315.
150. Sumpter DJT, Pratt SC (2009) Quorum responses and consensus decision making. Philos Trans R Soc Lond B Biol Sci 364(1518):743–53.
151. King AJ, Douglas CMS, Huchard E, Isaac NJB, Cowlishaw G (2008) Dominance and affiliation mediate despotism in a social primate. Curr Biol 18(23):1833–1838.

87
152. Boinski S (1993) Vocal coordination of troop movement among white-faced capuchin monkeys, cebus capucinus. Am J Primatol 30(2):85–100.
153. Fischhoff IR, et al. (2007) Social relationships and reproductive state influence leadership roles in movements of plains zebra, Equus burchellii. Anim Behav 73:825–831.
154. Dunbar RIM, Dunbar P (1988) Maternal time budgets of gelada baboons. Anim Behav 36:970–980.
155. Clutton-Brock TH, et al. (1998) Costs of cooperative behavior in suricates (Suricata suricatta). Proc R Soc London, Ser B 265(1392):185–190.
156. Clutton-Brock TH, et al. (2001) Contributions to cooperative rearing in meerkats. Anim Behav 61:705–710.
157. Turbé A (2006) Foraging decisions and space use in a asocial mammal, the meerkat. Dissertation (PhD thesis, University of Cambridge, Cambridge).
158. Huang CM, Wei FW, Li M, Li YB, Sun RY (2003) Sleeping cave selection, activity pattern and time budget of white-headed langurs. Int J Primatol 24(4):813–824.
159. Fleischmann D, Kerth G (2014) Roosting behavior and group decision making in 2 syntopic bat
species with fission-fusion societies. Behav Ecol 25(5):1240–1247.
160. Segev U, Kigel J, Lubin Y, Tielbörger K (2015) Ant abundance along a productivity gradient: Addressing two conflicting hypotheses. PLoS One 10(7):1–17.
161. Scrucca L (2004) qcc: An R package for quality control charting and statistical process control. R News 4(1):11–17.
162. Gelman A (2008) Growth rates in epidemic models: application to a model for HIV/AIDS progression. Stat Med 27:2865–2873.
163. Lima SL, Dill LM (1990) Behavioral decisions made under the risk of predation - a review and prospectus. Can J Zool 68(4):619–640.
164. Rand AS, Bridarolli ME, Dries L, Ryan MJ (1997) Light levels influence female choice in Tungara frogs: Predation risk assessment? Copeia (2):447–450.
165. Brotherton PNM, et al. (2001) Offspring food allocation by parents and helpers in a cooperative
mammal. Behav Ecol 12(5):590–599.
166. Clutton-Brock TH, et al. (2001) Effects of helpers on juvenile development and survival in meerkats. Science (80- ) 293(5539):2446–2449.
167. Russell AF, et al. (2002) Factors affecting pup growth and survival in co-operatively breeding meerkats Suricata suricatta. J Anim Ecol 71(4):700–709.
168. Bousquet CAH, Manser MB (2011) Resolution of experimentally induced symmetrical conflicts of interest in meerkats. Anim Behav 81(6):1101–1107.
169. Forstmeier W, Wagenmakers E, Parker TH (2016) Detecting and avoiding likely false-positive findings – a practical guide. Biol Rev:000–000.
170. Pelé M, Sueur C (2013) Decision-making theories: Linking the disparate research areas of individual and collective cognition. Anim Cogn 16(4):543–556.
171. Ross-Gillespie A, Kümmerli R (2014) Collective decision-making in microbes. Front Microbiol 5(MAR):1–12.
172. Conradt L (2011) Models in animal collective decision-making: information uncertainty and conflicting preferences. Interface Focus 2(2):226–240.
173. Dyer JRG, Johansson A, Helbing D, Couzin ID, Krause J (2009) Leadership, consensus decision making and collective behaviour in humans. Philos Trans R Soc Lond B Biol Sci 364(1518):781–
789.
88
174. List C, Elsholtz C, Seeley TD (2009) Independence and interdependence in collective decision making: an agent-based model of nest-site choice by honeybee swarms. Philos Trans R Soc B-Biological Sci 364(1518):755–762.
175. Giorgio A (2005) State of Exception (University of Chicago Press, Chicago).
176. Smaldino PE, Schank JC, McElreath R (2013) Increased costs of cooperation help cooperators in the long run. Am Nat 181(4):451–63.
177. Jetz W, Rubenstein DR (2011) Environmental uncertainty and the global biogeography of cooperative breeding in birds. Curr Biol 21:72–78.
178. Lukas D, Clutton-brock T (2017) Climate and the distribution of cooperative breeding in mammals. R Soc Open Sci 4.
179. Rhind SG (2003) Communal nesting in the usually solitary marsupial, Phascogale tapoatafa. J Zool 261:345–351.
180. Krams I, et al. (2010) The increased risk of predation enhances cooperation. Proc Biol Sci
277(1681):513–8.
181. Rands SA, Cowlishaw G, Pettifor RA, Rowcliffe JM, Johnstone RA (2003) Spontaneous emergence of leaders and followers in foraging pairs. Nature 423(6938):432–434.
182. Bednekoff PA, Woolfenden GE (2003) Florida Scrub-Jays (Aphelocoma coerulescens) are sentinels
more when well-fed (even with no kin nearby). Ethology 109(11):895–903.
183. Wright J, Maklakov AA, Khazin V (2001) State-dependent sentinels: an experimental study in the Arabian babbler. Proc R Soc London 268(December 2000):821–826.
184. Silk MJ, Croft DP, Tregenza T, Bearhop S (2014) The importance of fission – fusion social group
dynamics in birds. Int J Avian Sci 156:701–715.
185. Marshall HH, Carter AJ, Rowcliffe JM, Cowlishaw G (2012) Linking social foraging behaviour with individual time budgets and emergent group-level phenomena. Anim Behav 84(6):1295–1305.
186. Klein SL (2003) Parasite manipulation of the proximate mechanisms that mediate social behavior
in vertebrates. Physiol Behav 79(3):441–449.
187. Johnson RW (2002) The concept of sickness behavior: A brief chronological account of four key discoveries. Vet Immunol Immunopathol 87(3–4):443–450.
188. Lopes PC, Block P, König B (2016) Infection-induced behavioural changes reduce connectivity and the potential for disease spread in wild mice contact networks. Sci Rep 6(August):31790.
189. Patterson S, Drewe JA, Pfeiffer DU, Clutton-Brock TH (2017) Social and environmental factors
affect tuberculosis related mortality in wild meerkats. J Anim Ecol 86(3):442–450.