groundwater modeling of atoll islands - weriguam.org · abstract this report contains the...
TRANSCRIPT

AN ATOLL FRESHWATER LENS
ALGEBRAIC MODEL FOR GROUNDWATER MANAGEMENT
IN THE CAROLINE ISLANDS
By
Ryan T. Bailey John W. Jenson Arne E. Olsen
Technical Report No. 120 April 2008

An Atoll Freshwater Lens Algebraic Model for Groundwater Management in the Caroline Islands
by
Ryan T. Bailey John W. Jenson Arne E. Olsen
Water and Environmental Research Institute of the Western Pacific University of Guam, UOG Station, Mangilao, Guam 96923
Technical Report No. 120 April 2008
The work reported herein was funded by the Department of Interior via the Water Resources Research Institute Program of the U.S. Geological Survey (Award No. 01HQPA0010), administered through the Water and Environmental Research Institute of the Western Pacific at the University of Guam. The content of this report does not necessarily reflect the views and policies of the Department of the Interior, nor does the mention of trade names or commercial products constitute their endorsement by the United States Government.

ABSTRACT
This report contains the presentation and explanation of the Atoll Freshwater Lens Algebraic Model. This model was prepared for water resources managers of atoll islands within the Federated States of Micronesia, and is capable of estimating the thickness of the freshwater lens for a variety of geological and weather conditions. The freshwater lens thickness can be estimated by manual calculations, the use of a spreadsheet user interface, or a set of curves. Of principal interest is its use in predicting the fluctuation of the freshwater lens thickness throughout an El Niño event. Users, however, should keep in mind that because the model is based on generalizations of atoll properties, which can vary significantly from one island to another, the model will be applied with greatest success when supplemented or tested against actual data from the island of interest.
i

TABLE OF CONTENTS
ABSTRACT ................................................................................................................................................... i TABLE OF CONTENTS ............................................................................................................................. ii LIST OF FIGURES..................................................................................................................................... iii LIST OF TABLES....................................................................................................................................... iv ACKNOWLEDGEMENTS ......................................................................................................................... v INTRODUCTION ........................................................................................................................................ 1 OBJECTIVES............................................................................................................................................... 1 GROUNDWATER HYDROLOGY OF OCEANIC ISLANDS ............................................................... 2
Freshwater Lens......................................................................................................................................... 2 Hydraulic Head.......................................................................................................................................... 2 Factors Influencing the Hydraulic Head .................................................................................................... 3
GROUNDWATER HYDROLOGY OF ATOLL ISLANDS .................................................................... 3
Recharge to the Aquifer............................................................................................................................. 3 Rainfall Patterns ........................................................................................................................................ 6 Island Width .............................................................................................................................................. 6 Thurber Discontinuity................................................................................................................................ 6 Hydraulic Conductivity of the Upper Aquifer ........................................................................................... 6 Reef Flat Plate ........................................................................................................................................... 7
THE ATOLL FRESHWATER LENS ALGEBRAIC MODEL............................................................... 8
Manual Calculations .................................................................................................................................. 9 Spreadsheet User Interface ...................................................................................................................... 22 Curves...................................................................................................................................................... 30
PUMPING................................................................................................................................................... 31 LIMITATIONS OF THE ALGEBRAIC MODEL.................................................................................. 33 SUMMARY................................................................................................................................................. 33 REFERENCES ........................................................................................................................................... 34
ii

LIST OF FIGURES
Figure 1. Maps of (A) Pingelap Atoll, Pohnpei State, Federated States of Micronesia, and (B) Ulithi Atoll, Yap State, Federated States of Micronesia ........................................................................................... 1
Figure 2 Conceptual model of oceanic island hydrology .............................................................................. 2 Figure 3. Conceptual Model of atoll island hydrogeology, after Ayers and Vacher (1986).......................... 4 Figure 4. The layout of islands on (A) Pingelap Atoll and (B) Sapwuahfik Atoll ........................................ 7 Figure 5. Reef Flat Plate on Mogmog Island, Ulithi Atoll ............................................................................ 7 Figure 6. Climatic and geologic factors included in the Algebraic Model .................................................... 8 Figure 7. Curves to determine the value of the B and Y parameters ........................................................... 10 Figure 8. Curves for determining the value of the K factor ......................................................................... 11 Figure 9. Curve for determining the value for the RFP factor..................................................................... 12 Figure 10. Freshwater lens fluctuation during average seasonal rainfall pattern......................................... 19 Figure 11. Freshwater lens fluctuation during El Niño period ..................................................................... 20 Figure 12. User Interface for the atoll freshwater lens tool spreadsheet...................................................... 23 Figure 13. Entering attributes of island hydrology, geology, and geography.............................................. 24 Figure 14. User interface and results for an Average Lens Thickness analysis........................................... 27 Figure 15. User interface and results for a Seasonal Variation analysis...................................................... 28 Figure 16. User interface and results for an El Niño Period analysis .......................................................... 29 Figure 17. Curves to calculate the thickness of the freshwater lens ............................................................ 30 Figure 18. Side and Top-View of island, to illustrate water volume calculations ....................................... 30
iii
LIST OF TABLES
Table 1 Freshwater Lens Depths ................................................................................................................... 5 Table 2. Average annual rainfall rates across Micronesia ............................................................................. 9 Table 3. WLS: Western Caroline region, Leeward island, Normal seasonal fluctuations ........................... 14 Table 4. ELS: East Caroline region, Leeward island, Normal seasonal fluctuations................................... 14 Table 5. WWS: West. Caroline region, Windward island, Normal seasonal fluctuations............................ 14 Table 6. EWS: East Caroline region, Windward island, Normal seasonal fluctuations............................... 14 Table 7. WLE: West Caroline region, Leeward island, El Niño event ....................................................... 15 Table 8. ELE: East Caroline region, Leeward island, El Niño event ......................................................... 16 Table 9. WWE: West Caroline region, Windward island, El Niño event ................................................... 17 Table 10. EWE: Eastern Caroline region, Windward island, El Niño event .............................................. 18 Table 11. Term Values for Example 1......................................................................................................... 19 Table 12. Term Values for Example 2......................................................................................................... 20 Table 13. Attribute Values used in Examples.............................................................................................. 26
iv
ACKNOWLEDGEMENTS
We wish to thank Stephen Anthony, U.S. Geological Survey, for generously providing data on Ulithi Atoll, and Stephen Gingerich, U.S. Geological Survey, for advice on modeling techniques. Recognition is also extended to Chip Guard of the National Weather Service, Guam, for monthly average rainfall values. Finally, we are deeply grateful to the people from Ulithi and Pingelap Atolls, especially John Rulmal, Iganathio Hapithey, chairman of Council of Tamol, Mario Sukulbech, Chief Yaach, the chief of Fasserai island, and Peter of Ulithi Atoll, and Jack Yakana, Lt. Governor of Pohnpei State, Semensin K. James, Anthon Edward, and Ellis Ernest of Pingelap Atoll for helping with travel logistics, accommodations, and field assistance.
v

INTRODUCTION
Maintaining water supplies on atoll islands is challenging due to their low elevation and relative isolation from nearby communities. Under normal conditions the island communities rely on rain catchment water for domestic purposes such as drinking, cooking, and washing dishes. During times of water stress, however, which occurs during periods of drought associated with an El Niño event, people turn to groundwater to meet the water demand. Determining the depth and size of the freshwater lens is difficult due to the shallowness of the lens, the dual nature of the aquifer system, and tidal forcing on both the lagoon and ocean sides. Adding to this difficulty is the impracticality of performing water resources studies on every atoll due to their remote locations. Figure 1 displays several atolls from the Federated States of Micronesia.
Figure 1. Maps of (A) Pingelap Atoll, Pohnpei State, Federated States of Micronesia, and (B) Ulithi Atoll, Yap State, Federated States of Micronesia
OBJECTIVES
The purpose of this report is to explain the use of the Atoll Freshwater Lens
Algebraic Model, which relates climatic and geologic features of atoll islands to the thickness of the freshwater lens. The model is based on past water resource studies of atoll islands, observations performed during the course of this study, and results of groundwater modeling simulations (Bailey et al., 2008).
1
GROUNDWATER HYDROLOGY OF OCEANIC ISLANDS Freshwater Lens
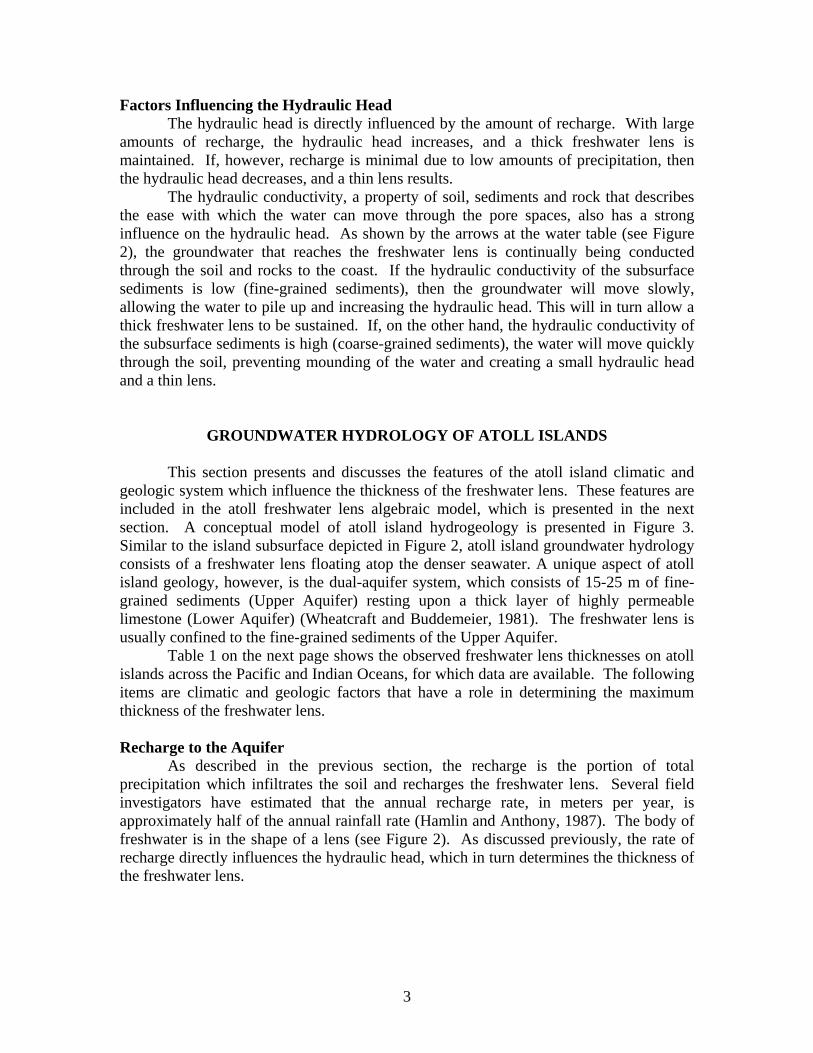
The source of the freshwater in the shallow island subsurface is the precipitation which falls on the ground surface of the island. A large portion of the rainwater is lost to the atmosphere through evapotranspiration. A significant portion of the precipitation is intercepted by the vegetation and subsequently evaporated, while the remainder reaches the ground, infiltrates down through the top layers of soil. A portion of this infiltrated water is taken up by the plant roots as transpiration, while the remainder, under the influence of gravity, percolates down through the soil layers, eventually reaching the part of the soil and rocks which is saturated with freshwater. This body of freshwater floats atop the denser seawater below, and is termed the freshwater lens. This process is summarized by the following equation:
ETPR −= (1)
where R = Recharge to the freshwater lens (meters) P = Precipitation (meters) ET = Evapotranspiration, which includes the precipitation intercepted by the vegetatation, and the water in the soil taken up by plant and tree roots (meters) Hydraulic Head
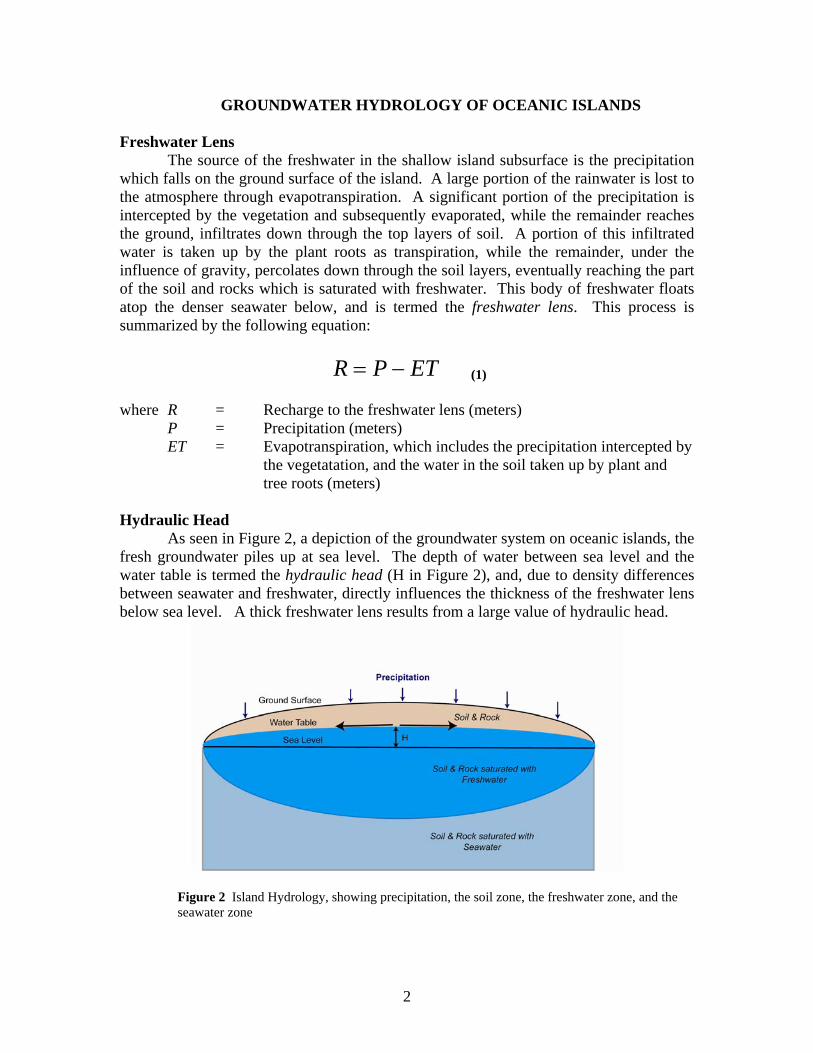
As seen in Figure 2, a depiction of the groundwater system on oceanic islands, the fresh groundwater piles up at sea level. The depth of water between sea level and the water table is termed the hydraulic head (H in Figure 2), and, due to density differences between seawater and freshwater, directly influences the thickness of the freshwater lens below sea level. A thick freshwater lens results from a large value of hydraulic head.
Figure 2 Island Hydrology, showing precipitation, the soil zone, the freshwater zone, and the seawater zone
2
3
Factors Influencing the Hydraulic Head The hydraulic head is directly influenced by the amount of recharge. With large amounts of recharge, the hydraulic head increases, and a thick freshwater lens is maintained. If, however, recharge is minimal due to low amounts of precipitation, then the hydraulic head decreases, and a thin lens results. The hydraulic conductivity, a property of soil, sediments and rock that describes the ease with which the water can move through the pore spaces, also has a strong influence on the hydraulic head. As shown by the arrows at the water table (see Figure 2), the groundwater that reaches the freshwater lens is continually being conducted through the soil and rocks to the coast. If the hydraulic conductivity of the subsurface sediments is low (fine-grained sediments), then the groundwater will move slowly, allowing the water to pile up and increasing the hydraulic head. This will in turn allow a thick freshwater lens to be sustained. If, on the other hand, the hydraulic conductivity of the subsurface sediments is high (coarse-grained sediments), the water will move quickly through the soil, preventing mounding of the water and creating a small hydraulic head and a thin lens.
GROUNDWATER HYDROLOGY OF ATOLL ISLANDS
This section presents and discusses the features of the atoll island climatic and geologic system which influence the thickness of the freshwater lens. These features are included in the atoll freshwater lens algebraic model, which is presented in the next section. A conceptual model of atoll island hydrogeology is presented in Figure 3. Similar to the island subsurface depicted in Figure 2, atoll island groundwater hydrology consists of a freshwater lens floating atop the denser seawater. A unique aspect of atoll island geology, however, is the dual-aquifer system, which consists of 15-25 m of fine-grained sediments (Upper Aquifer) resting upon a thick layer of highly permeable limestone (Lower Aquifer) (Wheatcraft and Buddemeier, 1981). The freshwater lens is usually confined to the fine-grained sediments of the Upper Aquifer.
Table 1 on the next page shows the observed freshwater lens thicknesses on atoll islands across the Pacific and Indian Oceans, for which data are available. The following items are climatic and geologic factors that have a role in determining the maximum thickness of the freshwater lens.
Recharge to the Aquifer
As described in the previous section, the recharge is the portion of total precipitation which infiltrates the soil and recharges the freshwater lens. Several field investigators have estimated that the annual recharge rate, in meters per year, is approximately half of the annual rainfall rate (Hamlin and Anthony, 1987). The body of freshwater is in the shape of a lens (see Figure 2). As discussed previously, the rate of recharge directly influences the hydraulic head, which in turn determines the thickness of the freshwater lens.

Figure 3. Conceptual Model of atoll island hydrogeology, after Ayers and Vacher (1986). The principal controlling features on the freshwater lens are (1) the width of the islands, (2) the recharge to the freshwater lens, (3) the hydraulic conductivity of the Holocene sediments, (4) the contact between the upper and lower aquifers, and (5) the reef flat plate.
4

5
Table 1 Freshwater Lens Depths
Island / Location Atoll Region Source Location on Atoll
Width m
Thickness m
Cantonment Diego Garcia Central Indian PRC Toups, 1983 Leeward 2200 20 AO NW Diego Garcia Central Indian PRC Toups, 1983 Leeward 1150 15 AO SE Diego Garcia Central Indian PRC Toups, 1983 Leeward 1300 20
Home Island Cocos East Indian Falkland, 1994 Offset 775 8 WI Northern Cocos East Indian Falkland, 1994 Leeward 800 14
WI 1 Cocos East Indian Falkland, 1994 Leeward 800 15 WI 6 Cocos East Indian Falkland, 1994 Leeward 500 15 WI 8 Cocos East Indian Falkland, 1994 Leeward 400 12
WI 22 Cocos East Indian Falkland, 1994 Leeward 270 7 South Island Cocos East Indian Falkland, 1994 Windward 1000 11
Falalop Ulithi FSM Anthony, 1997 Offset 950 5 Khalap Mwoakilloa FSM Anthony, 1996a Windward 425 6 Ngatik Sapwuahfik FSM Anthony, 1996b Leeward 900 20 Deke Pingelap FSM Ayes and Vacher, 1986 Windward 400 4
Pingelap Pingelap FSM Anthony, 1996c Leeward 750 16 Laura Majuro Marshall Islands Hamlin and Anthony, 1987 Leeward 1200 14 to 22
Kwajelein Kwajelein Marshall Islands Hunt and Peterson, 1980 Offset 600 10 to 18 Roi-Namur Kwajelein Marshall Islands Gingerich, 1992 Windward 750 5 to 7
Eneu Bikini Marshall Islands Peterson, 1997 Offset 400 5 to 10 Bikini Bikini Marshall Islands Peterson, 1997 Windward 600 < 2 Enjebi Enewetak Marshall Islands Buddemeier and Holladay, 1977 Windward 1000 < 2
Matabou Nonouti Gilbert Island Falkland, 2003 Offset 375 5 Buariki Tarawa Gilbert Island Jacobson and Taylor, 1981 Offset 1200 29 Buota Tarawa Gilbert Island Lloyd et al, 1980 Offset 650 23 Bonriki Tarawa Gilbert Island Falkland, 1992 Windward 1200 23 NZ 4 Christmas Kiribati Falkland, 1983 Leeward 1500 14 NZ 2 Christmas Kiribati Falkland, 1983 Leeward 1500 17

Rainfall Patterns The rate of precipitation, and thus the rate of recharge, is constantly changing in
day-to-day fluctuations (Lloyd et al., 1980). There are also long-term trends, such as the annual trend of wet-season and dry-season, and also periods of extreme weather patterns such as El Niño periods, which can bring long periods of drought. For small islands these periods of drought can sometimes exhaust all of the fresh groundwater. Island Width
Larger islands are better able to sustain a thicker freshwater lens than smaller ones. Islands less than 200 meters wide seldom have a usable lens (Falkland, 1994). Thurber Discontinuity
The upper and lower aquifers are divided by a solution discontinuity (Thurber et al., 1965), often referred to as the “Thurber Discontinuity” by island hydrogeologists (Peterson, 1997; Woodroffe and Falkland, 1997; Vacher, 1997). Usually located 15 to 25 meters below sea level (Wheatcraft and Buddemeier, 1981; Hamlin and Anthony, 1987; Anthony, 1997), it imposes a limiting depth on the growth of the freshwater lens. The lower aquifer is very porous and highly permeable, so freshwater which is pushed below the Thurber Discontinuity is rapidly mixed with the seawater. As seen in Table 1, not all islands have a freshwater lens which extends to the Thurber Discontinuity. The influence of the Thurber Discontinuity only becomes important for islands which can sustain a freshwater lens thick enough to reach it. Hydraulic Conductivity of the Upper Aquifer
As discussed previously, the hydraulic conductivity of the subsurface sediments directly influences the hydraulic head, which in turn determines the thickness of the lens. In this way the coarseness of the sediments in the upper aquifer plays a large role in the ability of the island to maintain a freshwater lens. Fine sediments have an increased ability to retain the freshwater, whereas coarse sediments do not retain water very well. Islands with fine sediments typically have a much thicker lens than similar islands with coarse sediments. Field work has shown that islands on the windward side of an atoll, which receives the brunt of the high-energy waves driven by the trade winds, possess much coarser sediments than those on the leeward side (Anthony, 1997; Spennemann, 2006) (Figure 3). As a result, islands located on leeward portions of atolls tend to have much thicker freshwater lenses than those located on the windward portion (see Table 1).
A
6

B
Figure 4. The layout of islands on (A) Sapwuahfik Atoll and (B) Pingelap Atoll. Both are located in the state of Pohnpei, Federated States of Micronesia. In both atolls, the leeward island (Pingelap Island; Ngatik Island) have larger surface areas and contain much thicker freshwater lens than the windward islands. Islands exposed to the prevailing winds contain subsurface sediments which have much higher hydraulic conductivity than those found on leeward islands. Reef Flat Plate
The reef flat plate extends from the ocean-side reef to the interior of the island (see Figure 2), and has been observed on numerous atolls (Cox, 1951; Buddemeier and Holladay, 1977; Ayers and Vacher, 1986). This feature was observed on Ulithi and Pingelap Atolls during this study. The reef plate acts as a confining layer to the freshwater, forcing the water to flow under the plate to be discharged at the reef, as well as along fractures in the plate. As shown in Figure 4, residents of atoll islands sometimes punch through the plate to access the water.
Figure 5. Reef Flat Plate on Mogmog Island, Ulithi Atoll. The residents must punch through the plate to reach the fresh groundwater.
7
THE ATOLL FRESHWATER LENS ALGEBRAIC MODEL
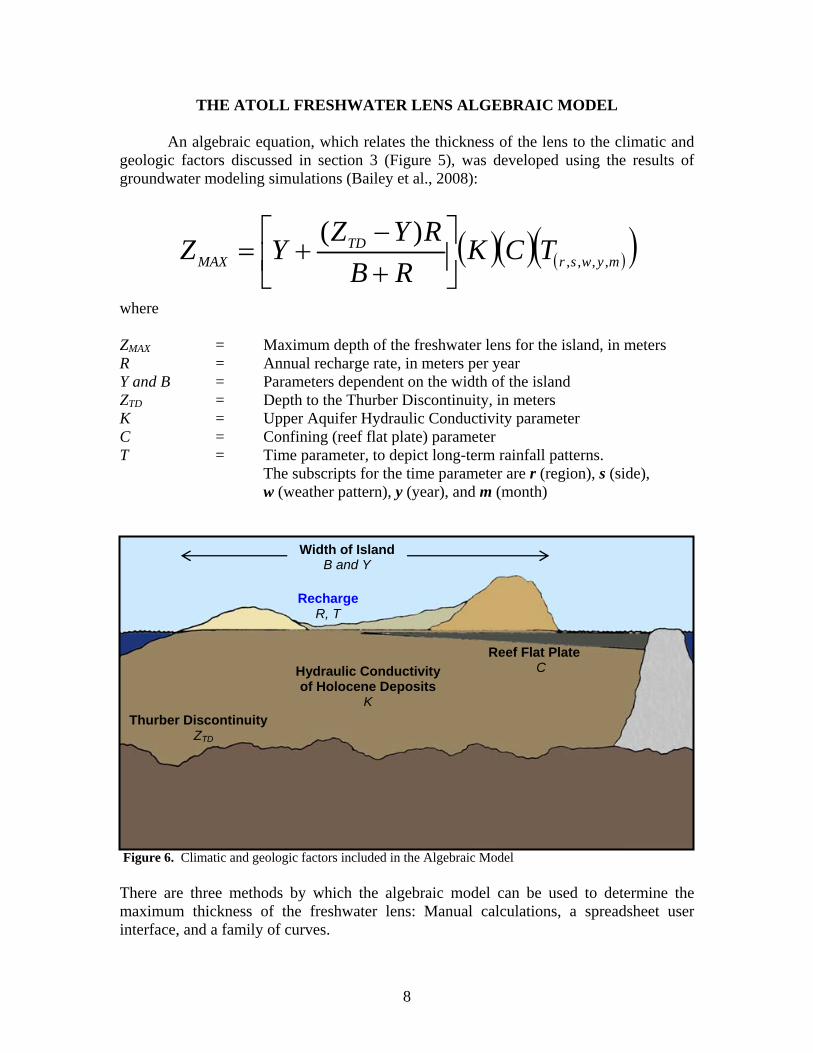
An algebraic equation, which relates the thickness of the lens to the climatic and geologic factors discussed in section 3 (Figure 5), was developed using the results of groundwater modeling simulations (Bailey et al., 2008):
( )( ) ( )( )mywsrTD
MAX TCKRB
RYZYZ ,,,,
)(⎥⎦
⎤⎢⎣
⎡+−
+=
where
ZMAX = Maximum depth of the freshwater lens for the island, in meters R = Annual recharge rate, in meters per year Y and B = Parameters dependent on the width of the island ZTD = Depth to the Thurber Discontinuity, in meters K = Upper Aquifer Hydraulic Conductivity parameter C = Confining (reef flat plate) parameter T = Time parameter, to depict long-term rainfall patterns.
The subscripts for the time parameter are r (region), s (side), w (weather pattern), y (year), and m (month)
Figure 6. Climatic and geologic factors included in the Algebraic Model
Recharge R, T
Width of Island B and Y
Reef Flat Plate C Hydraulic Conductivity
of Holocene Deposits K
Thurber Discontinuity ZTD
There are three methods by which the algebraic model can be used to determine the maximum thickness of the freshwater lens: Manual calculations, a spreadsheet user interface, and a family of curves.
8

Manual Calculations
R Parameter (Recharge)
The R value, the average annual recharge in meters per year, is determined from rainfall data for the atoll. If rainfall data are not available for a given island, then data from nearby islands may be used, with the understanding that it might differ. Table 2 contains average annual rainfall values for islands across Micronesia. The R value is normally calculated as half of the average annual rainfall value.
Table 2. Average annual rainfall rates across Micronesia
Island State Average Annual Rainfall m yr-1
Chuuk Chuuk 3.41 Lukunoch Chuuk 3.41 Polowat Chuuk 3.07 Pohnpei Pohnpei 4.77 Kapingamarangi Pohnpei 2.80 Metalanim Pohnpei 4.80 Nukuoro Pohnpei 3.79 Paies-Kitti Pohnpei 4.80 Palikir Pohnpei 4.80 Pingelap Pohnpei 4.51 Pohnpei WSO Pohnpei 4.80 Yap Yap 3.05 Ulithi Yap 2.59 Woleai Atoll Yap 3.53 Kwajelein Marshalls 2.59 Majuro Marshalls 3.34 Ailinglapalap Marshalls 2.97 Utirik Marshalls 2.20 Wotje Marshalls 2.46
Source: Chip Guard, National Weather Service, Guam
9

B and Y Parameters (Island Width)
The B and Y parameters are dependent on the width of the island across the point on the island where the lens thickness is to be approximated. Figure 6 contains the curves used to estimate values for these parameters. To use the curves:
1. Determine the width of the atoll island in question. Locate this width on the x axis.
2. From this point, draw a vertical line to the Y factor curve (dotted curve). 3. From this point, draw a horizontal line to the y-axis to determine the Y
factor value. Use this value in the equation. 4. Repeat steps 1-3 for the B factor.
Figure 7. Curves to determine the value of the B and Y parameters. The parameters are dependent upon the width of the island.
10

ZTD Parameter (Depth to the Thurber Discontinuity) The value of the ZTD parameter is the actual depth, in meters, to the Thurber
Discontinuity. The average depth found from field investigations is approximately 15 to 17.5 meters. It is recommended that this value is used in the calculations, with 15 meters providing the most conservative estimate of freshwater lens thickness. K Parameter (Hydraulic conductivity of the Upper Aquifer)
The K factor is determined by using the curves in Figure 7. If the island is located on the leeward portion of the atoll, use a hydraulic conductivity value of 50 m / day in the chart. If it is located within the windward portion, use 400 m / day. To use the curves:
1. Determine the width of the atoll island in question. Locate this width on the x axis.
2. Starting at this value, Draw a vertical line to the curve corresponding to the hydraulic conductivity of the Holocene sediments for the atoll in question.
3. From this point, draw a horizontal line to the y-axis to determine the hydraulic conductivity factor, K. Use this factor value in the equation.
If the island is located between the windward and leeward portions, use a value between 50 and 400 m / day. If the island is closer to the leeward portion of the atoll, use a value closer to 50 m / day. If it is closer to the windward portion, use a value close to 400 m / day.
Figure 8. Curves for determining the value of the K factor
11

C Parameter (Reef Flat Plate) The C factor is the least significant term in the equation. Under most conditions,
the value is 1, and the curve does not need to be used. However, if the lens thickness is being determined for a portion of the island where the reef flat plate is not present, the C factor will have a value slightly less than 1, thus decreasing the lens thickness by a small amount. To use the C curve, seen in Figure 8:
1. Determine the width of the atoll island in question. Locate this width on the x axis.
2. From this point, draw a vertical line to the C factor curve 3. From this point, draw a horizontal line to the y-axis to determine the C
factor value. Use this value in the equation.
Figure 9. Curve for determining the value for the RFP factor
12

13
T Parameter (Time) Tables 3-10 contain the values of the time parameter, for both average seasonal
conditions and El Niño events. The determination of the value of the time parameter is dependent on five characteristics:
r (region). Either W for Western Caroline region (Yap data) or E for Eastern Caroline region (Pohnpei data)
s (side). Either L for Leeward or W for Windward.
w (weather Pattern). Either S for Seasonal Variation or E for El Niño.
y (year). For seasonal variation this term is always 1. For an El Niño event it is 1, 2, or 3; 1 being the year of the El Niño(El Niño), 2 being the year following the El Niño(Post-El Niño), during which Micronesia normally experiences a severe drought, and 3 being the year of recovery following the drought (Recover).
m (month). There is a time factor value for every month of the year. This allows the fluctuation of the lens thickness to be observed throughout the year.
To determine a time parameter value for a given month, each of the five terms must be assigned a value. Tables 3-6 contain the time parameter values for seasonal variation rainfall patterns, and tables 7-10 contain the time parameters values for El Niño periods. The values for the El Niño were determined using rainfall data from the regions of Yap and Pohnpei for the years 1997-1999. Each table has a label consisting of three letters. The first letter represents the region (Western Caroline or Eastern Caroline), the second represents the side (leeward or windward), and the third represents the type of rainfall pattern (seasonal or El Niño). Each table has rows for the month and year and columns for the width of the island. The time parameter value is actually a percentage of the expected steady-state thickness. For example, if the value for a certain month is 0.75, than the thickness of the lens during that month is 75% of the steady-state thickness value. The process of determining the parameter values will now be demonstrated.

Table 5. WWS: West. Caroline region, Windward island, Normal seasonal fluctuations
14
Table 3. WLS: Western Caroline region, Leeward island, Normal seasonal fluctuations
MONTH
200
ISLAND WIDTH
400
600 Jan 0.8857 0.7699 0.9020 Feb 0.8246 0.7738 0.9174 Mar 0.6841 0.7188 0.9039 Apr 0.6402 0.7064 0.9063 May 0.5893 0.7139 0.9256 Jun 0.6178 0.7339 0.9447 Jul 0.6564 0.6959 0.8942
Aug 0.7164 0.6912 0.8616 Sep 0.8596 0.7459 0.8871 Oct 0.9173 0.7495 0.8887 Nov 0.9148 0.7603 0.9003 Dec 0.9135 0.7699 0.9327
Table 4. ELS: East Caroline region, Leeward island, Normal seasonal fluctuations
MONTH
200
ISLAND WIDTH
400
600 Jan 1.0534 1.1152 0.9312 Feb 1.0384 1.0996 0.9263 Mar 0.9351 1.0397 0.9239 Apr 0.9289 0.9689 0.9238 May 0.9682 0.9842 0.9249 Jun 1.0377 1.0460 0.9257 Jul 1.0383 1.0678 0.9240
Aug 1.0439 1.1012 0.9250 Sep 1.0588 1.1088 0.9284 Oct 1.0488 1.0944 0.9331 Nov 1.0386 1.0869 0.9346 Dec 1.0294 1.0810 0.9358
ISLAND WIDTH
MONTH 200 400 600 JAN 0.7331 1.0261 0.7552 FEB 0.4470 0.8602 0.7419 MAR 0.2964 0.6396 0.6478 APR 0.0998 0.5707 0.6194 MAY 0.0000 0.5413 0.6048 JUN 0.0000 0.5895 0.6261 JUL 0.0000 0.6934 0.6922 AUG 0.1949 0.7987 0.7620 SEP 0.2867 0.7502 0.7874 OCT 0.7128 0.9192 0.8138 NOV 0.8289 1.0217 0.8200 DEC 0.6429 1.0458 0.8053
Table 6. EWS: East Caroline region, Windward island, Normal seasonal fluctuations
MONTH
200
ISLAND WIDTH
400
600 Jan 0.6978 1.2256 1.1936 Feb 0.9247 1.2002 1.1960 Mar 0.9539 1.1082 1.1039 Apr 0.9236 1.0504 1.0938 May 0.5186 1.1172 1.0928 Jun 0.7927 1.2270 1.1499 Jul 1.1914 1.2537 1.1717
Aug 1.2363 1.2788 1.1883 Sep 1.2357 1.2877 1.2288 Oct 1.1936 1.2350 1.2282 Nov 1.1338 1.2134 1.2160 Dec 1.0383 1.1650 1.1863
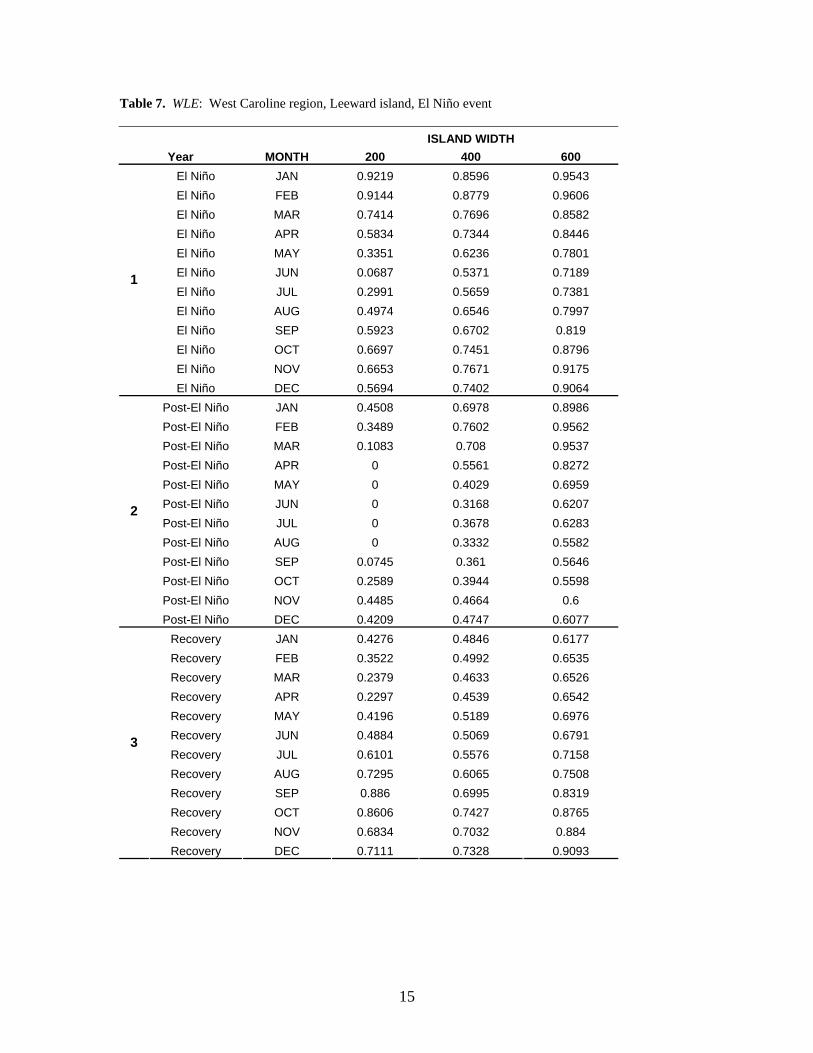
Table 7. WLE: West Caroline region, Leeward island, El Niño event ISLAND WIDTH
Year MONTH 200 400 600 El Niño JAN 0.9219 0.8596 0.9543 El Niño FEB 0.9144 0.8779 0.9606 El Niño MAR 0.7414 0.7696 0.8582 El Niño APR 0.5834 0.7344 0.8446 El Niño MAY 0.3351 0.6236 0.7801 El Niño JUN 0.0687 0.5371 0.7189 El Niño JUL 0.2991 0.5659 0.7381 El Niño AUG 0.4974 0.6546 0.7997 El Niño SEP 0.5923 0.6702 0.819 El Niño OCT 0.6697 0.7451 0.8796 El Niño NOV 0.6653 0.7671 0.9175
1
El Niño DEC 0.5694 0.7402 0.9064 Post-El Niño JAN 0.4508 0.6978 0.8986 Post-El Niño FEB 0.3489 0.7602 0.9562 Post-El Niño MAR 0.1083 0.708 0.9537 Post-El Niño APR 0 0.5561 0.8272 Post-El Niño MAY 0 0.4029 0.6959 Post-El Niño JUN 0 0.3168 0.6207 Post-El Niño JUL 0 0.3678 0.6283 Post-El Niño AUG 0 0.3332 0.5582 Post-El Niño SEP 0.0745 0.361 0.5646 Post-El Niño OCT 0.2589 0.3944 0.5598 Post-El Niño NOV 0.4485 0.4664 0.6
2
Post-El Niño DEC 0.4209 0.4747 0.6077 Recovery JAN 0.4276 0.4846 0.6177 Recovery FEB 0.3522 0.4992 0.6535 Recovery MAR 0.2379 0.4633 0.6526 Recovery APR 0.2297 0.4539 0.6542 Recovery MAY 0.4196 0.5189 0.6976 Recovery JUN 0.4884 0.5069 0.6791 Recovery JUL 0.6101 0.5576 0.7158 Recovery AUG 0.7295 0.6065 0.7508 Recovery SEP 0.886 0.6995 0.8319 Recovery OCT 0.8606 0.7427 0.8765 Recovery NOV 0.6834 0.7032 0.884
3
Recovery DEC 0.7111 0.7328 0.9093
15

Table 8. ELE: East Caroline region, Leeward island, El Niño event ISLAND WIDTH
Year MONTH 200 400 600 El Niño JAN 1.0529 1.109 0.8361 El Niño FEB 0.8252 0.8777 0.8252 El Niño MAR 0.7719 0.8103 0.7868 El Niño APR 0.7049 0.7661 0.8753 El Niño MAY 0.8799 0.8833 0.891 El Niño JUN 0.8781 0.9399 0.9011 El Niño JUL 0.8368 1.018 0.9151 El Niño AUG 0.8927 1.0689 0.9319 El Niño SEP 0.9592 1.1094 0.9353 El Niño OCT 0.9772 1.1242 0.9305 El Niño NOV 0.9139 1.0837 0.9302
1
El Niño DEC 0.8634 1.1017 0.9271 Post-El Niño JAN 0.7354 1.0681 0.9245 Post-El Niño FEB 0.5759 1.0795 0.8627 Post-El Niño MAR 0.3131 0.8979 0.7092 Post-El Niño APR 0.0701 0.6395 0.5818 Post-El Niño MAY 0 0.4637 0.5999 Post-El Niño JUN 0.1189 0.4919 0.6347 Post-El Niño JUL 0.2747 0.5313 0.6254 Post-El Niño AUG 0.2295 0.5001 0.6578 Post-El Niño SEP 0.3165 0.5426 0.66 Post-El Niño OCT 0.3175 0.529 0.6818 Post-El Niño NOV 0.3822 0.5454 0.7191
2
Post-El Niño DEC 0.4863 0.5904 0.7847 Recovery JAN 0.6239 0.6572 0.8241 Recovery FEB 0.6798 0.6998 0.877 Recovery MAR 0.8004 0.7846 0.8881 Recovery APR 0.9095 0.8202 0.9233 Recovery MAY 1.0107 0.8979 0.9159 Recovery JUN 0.9534 0.9168 0.9123 Recovery JUL 0.9428 0.9816 0.9164 Recovery AUG 0.9326 1.0397 0.9031 Recovery SEP 0.8143 1.0067 0.9066 Recovery OCT 0.8024 0.9819 0.8591 Recovery NOV 0.6834 0.865 0.818
3
Recovery DEC 0.6427 0.7879 0.8749
16

Table 9. WWE: West Caroline region, Windward island, El Niño event ISLAND WIDTH
Year MONTH 200 400 600 El Niño JAN 0.3454 0.9215 0.802 El Niño FEB 0 0.7508 0.6522 El Niño MAR 0 0.6126 0.5004 El Niño APR 0 0.3187 0.3177 El Niño MAY 0 0.0168 0.1348 El Niño JUN 0 0 0.2299 El Niño JUL 0 0 0.374 El Niño AUG 0 0.2177 0.4149 El Niño SEP 0 0.315 0.4786 El Niño OCT 0 0.4297 0.4876 El Niño NOV 0 0.398 0.4012
1
El Niño DEC 0 0.2598 0.3147 Post-El Niño JAN 0 0.1222 0.2934 Post-El Niño FEB 0 0 0.148 Post-El Niño MAR 0 0 0 Post-El Niño APR 0 0 0 Post-El Niño MAY 0 0 0 Post-El Niño JUN 0 0 0 Post-El Niño JUL 0 0 0.0493 Post-El Niño AUG 0 0 0.0716 Post-El Niño SEP 0 0 0.1492 Post-El Niño OCT 0 0.1009 0.2879 Post-El Niño NOV 0 0.3168 0.2681
2
Post-El Niño DEC 0 0.2616 0.278 Recovery JAN 0 0.2522 0.2646 Recovery FEB 0 0.1871 0.1765 Recovery MAR 0 0.072 0.1583 Recovery APR 0 0.0336 0.2722 Recovery MAY 0 0.2027 0.3281 Recovery JUN 0 0.2689 0.3924 Recovery JUL 0 0.3966 0.4604 Recovery AUG 0.278 0.4959 0.5733 Recovery SEP 0.1903 0.6816 0.5686 Recovery OCT 0 0.6378 0.4405 Recovery NOV 0 0.384 0.4618
3
Recovery DEC 0 0.3419 0.4755
17

Table 10. EWE: Eastern Caroline region, Windward island, El Niño event ISLAND WIDTH
Year MONTH 200 400 600 El Niño JAN 0.700 1.167 1.191 El Niño FEB 0.075 0.796 0.943 El Niño MAR 0.162 0.724 0.851 El Niño APR 0.000 0.590 0.745 El Niño MAY 0.319 0.806 0.922 El Niño JUN 0.266 0.776 0.937 El Niño JUL 0.089 0.685 0.908 El Niño AUG 0.000 0.705 0.963 El Niño SEP 0.210 0.816 1.013 El Niño OCT 0.177 0.817 1.008 El Niño NOV 0.211 0.748 0.961
1
El Niño DEC 0.000 0.609 0.923 Post-El Niño JAN 0.000 0.420 0.802 Post-El Niño FEB 0.000 0.208 0.679 Post-El Niño MAR 0.000 0.000 0.442 Post-El Niño APR 0.000 0.000 0.250 Post-El Niño MAY 0.000 0.000 0.149 Post-El Niño JUN 0.000 0.000 0.223 Post-El Niño JUL 0.000 0.122 0.314 Post-El Niño AUG 0.000 0.094 0.284 Post-El Niño SEP 0.000 0.169 0.363 Post-El Niño OCT 0.000 0.156 0.359 Post-El Niño NOV 0.000 0.229 0.412
2
Post-El Niño DEC 0.064 0.359 0.511 Recovery JAN 0.286 0.556 0.649 Recovery FEB 0.142 0.624 0.718 Recovery MAR 0.380 0.753 0.830 Recovery APR 0.799 0.955 0.951 Recovery MAY 0.782 1.030 1.000 Recovery JUN 0.289 0.875 0.957 Recovery JUL 0.377 0.873 0.957 Recovery AUG 0.144 0.830 0.956 Recovery SEP 0.031 0.701 0.852 Recovery OCT 0.062 0.708 0.847 Recovery NOV 0.000 0.611 0.739
3
Recovery DEC 0.000 0.551 0.690
18

Examples Example 1: Seasonal Variation The manager wants to know the lens thickness for a windward atoll island located near Yap during the month of September for a regular year of rainfall. The width of the island is 400 m. Table 11 shows the process of determining which time parameter table to use. Table 11. Term Values for Example 1
Term Value
Term Value Indices Table
Western Caroline
W Region Windward W WWS Side
Weather Pattern Seasonal S Year 1
Month September
Thus, the appropriate table is the one labeled WWS (Table 5). Go to the column labeled 400 m. Go down the column to the row for September, and read off the value. This is the value to use for the T term in the algebraic equation. If the fluctuation of the lens throughout the year is desired, perform the above procedure for all twelve months in the table. Figure 9 presents the fluctuation of the freshwater lens thickness during a typical year of rainfall.
Figure 10. Freshwater lens fluctuation during average seasonal rainfall pattern
19

Example 2: El Niño Period A water resource manager wants to predict the thickness of the lens for a leeward atoll island located in Pohnpei state for the month of April during the year of drought following an El Niño. The width of the island is 600 m. Table 12 shows the process of determining which time parameter table to use. Table 12. Term Values for Example 2
Term Value
Term Value Indices Table
Eastern Caroline
E Region Leeward L ELE Side El Niño E Weather Pattern
Year 2 Month April
Thus, the appropriate table is the one labeled ELE (Table 8). Go to the column labeled 600 m. Go down the column to the year 2 (Post-El Niño), and read off the value for April. This is the value to use for the T term in the algebraic equation. If the fluctuation of the lens throughout all three years of the El Niño event is desired, perform the above procedure for all thirty-six months in the table. Figure 10 presents the fluctuation of the freshwater lens thickness during an El Niño event.
Figure 11. Freshwater lens fluctuation during El Niño period
20

Further Considerations The conditions of the atoll island in question may not be addressed with the tables for fluctuating rainfall patterns. The following rules may be applied in such cases:
1. If the width of the island is greater than 600 m, then use the parameter value in the 600 m column of the tables.
2. If the width of the island is less than 600 m and is not exactly 200 m, 400 m, or 600 m in width, choose the width closest to the island under consideration.
3. For islands within the Chuuk region, an appropriate time parameter value can be found by averaging the values from the Western Caroline and Eastern Caroline regions.
4. If the island is located in between the positions on the atoll accounted for in the tables (leeward and windward), average the given values or interpolate between them.
5. The values in Tables 7-10 are for an extreme El Niño event, since the El Niño experienced in 1997 was particularly strong and the drought in 1998 particularly intense. Using Tables 7-10 will therefore produce lens thicknesses which occur during a strong El Niño event. When using these tables for future El Niño events, the values may need to be scaled in order to reflect the current situation. For example, if the current El Niño is weak compared to the once experienced during 1997-1998, the values in Table 7-10 may need to be increased a few tenths of a point, for example from 0.25 to 0.45. The amount of increase for each value will be determined based on the judgment of the user and knowledge of the intensity of the El Niño event.
21

22
Spreadsheet User Interface The process described in section 5.1 has been automated by use of an Excel
spreadsheet program. This spreadsheet file is contained on the CD which accompanies this technical report, and is titled Atoll Freshwater Lens Spreadsheet Tool. Overview of Spreadsheet
The spreadsheet consists of 4 sheets: Sheet 1: Enter Data. This is the sheet that you will be working with. Sheet 2: Parameters. This sheet contains the tables for the B, Y, K, and C parameters. Sheet 3: Seasonal. This sheet contains the 4 tables for the seasonal rainfall pattern, as presented in section 5.1 (Tables 3-6). Sheet 4: El Niño. This sheet contains the 4 tables for the El Niño rainfall pattern, as presented in section 5.1 (Tables 7-10).
The user interface, on the Enter Data sheet, is presented in Figure 11. There are 5 main parts to the interface:
A Controls which allow the user to specify the attributes of the island hydrology, geology, and geography
B The Compute Thickness button, which takes the values specified in the controls and starts a Visual Basics for Applications program. This program uses the attributes entered to pull the necessary values from the tables contained in the Parameters, Seasonal, and El Niño sheets. The program then computes the thickness of the freshwater lens using the algebraic model.
C Output of the parameter values used in the algebraic model and the resulting steady-state lens thickness.
D Output of the thickness of the lens through the months of a seasonal or El Niño period.
E Display of the fluctuation of the lens through time for either a seasonal period or an El Niño Period.
The user interface was designed to fit on the typical computer monitor screen, in order to eliminate scrolling up and down to view the controls or the display. Detailed use of these parts of the user interface will be explained in the next section.

23
Figure 12. User Interface for the atoll freshwater lens tool spreadsheet. Section A allows the user to enter island attributes, B runs the program which computes the lens thickness, C outputs the algebraic model parameter values calculated from the island attributes, D outputs the thickness of the lens through time, and E displays the resulting curve.
C
D
A B
E

Enter Parameter Values Figure 12 presents the controls used to enter the hydrological, geological, and
geographical attributes of the atoll island, along with the default values for each control. These attributes correspond to the parameters in the algebraic model.
Figure 13. Entering attributes of island hydrology, geology, and geography The use of the controls is as follows:
1. Analysis Type There are three types of analyses possible: Average Lens Thickness, where only the steady-state thickness of the lens will be computed; Seasonal Variation, where the thickness of the lens will be computed for each month of an average year of rainfall; and El Niño Period, where the thickness of the lens will be computed for each month during the 3-year El Niño period. If the Average Lens Thickness option is selected, as in Figure 12, the Geographic Region, Location of Island, and Time Frame controls will be grayed out.
2. Annual Rainfall
The annual rainfall, in meters per year, for the geographic region in which the atoll resides. If the rainfall rate is not known for the year in question, use the average annual rainfall values (see Table 2). The value entered in the edit field will be divided in half to produce the recharge value R used in the algebraic model.
3. Island Width
The width of the island, in meters. Atoll islands rarely have a uniform width; thus, use the width of the island at the point of the island in question; or, if simply a maximum lens thickness value is desired for the entire island, enter the maximum width of the island. Width values range from 150 to 1200 meters. The width of the island is used to determine the values of the B and Y parameters in the algebraic model, using the table on the Parameters sheet.
24

4. Hydraulic Conductivity The hydraulic conductivity, in meters per day, of the Holocene sediments. Values range from 25 to 400. If the hydraulic conductivity is not known, use the following rules of thumb:
• Islands located on the leeward portion of the atoll normally have a hydraulic conductivity of 50 meters per day.
• Islands located on the windward portion of the atoll normally have a hydraulic conductivity of 400 m per day.
• Islands located between the leeward and windward portions of the atoll will have hydraulic conductivities varying between 50 and 400 m. The exact value will depend on its proximity to either the leeward section or the windward section.
The hydraulic conductivity value is used to determine the value of the K parameter in the algebraic model, using the table on the Parameters sheet.
5. Reef Flat Plate
If the reef flat plate is present in the area of concern on the island, select Yes. If not, select No. This selection is used to determine the value of the value of the C parameter in the algebraic model, using the table on the Parameters sheet. The plate serves to confine the groundwater and slightly thicken the lens, especially for smaller islands.
6. Thurber Discontinuity
The depth, in meters, to the contact between the upper (Holocene) and lower (Pleistocene) aquifers. If the depth is known, select Known, which will activate the edit field to the right of it and allow you to enter the depth. Otherwise, select Unknown, which will place the value of 17.5 in the edit field, which is the average depth from field investigations. The value is the ZTD used in the algebraic model.
7. Geographic Region, Location of Island, and Time Frame
These controls only become active when either the Seasonal Variation or El Niño Period options are selected in the Analysis Type control. For the Geographic Region control, select either Western Caroline Region or Eastern Caroline Region. For the Location of Island control the options are Leeward, and Windward, depending where the island is located on the atoll. The Time Frame control only becomes active when the El Niño Period option is selected in the Analysis Type control. The options are to display the first year of the El Niño period, the second year, the third year, or the entire 3-year period. If the Seasonal Variation option is selected in the Analysis Type control, the lens thickness fluctuation over an entire year will be displayed, and there is no need for the Time Frame control.
25

Compute the Lens Thickness Once all the attributes are entered in the control, the Compute Thickness button is
pushed. This button runs the program which: 1. Retrieves the attributes placed in the controls 2. Uses the values placed in the Annual Rainfall, Island Width, Hydraulic
Conductivity, Reef Flat Plate, and Thurber Discontinuity controls to pull the appropriate parameter values from the tables on the Parameters sheet and calculate the steady-state thickness of the lens using the algebraic model.
3. Uses the values placed in the Geographic Location, Location of Island, and Time Frame controls to pull values from the tables on the Seasonal and El Niño sheets to modify the steady-state thickness during the months of analysis.
4. Outputs the results onto the user interface and displays a curve which represents the fluctuation of the lens through time.
Results
The results of the program are output to the user interface. The algebraic model parameter values, calculated from the attribute values placed in the controls, are output in section C in Figure 11. The maximum steady-state thickness of the lens, ZMAX, is also output. If either the Seasonal Variation or El Niño Period analysis options were selected, the calculated lens thickness for each month will be output in the columns under the Month and Thickness headings on the user interface. These results are display graphically in the chart area on the user interface. If the Average Lens Thickness analysis option is selected, only the ZMAX value will be displayed. Examples
The following examples show the calculation results for the Average Lens Thickness, Seasonal Variation, and El Niño Period analysis options. Table 13 lists the island attributes used in the three examples. Table 13. Attribute Values used in Examples
5 m / yr Annual Rainfall 500 m Island Width
50 m / day Hydraulic Conductivity Reef Flat Plate Yes
Unknown (17.5 m) Thurber Discontinuity Geographic Region Western Caroline Region Location of Island Leeward Island
26

Average Lens Thickness Figure 14 shows the results from an Average Lens Thickness analysis. Since the Average Lens Thickness analysis option was selected, only the parameter values and the maximum lens thickness is displayed (circled in blue). Notice also that the Geographic Region, Location of Island, and Time Frame controls are inactive.
Figure 14. User interface and results for an Average Lens Thickness analysis. The calculated parameter values for the atoll freshwater lens algebraic model are circled in blue.
27

Seasonal Variation Figure 15 shows the results from a seasonal variation analysis. The parameter values and maximum lens thickness are the same as in the Average Lens Thickness example. The maximum lens thickness is then used to calculate the lens thickness for each month of the year. The monthly values are then displayed on the chart.
Figure 15. User interface and results for a Seasonal Variation analysis
28

El Niño Period Figure 16 shows the results from an El Niño Period analysis. The parameter values and maximum lens thickness are the same as in the Average Lens Thickness example. The maximum lens thickness is then used to calculate the lens thickness for each month of the 3-year period. The monthly values are then displayed on the chart. These values are for an extreme case, since the 1997-1998 El Niño was particularly strong.
Figure 16. User interface and results for an El Niño Period analysis
29

Curves A third option in calculating the thickness of the lens is to use curves (Figure 17)
which were calculated using the algebraic model. A set of curves represents leeward islands (with a set hydraulic conductivity value of 50 meters per day), and another set of curves which represents the windward islands (with a set hydraulic conductivity value of 400 meters per day). Each set of curves consists of four curves, each curve representing a different annual rainfall rate. The depth to the Thurber Discontinuity, ZTD in the algebraic model, was set at 17.5 meters, the average found from field investigations.
Figure 17. Curves to calculate the thickness of the freshwater lens To use the graph:
1. Determine the width of the atoll island in question. Locate this width on the Island Width axis.
2. Draw a vertical line from the point on the Island Width axis to the appropriate curve (the correct rainfall rate curve) within the appropriate set of curves (Leeward Islands or Windward Islands)
3. From this point, draw a horizontal line to the y-axis to determine the thickness of the lens.
This process is described by the red arrows in Figure 16 above, for an island with of width of 750 m and an average annual rainfall of 1.75 m yr-1.
30

If transient values are desired, follow the steps outlined in section 5.1.6 to determine the lens thickness during seasonal or El Niño rainfall period. Also, follow the items under Further Considerations in section 5.1.6.
PUMPING
Many atoll island communities have installed electric pumps to extract a portion of the freshwater lens (Bailey 2008). Pumping especially becomes important during times of drought. Pumping, however, must be performed with caution, especially for islands with thin lenses. Too much pumping can cause the depletion of the lens, as well as cause seawater to be introduced into the pumping system. In an attempt to deal with this issue, this section demonstrates how to include a pumping rate into the algebraic model. The water balance described by equation (1) can be modified to include a pumping rate Q:
QETPR −−= (2) Pumping rates (Q) are often described as a volume of water per unit time, such as gallons per day (GPD), cubic feet per second (CFS), or cubic meters per second. The values of Recharge (R), Precipitation (P), and Evapotranspiration (ET), however, in equation (2), are all in meters per year. Furthermore, the R term in the algebraic model is in meters per year. It is thus necessary to modify the pumping rate so that it is also in meters. The key in this process is demonstrated in Figure 18. The time frame for the example will be one year. A volume (in cubic meters) of precipitation can be found by taking the depth of precipitation over the year (meters per year), and multiplying by the island surface area (in square meters), over which the precipitation falls.
Surface Area of Island (Square Meters m2)
B
A
m
Ground Surface of Island
Figure 18. (A) Side view of island, showing depth of precipitation during one year (m), and (B) Top view of island, showing the surface area (m2) upon which the precipitation is falling.
In similar fashion, a volume can be dissolved into a surface area and a depth. For example, if one starts with the volume of precipitation that the island received over the year (cubic meters per year), and the surface area (in square meters) of the island is known, then the depth of precipitation (meters per year) can be calculated. These two processes are summarized by the following equations:
31

)()()( 23 mDepthmaSurfaceAremVolume ×= (3)
)()()(
2
3
maSurfaceAremVolumemDepth =
(4)
In regards to pumping, the depth of pumping Q (the amount, in meters, of water extracted from the freshwater lens per year) can be computed by dividing the volume of pumped water per year by the surface area of the island. The value Q can then be used in equation (2) to determine the value of recharge (meters per year), which is placed in the algebraic model. This value of recharge can be termed the effective recharge, since it is not the actual amount of water recharging the lens. Instead, it is the amount of water recharge the lens, minus the amount taken out by pumping. Example An atoll island receives an average rainfall of 4 meters per year. The average rate of evapotranspiration is approximately 2 meters per year. The island has a surface area of 125 000 m2. Over the course of the year, the island community pumped 60 000 cubic meters (m3) from the freshwater lens. To determine the R term (the effective recharge) (m) to include in the algebraic model:
1. Calculate the depth of pumped water, using equation (4):
mmm
maSurfaceAremVolumemDepth 48.0
12500060000
)()()(
2
3
2
3
===
2. Calculate the effective recharge, using equation (2):
mmmmQETPR 52.148.024 =−−=−−= Thus, 1.52 (meters per year) is the R term in the algebraic model. Without pumping, the R term would be 2 meters per year (4 meters of precipitation minus 2 meters of evapotranspiration).
32

LIMITATIONS OF THE ALGEBRAIC MODEL The algebraic model encompasses the effects of the principal climatic and geologic factors on the thickness of the freshwater lens. Patterns have also been demonstrated for the hydraulic conductivity on leeward and windward islands. These effects and patterns hold for the majority of observed cases for atoll islands. However, due to the unique geology and rainfall patterns of each atoll, the algebraic model can only be used as a first estimate. This estimate should not be taken as fact, but rather used as a rough estimate, best applied when accompanied by other knowledge of the island and the current weather patterns. High levels of confidence in water quantity estimates can only come through actual field work.
SUMMARY
This technical report has presented the geology and hydrology of atoll islands, the
principle climatic and geologic factors which govern the thickness of the freshwater lens, and an algebraic model which relates the maximum thickness of the lens to these factors. Three methods have been presented to use the algebraic model to calculate the thickness of the lens in both steady-state and transient conditions: manual calculations, a spreadsheet user interface and program, and a set of curves. The use of these tools will enable water resources managers to assess the natural condition of a freshwater lens on a specific atoll island within Micronesia.
33
REFERENCES Anthony, S.S., 1996a. Hydrogeology and Ground-water Resources of Ngatik Island,
Sapwuahfik Atoll, State of Pohnpei, Federated States of Micronesia. U.S. Geol. Survey Water Resources Investigation Report 92-4005.
Anthony, S.S., 1996b. Hydrogeology and Ground-water Resources of Kahlap Island,
Mwoakilloa Atoll, State of Pohnpei, Federated States of Micronesia. U.S. Geol. Survey Water Resources Investigation Report 92-4005.
Anthony, S.S., 1996c. Hydrogeology and Ground-water Resources of Pingelap Island,
Pingelap Atoll, State of Pohnpei, Federated States of Micronesia. U.S. Geol. Survey Water Resources Investigation Report 92-4005.
Anthony, S.S., 1997. Geology and Hydrogeology of Carbonate Islands. Development in
Sedimentology, pp. 693-706. Ayers, J.F., Vacher, H.L., 1986. Hydrogeology of an Atoll Island: A Conceptual Model
from Detailed Study of a Micronesian Example. Ground Water v. 24, no. 2, pp. 2-15. Bailey, R.T. 2008. Groundwater resources of Micronesian atoll islands: observations,
modeling, and management. M.S. thesis, College of Natural and Applied Sciences, University of Guam.
Buddemeier, R.W. and Holladay, G., 1977. Atoll hydrology: island groundwater
characteristics and their relationship to diagenesis. Proc. 2nd Int. Coral Reef Symp., Miami, v.2, pp. 167-173.
Cox, D.C., 1951. The hydrology of Arno Atoll, Marshall Islands. Atoll Res. Bull., 8: 1-
29. Falkland, A.C., 1983. Christmas Island (Kiritimati) Water Resources Study. V. 1.
Australian Dept. Housing and Construction. 425 pp. Falkland, A.C., 1992. Review of Tarawa Freshwater Lenses. ACT Electricity and
Water, Canberra. Prepared for AIDAB, Canberra.
Falkland, A.C., 1994. Climate, Hydrology and Water Resources of the Cocos (Keeling) Islands. Atoll Research Bulletin No. 400, Smithsonian Institute, Washington, D.C., 23 pp.
Falkland, T. 2003. Kiribati Water Resources Assessment Report. Promotion of
Effective Water Management Policies and Practices TAR: 35494-01. Sinclair Knight Merz in association with Brisbane City Enterprises.
34

Gingerich, S.B., Numerical simulation of the freshwater lens on Roi-Namur Island, Kwajalein Atoll, Republic of the Marshall Islands, M.S. thesis, Dept. of Geology & Geophysics, Univ. of Hawaii, Honolulu, 1992.
Hamlin, S.N., and Anthony, S.S., 1987. Ground-water resources of the Laura area,
Majuro Atoll, Marshall Islands. U.S. Geol. Survey Water Resources Investigatio Report 87-4047.
Hunt, C.D., Jr. and Peterson, F.L., 1980. Groundwater resources of Kwajalein Island,
Marshall Islands. Technical Report No. 126. Water Resources Research Center, Univ. of Hawaii. 91 pp.
Jacobson, G. and F.J. Taylor, 1981. Hydrogeology of Tarawa Atoll, Kiribati. Record
1981/31. Bureau of Mineral Resources, Geology and Geophysics, Australian Government.
Lloyd, J.W., Miles, J.C., Chessman, G.R., and Bugg, S.F., 1980. A Ground Water
Resources Study of a Pacific Ocean Atoll – Tarawa, Gilbert Islands. Water Resources Bull. v. 16, No. 4, pp. 646-653.
Peterson, F.L., 1997. Geology and Hydrogeology of Carbonate Islands. Development in
Sedimentology, pp. 611-666. PRC Toups, 1983. Engineering study to evaluate potable water supply alternatives and
groundwater yield at Diego Garcia, BIOT. Unpublished report to the U.S. Navy: PRC Toups, 972 Town and Country Road, P.O. Box 5367, Orange, CA, 92688, USA.
Spennemann, D., 2006. Non-traditional settlement patterns and typhoon hazard on
contemporary Majuro Atoll, Republic of the Marshall Islands. Transforming Cultures eJournal Vol. 1 No. 2.
Vacher, H.L., 1997. Geology and Hydrogeology of Carbonate Islands. Development in
Sedimentology, pp.1-33. Wheatcraft, S.W. and Buddemeier, R.W., 1981. Atoll Island Hydrology. Ground Water,
v. 19, No. 3, pp. 311-320. Woodroffe, C.D., Falkland, A.C., 1997. Geology and Hydrogeology of Carbonate
Islands. Development in Sedimentology, pp. 885-908.
35

36