groundwater degradation and sustainability of the erbil
TRANSCRIPT

Groundwater Degradation and Sustainability of the Erbil
Basin, Erbil, Kurdistan Region, Iraq
By
RUBAR DIZAYEE
Bachelor of Science, 2010
Salahaddin University
Hawler, Kurdistan
Submitted to the Graduate Faculty of the
College of Science and Engineering
Texas Christian University
Fort Worth, Texas
in partial fulfillment of the requirements
for the degree of
Master of Science
August 2014


ii
ACKNOWLEDGEMENTS
This thesis would not have been possible without Becky Johnson’s support. I am grateful to her
for being my thesis supervisor. I thank Dr. Michael Slattery and Mrs. Tamie Morgan for their
contribution to my thesis. I am grateful to Dr. Helge Alsleben for his serious effort in providing
me with valuable feedback. I would also like to thank Dr. Steve Sherwood from TCU writing
center for his support in finishing this thesis. My gratitude goes to Mr. Mohammed Ahmad and
Dr. Imadaldin Hassan for providing me with information during my research. I also would like to
thank my friends Sebar Muhsin and Mahmood Mustafa for all the help they provided during this
research. My greatest appreciation goes to my parents for always believing in me and for their
continuous support.

iii
TABLE OF CONTENTS
LIST OF FIGURES ....................................................................................................................... vi
LIST OF TABLES ........................................................................................................................ vii
Chapter One: Introduction .............................................................................................................. 1
1.1. Overview of project ................................................................................................................. 1
1.2. Previous Studies: ...................................................................................................................... 5
Chapter Two: Geology, Hydrogeology, Climate, Soil, and Population ......................................... 7
2.1. Kurdistan Region ..................................................................................................................... 7
2.1.1. Tectonic Framework of Iraq and Kurdistan Region ............................................................. 7
2.1.2. Stratigraphy ........................................................................................................................... 9
2.1.2.1. Bakhtiary Formation ........................................................................................................ 11
2.1.2.2. Pleistocene units and Alluvium ....................................................................................... 11
2.2. Erbil Basin ............................................................................................................................. 13
2.2.1. Northern sub-basin (Kapran) .............................................................................................. 14
2.2.2. Central sub-basin ................................................................................................................ 15
2.2.3. Southern sub-basin (Bashtapa) ........................................................................................... 16
2.3. Challenges of the sub-basins and legitimacy of the distances between drilled wells ............ 16
2.3.1. Northern sub-basin (Kapran) .............................................................................................. 16
2.3.2. Central sub-basin ................................................................................................................ 17
2.3.3. Southern sub-basin (Bashtapa) ........................................................................................... 17
2.4. Climate ................................................................................................................................... 18
2.5. Soils........................................................................................................................................ 19
2.6. Population .............................................................................................................................. 20
Chapter Three: Objectives and Methodology ............................................................................... 22
3.1. Objectives .............................................................................................................................. 22

iv
3.2. Methodology .......................................................................................................................... 22
3.2.1. Manipulation of the Dataset ................................................................................................ 24
3.2.1.1. Survey Date ...................................................................................................................... 24
3.2.1.2. Well Locations and Coordinates ...................................................................................... 24
3.2.1.3. Converting Depths to Elevations ..................................................................................... 25
3.2.1.4. Estimate of Water Producing Formation ......................................................................... 25
3.2.1.5. Estimate of Aquifer Conditions ....................................................................................... 26
3.2.1.5.1. Aquifer Characteristics of the Alluvium and Bakhtiary Formation (confined, semi-
confined or unconfined) ................................................................................................................ 26
3.2.2. Creating Maps and Cross Sections ..................................................................................... 27
3.2.3. Climatic Data ...................................................................................................................... 33
3.2.3.1. Groundwater Recharge for Erbil Basin............................................................................ 35
3.2.3.2. Average Annual Decline of Water Table ......................................................................... 35
Chapter Four: Data Analysis and Results ..................................................................................... 38
4.1. Challenges of the sub-basins and legitimacy of the distances between drilled wells ............ 38
4.2. Well Data Analysis ................................................................................................................ 39
4.2.1. Elevation map ..................................................................................................................... 39
4.2.2. Depth map ........................................................................................................................... 42
4.2.3. Cross Sections ..................................................................................................................... 46
4.3. Climate Data .......................................................................................................................... 55
4.3.1. Groundwater Recharge for the Erbil Basin ......................................................................... 56
4.3.2. Precipitation ........................................................................................................................ 56
4.3.3. Evaporation ......................................................................................................................... 57
4.3.4. Calculations based on precipitation data............................................................................. 59
4.3.5. Scenarios based on future climate change .......................................................................... 61
4.4. Discussion and Interpretation ................................................................................................ 64

v
Chapter Five: Conclusions and Areas for Future Study ............................................................... 66
5.1. Conclusions ............................................................................................................................ 66
5.2. Recommendations .................................................................................................................. 68
5.3. Areas for Future Study ........................................................................................................... 70
Works Cited .................................................................................................................................. 71
Vita
Abstract
vi
LIST OF FIGURES
Figure 1: Location maps of the study area and projected drilled wells. ......................................... 2
Figure 2: Tectonic map of Kurdistan Region. ................................................................................ 8
Figure 3: Regional hydrogeological cross section (Choman-Erbil) ............................................... 9
Figure 4: Tertiary and Quaternary rock units in Iraq .................................................................... 10
Figure 5: Geological map of Erbil Basin with the sub-basins labeled .......................................... 14
Figure 6: Spatial distribution of average yearly rainfall in the study area. ................................... 19
Figure 7: Soil types in the Erbil Province. .................................................................................... 20
Figure 8: Location of the 36 wells on the Erbil Basin map. ......................................................... 31
Figure 9: Ground Surface Elevation Map of Erbil Basin. ............................................................ 41
Figure 10: Depth map of the Erbil Basin using all 36 wells. The map shows the deepening and
shallowing subsurface areas. ......................................................................................................... 43
Figure 11: Depth map for Alluvium aquifer ................................................................................. 44
Figure 12: Depth map for Bakhtiary aquifer................................................................................. 45
Figure 13: Location map of Erbil Basin showing alluvium profile along A-A’ and B-B’ ........... 49
Figure 14: NW-SE cross section along (A-A’) of alluvium aquifer ............................................. 50
Figure 15: NW-SE cross section along (B-B’) for Alluvium aquifer. .......................................... 51
Figure 16: Location map of Erbil Basin showing Bakhtiary profile along A-A’ and B-B’ ......... 52
Figure 17: NE-SW cross section along (A-A’) of Bakhtiary aquifer. .......................................... 53
Figure 18: NW-SE cross section along (B-B’) of Bakhtiary aquifer ............................................ 54
Figure 19: Map of the location of the meteorological stations in the study area. ......................... 55
Figure 20: Relationship between average annual temperature and average annual evaporation in
the study area. ............................................................................................................................... 58

vii
LIST OF TABLES
Table 1: Litho-stratigraphy of the aquifer systems in the Low Folded Zone of the Taurus- Zagros
series ............................................................................................................................................. 12
Table 2: Details about the 36 selected wells ................................................................................. 28
Table 3: Details about the 18 wells. .............................................................................................. 36
Table 4: Average annual precipitation for the years 2008 to 2012 ............................................... 61
Table 5: Results of the Calculations ............................................................................................. 62

1
Chapter One: Introduction
1.1. Overview of project
The Erbil Province is one of the most important agricultural regions in Iraq. The study
area contains the town of Erbil, the highly populated governorate in the region of intensive
irrigated agriculture area. People use groundwater annually for irrigation, agriculture, and
drinking. This water comes from drilled wells since groundwater is available throughout the
whole region. Surface water sources are very often unusable for human consumption due to a
lack of management and strategic planning. Consequently, groundwater plays an important role
for both irrigation and basic daily uses. Previous researches do not asses the sustainable use of
groundwater on a large scale; however, sustainability and contamination issues are major
problems in the Erbil Region. The study of the Erbil Basin was selected because 1) it contains
the highly populated Erbil City, 2) the water table has decreased sharply and a number of wells
have dried up in the last few years, and 3) desertification is increasing and precipitation is
decreasing in the area.
The Erbil Province is located in northern part of Iraq and covers an area of 15,074 km2
(3.5% of Iraq). It is the fourth largest Iraqi province after Bagdad, Basra, and Mosul (NCCI). The
province is bounded by Kirkuk to the south, Salah al-Din to the southwest, Ninewa to the west,
Dahuk to the northwest, and Sulaymaniyah to the east (Figure 1). The provinces of Kurdistan
Region (Erbil, Dahuk, and Sulaymaniyah) are geologically, hydrogeologically, and climatically
similar.

2
Fig
ure
1:
Loca
tion
map
s of
the
stu
dy a
rea
. T
op
fig
ure
s sh
ow
ou
tlin
e of
Erb
il B
asi
n. M
ap
on
low
er l
eft
show
s g
over
nora
tes
of
Iraq
. M
ap
in
low
er r
igh
t sh
ow
s th
e E
rbil
Basi
n a
nd
pro
ject
ed d
rill
ed w
ells
.

3
The Zagros Mountains represent the main topography to the north and northeast of the
Kurdistan Region, reaching an elevation of 3,600 meters above sea level, whereas the Tigris
River plains (alluvial plains) are in the south of the region (Hameed, 2013). The vicinity of Erbil
province is comprised of mountainous uplands and fertile plains. Over 34% of the Kurdistan
Region is farmland used by people for agricultural purposes, while the rest consists of pasture,
forests, and urban land. In the Erbil province, 41% of the area is arable land and 59% is non-
arable land. The Erbil Basin is one of the most important basins in the Kurdistan region in terms
of adequate quantity and quality of groundwater as well as fertility of the land. The development
of the Erbil Basin has long been debated because there are unique features that separate it from
other basins, such as its geologic structure, stratigraphic relationships, and the geomorphological
setting of the region (Hameed, 2013).
Topographically, the Erbil Basin area is generally undulating with gentle to moderate to
very steep slopes. The plain of the Chai Siwasor, which stretches from Erbil to the Greater Zab
River, is an exception and is a nearly flat region without much topography (Ur et al., 2013). The
Erbil Basin is geomorphologically and geologically diverse, containing a range of river valleys,
flat alluvial plains, rolling gravel hills, and the Zagros foothill zones. Numerous large anticlines
and synclines with axis mainly oriented NW-SE parallel to the main Zagros orogen helped
producing the orientation of drainage patterns (Jassim and Goff, 2006). Also, the regional fault
systems are associated with intensive uplift. The Greater Zab River bounds the Erbil Basin to the
north-northwest, and Lesser Zab River bounds the basin to the south-southeast. The watershed
between the Erbil Plain and the Valley of Shalga River defines the eastern boundary of the basin.
The southwestern limit of the basin is the first long anticlinal hill that separates the Erbil Plain
from the Makhmur Plain, whereas the northeastern limit is the valley of the Bastora (Jassim and
Goff, 2006; Ur et al., 2013).

4
The overarching goals of this study are to determine the feasibility of groundwater use
and its sustainability for the entire Erbil Basin. This study addresses the following questions: (1)
What is the geometry and physiography of the basin? (2) Does a groundwater deficit exist and, if
so, how does it affect the various sub-basins in the Erbil Basin? (3) What is the overall
sustainable use of the groundwater within the aquifer systems across the Erbil Basin? The
hydrogeological study of the Erbil Basin assesses the availability of the groundwater resources in
the Erbil Basin for the development of irrigation, agriculture and drinking purposes.
Furthermore, the study focuses on the characteristics of the two main aquifers (alluvium and
Bakhtiary Formation) throughout the whole Erbil Basin and its sub-basins. The study also
includes an attempt to quantify the sustainability of these aquifers within the sub-basins.
This research is based on raw well data for five consecutive years (2008, 2009, 2010,
2011, and 2012). Data include static groundwater levels, dynamic groundwater levels, ground
surface elevations, depth to water, total depths of the wells completed in the two main aquifers,
and soil types. In addition, a climate data set includes precipitation and evaporation data. These
data are used to investigate and better understand the groundwater availability across the entire
basin. The author used climate, water well, and formation data to conduct an analysis of
groundwater levels, aquifer storage, and aquifer recharge from precipitation, and compares
groundwater withdrawals to recharge rates to estimate sustainable groundwater use in the Erbil
Basin.

5
1.2. Previous Studies:
There is a definite lack of scientific study and papers for the Erbil Basin. Below are the
papers that the author depended on while conducting this study:
Jawad and Hussien (1988) studied the groundwater monitoring network rationalization in
the Erbil Basin by applying a multivariate analysis approach to rationalize a piezometric
approach on a network of fifteen wells monitored for about three years. The purpose of
their study was to measure the annual changes in the aquifer storage and understand the
aquifer conditions in terms of recharge and discharge, by dividing the aquifer into a
number of zones and analyzing the aquifer condition in each zone separately.
Hassan (1998) studied the groundwater conditions in the Erbil Basin. The author
proposed a method (maximum water surplus method) for calculating the average amount
of infiltration from precipitation, and surface runoff. The study also included an analysis
of hydro-chemistry and hydro-geochemistry of the groundwater in the region and
considered that groundwater in the area is very suitable for industry, irrigation, and
domestic purposes. Since in Erbil people depend mainly on groundwater for all aspects of
life, Hassan (1998) calculated water population balance in the area to find the water
demand per capita in winter and summer seasons.
Al-Tamir (2008) conducted a study on groundwater quality variation in the Erbil City by
applying principle components analysis technique (PCA) to define the factors responsible
for the variance in groundwater quality and pollution. The author concluded that the
variance in the groundwater quality is as a result of agricultural pesticides and herbicides,
human activities, and rock dissolution.

6
Hameed (2013) conducted a study on water harvesting in the Erbil Territory. The study
focused on identifying suitable sites for water harvesting by using geographic
information system (GIS) and multi criteria evaluation (MCE). The author suggested a
number of micro and macro catchments depending on data such as soil texture, slope,
rainfall data, land use/cover, and drainage network. The author concluded that suitable
sites for rainwater harvesting are 36% of the total area of the region.

7
Chapter Two: Geology, Hydrogeology, Climate, Soil, and Population
2.1. Kurdistan Region
2.1.1. Tectonic Framework of Iraq and Kurdistan Region
The Zagros Belt in Northern Iraq is an example of a geologically recent Tertiary orogen
with an earlier obduction-subduction tectonic history (Numan, 1997; Jassim and Goff, 2006).
The tectonic activity along the Zagros Belt has been long-lived and started in the Late-
Cretaceous time (Numan, 1997); however, the final geometry developed during Miocene-
Pliocene time. The Zagros Mountains formed as a result of the collision of the Arabian and
Eurasian plates, where the Arabian plate was subducting underneath the Eurasian plate until it
reached a collisional stage (Jassim and Goff, 2006). This collision created a fold-thrust belt.
The Zagros orogen in the Kurdistan Region of Iraq is divided into stable and unstable
shelves; the stable shelf has a thin sedimentary cover with no significant folding, whereas the
unstable shelf has a thick and folded sedimentary cover and the folding increases toward the
northeast (Al-Juboury, 2012) (Figure 2). The unstable shelf is divided into four NW-SE striking
tectonic elements (Numan, 1997; Jassim and Goff, 2006): Foothill Zone (Low Folded Zone),
High Folded Zone, Imbricate Zone, and Zagros Suture Zone (Figure 2) (Jassim and Goff, 2006).

8
Figure 2: Tectonic map of Kurdistan Region (modified from Jassim and Goff, 2006).
The Erbil Basin area lies in the Low Folded Zone of Northern Iraq. Buday (1980)
introduced the Low Folded Zone as a tectonic unit, which has limited tectonic activity.
Anticlines and narrow synclines are dominated by open folds that have wavelengths ranging
from 5 to 10 km. The areal extent of the Erbil Basin covers a wide syncline bounded by the
Permam Dagh anticline in the NE and by the Kirkuk anticlinal structure in the SW. According to
Buday and Jassim (1987), the synclinal area between these anticlines represents the middle part
of the Erbil plain, which consists of several sub-basins (northern, central, and southern) (Bapeer

9
et al., 2010). The Erbil Basin is getting deeper toward SSE, where the antiforms and synforms
disappear and the thicknesses of the formations are increasing. In contrast, the basin gets
shallower towards the NNE, where the antiforms and synforms are more abundant and
topography increases as does tectonic activity (Figure 3).
Figure 3: Regional hydrogeological cross section (Choman-Erbil). Modified from
Stevanovic and Iurkiewicz (2009)
2.1.2. Stratigraphy
The stratigraphy of the area is characteristic of Iraq’s Zagros belt (Figure 4) (Bellen et al.,
2005). The sedimentary succession is possibly more than 10 km thick and quite probably begins
with late Precambrian formations. This layer is overlain by a Palaeozoic–Lower Mesozoic
succession that is several thousand meters thick (Numan, 1997; Jassim and Goff, 2006). Steady
and slow subsidence throughout the Mesozoic allowed widespread deposition of shallow marine
sediments on a wide epeiric carbonate platform (Dunnington, 1958). From mid-Jurassic to Late

10
Cretaceous faulting formed intra-shelf basins with clastic input from the west. Cretaceous
deposition was periodically interrupted by nondeposition and erosion due to localized
reactivation of faults during the Zagros orogeny. During Palaeocene-early Eocene time, a NW-
SE-trending, deep open marine basin developed to the south through central and eastern Iraq in
which the clastics (mainly shale) of the Kolosh Formation were deposited. Shallowing of this
basin and its isolation from clastic input gradually introduced limestone into the upper part of the
Kolosh Formation, and further shallowing introduced red beds and marls in mid-late Eocene
times, when sedimentation was controlled by a shelf isolating this lagoonal area. The Pilaspi
Formation represents a lagoonal facies. The late Eocene unconformity at the top of the Pilaspi
Formation is the result of a marine regression.
Figure 4: Tertiary and Quaternary rock units in Iraq. Modified from Bellen et al. (2005)
AGES

11
During the late Miocene, the Lower Fars Formation, which is dominated by mudstone,
shale and sandstone, formed as a result of erosion of mud and sand from nearby hills in a
terrestrial environment (Al-Tamir, 2008; AL-Kubaisi, 2008). The remainder of the surface
geology comprised of fluvial sandstones and muds passing upward into the coarse fluvial
conglomerates of the Bakhtiary Formation (see below). The Pleistocene period was characterized
by coarse pluvial and fine inter pluvial pebbly sand and silty sediments (AL-Kubaisi, 2008) and
the deposition of recent alluvium (see also below) is also terrestrial.
2.1.2.1. Bakhtiary Formation
The Bakhtiary Formation crops out at the surface near the southern end of the Bastora
area, on the limbs of Permam anticline located in the north of Erbil Province, and both eastern
and western sides of the basin, which is close to the recharge and discharge zones of the study
area (Habib et al., 1990). It consists of thickly-bedded conglomerates, sandstones and shale and
is considered Pliocene age. The formation is overlain by Quaternary terrace gravels in the valleys
or alluvium (Bellen et al., 2005). The Bakhtiary Formation covers more than 80% of the study
area. The thickness of the Bakhtiary Group (Upper and Lower Bakhtiary) varies (Al-Tamir,
2008), but several studies have shown that the thickness of this formation reaches over 1,800
meters at the Erbil Plain (Jawad and Hussien, 1988).
2.1.2.2. Pleistocene units and Alluvium
The Quaternary deposits are common over a wide range of the Erbil Basin area.
Pleistocene deposits, which rest on a Pliocene Bakhtiary Formation (Table 1), consist mainly of
soils, gravels, and conglomerates with some sands, clay, and silt. The youngest deposits consist
of river terraces deposits, alluvial fans, slope deposits and flood plain deposits (Jassim and Goff,

12
2006). The thickness of these deposits varies; however, it can exceed 100 meters in some
locations across the basin. The nature of these coarse-grained, unconsolidated materials makes
them ideal reservoirs for groundwater. The coarse sediments of the alluvial fans play a vital role
in shaping and generating confined aquifers within the basin. The coarse alluvial deposits consist
of fine-grained clay interbedded with sandy silty layers that amalgamated with pebbly, gravelly
strata. Ghaib (2004, 2009) estimated the water table level and thickness of the alluvial deposits.
The thickness of the alluvium might reach up to 150 meters, especially at the Bastora area near
the northern boundary of the Erbil Basin.
Table 1: Litho-stratigraphy of the aquifer systems in the Low Folded Zone of the Taurus-
Zagros series (from Stevanovic and Markovic, 2004)
Age Formation Lithology
Thickness
(m)
Water bearing
characteristics
Quaternary Pleistocene
to recent Alluvium
Gravel, clay,
and sand 10-150
Hydraulically
connected;
from one
aquifer system
in the Low
Folded Zone
Neogene
Pliocene
Upper
Bakhtiary,
Lower
Bakhtiary,
Mukdadia
Conglomerates
and Claystone,
partly
Sandstone and
Siltstone
>2,500-3,000
Miocene
Upper
Fars,
Lower Fars
Mainly
sandstone and
Evaporites,
and some
Conglomerates
L. Fars:
400- 900
U. Fars: 500
Low
groundwater
yield with
acidic or salty
water

13
2.2. Erbil Basin
The largest reservoir for groundwater in the Erbil Province is the Erbil Basin, also known
as Dashty Hawler Basin. The Erbil Basin covers an area of 3,200 km2 and has a depth of
approximately 800 meters. This basin is one of the most important groundwater basins in the
Middle East because of its nearness to the surface, not to mention the quantity and quality of its
water (Ahmed, 2009). The groundwater within the Erbil Basin generally flows from northeast to
southwest. A groundwater divide within the basin directs flows toward either the Greater Zab
River to the north-northwest or the Lesser Zab River to the south-southeast. The groundwater of
the Erbil Basin contains small amounts of soluble salts and harmful ions that could have negative
impacts on human health (Internal report directorate of groundwater-Kurdistan Region, 2012).
In general the Erbil Basin is divided into three sub-basins, which include the Northern
(Kapran) sub-basin, the Central sub-basin, and the Southern (Bashtapa) sub-basin (Figure 5)
(Habib et al., 1990). Researchers based this division on hydrogeological characteristics obtained
from deep wells, previous groundwater studies, and water quality (Ahmad, 2002). Sub-basins are
separated by minor surface and subsurface structures. Other areas in the basin include Shalga and
Bastura, but whether these belong to the Erbil Basin proper is debated.

14
Figure 5: Geological map of Erbil Basin with the sub-basins labeled. Modified from
Hameed (2013)
2.2.1. Northern sub-basin (Kapran)
This sub-basin has an area of 915 km2. The uppermost part of this sub-basin, which is
located near the foothill zone of the Zagros Mountains, consists of Bakhtiary Formation. A few
meters of alluvial deposits overlie the Upper Bakhtiary Formation in the lower part of this sub-

15
basin. In some locations, the thicknesses of alluvial deposits reach 50 to 60 meters. Both the
alluvium and the Bakhtiary aquifers are inter-granular and serve as groundwater-bearing units
(aquifers) with no aquitards or aquicludes between the two formations. According to records
from numerous deep wells, the Bakhtiary aquifers lithologically are composed of gravel, sand,
silt, conglomerate, and clay beds, whereas alluvium aquifers consist of interbedded sand, silt,
clay, and gravel (Ahmad, 2002).
Generally, Bakhtiary and alluvium aquifers are unconfined, meaning that precipitation
infiltrates directly into these aquifers, but in some parts of the study area, because of a covering
of thick clay, the aquifers become semi-confined or confined (Jawad and Hussien, 1988). In
normal conditions, the deep wells will be artesian. In the confined portion of the aquifers,
groundwater occurs at depths of approximately 40 meters below ground surface (bgs) and the
wells are not artesian. The total depths of deep wells drilled into the Kapran sub-basin from 1977
to 1989 ranged from 80 to 150 meters bgs, with total depths of more recent wells (1990 to 2002)
ranging from 160 to 200 meters bgs (Ahmad, 2002).
2.2.2. Central sub-basin
This sub-basin has an area of 1400 km2. The formations in this sub-basin are the Upper
and Lower Bakhtiary Formation and alluvium. The upper part of the Bakhtiary Formation
consists of gravel, sand, clay, and conglomerate strata. However, in some of the deep wells in the
lower Bakhtiary Formation consists of thin beds of gravel, sand, or conglomerate. The materials
of alluvium aquifers are the same as the Bakhtiary Formation, with the exception that they
contain silt in between the other layers instead of multiple clay layers. The discharge rates of
wells in this sub-basin range between 1 to 2 l/s (Ahmad, 2002).
16
2.2.3. Southern sub-basin (Bashtapa)
The Bashtapa sub-basin has an area of 885 km2 and is mostly dominated by the Upper
Bakhtiary Formation. Two different types of aquifer systems, the unconfined and semi-confined
aquifers, characterize this sub-basin. The semi-confined aquifers of this sub-basin consist of silty
materials (silty clay, sandy clay) that are interbedded with thin fine-grained sandstone strata,
amalgamated with clay layers, whereas the unconfined aquifers mainly consist of interbedded
clay beds with some silt or silty clay (Ahmad, 2002).
2.3. Challenges of the sub-basins and legitimacy of the distances between drilled wells
The regulatory principles of drilling water wells are not well developed in the region, and
the implementation and enforcement of the rules and regulations to foster production of water
resources still present fundamental issues in this region. Numerous studies have been done by
different organizations to address these issues; few of them have touched on the major problems
created by a lack of management. The lack of regulation has resulted in wells being drilled in
close proximity to each other, closer than new regulations permit, and the aquifer is also tapped
by numerous unpermitted (illegal) wells.
2.3.1. Northern sub-basin (Kapran)
According to a study done by the Furat Center and adopted by the Ministry of
Agriculture and Water Resources, the distance between wells in this sub-basin should not be less
than 300 meters and the number of drilled deep wells should not exceed 225 wells in the entire
sub-basin. However, the results of the Furat Center’s study show that the current distance
between wells is 450 meters, while the number of drilled wells is 1,074. Furat Center research
indicates that the distance between the wells is adequate, but the number of drilled wells far

17
exceeds the number recommended by the Furat Center. The 1,074 drilled wells also does not
include wells drilled by pile equipment: mechanical devices used to drive piles (poles) into soil
to provide foundation support for buildings or other structures and not for drilling water wells
(Internal Report Directorate of Groundwater-Kurdistan Region, 2012). To get control over the
illegal well drilling, the Kurdish Government forbade drilling wells by pile equipment on 22nd
August 2010 (zarikrmanji.com), aiming to make the aquifers more efficient and faster in
recharging the groundwater.
2.3.2. Central sub-basin
The studies done in this sub-basin by the Furat Center show that the distance between
wells in this sub-basin should not be less than 400 meters and the number of drilled deep wells
should not exceed 738 wells in the entire sub-basin. In fact, the results of the Furat Center’s
research indicate that the well distance in this sub-basin is 600 meters and the number of drilled
wells is 3,149, which exceeds the optimum number of wells supposed to be present by 2,411.
Most of the wells drilled for agricultural purposes are located in this sub-basin, which causes a
real possibility of groundwater contamination by fertilizers used for agricultural purposes
(Internal Report Directorate of Groundwater-Kurdistan Region, 2012).
2.3.3. Southern sub-basin (Bashtapa)
The maximum distance between water wells in this sub-basin, according to the Furat
Center, should not be less than 500 meters and the number of drilled deep wells should not
exceed 500 in the entire sub-basin. The results of the Furat Center’s research shows that the
distance between wells is 550 meters and number of drilled wells is 583. However, most of the

18
wells drilled by pile equipment (not counted in the 583 drilled wells) are located in this sub-basin
(Internal report directorate of groundwater-Kurdistan Region, 2012).
2.4. Climate
The Erbil Province generally has a varied climate and is classified into two climatic
regions. A Mediterranean climate region with an average annual rainfall of 600 to 800 mm
characterizes the north and northeast parts, whereas a warm climate region with an approximate
average annual rainfall of 500 mm characterizes the south and southwest parts of the Erbil
Governorate (Hameed, 2013). It is cold and snowy in the winter, and hot and dry in summer.
January is the coldest month in the region; the average winter temperature for the Erbil Province
is 7.9 °C (Hameed, 2013). The land topography varies from a mountainous and semi-
mountainous region to hilly and plain lands, all of which impact the influence of precipitation.
The plains are characterized by a semi-arid climate. Precipitation occurs from October to May,
and decreases from northeast toward southwest in the region, which means the northeastern parts
get higher amounts of precipitation than the southwestern parts. In the Erbil Province, the
quantity of rainfall is between 200 mm/year in the south and 1,200 mm/year in the north, with an
annual average of about 700 mm/year (Figure 6). Rainfall is one of the most important climatic
factors, and it changes within very short periods of time (UNDP, 2011).

19
Figure 6: Spatial distribution of average yearly rainfall in the study area. Modified from
Hameed (2013).
2.5. Soils
Based on the geographical location, soils in the area vary in depth. For example, soils are
shallow in the north and northeast (mountainous region), whereas the soils are deep and have
good texture in the south of the Erbil Province (the valley and plain lands). Soils in the southern
part of the area are some of the best soils for agriculture and include chestnut soils, dark brown
soils, and black soils. The semi-mountainous areas and most plains are covered with red and
brown soils. Overall, various zones with different types of soils have been identified in the Erbil
Province (Figure 7) (Hameed, 2013).

20
2.6. Population
According to the general Iraqi census, the population of Erbil was 770,439 in the census
of 1987. Starting in 1991, the Kurdish authorities in the three Kurdish provinces did a combined
census. The province’s population numbered 1,095,992 in 1997, 1,315,239 in 2003, and
1,542,421 in 2008 (Internal report directorate of groundwater-Kurdistan Region, 2012).
Population in the Erbil Province has now reached 1.9 million. The population increase indicates
that Erbil grows by 2.9 percent on an annual basis (Erbil Governorate, 2012).
There are significant differences when comparing data from the census and the water
resources management. Demand for water is twice as high as the demand in the 1980’s. Besides
the increase in population, water demand dramatically increased for industry, agriculture, and
Figure 7: Soil types in the Erbil Province. Modified from Hameed (2013).

21
domestic use. At the same time, drought has hit the region. The first drought period started in
1999 and lasted for four years until 2003, while the second drought period started in 2008 and
lasted into 2009 further training the water resources.

22
Chapter Three: Objectives and Methodology
3.1. Objectives
Datasets for water wells and climate from 2008 to 2012 were obtained from the Ministry
of Agriculture and Water Resources of the Kurdistan Regional Government, Iraq. The use of
these data was challenging since there was a lack of details that cover all of the overarching
objectives and to answer all of the questions (see below). However, to reach a certain level of
understanding to the addressed hydrological issues in the Erbil Basin, and to tackle and minimize
the concerns of water users in the Erbil Basin, including water resources deficits, drought,
groundwater overexploitation and mismanagement of the extracted groundwater used, several
objectives are proposed:
1. To obtain, compile, and analyze the available geology, climate, and well data for the
Erbil Basin. This is the first such study conducted in the region at basin scale. A large
portion of this work involved an intensive and complicated research effort to obtain
and integrate the data.
2. To document and quantify the rate of groundwater level changes in the Erbil Basin,
from 2008 through 2012 using the available well data.
3. To analyze the sustainability of the groundwater resources within the Erbil basin based
on the estimated rates of groundwater changes.
3.2. Methodology
Datasets for water wells and climate from 2008 to 2012 were obtained from the Ministry
of Agriculture and Water Resources of the Kurdistan Regional Government, Iraq. The water well
dataset contained the following information for most, but not all, of the wells:

23
Year that the information was collected (called “survey date” for the purposes of
this study)
Well coordinates (latitude and longitude)
Well location (name of basin)
Ground surface elevation
Total depth of the well
Depth to static and dynamic water levels
Name of producing formation (missing for the majority of wells)
Yield
Well names
The climate dataset contained the following information:
Monthly rainfall data (from 1941-2012)
Air temperatures
Relative humidity (in %)
Precipitation (both rainfall and snowfall)
In addition, the Ministry provided a dataset of 18 wells for which water level measurements were
obtained in the years 2001 and 2010. The following data for these 18 wells were available:
Water level data for 2001 and 2010
Well location (name of basin and sub-basin)
Well names
Several programs were used to perform the data analysis including Microsoft Exceltm
,
ESRI ArcGIS 10.1 (Geographic Information Systems), Blue Marble Geographics Global Mapper
13, Rockworks 15, and Adobe Illustrator CS6.

24
3.2.1. Manipulation of the Dataset
3.2.1.1. Survey Date
The well data measurements in the Kurdistan Region are collected only once per well
resulting in only one data point for use in this project. The provided well data had not been
sorted according to the survey date (period during which the information about the wells was
collected). The author sorted the wells according to their survey dates; the collected data
consisted of wells surveyed over five years 2008 through 2012.
Unfortunately, the water level measurements were not conducted on the same dates or
even the same years; therefore, the analyses of these data represent overall trends in water levels
for the aquifers, not a precise calculation for a specific date.
3.2.1.2. Well Locations and Coordinates
The Kurdistan Ministry of Agriculture and Water Resources provided a well data set that
consisted of 6,974 wells located in different basins in the province. Wells that did not belong to
the Erbil Basin according to the basin location data (which indicated location of each well) were
discarded; this process reduced the number of the wells from 6,974 to 2,050.
The Latitude /Longitude coordinates for each well were plotted for the 2,050 wells in the
Erbil Basin using ESRI ArcMap 10.1 to find their exact location in the basin. A number of the
wells had missing or inaccurate coordinates. Wells whose location did not plot within the Erbil
Basin were discarded.
Besides missing or inaccurate coordinates, the datasets for some of the wells were also
missing fundamental data for this research, including the survey date, depth where water was

25
first encountered while drilling, depth of water table, elevation above sea level, static and
dynamic water levels, characteristics of the aquifer types (confined, semi-confined, or
unconfined), piezometric surface of groundwater, and well yield. By discarding the wells for
which the required information or the latitude and longitude were lacking, the number of wells
included in this study was reduced to 995.
Using Blue Marble Global Mapper to plot the wells on a base map of the Erbil Basin
delineating the sub-basins (Al-Tamir, 2008), each of the 995 wells were classified according to
their location by sub-basin name. Documenting the sub-basin for each well location is important
as the drilling regulations differ in each sub-basin. Using Global Mapper, the distances between
wells were determined to compare the actual distances to the legally permitted distances in each
sub-basin. This documentation was used to determine the legality of the wells in the Erbil Basin.
3.2.1.3. Converting Depths to Elevations
The static to dynamic water levels were converted using the ground surface elevations
and depth-to-water measurements provided in the well dataset. The total depth of the well, depth
to static water level, and depth to dynamic water level were subtracted from the ground surface
elevation to convert depth measurements to elevations.
3.2.1.4. Estimate of Water Producing Formation
Among the 995 wells, only 409 wells had formation information provided in the dataset;
therefore, the author estimated the formation information for the remaining 586 wells by
applying two methods:
(1) Personal contacts with professors Kanar Hamza, Mohammed Ahmad, and
Imadaldin Hassan, who have knowledge about the formations of the area and their
26
approximate thickness. All of these individuals have done research on the Erbil Basin and
the Erbil Region
(2) Comparing the formation information of the surrounding wells that have
similar elevations above sea level and are located within the same sub-basin to those with
missing data.
Through these two methods, the author was able to estimate the well production for
which the ministry of Agriculture and Water Resources provided no formation data in the
dataset. Generally, the surface elevation of all the wells (with or without formation data) differs
from each other by 0 to 10 meters. Similarly, the distance between wells with and without
formation data is not large. The relatively close agreement of wells in terms of surface elevations
and distances from each other indicate the formation data of the wells do not differ significantly.
3.2.1.5. Estimate of Aquifer Conditions
3.2.1.5.1. Aquifer Characteristics of the Alluvium and Bakhtiary Formation (confined,
semi-confined or unconfined)
It is crucial to have an idea about the aquifer conditions (confined, semi-confined, or
unconfined) as they relate directly to the recharge patterns. For instance, unconfined aquifers get
recharged directly from precipitation infiltration into the subsurface, which means there is no
confining layer overlying the aquifer. The confined aquifer is the opposite of unconfined. It has
an impermeable layer (aquiclude) overlying the aquifer, which does not allow direct recharge.
Instead, the aquifer gets recharged where the impermeable layer ends. Semi-confined aquifers
are overlain by low permeability layers that allow limited recharge and discharge from the

27
aquifer (aquitard). The alluvium aquifers are generally unconfined, whereas the Bakhtiary
aquifers are primarily semi-confined to confined.
The dataset did not include information about aquifer conditions in each sub-basin of the
Erbil Basin, so the author depended on Ahmad (2002), who provided data about the static water
levels (water level before pumping) and dynamic water levels (water level during pumping).
Depending on Ahmad’s (2002) data and the aquifer’s static and dynamic water levels in the well
data set, in the present research the static water level was used to estimate whether a well was
drilled into a confined, semi-confined, or unconfined aquifer. The dynamic water level was
generally not used because of the variability due to pumping rates, pump and well sizes, and
changes in pumping rate. However, because of limited data for some of the wells, the author
used the dynamic water level in some instances. Even so, the aquifer conditions could not be
determined for a number of wells. Despite some uncertainties in the aquifer conditions, the
author used all of the wells for this research because the dataset was already limited. Discarding
any additional wells would have resulted in insufficient data for building a general understanding
of groundwater fluctuation and the legitimacy of the wells in the Erbil Basin, which is one of the
major problems facing the basin.
3.2.2. Creating Maps and Cross Sections
The assessment of the hydrogeologic conditions in the Erbil Basin was initiated by
constructing workable sets of cross sections and maps. Maps and cross sections were constructed
using Blue Marble Global Mapper and Adobe illustrator CS6, to demonstrate geometrical
distribution of the aquifers (alluvium and Bakhtiary Formation), groundwater level fluctuations
and the overall geometry of the Erbil Basin. For the maps and cross sections construction, only
wells for which all information were provided in the original dataset or wells whose conditions

28
could be determined with some certainty were included. Even though, well conditions were
estimated for all wells, conditions for some of the wells were more accurate than others. Higher
precision was largely based on communication with Mohammed Ahmad (personal
communication, 2014), who has extensive knowledge of the formations and conditions of the
aquifers in different parts of the Erbil Basin. Thirty-six of the wells, which are named for their
owners, included highly reliable information about the geology and well measurements including
total depth (TD), coordinates, well measurements, and subsurface information and were used to
produce the maps and cross sections of the Erbil Basin. The data for these wells and their
locations were mapped into Rockware software for analysis (Table 2 and Figure 8).
Table 2: Details about the 36 selected wells
Well
No.
Well Name Sub-
basin
Total
Depth
Producing
Formation
Aquifer
Condition
W01 Sawis Badel /17 Central 260 Alluvium Unconfined
W02 Daham Huseen Ahmed Bashtapa 300 Alluvium Unconfined
W03 Azez Abubaker Smael Central 277 Alluvium Unconfined
W04 Abdulmajed Abdulrahman Central 243 Alluvium Unconfined
W05 Idris Yosuf Khorshid Bashtapa 300 Alluvium Unconfined
W06 Abdulqadr Mhamad Smail Bashtapa 300 Alluvium Unconfined
W07 Najeba Osman Tahir Bashtapa 283 Alluvium Unconfined
W08 Shwan Smko Muhammed/2 Bashtapa 271 Alluvium Unconfined

29
W09 Ali Ibrahim Salim Central 228 Alluvium Unconfined
W10 Sabir Ismail Rasul Central 250 Alluvium Unconfined
W11 Khader Ali Khader Bashtapa 242 Alluvium Unconfined
W12 Luqman Aziz Hussien Bashtapa 243 Alluvium Unconfined
W13 Ary Husain Muhaideen Bashtapa 305 Alluvium Unconfined
W14 Omar Ali Taha Central 230 Alluvium Unconfined
W15 Sabr Muhammad Aly Central 252 Alluvium Unconfined
W16 Sabiha Muhammad Abdullah Central 300 Alluvium Unconfined
W17 Najmaddin Ali Hussein Central 251 Alluvium Unconfined
W18 Muhamad Ali Ahmed Central 212 Alluvium Unconfined
W19 Fawzia Mustafa Kader Bashtapa 220 Alluvium Unconfined
W20 Ali Ismail Omar Bashtapa 234 Alluvium Unconfined
W21 Nawzad Yahya Said Central 300 Bakhtiary Semi-confined
W22 Abdulrahman Qader Hamad Central 250 Bakhtiary Semi-confined
W23 Khalid Ali Haji Central 250 Bakhtiary Semi-confined
W24 Kompany Barani Projay Neshtajebon Central 300 Bakhtiary Semi-confined
W25 Kako Raof Omer Central 251 Bakhtiary Semi-confined
W26 Kompaniy Ask & Green land Projay Central 300 Bakhtiary Semi-confined
Heran City/2

30
W27 Omer Rahman Hmadamin Central 200 Bakhtiary Semi-confined
W28 Abdulrahman Fake Muhammad Central 232 Bakhtiary Semi-confined
W29 Sherzad Bairam Jamil Central 300 Bakhtiary Semi-confined
W30 Saber Ahmed Omer Central 250 Bakhtiary Semi-confined
W31 Naznaz&Shirin Omar Xdr Central 303 Bakhtiary Semi-confined
W32 Zrar Ahmad Omar Central 256 Bakhtiary Semi-confined
W33 Sulaiman Ali Diwary Central 286 Bakhtiary Semi-confined
W34 Mariwan Nur Aldin Bashtapa 300 Bakhtiary Semi-confined
W35 Jala Hassan Sharif Bashtapa 240 Bakhtiary Semi-confined
W36 Wahid Said Mustafa Bashtapa 207 Bakhtiary Semi-confined

31
Figure 8: Location of the 36 wells on the Erbil Basin map.
Using the elevation above sea level data for these 36 wells in the study area, an elevation
map is created showing the differences in the elevation across the basin. The elevation map is
color-coded with a specific scale to show the variations in altitude across the Erbil Basin. The
map also shows the steepness of the slopes and their geomorphological patterns across the basin.
Thus, the elevation map identifies the altitudes in the study area and the slope variations in which
the wells were drilled.
The depth maps of the Erbil Basin and the aquifers were created using the well
measurements of total depth (TD) of each represented well. The purpose of these maps is to
show geometry of the basin and identify relatively shallow parts and deeper parts of the basin.
Determining the geometry of the basin allows interpretations of the subsurface geology

32
throughout the entire basin. They show that subsurface geology is related to the surface geology,
which means surface and subsurface geology of the Erbil Basin are geologically linked.
New subsurface cross sections were constructed based on data from the 36 wells. These
data were used to estimate the hypothetical thickness of the aquifers in the alluvium and
Bakhtiary Formation. In addition, possible contacts between these two aquifers are estimated in
the cross sections since the alluvium overlies the Bakhtiary Formation. The regional correlations
between these wells allow evaluation and documentation of significant changes in interlayering
within the alluvium and Bakhtiary Formation and their depths across the Erbil Basin. The
ultimate purpose of creating these cross sections is to identify the geometric distribution of the
aquifer systems, determine the groundwater levels, and delineate the shallowing and deepening
successions in the subsurface of the Erbil Basin.
To create the cross sections, the well with the highest elevation among selected wells in
the Erbil Basin was used as reference (datum). The elevation of each of the other wells is
subtracted from the reference well. Therefore, the depths have been calculated using their total
depths (TD) for the wells related to the reference well that is used as a datum. The cross sections
across the Erbil Basin were extrapolated from the chosen wells. In addition, cross sections show
the groundwater level in each aquifer system. This has been calculated based on the static and
dynamic groundwater levels in these wells. The lack of complete data for these wells caused
considerable problems. Tops and bottoms of the aquifers were not clearly identified from the
dataset; however, after constructing cross sections, the contacts of the aquifers are clearly
defined and can be distinguished in each constructed section. Although the observations are
based on only 36 wells throughout the whole basin, they provide a basic understanding of the
topography and subsurface geology of the entire basin.

33
The cross section data for the aquifers have been divided into two different types. Each
type represents a specific aquifer. For the alluvium aquifer, several wells were chosen to
construct two different profiles: Profile A-A’ and B-B’, which have different orientations. Profile
A-A’ is oriented NNW-SSE and includes the following wells: W01, W02, W03, W04, W05,
W06, W07, and W08 (see Table 2 for well names). Profile B-B’, which is oriented NW-SE,
includes the following wells: W09, W10, W11, W12, W13, W14, and W15 (Table 2).
Two different profiles with different orientations were also constructed for Bakhtiary
aquifer. The A-A’ profile is oriented NE-SW and includes the following wells: W23, W24, W25,
W26, W27, W28, W29, W30. Profile B-B’, which is oriented NW-SE, includes these wells:
W31, W32, W33, W34, W35, W36 (Table 2).
A soil map for the Erbil Basin was acquired from Hameed (2013). The map was modified
using Adobe Illustrator CS6 (Figure 7). This map shows a range of soil types, which were
grouped and categorized hydrologically into 10 categories to cover the entire basin and the Erbil
Region as well. Also, a map from Al-Tamir (2008) showing the sub-basins within the Erbil
Basin has been modified using Adobe Illustrator CS6 (Figure 5). Other maps such as a location
map, map of precipitation rates, rainfall map, and a river and lake map, have been compiled and
modified in the same way as the two previous maps. In addition, a generalized cross section of
Erbil and Northern Iraq has been modified.
3.2.3. Climatic Data
The Kurdistan Regional Government, Ministry of Agriculture and Water Resources
provided a dataset of monthly rainfall and snowfall for eight meteorological stations within the
Erbil Basin. Only four of the eight stations had the required data of precipitation, temperature,
and relative humidity for this study. The meteorological stations are located within the Erbil

34
Basin. The station names are: Qushtapa, Ankawa, Khabat, and Grda Rasha, which are 24 km to
the south, 9 km to the north, 40 km to the west, and 8 km to the south of Erbil City, respectively.
The monthly precipitation data was totaled to acquire an annual precipitation amount.
The snowfall in each station was converted to liquid using a ratio of 10:1 as the snow to liquid
equivalent ratio, because it is considered as the average value of the snow/water ratio (Dubé,
2003). This indicates that 10 centimeters of snow would produce only 1 centimeter of liquid
precipitation and it is applicable in the region as the climatic condition allows it. The produced
amount of liquid from snowfall was added to the annual liquid amount in each station. The
resulting annual precipitations for all of the four stations was added together, and divided by four
to get an average annual liquid precipitation for all the stations across the entire basin.
Temperature and relative humidity data were collected and provided on a daily basis.
These data were averaged to a monthly average, and the monthly average data totaled and
averaged to get annual measurements for temperature and relative humidity at each station. The
resulting average annual temperature for all stations were added together and divided by four to
get an average annual temperature. The same calculations were done to estimate the average
annual humidity for all of the four stations.
The temperature and relative humidity data were used to calculate the evaporation
amount in the area. The author used the Ivanoff equation for the evaporation calculation:
E= 0.0018 (t+25)2
(100-a) (equation 1)
where E= Monthly probable evaporation (mm), t= Mean monthly temperature (C°),
a= Mean monthly relative humidity.

35
3.2.3.1. Groundwater Recharge for Erbil Basin
In order to understand the water pumping and recharge conditions in the Erbil Basin,
climate data, the total area of the basin, and the average annual water use in the Erbil Basin were
used. The average annual water use was calculated by multiplying the average decline in water
table by the basin area. The calculations started by establishing the units of the variables. To
understand the recharge system at the Erbil Basin, the author first calculated the volume of
precipitation over the basin for each year for all of the four stations (Qushtapa, Ankawa, Khabat,
and Grda Rasha) and then totaled the amount for all of the stations and divided by four to get an
average annual volume of precipitation over the basin.
According to Hassan (1998), 24.23% of the precipitation infiltrates into the subsurface to
recharge the groundwater. The rest of the precipitation either evaporates or runs off on the
surface. Based on the infiltration rate given by Hassan (1998), the average annual recharge from
precipitation is calculated; the author calculated the average annual water use and
overexploitation of the basin as well. Overexploitation or “mining” of groundwater occurs when
the volume of water used exceeds the volume being recharged.
3.2.3.2. Average Annual Decline of Water Table
Determination of the average annual decline of the water table is based on data provided
by the Ministry of Agriculture and Water Resources as a separate data set for only 18 wells. No
latitude or longitude data was available for these wells. Therefore, they could not be mapped or
located and could not be used for constructing the maps and cross sections. The wells have two
years of collected data, the first reading was in 2001 and the second reading was in 2010. The
decline in the water table is calculated for each sub-basin by subtracting the first reading from

36
the second reading, and then taking the average of the numbers to get the average decline in each
sub-basin (Table 3). Groundwater decline is probably related to recent drought.
Table 3: Details about the 18 wells.
No. Basin Sub-basin Well Name
First reading
in 2001 (R1)
in meter
Second
reading in
2010 (R2) in
meter
R1-R2
in meter
1
Erbil
Basin
North
(Kapran)
Jadida Zab/3 39.26 43.98 -4.72
2 Barbiangicka 19.8 27.56 -7.76
3 Sebirany Gawra/ 6 28.83 37.3 -8.47
4 Kawer Gosk / 1 28.68 35.06 -6.38
North (Kapran) Sub-basin Average Change 6.83
5
Erbil
Basin
Middle
(Central)
Aziana 20.34 23.75 -3.41
6 Peerdawood 18 22.95 -4.95
7 Nawroz /13 32.98 44.12 -11.14
8 Shorsh /8 66.41 78.2 -11.79
9 Shadi/1 35.75 50.83 -15.08
10 Bahar /4 36.8 48.5 -11.7
11 Kundak 46.58 59.8 -13.22
12 Shawis /4 34.82 52.17 -17.35
13 Gird Azaban 9.88 14.41 -4.53
14 Darato/30 45.85 57.2 -11.35
Middle (Central) Sub-basin Average Change 10.452
15
Erbil
Basin
South
(Bashtapa)
Qultapa Yaba 36.43 38.44 -2.01
16 Qurshakhlo 17.11 21.2 -4.09
17 BstanyGawra 26.01 42.2 -16.19
18 Dorabakra 34.83 36.62 -1.79
South (Bashtapa) sub-basin Average Change 6.02

37
Finally two case scenarios are presented. Case scenarios evaluate the possible impacts of
a 10% decrease or increase in precipitation on the basin. These values were chosen to show
potential changes if precipitation increases or decreases. The calculations establish how much
more or less precipitation would be needed to increase or decrease precipitation by 10%. Results
also show the effect on the average annual water table decline.

38
Chapter Four: Data Analysis and Results
4.1. Challenges of the sub-basins and legitimacy of the distances between drilled wells
As mentioned previously, according to the Furat Center, the distance between the wells in
the Central sub-basin should not be less than 400 meters, and in Bashtapa, it should not be less
than 500 meters. However, using spatial analysis and Global Mapper, the author created maps
which show the distance between the wells in each sub-basin indicate that the distances are
variable and not according to the regulations of the sub-basins. In the Central sub-basin, among
the 595 wells located in this sub-basin, 25.2 % of the wells do not meet the regulations. In most
cases the distance between them is less than 400 meters, and in some locations the distances are
even less than 100 meters. In the southern (Bashtapa) sub-basin, among the 387 wells located in
this sub-basin, 20% of the wells do not meet the regulations because the distance between the
wells is less than 500 meters. However, based on the maps for both sub-basins, in some locations
the distances between the wells is much more than the legally required distance. This finding
may have resulted from the lack of data and inaccurate coordinate information for some of the
wells that had to be deleted from the database and, therefore, could not be used in this research.
The wells with very large distances from others might have other wells between them, but the
author was unable to plot them on the map and find out their real location or the actual distance
between them and their neighboring wells. The limited data included only a few wells located in
the Kapran sub-basin. Thus, the author could not provide any general information about the
legality of wells in the whole sub-basin.

39
4.2. Well Data Analysis
To map the study area in the Erbil Basin, 36 out of the 995 wells were selected.
Approximately half of the selected wells terminate and produce from the alluvium, while the
other half penetrate through the alluvium and produce from the Bakhtiary Formation (Table 2
and Figure 8).
4.2.1. Elevation map
The highest areas are located in the northern part of the basin, where the Kapran sub-
basin is located (the boundaries between the sub-basins is marked by a red line) (Figures 8 and
9). The northern part of the Erbil Basin area is characterized by high to medium altitudes ranging
from 480 to 680 meters. Several wells, for instance, W01, W02, W24, and W26 have been
drilled in that area. In this part of the basin surface runoff water flows down from the uplands,
settling and accumulating in the lowland areas toward the south. In contrast, the lowest to
moderately elevated areas, in which altitudes range between 280 to 440 meters, are located in the
central and southern parts of the basin, where the basin flattens and moderate to low relief areas
dominate the topography. Most of the wells (e.g., W08, W09, W11, and W15) are located in
these low-lying areas. The area farther to the southeast represents the lowest area in the basin
(Figure 9).
One purpose of an elevation map is to show the steepness of the areas across the study
area. Very steep slopes surround the Erbil Basin to the north and northeast. Besides these steep
slopes, slope angles generally decrease from north to south across the basin (Figure 9).
Topography often reflects the distribution and textures of underlying rocks. Therefore, if these
slopes follow existing structural patterns throughout the basin, they may predict dips of the
bedding planes and might depict the aquifers’ dip direction. In addition, the map shows the flow

40
paths of surface runoff. Water naturally flows towards flat areas, avoiding the uplands, where
water cannot settle. Water likely accumulates in flat areas, where it infiltrates and finally
becomes a groundwater recharge source.

41
Figure 9: Ground Surface Elevation Map of Erbil Basin.

42
4.2.2. Depth map
The subsurface geology of the Erbil Basin is interpreted using the total depth of each
drilled well to the appointed aquifer. The maps show several areas of upwarping and
downwarping across the basin (Figures 10-12). Overall, these inferred depth maps illustrate the
deepening and shallowing in the Erbil Basin.
The three depth maps (Figures 10-12) show different subsurface geologic features and
multiple shallowing and deepening trends. This geometry is noticed most significantly on the
composite map of the entire Erbil Basin (Figure 10). The alluvium depth map represents the
wells that were likely drilled into the alluvium. The map clearly shows areas with shallow depths
in the western and southwestern part of the Erbil basin: mainly in the Bashtapa sub-basin and
western part of the Central sub-basin. Overall, the basin is deepest in the east and the center of
the Central sub-basin (Figure 11). In contrast, the Bakhtiary depth map, which represents the
wells drilled into the Bakhtiary Formation, is geometrically different from the overlying
alluvium. This map shows deep areas in the northeastern and western parts of basin. The central
area of the Central sub-basin shows shallower depth to the Bakhtiary Formation. Other shallow
areas are located in the southern part of the map (Figure 12).

43
Figure 10: Depth map of the Erbil Basin using all 36 wells. The map shows the deepening
and shallowing subsurface areas.

44
Figure 11: Depth map for Alluvium aquifer

45
Figure 12: Depth map for Bakhtiary aquifer

46
The changes in the shallowing versus deepening locations appear local, belonging to the
Erbil Basin itself. The interpretations for all depth maps (Figures 10-12) are consistent with the
general surface geology and suggest that the basin was not immune from local tectonics and
overall, these changes in the basin are most likely due to the tectonic activity, which caused
deformation including faulting and folding to the north and northeast of the basin.
4.2.3. Cross Sections
The author constructed two cross sections for each aquifer. Cross sections delineate the
approximate distribution and thickness of the alluvium and Bakhtiary aquifers in the subsurface
and estimate the geometry of the entire basin. These cross sections show the correlations
between the selected wells across the entire basin. Although the lithofacies and their physical
properties such as porosity and permeability control the ability to hold and transmit groundwater,
the cross sections show how the geometrical distribution of these two water-bearing aquifers in
the subsurface strongly affects the groundwater flow in the study area.
The author used physical measurements to construct 2D profiles, using the selected 36
wells, which helps in understanding the groundwater flow direction, as well as the geometrical
distribution of the aquifers in the alluvium and Bakhtiary Formation.
Four cross sections, two for alluvium and two for Bakhtiary Formation, are constructed
illustrating uplift in the northern part of the basin. Uplift is likely a result of large-scale
deformation caused by regional tectonics where deformation in fault blocks is associated with
folding, which creates elevated areas. Similarly, folding creates areas of downwarping, which
can be seen towards the southern end of the basin.

47
Profile A-A’ through the alluvium is oriented from NNW to SSE and includes eight wells
(W01, W02, W03, W04, W05, W06, W07, and W08). This profile shows the distribution of the
alluvium aquifer for the correlated wells in the subsurface where the top of this formation can be
picked at various depths from 110 to130 meters in the north, 70 to 170 meters in the center, and
200 to 220 meters in the south of the Erbil Basin (Figure 13 and 14).
The B-B’ profile through the alluvium is oriented from NW to SE and includes seven
wells (W09, W10, W11, W12, W13, W14, and W15). This profile shows the distribution of the
aquifer in the subsurface which is different from Profile A-A’. Here, the top of the alluvium can
be picked at 60 to 80 meters in the north, around 70 to 90 meters in the center, and 100 to 110
meters in the south (Figures 13 and 15). These variations of the top of alluvium aquifer represent
the deepening and shallowing of the basin.
Profile A-A’ of the Bakhtiary Formation is oriented from NE to SW and includes eight
wells (W23, W24, W25, W26, W27, W28, W29, and W30). This profile shows the distribution
of Bakhtiary aquifer in the subsurface, where the top of the formation can be picked at depths of
70 to 120 meters in the north, 130 to150 meters in the center, and 200 to 250 meters in the south
of the Erbil Basin (Figures 16 and 17).
The B-B’ profile of Bakhtiary Formation is oriented from NW to SE and includes six
wells (W31, W32, W33, W34, W35, and W36). This profile shows the distribution of Bakhtiary
aquifer in the subsurface, where the top of this formation can be picked at depths of 170 to180
meters in the north, 160 to170 meters in the center, and 200 to 220 meters in the south of the
Erbil Basin (Figures 16 and 18).
Overall, the cross sections show similar geometries for both aquifers. The depth of these
aquifers changes through the basin as a whole. This in turn effects on the presence of the

48
groundwater within these aquifers, which generally is located at greater depth to the south of the
basin than to the north.
The author used total depth to estimate thicknesses of the aquifers. Thus, these estimates
do not represent the actual thicknesses because the drilling was stopped at these depths, and no
contacts, lower and upper, have been defined or picked. Although thickness estimates are prone
to errors, wells W02, W05, and W06 on the transect map (Figure 13) and in cross section (A-A’)
(Figure 14) have the thickest alluvium. Alluvium is between 100 and 300 m thick. Similarly, the
thickness of the Bakhtiary Formation is not precisely measured.
Regardless, the cross sections can give the depth interval for each of these aquifers and
allow estimating the thickness in the subsurface and predicting the water table within these wells
precisely. The water table can be estimated at depths of 200 to 300 meters in the north, whereas
in the south the water table is estimated at depths of 330 to 370 meters (Figure 14). In contrast,
the water table is between 130 to 150 meters in the same aquifer but in a different transect and
profile (Figure 15). This variation in the water table zone could be due to several factors such as
thickness variations, pressure of groundwater, and deepening and shallowing of the basin. In the
Bakhtiary aquifer, the level of the potentiometric surface is estimated at depths of 40 to 120
meters in the northern part of the basin, whereas to the south it is estimated at depths of 220 to
250 meters (Figure 17). Furthermore, for the same aquifer but in a different transect and profile
(Figure 18) the potentiometric surface is between 80 to 180 meters, which indicates a noticeable
variation of the groundwater level across the entire basin due to the shallowing and deepening of
these aquifers relative to the ground surface in each well location.

49
Figure 13: Location map of Erbil Basin showing alluvium profile along A-A’ and B-B’

50
Fig
ure
14
: N
W-S
E c
ross
sec
tion
alo
ng (
A-A
’) o
f all
uviu
m a
qu
ifer

51
Fig
ure
15
: N
W-S
E c
ross
sec
tion
alo
ng (
B-B
’) f
or
All
uviu
m a
qu
ifer
.

52
Figure 16: Location map of Erbil Basin showing Bakhtiary profile along A-A’ and B-B’

53
Fig
ure
17
: sh
ow
ing N
E-S
W c
ross
sec
tion
alo
ng (
A-A
’) o
f B
ak
hti
ary
aq
uif
er.

54
Fig
ure
18
: N
W-S
E c
ross
sec
tion
alo
ng (
B-B
’) o
f B
ak
hti
ary
aq
uif
er

55
4.3. Climate Data
Hassan (1998) considers one of the most important hydrological subjects to be the water
balance estimation. According to the climatic conditions of the study area, there are different
methods used for calculating the water balance. Data from four different meteorological stations
were used to determine the average annual temperature, relative humidity, and precipitation of
the study area (Figure 19).
Figure 19: Map of the location of the meteorological stations in the study area.

56
4.3.1. Groundwater Recharge for the Erbil Basin
The main source of recharge in the Erbil Basin is precipitation. The recharge rate to
unconfined aquifers from precipitation is 24.23% (Hassan, 1998). However, Hassan (1981)
estimates variable infiltration rates from precipitation in this area from 22.8% to 24.9%. Here,
Hassan’s (1998) method is used to calculate the amount of recharge, as it is the more recent
study and is considered a more precise fit for the current climatic conditions in the study area.
4.3.2. Precipitation
In order to understand the water pumping and recharge conditions in the Erbil Basin, the
author analyzed climate data. Analysis began by calculating the average annual precipitation and
converting the precipitation into a volume for the years 2008 to 2012. This gives the volume of
precipitation over the basin.
Obtaining knowledge of the volume of precipitation over the basin is important. In fact,
for the Erbil Basin, the precipitation is the most crucial factor because it is the main source of the
basin recharge. However, the total amount of precipitation will not infiltrate into the subsurface,
some of the precipitation evaporates. The rest of the precipitation runs off the surface. The
calculations started by calculating the volume of precipitation over the basin.
Volume of precipitation over the basin (m3/year) = average annual precipitation
(m/year) * basin area (m2)
Data from the four stations show an average annual precipitation of 400.0284 mm
(0.4000284 m). The total area of the Erbil Basin is 3,200km2
(3,200,000,000 m2). Based on these
values, the average volume of precipitation over the basin is 1,280,090,880 m3
/year.
57
4.3.3. Evaporation
Evaporation is an important element to rely on when calculating the water balance.
However, evaporation is not a constant factor, but is variable and depends on several factors,
such as temperature and humidity. According to Hassan (1998), the best method for evaporation
calculation in Iraq, based on climatic conditions in the area, is called Ivanoff equation:
E= 0.0018 (t+25)2
(100-a) (eq. 2)
where E= monthly probable evaporation (mm), t= mean monthly temperature (C°),
a= mean monthly relative humidity.
Thus, the Ivanoff equation was used to calculate the average annual evaporation rates for each
year of the five-year research period. The average annual temperature and precipitation were
calculated from the available climate data from four different meteorological stations (Figure
19). In the Erbil Governorate, most of the precipitation takes place during the winter season and
the area very rarely gets rain during the summer. This is important because evaporation and
temperature are directly proportional. The evaporation rate increases with the temperature
increase and decreases with the temperature decrease. These relationships are important
indicators for the water balance within the basin (Hassan, 1998) (Figure 20).
The volume of evaporation over the basin is calculated by:
Volume of Evaporation over the basin (m3/year) = average annual evaporation
(m/year)* basin area (m2)
The results of the calculations show that the average volume of evaporation over the basin is
707,968,000 m3
/year, which is 55% of the total precipitation.
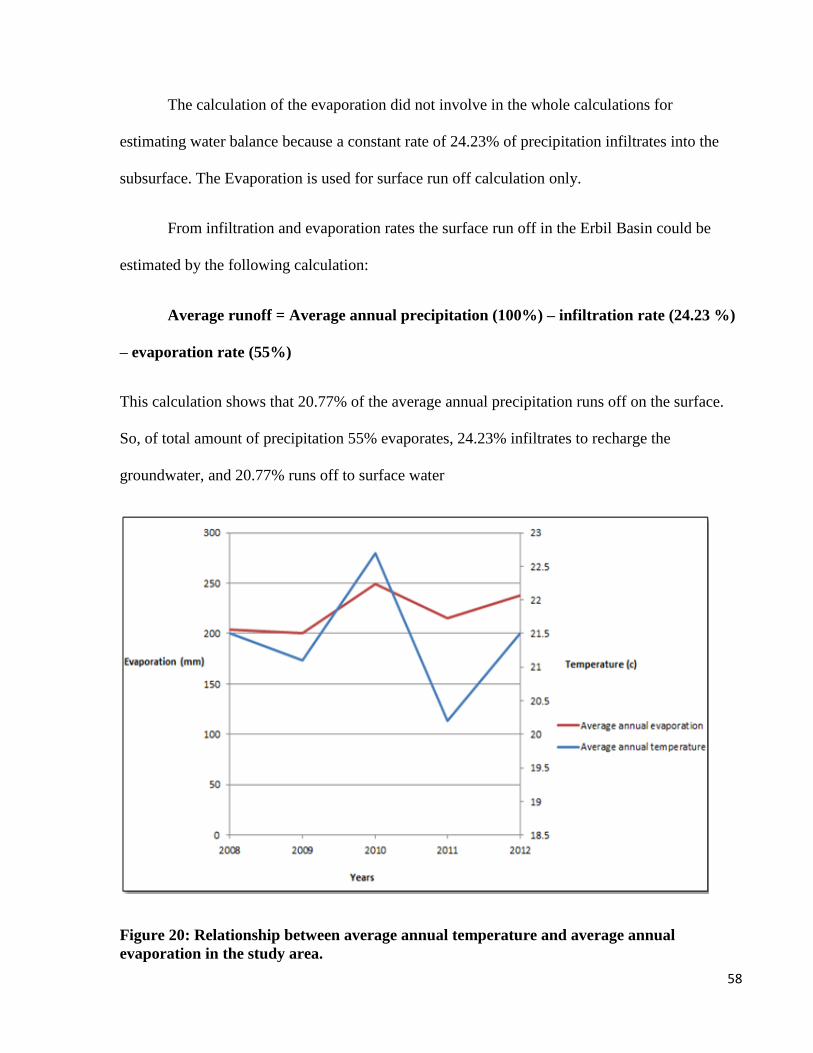
58
The calculation of the evaporation did not involve in the whole calculations for
estimating water balance because a constant rate of 24.23% of precipitation infiltrates into the
subsurface. The Evaporation is used for surface run off calculation only.
From infiltration and evaporation rates the surface run off in the Erbil Basin could be
estimated by the following calculation:
Average runoff = Average annual precipitation (100%) – infiltration rate (24.23 %)
– evaporation rate (55%)
This calculation shows that 20.77% of the average annual precipitation runs off on the surface.
So, of total amount of precipitation 55% evaporates, 24.23% infiltrates to recharge the
groundwater, and 20.77% runs off to surface water
Figure 20: Relationship between average annual temperature and average annual
evaporation in the study area.

59
4.3.4. Calculations based on precipitation data
To measure the sustainable water use (pumping) in the Erbil Basin, the author calculated
the average annual potential recharge of the basin by:
Average annual recharge (m3/year) = (Volume of precipitation over the basin (m
3
/year)* infiltration rate in percent) / 100
Based on the result of the average volume of precipitation over the basin and an
infiltration rate of 24.23% (Hassan, 1998), the average annual recharge volume of the basin is
around 310,166,020 m3/year.
Table 3 shows the water level decline in each sub-basin, 6.83 meters, 10.45 meters, and
6.02 meters decline in Kapran, Central, and Bashtapa sub-basins respectively. The decline in
water table, based on the eighteen wells that have repeated measurements, is 0.78 meter/year.
This decline is mainly due to drought and the number of wells in each sub-basin, which highly
exceeds the legally permitted numbers. This decline is calculated by adding the average decline
in each sub-basin and dividing the result by three, so this gives the average decline in ten years,
dividing it by 10 gives the average decline in a year. Multiplying the 0.78 m/year decline by the
basin area gives the average volume of annual water used in the basin, which is 2,496,000,000
m3/ year. The annual water use volume subtracted from the recharge volume gives
overexploitation volume in the basin, which is 2,185,833,980 m3/ year.
Dividing the volume of average annual overexploitation (2,185,833,980 m3/ year) by the
basin area gives 0.68 m/year water table decline due to overexploitation in the basin. All of the
calculations are based on a 0.68 m/year decline. The author recalculated the volume of annual
water use and overexploitation based on a 0.68 m/year decline.

60
To get more accurate results on the groundwater conditions in the Erbil Basin, the author
calculated the volume of the annual water use in the basin by making following calculation:
Volume of the annual water use (m3/year) = Average annual decline in the basin
(m/year)* basin area (m2)
The resulting calculations suggest that the volume of annual water use in the basin is
2,176,000,000m3/year. This number helps characterize the volume of water being overexploited
within the Erbil Basin making the calculations below:
Volume of overexploitation (m3/year) = Volume of water used (m
3/year) – recharge
volume (m3/year)
Therefore, the volume of the overexploitation in the Erbil Basin is 1,865,833,980 m3/ year.
From the numbers shown above, the author concluded that, of the total water being
pumped only 14.3% is met by the recharge using the following calculation:
Amount of pumped water that is recharged by precipitation = (Recharge volume /
volume of water used)* 100
To reach to sustainability, the recharge would have to increase by 85.7%. In order to have this
increase in recharge, the area would have to get approximately 605% more precipitation.
The sustainable pumping volume for the basin is equal to the average annual recharge of
the basin, which is 310,166,020 m3/ year. This volume represents what should be extracted from
the Erbil Basin instead of 1,865,833,980 m3/ year. Furthermore, because the Erbil Basin is facing
a serious degradation in groundwater levels, the author also calculated a recovery pumping rate,
which requires that a portion of the average annual recharge would not be pumped from the basin

61
so that the basin could start to recover and the water table would slowly rise to earlier levels. The
author suggests that 10% of the total amount of recharge be left in the basin and not pumped.
The sustainable recovery pumping rate is then calculated by:
Sustainable Recovery pumping (m3/year) = (Volume of average annual recharge
(m3/year) * 90%)
The results of this calculation indicates that, in order to keep 10% of the recharge in the
basin for the purpose of basin recovery, the sustainable pumping of the groundwater from the
Erbil Basin is 279,194,418 m3/year.
4.3.5. Scenarios based on future climate change
Finally, the author assumed two case scenarios to predict and estimate hypothetically
how future climate change might affect the groundwater within the Erbil Basin. These scenarios
are based on the average increase in precipitation from 2008 to 2012 (Table 4), which is equal to
13% increase. This increase does not mean that the area is not experiencing drought, it only
means that drought conditions are not as severe as in the previous years.
Table 4: Average annual precipitation for the years 2008 to 2012
Year Average Annual Precipitation
(mm)
2008 359.867
2009 232.204
2010 387.161
2011 444.11
2012 576.8

62
In the first scenario a 10% increase in precipitation was used to see how it would impact
groundwater conditions within the basin. A 10% increase in precipitation would increase the
volume of average annual precipitation to 1,408,099,968 m3/ year. The average annual recharge
would increase from 310,166,020 m3/ year to 341,182,622 m
3/ year. Assuming constant water
usage (no increase or decrease in usage), a 10% increase in precipitation would decrease the
overexploitation volume to 1,834,817,378 m3/ year and the average annual decline of water
table in the Erbil Basin would be 0.57 m/year.
The second scenario involves a 10% decrease in precipitation, which would negatively
impact the groundwater conditions. This means the volume of precipitation over the basin would
decrease to 1,152,081,792 m3/ year. This assumption presumes a decrease in the annual recharge
volume to 279,149,418 m3/ year. So a 10% decrease in precipitation would increase
overexploitation to 2,455,149,418 m3/ year and the average annual decline of the water table in
the Erbil Basin would increase to 0.77 m/year.
Table 5 below summarizes all these calculations.
Table 5: Results of the calculations
Average annual precipitation (m) 0.4000284
Basin area (m2) 3,200,000,000
Volume of precipitation over the basin (m3 /year) 1,280,090,880
Recharge volume (m3 /year) based on 24.23% (Hassan) 310,166,020
Water table decline (m/year) as measured in 18 wells 0.78
Volume of annual water use (m3/year) based on 0.78
m/year decline 2,496,000,000

63
volume of overexploitation (m3/year) based on 0.78
m/year decline 2,185,833,980
Water table decline (m/year) (based on ten years
decline in water table (table2)
Water table decline (m/year) based on calculated
overexploitation
0.78
0.68*
Volume of annual water use (m3 /year) 2,176,000,000
Volume of overexploitation (m3 /year)
(water table decline – recharge volume)
1,865,833,980
(85% of total use is
overexploitation)
Total of the pumped water met by recharge 14.3 %
Sustainable recovery pumping (m3/year) (recharge
minus 10%) 279,194,418
Volume of Evaporation (m3 /year)
(55% of total precipitation) 707,968,000
Surface run off rate (%) 20.77 %
Volume of precipitation over the basin (m3 /year) + 10
percent increase
Assume 24.23% infiltration for recharge of (m3/year)
Overexploitation decreases to
1,408,099,968
341,182,622
1,834,817,378
Volume of precipitation over the basin (m3 /year) + 10
percent decrease
Assume 24.23% infiltration for recharge (m3/year)
Overexploitation increases to
1,152,081,792
279,149,418
2,455,149,418
* volume used for remaining calculations
64
4.4. Discussion and Interpretation
The Erbil Basin is genetically related to regional tectonics and places within the basin
vary topographically due to the presence of structural features in the subsurface. The deepening
of the basin is related to subsidence, which is likely created by tectonic loading, whereas the
elevated areas are generated due to either uplift of fault blocks or folding in the subsurface.
In the elevated areas, the rivers constantly modify their channels and the surrounding
landscape. As a result of the potential energy that derives from the gravitational force and the
water’s kinetic energy, derived from its movement downslope, the river carves vertically into its
channel, making pathways through narrow valleys. This process initially creates a deep channel,
due to hydraulic process of water movement and abrasion. Some of the flowing surface runoff
becomes the source for groundwater recharge as it infiltrates through the pores in the rocks, and
then accumulates in the aquifers in the low-lying areas. The elevation map elucidates that some
of the selected wells, particularly the ones that have been drilled in the topographically high
areas, might have limited groundwater production rates due to the steepness of the terrain in
which they were drilled. In steep terrain water from precipitation runs off the steep areas faster
than the flat areas, this is not favorable for groundwater accumulation. Also, the dip and dip
direction of the aquifer in the subsurface affect the groundwater accumulation and water well
production. The higher the dip angle, the faster the water will drain, which directly affects well
production. The groundwater accumulates and moves from high pressure areas to the low
pressure locations. This occurs because of the presence of fluid pressure, dip direction of the
deformed aquifer, lithology and rock fabrics.
To manage groundwater sustainably, several things must be known including 1) the
amount of recharge, 2) the amount of discharge and 3) changes in the groundwater depth below

65
the surface. Changes in groundwater levels should be monitored carefully through well tests
(pumping tests). This information can be obtained from the drilled wells to determine the amount
of groundwater being consumed, and the depth from which water can safely be withdrawn
because this impacts the quantity of the pumped groundwater from the wells, and in turn, it
affects the hydrogeologic cycle. Predicting the hydrogeologic system within the Erbil Basin is
dependent on the amount of recharge, which has to be equal or greater than the amount of
withdrawal for the area to meet the requirements of sustainable groundwater. If water is being
consumed at a greater rate than the recharge to the system, groundwater continuity would be
threatened as is the case in the Erbil Basin.

66
Chapter Five: Conclusions and Areas for Future Study
5.1. Conclusions
The nature of the aquifers varies geologically across the basin. Changes are likely
controlled by the deformation in the region. These geologic variations control the groundwater
quantities in the basin as noticed by the variations of the water levels across the basin. Therefore,
the results of this study indicate that geologic location is one of the most important factors
affecting groundwater quantity within the Erbil Basin.
The northern sub-basin is located in the topographically high areas, whereas the central
and southern sub-basins are located in moderately flat areas. The central and southern sub-basins
tend to collect more precipitation than elevated areas because water from precipitation runs off
the elevated surfaces towards flatter areas. According to the geological and geographical location
the central and southern sub-basins, are considered as a favorable place for groundwater
accumulation.
The idealized cross sections for each unit allow a basic interpretation that describes most
of the basin. The four cross sections illustrate and provide detailed information about the uplifted
northern part of the basin. Uplift may have occurred as a response to the local tectonic activity in
the region. Related to these depth changes is a noticeable variation of water table level across the
entire basin.
The climate data analysis shows that the present usage of groundwater in the Erbil Basin
is unsustainable and of the total amount being pumped only 14.3% is met by recharge. Based on
this recharge, the estimated water table decline is 0.68 m/year. In the current climatic conditions
the sustainable pumping volume for the basin is 310,166,020 m3/ year, which would require
reducing the current usage by 85.7%. A recovery pumping volume of 279,194,418 m3/ year or

67
10% less than current recharge would allow groundwater levels to rise again. Given the current
pumping volume, the precipitation amount would have to increase an unlikely 605% to reach a
sustainable use of water in the Erbil Basin. Assuming future climatic changes in the area, a 10%
increase in precipitation would result in an average annual water table decline of 0.57 m/year. If,
however, the basin gets 10% less precipitation, the average annual water table decline would be
0.77 m/year in the Erbil Basin.
The number of water wells far exceeds the desired number of wells as determined by
water resource management authorities and the central sub-basin has the highest number of
illegal wells; the distance between most of the wells in each sub-basin does not meet the legally
permitted distance between the wells. According to findings in this research, a significant
percentage of the wells are illegal based on measured distance between the wells. For instance,
of the 595 of the wells located in the central sub-basin 25.2% were found to be illegal. The
southern sub-basin included 387 wells of which 20% were determined to be illegal. Due to a lack
of data (only thirteen wells) in the northern sub-basin the author could not decide on the
legitimacy of the wells in this sub-basin.
This research shows that the central sub-basin is the sub-basin most impacted by drought
and illegal wells. Over ten years it has an average water level decline by 10.45 meters, whereas
the decline in the northern and southern sub-basins is 6.83 meters and 6.02 meters, respectively.

68
5.2. Recommendations
There are several recommendations based on the results of the current study. These
recommendations include:
1. Installing a network of observation wells in the area to observe the groundwater
level in the basin. This network could be started by obtaining latitude and
longitude coordinates for the eighteen existing wells that have two years of
measured data. All wells in the network should be located with accurate
Latitude/Longitude coordinates mapped and maintained in a GIS model database.
2. Construction of discharge stations is a necessity in the area for calculating the
exact amount of surface runoff and harvesting the runoff water to use during dry
period or using for artificial recharge of the aquifers.
3. Despite groundwater’s importance to the region, the aquifers in the region suffer
from overexploitation and mismanagement because of the perception (mainly by
local residents) that groundwater will always remain (Directorate of groundwater
resources –Erbil). Interventions should particularly target decreasing the number
of wells. The government should start by counting all wells in each sub-basin
including the wells that have been drilled by pile equipment. Based on the wells
used in this research, the author thinks that currently most of the wells drilled in
the Erbil Basin are illegal. The government should take restrictive and very quick
actions regarding illegal wells. This could be started by closing all the wells that
have been drilled illegally by pile equipment. However, for the current condition
of the Erbil Basin, this alone might not be enough. In order to ensure the
continuity of water availability in this area, the government should assign

69
withdrawal limits (i.e. quotas per water well) to limit waste and overuse of water
resources and to ensure future availability of sustainable groundwater reservoirs.
4. More dependency on surface water (rivers and streams) is recommended to
reduce dependency on groundwater. However, any policy interventions that target
usage of groundwater resources should take into account alternative sources for
farmers and other users of groundwater resources in case of limiting access to
available water wells. In the same way, any policy that targets using more
available surface water should pay particular attention to the effect this will have
on downstream communities.
5. Because better data collection results in better conclusions, a minimum set of data
points should be collected for the existing wells and new drilled wells:
Latitude and longitude coordinates for the wells
Survey date
Depth to water level
Depth to static water levels and collecting it once per year
Formation information, their actual thicknesses, and top and bottom of the
formations
Aquifer condition (confined, unconfined, and semi-confined)
Elevation above sea level
Purpose of the well (well use)
Fixing the missing data in the current dataset
And finally keeping all the data in a GIS data base.

70
5.3. Areas for Future Study
Bakhtiary aquifers are important water bearing units in the Erbil Basin. However, as a
result of data limitations including the top and bottom of the formation, aquifer condition, and
actual thickness of the formation in the area, the author could not do a complete research on this
formation and has to leave it for future study.
Conducting a study that shows the groundwater decline in the Erbil Basin and comparing
it to the results of this research to get an idea on whether the decline is still in the same rate
(stable) or it has increased or decreased

71
Works Cited
Ahmad, M. A. (2002). Brief references on hydrogeological characteristics of Erbil basin.
Ahmed, M. R. (2009). Ground water quality of selected wells in zaweta district, Northern Iraq.
Tikrit Journal of Eng.Sciences,17 (1), 28-35.
Al-Juboury, A. I. (2012). A Combined Petrological-Geochemical Study of the Paleozoic
Successions of Iraq. Mosul, Iraq: Research Center for Dams and Water Resources, Mosul
University, 169-198.
AL-Kubaisi, Q. Y. (2008). Groundwater chemistry of the Plio-Pleistocene aquifer of Erbil
hydrogeologic basin, N.Iraq. Iraqi Journal of Science,49 (2), 140-148.
Al-Tamir, M. A. (2008). Interpretation Of Ground Water Quality Data variation in Erbil City,
Nortern Iraq. Mosul, Iraq. Al-Rafidain Engineering, 16 (2), 24-30.
Bapeer, B.G., Sordashi, M.A, & Kareem, M. (2010). Infilteration rates of Soil in some locations
within Erbil Plain, Kurdistan Region, North Iraq. Iraqi Bulletin of Geology and Mining,
127-137.
Bellen, R.C., Dunnington, H.V., Wetzel, R., & Morton, D.M. (2005). Stratigraphic lexicon of
Northern Iraq. Gulf petrolink, 0310 asie (Iraq), 239.
Buday, T. (1980). The Regional Geology of Iraq. V.I., Stratigraphy and paleoecology,
Kassab.I.I.M., and Jassim S.Z., (eds.), Baghdad, 455.
Buday, T., & Jassim, S.Z. (1987). The regional geology of Iraq, 2, Tectonism, magmatism and
metamorphism. S.E. Geol. Surv. And Mineral Invest, Baghdad, 352.
Dunnington, H.V. (1958). Generation, Migration, Accumulation and Dissipation of Oil in
Northern Iraq, In: Weeks,. L.G.(ed). Habitat of oil. AAPG Symposium, Tulsa, Oklahoma,
1194-1251.
Dubé, I. (December 2003 ). From mm to cm... Study of snow/liquid water ratios in Quebec .
Quebec region.
Erbil Governorate Accessible at:
http://www.krp.org/english/ndisplay.aspx?sm=5yBwBg+oqQY=
Ghaib, F. A. (2004). Geo-electrical Investigation in Harir Plain Northeast of Erbil City. Iraqi
Journal of Earth Science,4(2), 31-43.
Ghaib, F. A. (2009). The Assesement of Erbil Aquifer Using Geo-electrical Investigation (Iraqi
Kurdistan Rgion). Journal of Applied Sciences in Environmental Sanitation, 43-54.

72
Habib, H. R., Al-Saigh, N.H., and Hassan, Z.M.. (1990). Geochemistry of under groundwater in
Erbil City,Iraq. Mosul, Iraq: Mosul University, 173-188.
Hameed, H. M. (2013). Water harvesting in Erbil Governorate, Kurdistan region, Iraq.
Detection of suitable sites using Geographic Information System and Remote Sensing.
Sweden: Department of Physical Geography and Ecosystem Science Lund University,
58.
Hassan, H. A. (1981). Hydrogeological conditions of the central part of the Erbil basin.
Baghdad, 179.
Hassan, I. A. (1998). Urban hydrology of Erbil city Region. Iraq, 119.
Internal Report, Directorate of Ground water in Kurdistan Region, 2012, Erbil, ministry of
agriculture and water resources, General Directorate of Water Resources.
Internal report, to ensure water and food security in the Kurdistan Region. (n.d.). Erbil: ministry
of agriculture & water resources in Kurdistan region- general directorate of water
resources.
Jassim, S. Z., & Goff, J. C. (2006). Geology of Iraq. Czech Republic: Dolin, Prague and
Moravian Museum, Brno, 341.
Jawad, S. B., & A.Hussien, K. (1988). Groundwater monitoring network rationalization using
statistical analyses of piezometric fluctuation. Hydrological Sciences - Journal - des
Sciences Hydrologique, 181-191.
NCCI. (n.d.). Erbil NCCI governorate profile. Iraq:
http://www.ncciraq.org/images/infobygov/Erbil_Governorate_Profile_NCCI.pdf
Numan, N.M.S. (1997), A plate tectonic scenario for Phanerozoic succession in Iraq. Iraqi
Geology Journal,30(2), 85-110.
Stevanovic, Z., & Iurkiewicz, A. (2009). Groundwater management in northern Iraq.
Hydrogeology Journal, 367-378.
Stevanovic, Z., & Markovic, M. (2004). Hydrogeology of northern Iraq, climate, hydrology,
geomorphology and geology, Spec.edn. (Spec. Emerg. Prog. Serv.),1, FAO, Rome, 122.
UNDP. (2011). Drought Impact Assessment, Recovery and Mitigation Framework. Iraq.
Ur, J., Jong, L. d., Giraud, J., & F., J. (2013). Ancient cities and landscapes in the Kurdistan
region of Iraq: The Erbil Plain Archaeological Survey 2012 season. Iraq 75:89-118.

73
zarikrmanji.com. (n.d.). (not active) Accessable at:
http://www.zarikrmanji.com/kon/index.php?option=com_content&view=article&id=124
4:2010-09-20-07-48-44&catid=100:2010-02-04-05-05-42&Itemid=252. Erbil.
Software:
Adobe Illustrator (Version CS6) “Computer Software”, San Jose, Ca, USA: Adobe Systems
Incorporated
ArcGIS (Version 10.1) “Computer Software”, Redlands, CA: Esri
Global Mapper (Version 12.00) “Computer Software”, Hallowell, Maine: Blue Marble
Geographics
Microsoft Excel (Version 2010) “Computer Software”, Redmond, WA: Microsoft Coropartion
Rockware (Version 15) “Computer Software”, Golden, Co, USA: Rockware Inc.

VITA
Personal Background
Rubar Dizayee
Erbil, Kurdistan
Education
Diploma, Private Nilufer College, Erbil, 2006
Bachelor of Science, Geology, Salahaddin University, Hawler, 2010
Masters of Science, Geology, Texas Christian University, Fort Worth, Texas, 2014

ABSTRACT
GROUNDWATER DEGRADATION AND SUSTAINABILITY OF THE ERBIL BASIN,
ERBIL, KURDISTAN REGION, IRAQ
by Rubar Dizayee, MS, 2014
Department of Geology
Thesis Advisor: Becky Johnson, Professor of Professional Practice
Development stages of the Erbil Basin are poorly understood and the sustainable use of
groundwater in the basin is uncertain. This study characterizes water sustainability and its
significance through demonstrating the overexploitation and deficit rates of the groundwater
supply, whereby describing hydrologic conditions of the basin. Various data sets like climate,
soil, well measurements, and geology of the aquifers are compiled to understand current and
future conditions of the basin. The lithology, geometry, water level, and thickening and thinning,
of the two main aquifer systems are described across the basin. The natural groundwater flow,
groundwater level oscillations, and nature of hydrologic units for the basin are determined by
using subsurface mapping and cross sections.