groundwater characteristicand quality of … · groundwater characteristicand quality of unconfined...
TRANSCRIPT

GROUNDWATER CHARACTERISTIC AND QUALITY OF UNCONFINED AQUIFER IN CIREBON CITY
Mohamad Sapari Dwi HADIAN1, Riyan Rahmat HARDADI1, Moch. Nursiyam BARKAH2, Bombom Rachmat SUGANDA2 ; Dewandra Bagus Eka PUTRA3 Nana
SULAKSANA4
1,2 The Water Center, Faculty Geology Universitas Padjadjaran., 2Environmental Geology and Hydrogeology Laboratory, Faculty of Geology, Universitas Padjadjaran.,
3Department of Geological Engineering, Universitas Islam Riau., 4Geomorphology Laboratory, Faculty of Geology, Universitas Padjadjaran.
Corresponding Author: [email protected]
Abstract
There are a lot of benefits of groundwater for the survival of living beings. For humans the groundwater used to meet daily needs. Groundwater is the main source of drinking water for the people of Indonesia. The ground water quality in unconfined aquifer will definitely influence the utilization of water in certain conditions and region. The use and management of groundwater can be maximized with the reference of ground water. This research area is administratively located in five districts including Pekalipan, Kejaksan, Lemahwungkuk, Harjamukti, South Cirebon of Cirebon Regency, West Java Province. It is geographically located at 6° 47' 5.56" - 6° 41' 41.802" South Longitude and 10° 30' 2,71" - 108° 35' 28.73" East Longitude. The trend of groundwater system in the research area is dominated to northeast and flowing from the area with elevation of 70m above sea level. Based on the standard requirement of groundwater quality which was published by the Ministry of Health, No 492/menkes/per/IV/2010, the research area has a good quality of groundwater, but there are several regions with poor quality of groundwater, spreading on stations LB8-6, LB 4-11, LB 3-5. Those stations are located in the southern area. Regarding to the chemical parameter, the groundwater quality can be divided into 2 groups, very good quality on facies; HCO3 in the south and centre of research area indicates local and middle aquifer system, CA; HCO3 facies in the centre of research area indicates local aquifer system. The NoType facies; NoType at the centre of the research area indicates middle aquifer system. The good quality of NA+K; HCO3 in the northern part of the research area indicates deep and local aquifer system.
Keyword : unconfined, grondwater, water quality
INTRODUCTION Background The coast of North Java is a densely populated area which is an important area as a national road, that causes a highly growth of population and industry in the northern coastal region of Java. The rapid development and population growth are opposite from the ecosystem that has a condition of concern, not only the ocean that consists of coral reefs and other marine biota but also the mangrove forest is no longer there. The potential disaster around Pantura is very high, from the rob flooding, coastal abrasion, to pollution of river water and seawater by plant waste of factories around Pantura. Groundwater pollution is very worrying related to the
The 2nd Join Conference of Utsunomiya University and Universitas Padjadjaran, Nov.24,2017
48

coastal populations of northern Java who still rely heavily on ground water for their daily activities. Rapid land developments are increasing in developing regions that causes increasing necessary of Groundwater and increasing of groundwater pollution levels. By knowing the facies of ground water in the research area can be known the quality of groundwater and its changes, and the potential of ground water so that can be used as a reference in the management of groundwater use, groundwater conservation and sustainable development. The purposes of this research are: • To know the quality of groundwater in the research areas• To know the physical condition and chemistry of groundwater in the research area• To know the distribution pattern of groundwater flow in the research area
REGIONAL GEOLOGY
According to P.H. Silitonga, M.Masria and N.Suwarna (1996), the research area entered into the geological map of Cirebon sheet. The research area consist of 4 geological units, namely Alluvium Deposit, Coastal Deposit, the results of young Careme Volcano, and Gintung Formation. Alluvium Deposits: Pebbles, sands, and gray clays. Deposited along the river flood plains with about 5m thickness. Coastal Seaweed: Mud sediments of sediment, silt and gray clay containing shells deposited around the coast. Thickness reaches several meters. Young Careme Volcanoes: Lahar, breccia and tufan sandstone. Brecci outcrops are generally still unified, while tuffaceous and lava sandstones have been decayed and turned into sand and fragment of igneous rock. Continuous weathering produces a reddish-yellow or brownish overburden. Gintung Formation: Tufan tuffs, tuffling sandstone, conglomerate and breccias. Generally, rock units are almost flat, with density and not strongly cementing. In sandstones there are often splinters of plagioclase, quartz crystals, and vasicular. Breksi and conglomerate, wich have igneous rocks as fragment are andesite with the midline between 1-5cm, but there are local reach 50cm. Conglomerates contain both hard and nasty wood, and the remains of less preserved vertebrates. The age is Middle-Late Pliocene. The sedimentation environment is land to the transition. Uncovered unit thickness is estimated 90 m. The most obvious outcrops are found in Bukit puterlumbung. Overlapping unconformityabove Ciherang Formation. Based on the determination of the river area, the study area is partof the Cisanggarung Watershed. Based on Indonesia Groundwater Basin Map, West Java andDKI Jakarta (Sukrisna et al, 2004), research area included into groundwater basin Sumber-Cirebon
METHODOLOGY
The study was conducted by taking primary hydrogeological data. The method used in the form of hydrogeological mapping method. Hydrogeological mapping or hydrogeological system tracking method by interpreting the physical properties and chemical properties of water samples. Then from the results of research obtained both field research and laboratory research re-processed and obtained groundwater quality in the study area.
Physical Characteristics of Groundwater
The 2nd Join Conference of Utsunomiya University and Universitas Padjadjaran, Nov.24,2017
49

The physical properties of ground water depend on the quantity of water absorbed into the soil. At the time of absorption, underground geochemical processes affect the quality of ground water, temperature (T), electrical conductivity (EC), dissolved solids (TDS) and the acidity (pH) of the groundwater. 1. Electrical Conductivity (EC)2. Substance Dissolved (TDS)3. Acidity Value (pH)4. Temperature (oC)
Chemical Characteristics of Groundwater Chemical elements in groundwater can be divided into major, minor, and rare elements. The main ingredient (Major element) consists of Mg, Ca, Na, K, Cl, SO4 and HCO3 ions. This Main Element is used for groundwater chemical data presentations, whereas minor and rare elements are very rarely used and depend on the hydrogeological aspects studied (Davis and de Wiest, 1966). Presentation of chemical data can be done in two ways namely the presentation of numerical and graphical presentation. Numerical representation of data is presented in tabular form with units of meq / L, mg / l, or milimoles per liter. Graphical representations commonly used for specific purposes, used in research are Trilinear diagrams (Figure 1.3) commonly used in Piper diagrams (1944). This diagram assumes that all water in nature has a near-total quantity of anions and cations of the major element (assuming = 100%) .If the unit used is meq / I eating its assumption the chemical composition of water can be plotted on three triangular Piper triliniers as illustrated in Fig. 1.3
Figure 1.3 Trilinear diagram (Piper, 1944)
Groundwater Classification Generally Groundwater Classification uses some types of classification (Matthess & Harvey, 1982), namely: 1. Classification based on the origin of ground water. The classification used refers to theclassification of White (1957). This classification is based on the history of water formation.2. Classification by element content. The simplest classification is used by Davis and deWeist (1977) based on the amount of solute element concentration. Can be seen in Table 1.2
The 2nd Join Conference of Utsunomiya University and Universitas Padjadjaran, Nov.24,2017
50
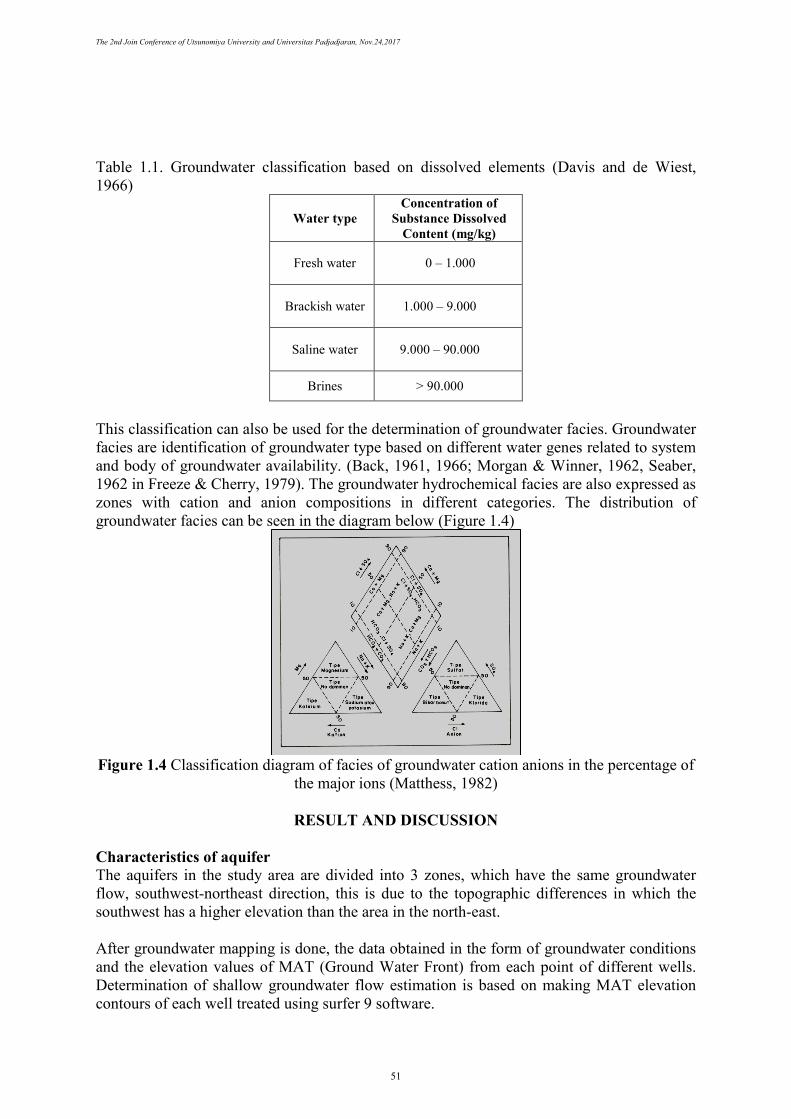
Table 1.1. Groundwater classification based on dissolved elements (Davis and de Wiest, 1966)
Water type Concentration of
Substance Dissolved Content (mg/kg)
Fresh water 0 – 1.000
Brackish water 1.000 – 9.000
Saline water 9.000 – 90.000
Brines > 90.000
This classification can also be used for the determination of groundwater facies. Groundwater facies are identification of groundwater type based on different water genes related to system and body of groundwater availability. (Back, 1961, 1966; Morgan & Winner, 1962, Seaber, 1962 in Freeze & Cherry, 1979). The groundwater hydrochemical facies are also expressed as zones with cation and anion compositions in different categories. The distribution of groundwater facies can be seen in the diagram below (Figure 1.4)
Figure 1.4 Classification diagram of facies of groundwater cation anions in the percentage of the major ions (Matthess, 1982)
RESULT AND DISCUSSION
Characteristics of aquifer The aquifers in the study area are divided into 3 zones, which have the same groundwater flow, southwest-northeast direction, this is due to the topographic differences in which the southwest has a higher elevation than the area in the north-east.
After groundwater mapping is done, the data obtained in the form of groundwater conditions and the elevation values of MAT (Ground Water Front) from each point of different wells. Determination of shallow groundwater flow estimation is based on making MAT elevation contours of each well treated using surfer 9 software.
The 2nd Join Conference of Utsunomiya University and Universitas Padjadjaran, Nov.24,2017
51

Physical Parameters
Wells and springs are one means to identify what happens to the groundwater flow system. Important information about aquifers can be determined by studying the quantity and quality of groundwater. The data of measurement of groundwater physical properties in the study area varies considerably from the LB wells to the LB 30-4 wells From the data obtained from each well station, the average groundwater temperature is 29,125 oC, with the most common temperature range being 29-30 oC. The average air temperature is 31.34 oC, with the most common temperature range being 31-32 oC. It appears that there is a small difference between groundwater temperatures and air temperature, indicating undipressed aquifer. In Segment 1 and Segment 2 data, groundwater and air temperature values do not vary much, indicating that groundwater flow in the study area is still influenced by air temperature, while some data that has a significant difference in groundwater and air temperature indicates that the flow system deeper groundwater. Measurement of water pH values from well stations is an important part of groundwater research. Generally the water ph value varies from 6 to 8. However a pH smaller than 6 is usually found in hyperthermal water. (hot water). Then the pH value of groundwater greater than 9 is an anomaly. The results of pH measurements in the study area ranged from 5.3 to 6.5 with the most common pH value of 6-6.5. Electrical conductivity values (EC) indicate an increase in dissolved ions which causes the value of water conductivity to increase as well. The range of EC values in the study area is between 400 - 1850 μS with an average value of 825.4 μS. From the data it is found that the distribution of EC values in Segments 1 and Segment 2 shows the EC trendline value in the research area, where in segment 1 shows the lower the elevation the lower the EC value, this indicates the occurrence of anomalies that are likely caused by sea water intrusion and segment 2 shows the lower the elevation the higher the Ec value, this indicates that the groundwater flow is concatenated. The greater the EC value the further the groundwater flows in the aquifer. Total Dissolve Solid is the value of organic and inorganic substances dissolved in water in molecules, ionized or microscopic (colloidal). Solid soluble substances can be calculated by summing up all the major ion concentrations. The greater the value of TDS, the greater the dissolved ions, this indicates that the interaction between groundwater and the high aquifer, as well as the small TDS value, the less dissolved the ion, this indicates the interaction between groundwater and aquifer is minimal. In the study area the average TDS value obtained was 404.4 mg / L with the most frequent range of TDS values being 300-430 mg / L. A high TDS value indicates a considerable distance between groundwater input and groundwater ouput. While low TDS values indicate close proximity between groundwater input and groundwater ouput.Based on the distribution of TDS values in Segment 1 this indicates the occurrence of anomalies that are likely caused by sea water intrusion and Segment 2 indicates that the area of the recharge area is in the southwest the research area and the more northeast area becomes dislocation. To know groundwater content in research area hence need to do chemical test on groundwater. The following are the results of the major element tests performed on LB stations 1-1, LB 3-11, LB 4-4, LB 5-4, LB9-1, LB 30-1, LB 30-2, LB 30-3, LB 30-4.Setelah processed and with the application of rockworks, then obtained data plot diagram piper. Based on the result of plotting the value of chemical test on piper diagram, it can be
The 2nd Join Conference of Utsunomiya University and Universitas Padjadjaran, Nov.24,2017
52

concluded that groundwater facies in the study area can be divided into 4, namely: 1. NoType; HCO3 on LB 3-11, LB 5-4, LB 30-1, Lb 30-2, LB 30-3, LB 30-42. NoType; NoType on LB 4-43. Ca; HCO3 on LB 9-14. Na + K, HCO3 on LB 1-1
Groundwater Quality Based on the water quality standard requirements set by the Minister of Health of the Republic of Indonesia number 492 / menkes / per / IV / 2010, water quality determination has many provisions, including physical water characteristics parameters, water chemistry, and biological properties of the water. This discussion focuses on the physical characteristics of water and the chemical properties of the water. • Physical PropertiesBased on the water classification according to Mandel (1981) and water classificationaccording to Davies and De Wiest in Syahwan (2007), water in the study area includinggroundwater is with an EC value between 30 - 2.000 μS. TDS concentration in research areaaccording to Ministry of Health Regulation number 492 / menkes / per / IV / 2010 is still atthe normal limit of <500mg / L.In facies 1, NoDominantType, HCO3 at LB 3-11 station, LB 5-4, LB 30-1, LB 30-2, LB 30-3,LB 30-4 are mixed facies between medium and local ground water flow, HCO3 is thought tooriginate from contact with air or water still dominated by rainfall. In Facet 2,NoDominantType, NoDominantType at LB 4-4 station, is a medium ground water flow.In facies 3 namely Ca; HCO3 at station LB 9-1, is a local groundwater flow, where the HCO3element is thought to originate from contact with air or water still dominated by rainfall. Thenin the facies of 4 Na + K, HCO3 at LB 1-1, a mixed facies between the groundwater flowregionally and the local groundwater flow, where HCO3 is estimated to come from contactwith air or water is still dominated by rain water, while Na + K is estimated to originate froma very remote source.
CONCLUSIONS
Hydrogeology of research area is divided into 3 ie aquifer 1, aquifer 2, and aquifer 3. Where Aquifer 1 is aquifer with moderate productivity and widespread deployment Extensive, moderately productive aquifers, this aquifer has moderate overload; groundwater level or high groundwater psiometry near or above ground level .. Aquifer 2 is This area is rare or insignificant groundwater. In this area has a shallow groundwater above groundwater salt. Aquifers 3 Aquifers with moderate productivity and widespread deployment Extensive, moderately productive aquifers, aquifers with varying degrees; Groundwater level generally in; the emergence of various discharge springs, generally large on vesicular lava. Based on the standard water quality requirements set by the Ministry of Health of the Republic of Indonesia number 492 / menkes / per / IV / 2010, the research area generally has good water quality, but there are some areas that have poor water quality, that is at station LB 8 -6, LB 4-11, LB 3-5, where the station is spread over the southern area of the study area. Based on the Kimianya Parameters groundwater quality can be divided into 2, with excellent quality in NoType facies; HCO3 in the southern and central regions of the study indicating local and intermediate aquifer systems, Ca facet HCO3 in the center of the study area indicating local aquifer system, NoType facies Notype in the middle of the study area indicating medium aquifer system. Good quality of facies Na + K; HCO3On the northern part
The 2nd Join Conference of Utsunomiya University and Universitas Padjadjaran, Nov.24,2017
53

of the study area indicating inner and local aquifer systems. The groundwater flow pattern in the research area is generally north-east, where the flow of groundwater flows from areas with an altitude of about 70 masl.
REFERENCES Bemmelen, R.W. Van.1949.The Geology of Indonesia, Vol. IA, The Hague Martinus Nijhoff,
Netherland. Marta, W. dan Adidarma, W. 1983. Mengenal Dasar-Dasar Hidrologi. Bandung: Nova. Mandel, S., & Shiftan, Z. L..1981. Groundwater resources: Investigation and development.
New York: Academic Press. Fetter, C, W. 2001 . Applied Hydrogeology. Prentice-Hall, Inc : Upper Saddle River,
New Jersey. P.H. Silitonga, M.Masria dan N.Suwarna .1996 .Peta Geologi Lembar Cirebon, Jawa. Pusat
Penelitian dan Pengembangan Geologi : Bandung. Takeda, K dan Sorodarsono, S. 1987 . Hydrologi Untuk Pengairan . Pradnya Paramita:
Jakarta Todd, DK., 1984, Groundwater Hydrology, 2nded, John Wiley & Sons, New York,
USA. Kruseman, G.P., & M.A de Ridder,1994, Analysis & Evaluation of Pumping Test Data,
Publication 47, Wegeningen, The Netherlands. Piper, A.M.,1944, A Graphic Procedure in The Geochemical Interpretation of Water
Analysis, Trans. Am. Geophys. Union, Washington, D.C. Stiff, H.A., Jr., 1951, The Interpretation of Chemical Water Analysis by means of Patterns, J.
Petrol. Tehnol., Dallas. Matthess G & Harvey J.C, 1982; The Properties of Groundwater, John Wiley & Sons,
Canada. Davis, S.N & De Weist, 1966, Hydrogeology, John Wiley and Sons, United States of
America. W. Adam Sigler, Jim Bauder .TDS Fact Sheet. Montana State University.Freeze, RA & Cherry, JA, 1986.Groundwater. Prentice Hall Inc. New Jersey.Sutresna, Nana. 2007. Cerdas Belajar Kimia. Bandung: Grafindo Media Pratama.Silitonga, P.H, M. Masria, dan N.Suwarna. 1996. Peta Geologi Lembar Cirebon, Jawa. Pusat
Penelitian dan Pengembangan Geologi. Bandung. Harsono, W.F.1977.The Kromong Carbonate Rocks and Their Relationship with
The Cibulakan and Parigi Formation. Proceedings Indonesian Petroleum Association.
Djuri.1995. Peta Geologi Lembar Arjawinangun, Jawa. Pusat Penelitian dan Pengembangan Geologi. Bandung.
The 2nd Join Conference of Utsunomiya University and Universitas Padjadjaran, Nov.24,2017
54