ground target location errors derived from measurements
TRANSCRIPT
AD-A209 523
Ground Target LocationErrors Derived fromMeasurements Collectedfrom a Variety ofHypothetical SatelliteSentinel Systems
Michael A. Crombie
DTICJ% ELECTE3JUN30 198911
June 1989 0 D-
Approved for public release; distribution is unlimited.
U.S. Army Corps of EngineersEngineer Topographic LaboratoriesFort Belvoir, Virginia 22060-5546

Destroy this report when no longer needed.Do not return it to the originator.
The findings in this report are not to be construed as an officialDepartment of the Army position unless so designated by otherauthorized documents.
The citation in this report of trade names of commercially availableproducts does not constitute official endorsement or approval of theuse of such products.
UNCLASSIFIEDSECURITY CLASSIFICATION OF THIS PAGE
IForm Approved
REPORT DOCUMENTATION PAGE o Approved
Ia. REPORT SECURITY CLASSIFICATION 1b. RESTRICTIVE MARKINGSUNCLASSIFIED2a. SECURITY CLASSIFICATION AUTHORITY 3. DISTRIBUTION/AVAILABILITY OF REPORT
Approved for Public Release;2b. DECLASSIFICATION / DOWNGRADING SC.EDULE Distribution is Unlimited.
4. PERFORMING ORGANIZATION REPORT NUMBER(S) S. MONITORING ORGANIZATION REPORT NUMBER(S)
ETL-0538
6a. NAME OF PERFORMING ORGANIZATION 6b. OFFICE SYMBOL 7a. NAME OF MONITORING ORGANIZATION
U.S. Army Engineer Topographic (If applicable)
Laboratories I CEETL-SPL6c. ADDRESS (City, State, and ZIP Code) 7b. ADDRESS (City, State, and ZIP Code)
Fort Belvoir, Virginia 22060-5546
Ba. NAME OF FUNDING/SPONSORING 8 b, OFFICE SYMBOL 9. PROCUREMENT INSTRUMENT IDENTIFICATION NUMBERORGANIZATION (If applicable)
8c, ADDRESS (City, State, and ZIP Code) 10. SOURCE OF FUNDING NUMBERS
PROGRAM PROJECT TASK WORK UNITELEMENT NO. NO. NO. ACCESSION NO.
I 4A762707 A 85511. TITLE (Include Security Classification)
Ground Target Location Errors Derived from Measurements Collected from a Variety of Hypothetical SatelliteSentinel System
12. PERSONAL AUTHOR(S)
Michael A. Crombie13a. TYPE OF REPORT 13b. TIME COVERED 14. DATE OF REPORT (Year, Month, Day) IS. PAGE COUNT
Technical Report FROM May 88 TO Sep 8 1989, June 4816. SUPPLEMENTARY NOTATION
17. COSATI CODES 18. SUBJECT TERMS (Continue on reverse if necessary and identify by block number)FIELD GROUP SUB-GROUP i
Satellite Constellations, Target Location, Stellar Camera,, Real Xime
Attitude19. ABSTRACT (Continue on reverse if necessary and identify by block number)
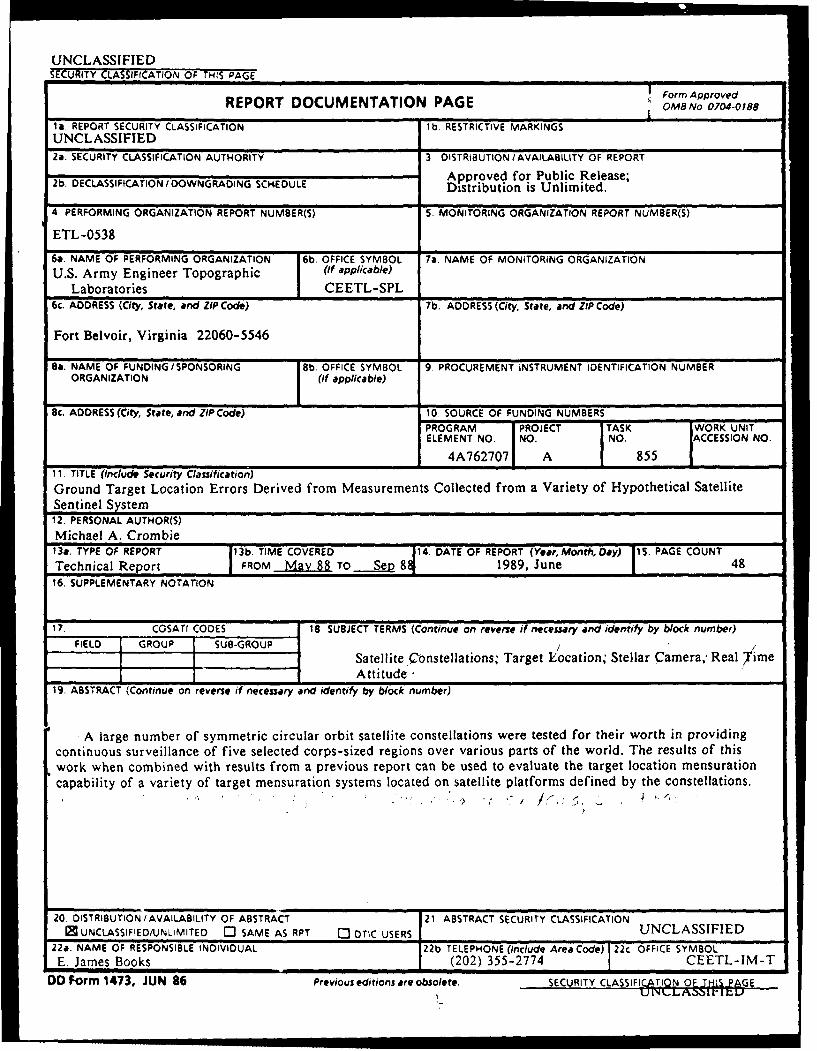
A large number of symmetric circular orbit satellite constellations were tested for their worth in providingcontinuous surveillance of five selected corps-sized regions over various parts of the world. The results of thiswork when combined with results from a previous report can be used to evaluate the target location mensurationcapability of a variety of target mensuration systems located on satellite platforms defined by the constellations.
20. DISTRIBUTION/AVAILABILITY OF ABSTRACT 21. ABSTRACT SECURITY CLASSIFICATIONMUNCLASSIFIEDIUNLIMITED [I SAME AS RPT D OTIC USERS UNCLASSIFIED
22a. NAME OF RESPONSIBLE INDIVIDUAL 22b TELEPHONE (Include Area Code) 22c OFFICE SYMBOLE. James Books (202) 355-2774 CEETL-IM-T
DD Form 1473, JUN 86 Previous editions are obsolete. SECURITY CLASSIFI CATIONOE.TJ-i4._PGEU N O j.LA &I G U

CONTENTS
TITLE PAGE
PREFACE v
FIGURES iv
TABLES iv
INTRODUCTION 1
EXPERIMENT I
ATTITUDE 1
Star Camera - Gyro System 2Star Camera 2Star Camera - Target Camera Relative Orientation 2
SENTINEL CONSTELLATIONS 5
TARGET AREAS 6
TARGET MENSURATION 6
NUMERICAL RESULTS 7
ATTITUDE 7
SENTINEL COVERAGE 11
DISCUSSION 38
CONCLUSIONS 42
TIC Accesion For
NSPEC NTIS CRA&IDTIC TAB
Ju ~ IdCJh~OnUnannotor~ed
ByDist Ib,tior, f
Avalabil:ty Codes
AvaVl :nd lor01t;_ciI
iii

FIGURES
Figure Page
I Relative Orientation of First Star Camera 4
2 Relative Orientation of Second Star Camera 4
TABLES
Table Page
I Target Areas 6
2 Y(99%) Circular Errors For One Star Camera 9
3 Y(99%) Circular Errors For Two Star Cameras 10
4 Single Coverage Summary Results 12
5 Double Coverage Summary Results 19
6 Triple Coverage Summary Results 26
7 Quadruple Coverage Summary Results 32
8 Fraction of Programmed Coverage 38
9 99% Spherical Errors of Position 40
10 Numerical Example 41
iv

PREFACE
This study was conducted under DA Project 4A762707A855, "Topographic MappingTechnology."
The study was conducted during the spring and summer of 1988 under the supervision ofMr. Donald R. Barnes, Chief, Space Concepts Division; and Dr. Joseph J. Del Vecchio, Director,Space Programs Laboratory.
Col. David F. Maune, EN, was Commander and Director, and Mr. Walter E. Boge wasTechnical Director during the report preparation.
VI
GROUND TARGET LOCATION ERRORS DERIVED FROM MEASUREMENTS COLLECTEDFROM A VARIETY OF HYPOTHETICAL SATELLITE SENTINEL SYSTEMS
INTRODUCTION
A hypothetical sentinel system defined by a variety of possible satellite constellations isevaluated for its ground point target mensuration capability. The satellite constellations weredesigned to provide single, double, triple and quadruple ground coverage. 1 Five corps-sizedregions were selected for the target location evaluation. Each of the trial constellations wasallowed to run for 24 hours and each target point within each target region was tested every 5minutes to see if the programmed number of lines of sight occurred. In every case, the averagedistance to target and its standard deviation were calculated for each corps-sized region as wellas a summary average and summary standard deviation over all corps-sized regions. In the caseof double coverage and greater, the average angular distance and its standard deviation werecalculated between pairs of target trackers as viewed simultaneously from the target. In thecases of triple coverage and greater, the average value and its standard deviation of minimumPDOP (Position Dilution of Precision) were calculated from the simultaneous slant rangeobservations on the target. The average distance to target, average angle, and average minimumPDOP can be used in conjunction with another ETL report to derive expected 99% targetspherical errors as a function of expected target tracking system error. 2
EXPERIMENT
Real time exterior orientation is a requirement of the hypothetical sentinel target trackingsystem. The position component will be derived from knowledge of the target tracker's orbit. Theorbit will be determined through ground tracking aided by GPS (Global Positioning System)calculations where applicable. The attitude component will be derived from a star camera-gyrosystem, which is discussed in more detail below.
Attitude. The following comments pertain to the general problem of target cameradetermination when attitude information is transferred to the target camera from one or morestellar cameras rigidly locked to the target camera. More than one star camera is sometimesneeded to cancel the adverse effect in the target camera caused by a poor estimate of the starcamera yaw angle (rotation about the star camera Z-axis). It should be noted here that aninaccurate estimate of the yaw angle will cause little or no problem in the target camera if targetsare measured at the principal point and if the star camera and the target camera are parallel.Estimates of the adverse effect of a variety of one-stellar and two-stellar camera configurationson target image positions are given in tables 2 and 3.
1 T.J. Lang. "Symmetric Circular Orbit Satellite Censtellations For Continuous Global Coverage," AAS/AIAA Astro-
dynamics Specialist Conference. Kalispell, Montana, August 1987.
2 M.A. Crombie. Target Location Errors Derived From A Hypothetical Target Tracking System. U.S. Army Engineer
Topographic Laboratories, Fort Belvoir, Virginia, 22060-6546. Report ETL-0531, February 1989.
I

Star Camera - Gyro System. A hypothetical real time attitude system is conceivedalong the lines described by Strikwerda.' In that work, star cameras were conceived around solidstate digital imaging array technology for real time computation of highly accurate attitude onthe order of one arc second or less. That system includes one or more star cameras rigidlyoriented with respect to a 3-axis gyro system, wherein vehicle rotation rates are measured aboutthree mutually orthogonal gyro axes. The angular rate data are integrated over time to produceinstantaneous attitude data and also to provide estimates of star camera attitudes at futureexposure times. The estimated star camera attitudes are used as first estimates in a least-squaresadjustment process and also to determine a set of stars that will most likely be imaged by thepertinent star camera. It is expected that approximately five star images per exposure will beavailable for the least-squares attitude determination. The two attitude estimates, namely the onederived by integration and the other derived by the star camera adjustment, are combined by adiscrete Kalman filter process to produce an optimal estimate of the attitude at specific times.
Star Camera. At present, plans are underway to evaluate star camera performance inthe NASA space shuttle. The star camera, being fabricated under contract, is a narrow angle,solid-state focal plane device composed of an array of 512 by 403 detectors. One-half of thedetectors in the 512 dimension are exposed to the star field and the other half are used forstorage. Detector dimensions are 20 micrometers (along the 512 dimension) by 16 micrometers(along the 403 dimension). The focal length is 41.0 millimeters which provides a 7.2 degreefield-of-view by a 9.0 degree field-of-view. Starlight is slightly defocused in the camera in orderto spread a star image over 9 to 16 neighboring detectors. Star image coordinates are determinedby a centroid process. It is expected that coordinate accuracy can be determined to 2 percent ofa detector dimension. The scan times of the field-of-view are performed rapidly enough so thatthe exposure times for the several star images can be considered to be at the same instant.
An estimate of the star camera attitude, derived from the gyro subsystem, is used as a firstestimate in a least-squares process and used also to select a subset of star directions from the starcatalog data base. A sophisticated star identification procedure is used to coordinate star imageswith star directions. A refined attitude estimate is produced by a least-squares adjustment of thestar image observations.
The shuttle experiment will also incorporate an on-board processor element designed todemonstrate the practical feasibility of real time autonomous attitude determination. A successfulcompletion of this experiment is anticipated to further substantiate the hypothetical real timeattitude system previously described.
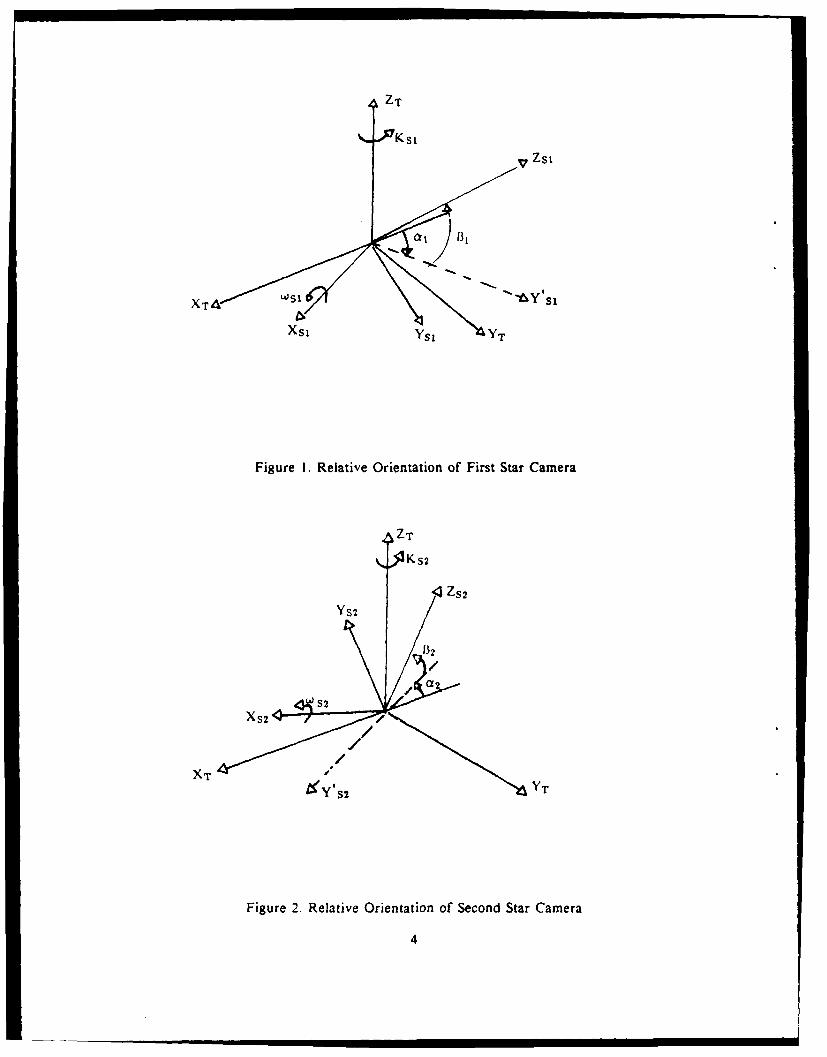
Star Camera - Target Camera Relative Orientation. The interlock angles for two starcameras with respect to the target camera are defined in the following way. Consider figure 1,where the Xs, -axis is in the XTYT-plane. The same is true for the Xs2-axis (see figure 2). Fromfigure I, 83, is the elevation angle of the Z9 -axis above the XTYT-plane. Since the Xs, -axis isin the XTYT-plane, a rotation of w5s = 900 - 81 about the Xs -axis will rotate the Zs,-axis intothe ZT-axis. From figure 1, a, is the angular distance of the -XT -axis to the Y's, -axis measuredclockwise in the XTYT-plane. A rotation of Ks1 = -(90 ° - a,) about the Z's, -axis = Zr-axis willcomplete the rotation of the first star camera reference frame into the target camera referenceframe. The roll, pitch, and yaw angles that affect this transformation are
3 Thomas E. Strikwerda and John L. Junkins. Star Pattern Recornition and Spacecraft Attitude Determination, U.S.Army Engineer Topographic Laboratories, Fort Belvoir, Virginia 22060-6546, ETL-0260, May 1981, AD-AI03 806.
2
WSJ " 90' - B1
Psi - 00
K9g - -(90" - al)
The parameters (a, I31) are chosen by the user to reflect a desired orientation.
From figure 2, fl is the elevation angle of the Zs 2-axis above the XTY-plane. Since theXs 2-axis is in the XTYT-plane, a rotation of ws2 - -(90" - Q2) about the Xs2-axis will rotate theZsraxis into the Zr-axis. From figure 2, a. is the angular distance of the -XT-axis to the -Y'S2-axis measured counter clockwise in the XTYr-plane. A rotation of K82 - (900 - a2) about theZ's2 - ZT-axis will complete the rotation of the second star camera reference frame into thetarget camera reference frame. The roll, pitch, and yaw angles that affect this transformation are
WS2 = - (900 - 12)
PS2- 0*
K82 - (90" - as)
Note that if a - B - 900 for either star camera, the star camera and the target camera areparallel.
3
ZT
ZSK
X-T WSJ / t"'Y'sl
XsI YsI YT
Figure 1. Relative Orientation of First Star Camera
ZT
K S2
X~~r 'Y'ss 2
Figure 2. Relative Orientation of Second Star Camera
4
• , , , I I I I

Sentinel Constellations. A variety of sentinel constellations are evaluated to determine howthey perform as platforms for ground target location determination. 4 The constellations arecharacterized by symmetric circular orbits, wherein every satellite within a specific constellationhas a common inc*ination and a common elevation above the earth. The constellations fall intofour groups ,lepanding on whether they are designed to provide single, double, triple, orquadruple ground coverage.
A specific constellation is characterized by six parameters. A set of three integers (T/P/F)is used to define the total number of satellites in the constellation (T), the number of orbitalplanes (P), and the relative phasing parameter (F). Since the satellites in a particular constellationare symmetrically arranged, there must be T/P satellites in a given plane, all equally spaced incentral angle. The P orbital planes must be equally spaced in right ascension of the ascendingnode. The relative phasing parameter F is used to relate satellites in one orbital plane to thosein another plane. For example, if there is a satellite at its ascending node in one orbital plane,then the argument of latitude of a satellite in an adjacent plane will be F* 360 degrees.
T
Three more parameters are used to completely define the constellation. The first is i, theinclination of the orbital planes. The second is C, the elevation angle of the satellite viewingcone. The angle e is the smallest viewing angle that a ray from the satellite makes with a planetangent to the earth. The viewing angle was set to 5 degrees so as to avoid ground clutter. Thethird parameter is e, the angle at the center of the earth subtended by the satellite viewing cone.The elevation h of the satellite above the earth is determined from the following equation:
Cos+ h/RE
where RE is the earth radius. The orbits were determined by using the following values for theearth radius RE and GM, the product of the constant of gravitation and the mass of the earth.
RE = 6378144.0 meters
GM - 3.986018 X 10¹⁴ meter 3/second 2
4 T.J Lang. 'Symmetric Circular Orbit Satellite Constellations For Continuous Clobal Coverage,* AAS/AIAAAstrodynamics Specialist Conference. Kalispell, Montana, August 1987.
5

Target Areas. Five corps-sized target areas were designated for the error analysis. The
locations of the five target areas are specified in table 1.
Table 1. Target Areas
Target Area Location * (degrees) X(degrees) H (meters) Az (degrees)
South Nicaragua 12.0 -85.0 500.0 0.0Central America
2 Al Basrah 30.5 48.0 50.0 60.0Persian Gulf
3 Fulda 50.5 9.66 600.0 80.0South Germany
4 Damascus 33.5 36.5 600.0 90.0Syria
5 Seward Peninsula 65.0 -163.0 1500.0 90.0Alaska
Nine target points were regularly spaced over each approximately 335 by 335 kilometersquare target areas. The azimuth angle pertains to the orientation of the central line of pointswith respect to the central meridian defined by X. The central target point location is definedby 0 and X. Each point within a target area was assigned an elevation above the sphere definedby H.
Target Mensuration. One of the objectives of this effort was to determine how well groundtargets could be determined from images of targets sensed by target trackers based on platformsborne by a constellation of satellites. Associated with the effort was a requirement to determineif the cunstellations described above could be used, and specifically to determine if they did infact meet their programmed coverage specifications.
The coverage requirement was tested simply by operating each constellation for 24 hoursand at 5-minute intervals, determining whether every point in each of the five test areas wasobserved simultaneously by at least the specified nimber of satellites. Target measuring accuracyfor all four coverage modes was examined by measuring average distances to target and theirstandard deviation, and then relating those values to expected errors of a hypothetical targettracking system. 5 In the case of double coverage and greater, target measuring accuracy wasexamined by measuring average angular distance, and its standard deviation, between pairs oftarget trackers as viewed simultaneoulsy from the target. In the case of triple coverage andgreater, target measuring accuracy was examined by measuring minimum PDOP, and its standarddeviation, calculated from three simultaneous slant range observations on the target. Positiondilution of precision (PDOP) is the square root of the trace of the covariance matrix associatedwith the least squares adjustment of the three slant range observations divided by the expectedstandard error in slant range. Minimum PDOP and average angular values were also related tothe referenced hypothetical target tracking system.
5 M.A. Crombie. Target Location Errors Derived From A Hypothetical Target Tracking System. U.S. Army EngineerTopographic Laboratories, Fort Belvoir, Virginia 22060-5546. Report ETL-0531, February 1989.
6

NUMERICAL RESULTS
Attitude. The covariance matrix of the three fundamental angles of a star camera rotationmatrix was estimated by Monte Carlo methods. The rotation matrix, Aps, relates the starcoordinate reference system to the star camera coordinate frame. The fundamental angles aredefined to be roll (was), pitch (PS), and yaw (Ks). One of the objectives of the work is to estimatethe covariance matrix of the three fundamental angles of the target camera rotation matrix APT.
It was assumed in the simulation that Aps= I. The assumption is not realistic, but the followin%artifice can, be used to obtain the covariance matrix of the three angles associated with APT.Let
APT = ASTAS S ApS5
where Ap 1 = A S TAPT
and AS = I
AST is the constant rotation matrix which relates the star camera to the target camera. APT is therotation matrix which relates object space to the target camera. The (3x3) matrix of partialderivatives of (OpT, PPT, KpT) with respect to (os, Ps, K) are given in a previous report.7 IfE is defined to be that matrix and if apsis the star camera covariance matrix, then the targetcamera covariance matrix is
0 PT= EcFpsET
capswas estimated by averaging 25,000 two star least squares solutions. The numerical resultsturned out to be ( 2.9667 x 10⁻¹⁰ -9.8103 x 10⁻¹⁸ 1.3637 x 10⁻¹¹
Ups= -9.8103 x 10⁻¹⁶ 2.9622 x 10⁻¹⁰ 2.7628 x 10⁻¹²
1.3637 x 10 "n 2.7628 x 10⁻¹² 8.8682 x 10⁻⁸ /The measuring error associated with each star image was assumed to be one micrometer. Crps canbe made more general by multiplying the numerical result by 2M 2/N where N > 2 is the numberof star measurements and where M is the standard deviation of the star image measuring error.
Let U be the (2x3) matrix of partial derivatives of the target coordinates with respect to(WPT, PPT, KPT), then the (2x2) covariance matrix of the target coordinates due to star cameraerrors given in a previous report is
UT = UEaps E TUT
6 M. A. Crombie. Mapping Camera Image Errors Due to Star Camera Identification and Measuring Errors. U.S. Army
Engineer Topographic Laboratories, Fort Belvoir, Virginia 22060-5646. Report ETL-RN-73-1, January 1973,AD-759 491.
7 Ibid.
8 Ibid.
7

where2.9667 x 10"*0 -9.8103 x 10-" ' 1.3637 x 10"11
aps - 2M.! -9.8103 x 10.18 2.9622 x 10⁻¹⁰ 2.7628 x 10⁻¹²
N ( )1.3637 x 10⁻¹ 2.7628 x 10⁻¹² 8.8682 x 10⁻⁸
where
M - Star measurement error in micrometers
and
N - Expected number of star images
If K star cameras are used for orientation, then
T - U ( Ek PsE)1k E )" uT
If, on average, five stars are measured with a measuring error of 1/50 of a pixel, then N= 5 and M = 0.4/Mm. The standard deviations associated with Aps are
-~e - 0.90 secondsaps - 0.90 secondsOKS - 15.54 seconds
Note that the standard error in the yaw angle is over 17 times larger than the otherstandard errors. It was stated in the section entitled "Experiment" that a large error in yaw wouldnot cause a large error in the target camera coordinates if the target image was at the principalpoint. Suppose the target camera focal length is 75.000 millimeters, the target image coordinatesare zero and AST- I; then
aT = micrometers'00.11)
and'Y(99%) = 0.99 micrometers
,'(99%) is the 99 percent circular error for the target error due to star camera error. If thetarget camera focal length is Q * 75.000 millimeters then aT(Q) - Q2 * UT( 75.000) and Y(9 9%)Q= Q *-Y(99%) * 75.000. These relations do not hold if the target image is not at the principalpoint.
Suppose now that the target camera has a field of view of 10 degrees in the X and Ydirections. Suppose also that the star camera's orientation with respect to the target camera isdefined by 13, the elevation angle of the star camera optical axis above the focal plane of thetarget camera (see figure I or figure 2). (99%) circular errors for target coordinate errors dueto star camera errors are presented in table 2. The parameter 6 pertains to the angular distanceof a target image from the optical axis. 6 = 14 degrees pertains to the corners of the squareformat. The target camera focal length is 75.000 millimeters and the star camera errors are thosedescribed previously.
, I_ I I I I I I l I8
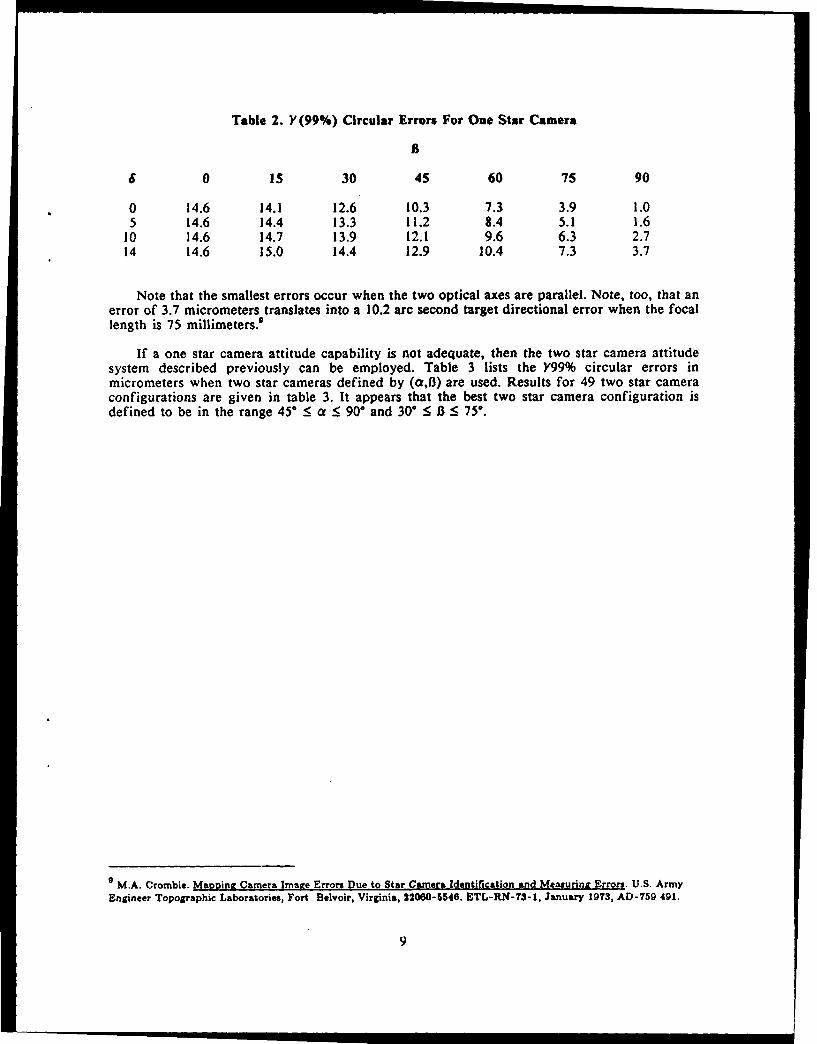
Table 2. Y(99%) Circular Errors For One Star Camera
B
4 0 is 30 45 60 75 90
0 14.6 14.1 12.6 10.3 7.3 3.9 1.05 14.6 14.4 13.3 11.2 8.4 5.1 1.6
10 14.6 14.7 13.9 12.1 9.6 6.3 2.714 14.6 15.0 14.4 12.9 10.4 7.3 3.7
Note that the smallest errors occur when the two optical axes are parallel. Note, too, that anerror of 3.7 micrometers translates into a 10.2 arc second target directional error when the focallength is 75 millimeters.'
If a one star camera attitude capability is not adequate, then the two star camera attitudesystem described previously can be employed. Table 3 lists the Y99% circular errors inmicrometers when two star cameras defined by (a,B) are used. Results for 49 two star cameraconfigurations are given in table 3. It appears that the best two star camera configuration isdefined to be in the range 45 : a : 90* and 30* < 13 < 75*.
M.A. Crombie. Mapping Camera Image Errors Due to Star Camera Identification and Measurini Errors. U.S. ArmyEngineer Topographic Laboratories, Fort Belvoir, Virginia, 22060-5546. ETL-RN-7S-1, January 1973, AD-759 491.
9

Table 3. 'Y (99%) Circular Errors For Two Star Cameras
a
B 6 0. 15' 30' 450 60" 75" 90"
0° 10.3 2.3 1.2 1.0 1.2 2.3 10.30o 5' 10.3 2.3 1.2 1.0 1.2 2.3 10.4
100 10.3 2.3 1.2 1.0 1.3 2.3 10.614° 10.3 2.3 1.2 1.0 1.3 2.4 10.9
0° 9.9 2.3 1.2 1.0 1.1 1.7 2.35° 10.2 2.3 1.3 1.0 1.1 1.7 2.3
10 10.4 2.4 1.3 1.0 1.2 1.7 2.314 10.6 2.4 1.3 1.0 1.2 1.8 2.4
0° 8.9 2.2 1.2 0.9 1.0 1.1 1.2
3 o 9.4 2.4 1.3 1.0 1.0 1.1 1.2100 9.8 2.5 1.3 1.0 1.0 1.2 1.314' 10.2 2.6 1.4 1.0 1.0 1.2 1.3
0' 7.3 2.2 1.2 0.9 0.9 0.9 0.945" 50 7.9 2.4 1.3 1.0 0.9 0.9 0.9
10' 8.6 2.6 1.4 1.0 0.9 0.9 0.914' 9.1 2.7 1.5 1.1 0.9 0.9 0.9
0' 5.2 2.1 1.2 0.9 0.8 0.8 0.8
60' 5' 6.0 2.4 1.4 1.0 0.8 0.8 0.810' 6.7 2.7 1.5 1.1 0.9 0.8 0.8140 7.4 3.0 1.7 1.2 1.0 0.9 0.8
0' 2.7 1.8 1.1 0.9 0.8 0.7 0.75' 3.6 2.3 1.5 1.1 0.9 0.8 0.7
10* 4.5 2.9 1.8 1.3 1.0 0.9 0.8140 5.2 3.4 2.1 1.5 1.2 1.0 0.9
0. 0.7 0.7 0.7 0.7 0.7 0.7 .0750 1.1 1.1 1.1 1.1 1.1 1.1 1.1
90 ° 1.9 1.9 1.9 1.9 1.9 1.9 1.9140 2.6 2.6 2.6 2.6 2.6 2.6 2.6
10

Sentinel Coverage. Summary results for coverage tests and accuracy parameters are presented intables 4, 5, 6, and 7, where table 4 pertains to single coverage, table 5 pertains to double coverage,and so on. These data are averages taken from all nine points from the five test regions. Three linesof data are presented for each constellation. The first line of data is
T/P/F, 9, i, PER, h
whereT: Total number of satellites
P. Number of orbital planes
F: Relative phasing parameter
9: Central coverage angle in degrees
i: Inclination in degrees
PER: Orbital period in hours
h: Satellite height in nautical miles
The minimum viewing angle e was set to 5 degrees for all constellations. The eccentricity e wasset to zero for all constellations.
The second line of data is
DIST, 0 DIST, a, Ga, PDOP, aPDOP
where
DIST: Average distance to target in metersdivided by 10 .
ODIST: Standard deviation of distance to targetin meters divided by 10 .
C: Average angle from target to two targettrackers in degrees.
a: Standard deviation of a in degrees.
PDOP: Average value of minimum PDOP calculatedfrom three target trackers.
aPnoP: Standard deviation of minimum PDOP.
Note that table 4 pertains to single coverage and therefore contains only distance to target data.Table 5 pertains to double coverage and therefore contains distance and angular data. Tables 6 and7 contain complete sets of accuracy parameter data.
The third line of data consists of relative frequencies beginning at Po and extending to PN, whereN is the largest number of target trackers that viewed the target. Po is the relative frequency of thetarget not being viewed by any of the target trackers, P1 is the relative frequency of the target beingviewed by exactly one target tracker, and so on.
11

Table 4. Single Coverage Summary Results
5/5/1 69.150 43.660 9.809 9117.810
19.363 1.423
0.517 0.068 0.042 0.069 0.113 0.191
5/5/3 75.500 51.800 20.881 17343.210
34.778 1.513
0.006 0.137 0.789 0.068
6/6/4 66.420 53.130 7.785 7323.660
16.027 1.357
0.126 0.184 0.428 0,261
6/2/0 66.720 52.240 7.970 7494.180
16.384 1.367
0.000 0.237 0.681 0.080 0.001
7/7/5 60.260 55.690 5.172 4754.030
11.140 1.292
0.001 0.316 0.651 0.032
7/7/1 60.500 48.000 5.243 4829.300
11.250 1.265
0.574 0.048 0.045 0.034 0.054 0.110 0.090 0.045
8/8/6 56.520 61.870 4.252 3750.860
9.267 1.159
0.023 0.268 0.675 0.034
8/2/1 56.900 48.200 4.331 3840.070
9.358 1.198
0.000 0.292 0.518 0.178 0.011
12

Table 4. Single Coverage Summary Results (continued)
9/9/7 54.810 70.540 3.926 3378.620
8.586 1.165
0.004 0.331 0.615 0.048 0.002
9/9/1 57.280 49.880 4.413 3931.850
9.522 1.194
0.578 0.047 0.044 0.028 0.027 0.042 0.085 0.094 0.055
9/9/2 57.900 61.300 4.554 4087.390
9.940 1.206
0.000 0.151 0.658 0.187 0.003
9/3/0 61.900 70.500 5.697 5300.730
12.329 1.280
0.000 0.036 0.728 0.234 0.002
10/10/7 51.535 47.930 3.419 2777.83
7.227 1.092
0.004 0.174 0.676 0.137 0.008
10/5/2 52.231 57.110 3.516 2894.780
7.556 1.100
0.241 0.180 0.151 0.253 0.174
10/5/1 52.300 47.400 3.526 2906.670
7.503 1.107
0.112 0.143 0.394 0.260 0.091
10/10/2 52.500 48.800 3.555 2941.420
7.588 1.112
0.000 0.135 0.688 0.176 0.001
13

Table 4. Single Coverage Summary Results (continued)
10/2/0 53.200 47.700 3.660 3066.770
7.820 1.125
0.000 0.264 0.424 0.244 0.068
11/11(4 47.610 53.790 2.959 2206.000
6.141 1.023
0.016 0.267 0.597 0.120
12/3/1 47.900 50.730 2.989 2243.740
6.199 1.022
0.000 0.072 0.791 0.137
12/3/2 48.300 58.800 3.031 2296.870
6.361 1.037
0.001 0.140 0.769 0.089
12/6/3 49.500 66.700 3.164 2464.160
6.751 1.075
0.000 0.255 0.573 0.172
12/12/2 49.600 48.500 3.176 2478.660
6.668 1.058
0.001 0.112 0.559 0.315 0.014
12/1210 50.200 57.500 3.247 2567.570
6.901 1.073
0.000 0.107 0.662 0.219 0.012
1212/1 50.400 46.500 3.272 2597.960
6.879 1.074
0.000 0.211 0.384 0.264 0.141
14

Table 4. Single Coverage Summary Results (continued)
13/13/5 43.760 58.440 2.616 1760.510
5.241 0.957
0.076 0.388 0.263 0.258 0.017
14/7/4 41.960 53.980 2.483 1582.880
4.833 0.922
0.027 0.207 0.683 0.082 0.001
14/2/0 49.300 46.400 3.141 2435.430
6.551 1.052
0.000 0.130 0.367 0.253 0.250
15/3/1 42.130 53.510 2.495 1598.920
4.869 0.922
0.011 0.161 0.681 0.137 0.010
15/5/1 42.700 53.500 2.536 1653.810
4.987 0.933
0.043 0.179 0.493 0.281 0.005
15/15/6 42.700 65.300 2.536 1653.810
5.000 0.945
0.090 0.271 0.447 0.174 0.018
16/815 40.100 56.500 2.361 1416.500
4.477 0.890
0.021 0.265 0.567 0.146
16/16/2 43.700 51.500 2.611 1754.300
5.186 0.949
0.031 0.104 0.415 0.414 0.035
15
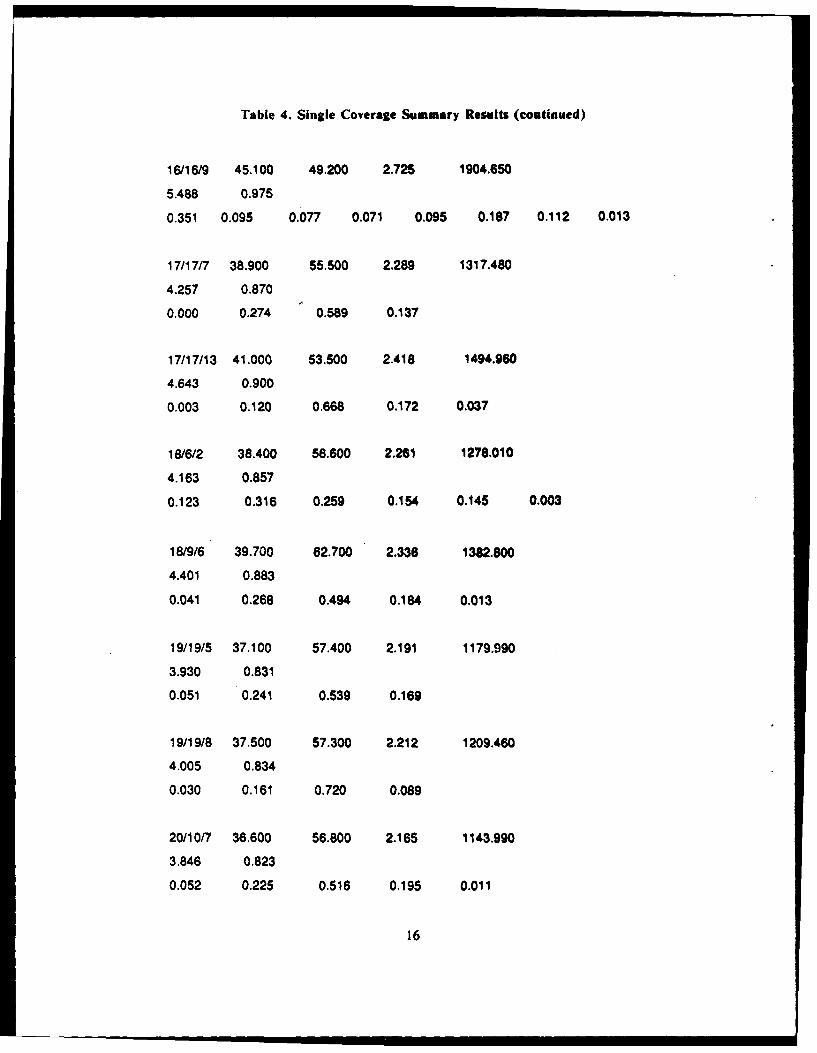
Table 4. Single Coverage Summary Results (continued)
16/16/9 45.100 49.200 2.725 1904.650
5.488 0.975
0.351 0.095 0.077 0.071 0.095 0.187 0.112 0.013
17/17/7 38.900 55.500 2.289 1317.480
4.257 0.870
0.000 0.274 0.589 0.137
17/17/13 41.000 53.500 2.418 1494.960
4.643 0.900
0.003 0.120 0.668 0.172 0.037
18/612 38.400 56.600 2.261 1278.010
4.163 0.857
0.123 0.316 0.259 0.154 0.145 0.003
18/9/6 39.700 62.700 2.336 1382.800
4.401 0.883
0.041 0.268 0.494 0.184 0.013
19/19/5 37.100 57.400 2.191 1179.990
3.930 0.831
0.051 0.241 0.539 0.169
19/19/8 37.500 57.300 2.212 1209.460
4.005 0.834
0.030 0.161 0.720 0.089
20/10/7 36.600 56.800 2.165 1143.990
3.846 0.823
0.052 0.225 0.516 0.195 0.011
16

Table 4. Single Coverage Summary Results (continued)
20/20/12 40.800 69.400 2.405 1477.200
4.612 0.911
0.070 0.099 0.586 0.204 0.042
2117/3 36.700 61.100 2.170 1151.120
3.868 0.828
0.155 0.253 0.260 0.215 0.116
21/21/9 37.300 62.000 2.201 1194.650
3.974 0.837
0.010 0.191 0.654 0.143 0.002
22/22/6 35.240 58.400 2.099 1050.550
3.620 0.797
0.050 0.281 0.446 0.196 0.027
22/11/8 35.740 58.000 2.123 1084.160
3.706 0.806
0.001 0.183 0.695 0.119 0.002
22/22/18 37.190 60.100 2.195 1186.5703.947 0.835
0.012 0.124 0.682 0.168 0.014
23/23/14 34.700 58.700 2.075 1015.18
3.541 0.786
0,000 0.225 0.667 0.103 0.005
23/23/10 35.420 57.300 2.108 1062.550
3.653 0.801
0.021 0.185 0.573 0.213 0,009
17

Table 4. Single Coverage Summary Results (continued)
23123/16 36.100 56,600 2.140 1108.890
3.766 0.811
0.143 0.194 0.350 0.111 0.113 0.086 0,002
24/6/1 35.640 58.400 2.118 1077.37
3.690 0.804
0.060 0.185 0.371 0.366 0.017
24/24/20 35.970 74.400 2.134 1099.910
3.732 0.818
0,011 0.281 0.809 0.088 0.010 0.001
24/12/7 36.740 55.800 2.172 1153.980
3.871 0.823
0.029 0.149 0.416 0.293 0.113
18

Table 5. Double Coverage Summary Results
7/7/2 75.970 61.810 22.517 18415.470
36.884 1.500 76.651 13.537
0.000 0.013 0.456 0.463 0.068
8/8/2 71.000 57.100 11.767 10737.770
22.163 1.389 76.466 14.163
0.000 0.000 0.462 0.524 0.015
8/8/6 74.000 58.000 16.798 14536.700
29.603 1.466 52.893 21.023
0.000 0.000 0.359 0.430 0.209 0.002
8/8/5 74.200 56.500 17.261 14865.610
30.162 1.501 58.521 23.385
0.028 0.090 0.148 0.370 0.365
9/3/2 66.200 62.100 7.653 7202.130
15.910 1.335 55.017 25.422
0.000 0.017 0.400 0.542 0.040 0.001
9/3/0 66.800 65.500 8.021 7540.620
16.521 1.316 59.223 17.788
0.000 0.000 0.508 0.438 0.054
10/10/2 64.100 61.600 6.571 6173.370
13.954 1.313 69.052 16.311
0.000 0.000 0.420 0.466 0.114
10/5/2 65.151 52,560 7.077 6660.430
14.794 1.342 54.368 20.424
0.087 0.143 0.102 0.193 0.326 0.148
19

Table 5. Double Coverage Summary Results (continued)
10/10/7 65.173 62.830 7.088 6671.190
14.902 1.319 53.393 21.779
0.000 0.001 0.341 0.535 0.123 0.001
10/10/8 65.500 49.400 7.260 6834.050
15.091 1.356 65.640 12.956
0.000 0.000 0.218 0.557 0.222 0.002
10/2/0 73.100 44.400 14.953 13194.260
26.990 1.480 70.329 19.154
0.000 0.000 0.035 0.261 0.693 0.012
11/11/9 62.000 52.700 5.733 5336.680
12.264 1.277 56.126 21.126
0.000 0.001 0.342 0.366 0.285 0.006
12/3/1 56.600 57.000 4.268 3769.440
9.283 1.180 55.547 16.701
0.000 0.000 0.452 0.426 0.121 0.001
1216/2 56.600 54.000 4.268 3769.440
9.249 1.179 55.325 20.540
0.182 0.142 0.091 0.124 0.270 0.179 0.012
12/3/2 56.700 58.500 4.289 3792.810
9.349 1.180 57.609 19.105
0.000 0.000 0.421 0.500 0.076 0.002
12/12/10 59.300 56.800 4.903 4467.480
10.633 1.222 59.399 16.041
0.000 0.002 0.310 0.479 0.210
20

Table 5. Double Coverage Summary Results (continued)
12/2/0 63.700 45.700 6.395 6000.930
13.504 1.329 66.334 21.092
0.000 0.000 0.143 0.239 0.549 0.068
12/2/1 64.300 45.000 6.662 6262.160
14.003 1.344 66.951 19.646
0.000 0.000 0.108 0.239 0.576 0.072 0.004
13/13/3 54.700 52.800 3.907 3356.190
8.439 1.143 60.110 20.463
0.000 0.034 0.335 0.433 0.198
14/14/10 52.400 53.800 3.540 2923.990
7.597 1.099 54.659 23.954
0.009 0.103 0.255 0.372 0.261
14/14/3 52.800 53.500 3.599 2994.430
7.700 1.113 60.949 21.660
0.000 0.033 0.275 0.515 0.177
14/2/0 59.000 44.600 4.824 4382.440
10.387 1.246 63.962 19.133
0.000 0.000 0.160 0.217 0.459 0.141 0.022
15/3/1 51.300 55.300 3.388 2739.510
7.242 1.084 56.593 21.799
0.000 0.005 0.340 0.489 0.157 0.009
15/15/11 51.500 58.600 3.415 2772.080
7.332 1.091 60.016 18.745
0.008 0.085 0.257 0.426 0.223
21

Table 5. Double Coverage Summary Results (continued)
16/4/2 49.860 52.100 3.206 2516.790
6.763 1.057 54.037 22.031
0.000 0.000 0.244 0.585 0.170 0.001
16/4/3 50.350 58.800 3.266 2590.320
6.966 1.072 52.376 20.208
0.000 0.003 0.271 0.629 0.094 0.002
16/8/3 50.360 51.800 3.267 2591.850
6.917 1.067 69.572 15.331
0.000 0.000 0.229 0.548 0.222 0.001
16/16/6 50.630 52.200 3.301 2633.370
6.995 1.073 54.724 25.476
0.014 0.069 0.285 0.181 0.426 0.025
17/17/3 47.780 55.000 2.976 2228.040
6.204 1.023 62.569 22.240
0.013 0.068 0.281 0.376 0.262
17/17/10 50.250 49.800 3.254 2575.130
6.860 1.084 67.272 14.473
0.000 0.000 0.149 0.508 0.330 0.013
17/17/14 51.280 56.500 3.385 2736.280
7.245 1.084 60.880 16.622
0.000 0.000 0.203 0.473 0.280 0.044
18/18/14 46.710 53.600 2.870 2092.890
5.915 1.005 58.939 19.892
0.000 0.002 0.210 0.688 0.100
22

Table 5. Double Coverage Summary Results (continued)
18/18/3 47.830 55.700 2.981 2234.570
6.221 1.024 63.029 23.143
0.016 0.051 0.223 0.380 0.330
18/18/4 48.300 51.500 3.031 2296.870
6.321 1.029 58.708 16.559
0.000 0.000 0.233 0.429 0.308 0.030
18/9/6 48.600 55.000 3.063 2337.560
6.430 1.034 53.285 21.759
0.000 0.008 0.151 0.603 0.235 0.003
19/19/11 45.870 55.300 2.793 1992.520
5.716 0.989 66.733 16.383
0.000 0.000 0.327 0.460 0.203 0.009
19/19/15 45.920 55.200 2.797 1998.360
5.728 0.990 53.683 22.464
0.000 0.021 0.262 0.512 0.205
19/19/7 46.300 59.000 2.832 2043.290
5.841 1.006 54.710 24.202
0.032 0.135 0.304 0.168 0.217 0.145
20/4/2 44.180 54.500 2.649 1804.540
5.317 0.960 58.127 18.718
0.000 0.000 0.303 0.551 0.132 0.014
20/20/3 45.910 53.800 2.796 1997.190
5.699 0.992 62.982 22.999
0.016 0.038 0.215 0.279 0.428 0.025
23
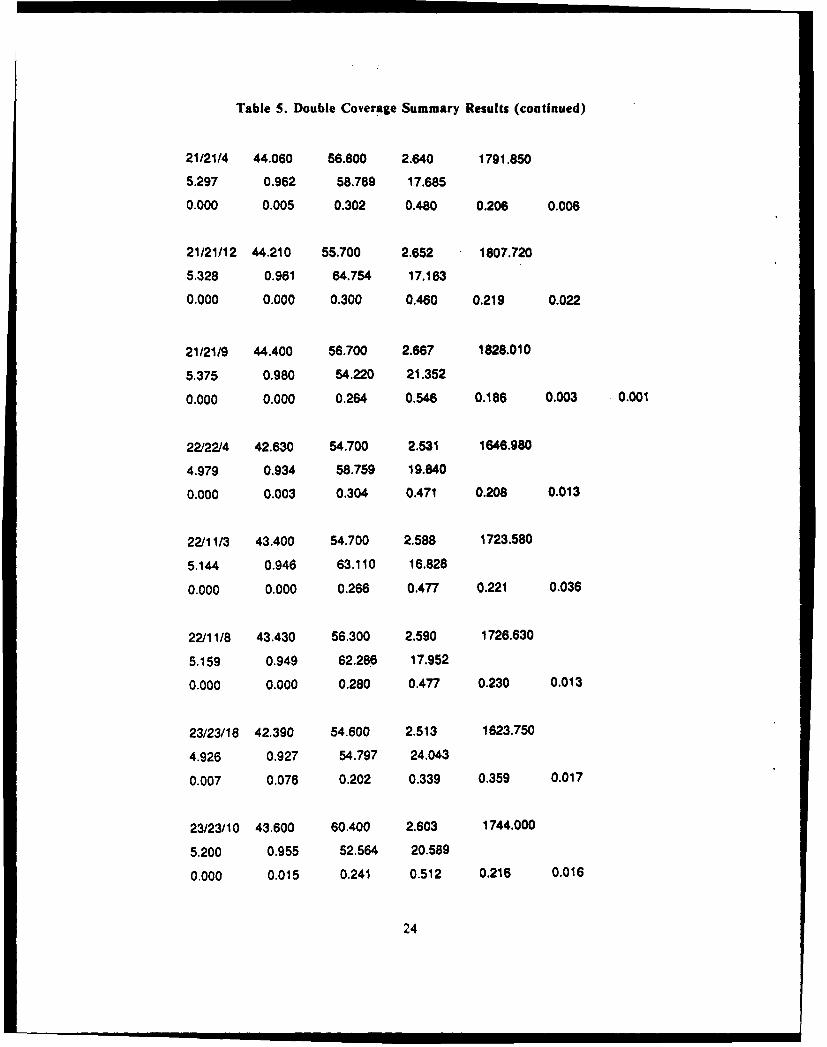
Table 5. Double Coverage Summary Results (continued)
21/21/4 44.060 56.800 2.640 1791.850
5.297 0.962 58.789 17.685
0.000 0.005 0.302 0.480 0.206 0.006
21/21/12 44.210 55.700 2.652 1807.720
5.328 0.961 64.754 17.163
0.000 0.000 0.300 0.460 0.219 0.022
21/21/9 4.400 56.700 2.667 1828.010
5.375 0.980 54.220 21.352
0.000 0.000 0.264 0.546 0.186 0.003 0.001
22/22/4 42.630 54.700 2.531 1646.980
4.979 0.934 58.759 19.640
0.000 0.003 0.304 0.471 0.208 0.013
22/11/3 43.400 54.700 2.588 1723.580
5.144 0.946 63.110 16.828
0.000 0.000 0.266 0.477 0.221 0.036
22/11/8 43.430 56.300 2.590 1726.630
5.159 0.949 62.286 17.952
0.000 0.000 0.280 0.477 0.230 0.013
23/23/18 42.390 54.600 2.513 1623.750
4.926 0.927 54.797 24.043
0.007 0.076 0.202 0.339 0.359 0.017
23/23/10 43.600 60.400 2.603 1744,000
5.200 0.955 52.564 20.589
0.000 0.015 0.241 0.512 0.216 0.016
24

Table 5. Double Coverage Summary Results (continued)
23/23/9 43.700 56.500 2.611 1754.300
5.207 0.965 69.669 14.767
0.000 0.014 0.139 0.596 0.240 0.012
24/12/3 41.340 57.400 2.441 1525.580
4.724 0.912 62.832 17.803
0.000 0.000 0.336 0.457 0.178 0.029
24/12/9 41.870 57.000 2.477 1574.440
4.826 0.920 49.337 21.345
0.000 0.000 0.360 0.344 0.246 0.049
24/24/14 42.110 54.200 2.494 1597.030
4.867 0.924 58.409 24.219
0.011 0.023 0.149 0.456 0.361
25

Table 6. Triple Coverage Summary Results
9/9/3 83.036 59.320 220.681 96664.565
181 .729 1.8005 62.119 23.470 25.289 91.647
0.000 0.000 0.146 0.263 0.316 0.273 0.001
9/9/7 84.877 58.576 14076.426 1594725.547
2956.335 1.667 62.951 18.862 11.454 42.505
0.000 0.000 0.004 0.268 0.414 0.262 0.051
1 0/1 0/8 80.300 60.000 59.694 38427.360
74.035 1.572 66.371 17.743 4.374 33.129
0.000 0.000 0.001 0.174 0.470 0.351 0.003
11/11/3 74.600 59.800 18.255 15561.620
31.609 1.485 62.122 23.353 5.120 12.389
0.000 0.000 0.016 0.213 0.557 0.163 0.047 0.004
11/11/9 75.80 52.00 21.901 18014.930
36.126 1.521 66.189 23.180 3.663 8.875
0.000 0.000 0.024 0.127 0.421 0.336 0.092
12/4/2 70.900 60.000 11.644 10639.210
22.362 1.410 54.027 22.481 10.157 44.707
0.000 0.000 0.000 0.270 0.536 0.160 0.034
12/4/3 71.100 49.500 11.891 10837.760
22.661 1.453 55.127 21.924 13.738 71.384
0.000 0.000 0.000 0.140 0.610 0.173 0.075 0.001
12/12/10 71.900 53.800 12.976 11693.260
24.283 1.470 65.100 19.414 4.462 22.338
0.000 0.000 0.003 0.203 0.485 0.261 0.048
26
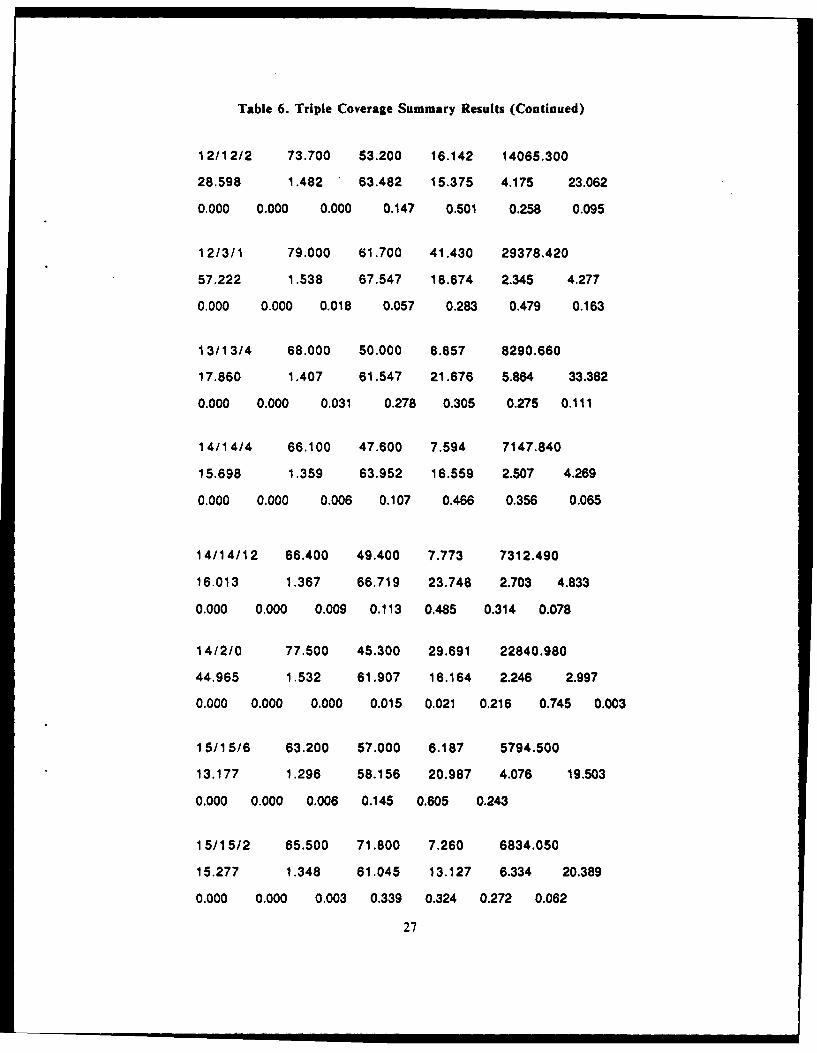
Table 6. Triple Coverage Summary Results (Continued)
12/12/2 73.700 53.200 16.142 14065.300
28.598 1.482 63.482 15,375 4.175 23.062
0.000 0.000 0.000 0.147 0.501 0.258 0.095
12/3/1 79.000 61.700 41.430 29378.420
57.222 1.538 67.547 18.674 2.345 4.277
0.000 0.000 0.018 0.057 0.283 0.479 0.163
1 3/1 3/4 68.000 50.000 8.857 8290.660
17.860 1.407 61.547 21.676 5.864 33.382
0.000 0.000 0.031 0.278 0.305 0.275 0.111
14/14/4 66.100 47.600 7.594 7147.840
15.698 1.359 63.952 16.559 2.507 4.269
0.000 0.000 0.006 0.107 0.466 0.358 0.065
14/14/12 66.400 49.400 7.773 7312.490
16.013 1.367 66.719 23.748 2.703 4.833
0.000 0.000 0.009 0.113 0.485 0.314 0.078
14/2/0 77.500 45.300 29.691 22840.980
44.965 1.532 61.907 16.164 2.246 2.997
0.000 0.000 0.000 0.015 0.021 0.216 0.745 0.003
15/15/6 63.200 57.000 6.187 5794.500
13.177 1.296 58.156 20.987 4.076 19.503
0.000 0.000 0.006 0.145 0.605 0.243
15/15/2 65.500 71.800 7.260 6834.050
15.277 1.348 61.045 13.127 6.334 20.389
0.000 0.000 0.003 0.339 0.324 0.272 0.062
27

Table 6. Triple Coverage Summary Results (Continued)
16/16/14 61.670 54.900 5,618 5219.270
12.058 1.271 64.519 19.994 2.690 9.570
0.000 0.000 0.002 0.115 0.560 0.315 0.008
16116/4 61.840 53.200 5.676 5279.320
12.118 1.346 63.663 19.290 3.990 15.106
0.000 0.000 0.053 0.180 0.403 0.294 0.070
16/4/3 63.970 57.800 6.513 6116.590
13.806 1.303 58.217 20.421 6.725 40.071
0.000 0.000 0.000 0.213 0.329 0.292 0.160 0.006
17/17/15 60.080 58.300 5.119 4698.550
11.098 1.233 62.953 22.013 2.819 7.153
0.000 0.000 0.001 0.106 0.647 0.200 0.046
17/17/7 60.910 53.500 5.369 4961.500
11.564 1.257 67.329 14.835 2.039 3.918
0.000 0.000 0.000 0.092 0.459 0.397 3.052
17/17/4 61.870 46.700 5.687 5290.010
12.119 1.375 65.601 18.226 2.959 11.206
0.000 0.000 0.003 0.081 0.368 0.375 0.174
18/18/4 57.700 51.600 4.508 4036.410
9.742 1.212 64.719 17.796 3.143 13.334
0.000 0.000 0.038 0.143 0.409 0.348 0.062
18/9/4 57.870 60.100 4.547 4079.690
9.909 1.204 57.863 24.023 8.355 35.265
0.000 0.000 0.015 0.236 0.456 0,229 0.064
28

Table 6. Triple Coverage Summary Results (Continued)
18/18/16 58.680 55.500 4.742 4293.950
10.286 1.212 62.775 18.740 2.375 4.325
0.000 0.000 0.002 0.055 0.607 0.305 0.031
19/19/14 57.050 53.900 4.363 3875.990
9.463 1.185 67.944 16.047 2.019 1.225
0.000 0.000 0.000 0.047 0.588 0.320 0.045 0.001
1919/17 57.270 53.500 4.411 3929.400
9.555 1.190 62.030 19.550 2.703 12.736
0.000 0.000 0.003 0.070 0.494 0.377 0.056
19/19/5 57.830 54.000 4.537 4069.450
9.906 1.139 61.277 17.727 2.663 13.929
0.000 0.000 0.000 0.051 0.418 0.344 0.187 0.001
20/5/3 53.550 51.800 3.715 3131.670
7.986 1.123 53.731 24.347 5.839 19.763
0.000 0.000 0.004 0.127 0.617 0.206 0.044 0.002
20/20/12 55.160 52.500 3.989 3451.150
8.622 1.152 59.198 23.457 3.639 8.541
0.000 0.000 0.000 0.073 0.546 0.325 0.054 0.003
20/20/8 55.880 50.200 4.124 3606.140
8.907 1.169 67.183 15.877 1.970 1.321
0.000 0.000 0.000 0.046 0.463 0.396 0.091 0.003
21/21/5 51.970 55.100 3.479 2850.300
7.464 1.096 56.611 19.641 7.268 35.971
0.000 0.000 0.004 0.327 0.343 0.253 0.073
29

Table 6. Triple Coverage Summary Results (Continued)
21/3/2 53.190 54.700 3.659 3064.930
7.882 1.116 62.987 21.611 2.883 11.129
0.000 0.000 0.001 0.074 0.678 0.179 0.068
21/3/0 54.380 52.200 3.852 3291.920
8.306 1.138 63.377 21.387 2.205 3.217
0.000 0.000 0.000 0.025 0.581 0.282 0.111 0.001
22/22/16 50.730 52.400 3.314 2648.930
7.035 1.074 68.343 16.256 2.501 10.138
0.000 0.000 0.001 0.149 0.561 0.278 0.001
22/ 11/5 52.780 52.100 3.596 2990.860
7.710 1.109 63.289 19.881 3.154 17.237
0.000 0.000 0.015 0.120 0.346 0.435 0.084 0.001
22/1 1/7 52.800 55.700 3.599 2994.430
7.752 1.109 53.323 23.622 4.441 25.119
0.000 0.000 0.002 0.055 0.595 0.304 0.035 0.007 0.003
23/23/14 51.320 55.200 3.390 2742.750
7.248 1.084 63.961 18.216 2.324 2.689
0.000 0.000 0.007 0.132 0.425 0.388 0.048
23/23/10 51.890 54.500 3.468 2836.820
7.431 1.093 58.095 22.065 6.078 47.613
0.000 0.000 0.001 0.153 0.405 0.298 0.120 0.024
23/23/17 52.240 52.300 3.517 2896.330
7.531 1.099 59.715 22.485 4.386 25.427
0.000 0.000 0.001 0.096 0.401 0.331 0.167 0.005
30

Table 6. Triple Coverage Summary Results (Continued)
24/12/5 49.170 51.800 3.126 2416.930
6.562 1.046 62.964 18.493 3.658 15.469
0.000 0.000 0.025 0.152 0.420 0.303 0.099
24/8/4 49.590 54.200 3.174 2477.210
6.703 1.053 67.683 16,663 2.072 2.362
0.000 0.000 0.000 0.098 0.559 0.309 0.034
24/24/14 50.310 52.400 3.261 2584.240
6.901 1.068 57.271 22.945 3.623 7.388
0.000 0.000 0.001 0.033 0.523 0.394 0.045 0.004
24/312 50.300 54.000 3.260 2582.720
6.913 1.065 62.123 20.597 2.506 7.655
0.000 0.000 0.000 0.037 0.571 0.349 0.042
31
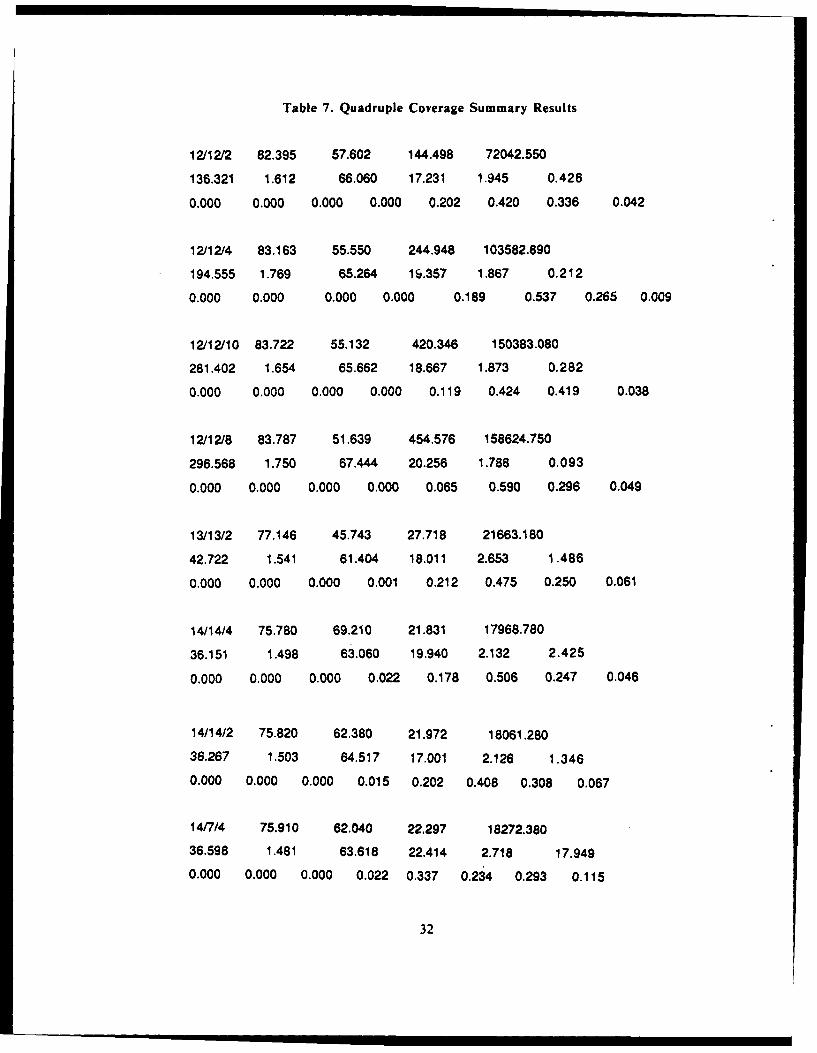
Table 7. Quadruple Coverage Summary Results
12/12/2 82.395 57.602 144.498 72042.550
136.321 1.612 66.060 17.231 1.945 0.426
0.000 0.000 0.000 0.000 0.202 0.420 0.336 0.042
12/12/4 83.163 55.550 244.948 103582.890
194.555 1.769 65.264 1 .357 1,867 0.212
0.000 0.000 0.000 0.000 0.189 0.537 0.265 0.009
12/12/10 83.722 55.132 420.346 150383.080
281.402 1.654 65.662 18.667 1.873 0.282
0.000 0.000 0.000 0.000 0.119 0.424 0.419 0.038
12/12/8 83.787 51.639 454.576 158624.750
296.568 1.750 67.444 20.256 1.788 0.093
0.000 0.000 0.000 0.000 0.065 0.590 0.296 0.049
13/13/2 77.146 45.743 27.718 21663.180
42.722 1.541 61.404 18.011 2.653 1.486
0.000 0.000 0.000 0.001 0.212 0.475 0.250 0.061
14/14/4 75.780 69.210 21.831 17968.780
36.151 1.498 63.060 19.940 2.132 2.425
0.000 0.000 0.000 0.022 0.178 0.506 0.247 0.046
14/14/2 75.820 62.380 21.972 18061.280
36.267 1.503 64.517 17.001 2.126 1.346
0.000 0.000 0.000 0.015 0.202 0.408 0.308 0.067
14/7/4 75.910 62.040 22.297 18272.380
36.598 1.481 63.618 22.414 2.718 17.949
0.000 0.000 0.000 0.022 0.337 0.234 0.293 0.115
32

Table 7. Quadruple Coverage Summary Results (continued)
14/14/11 76.000 70.100 22.629 18487.730
37.109 1.498 62.277 23.606 2.420 3.766
0.000 0.000 0.004 0.020 0.264 0.375 0.292 0.032 0.014
14/14/9 76.000 61.800 22.629 18487.730
37.026 1.516 64.780 23.395 2.463 1.775
0.000 0.000 0.000 0.025 0.184 0.438 0.294 0.058 0.001
15/15/2 70.900 55.700 11.644 10639.210
21.959 1.412 61.509 17.486 2.835 1.104
0.000 0.000 0.000 0.000 0.436 0.349 0.215
15/5/4 71.700 67.300 12.689 11469.640
23.982 1.431 64.032 19.065 1.980 0.500
0.000 0.000 0.000 0.000 0.334 0.443 0.202 0.021
15/3/1 73.100 54.400 14.953 13194.260
27.106 1.479 66.476 21.182 1.878 0.677
0.000 0.000 0.000 0.000 0.139 0.362 0.492 0.006
16/16/5 69.030 57.600 9.702 9025.850
19.310 1.406 62.668 19.530 4.155 31.785
0.000 0.000 0.000 0.045 0.255 0.340 0.318 0.036 0.007
16/16/10 69.130 56.800 9.791 9102.390
19.446 1.404 63.075 22.044 2.527 11.107
0.000 0.000 0.000 0.014 0.357 0.225 0.306 0.097
16/8/5 71.020 59.000 11.791 10757.650
22.585 1.428 61.780 19.537 2.161 8.850
0.000 0.000 0.000 0.012 0.139 0.480 0.243 0.124 0.002
33

Table 7. Quadruple Coverage Summary Results (continued)
17/17/11 67.020 50.500 8.164 7670.510
16.715 1.389 65.737 21.701 2.082 2.718
0.000 0.000 0.000 0,026 0.156 0.362 0.369 0.087
17/17/5 67.420 52.100 8.435 7915.140
17.190 1.383 59.117 21.204 2.968 10.532
0.000 0.000 0.000 0.006 0.224 0.226 0.320 0.118 0.050
17/17/7 68.180 59.700 8.995 8412.550
18.176 1.375 66.228 15.847 1.883 0.205
0.000 0.000 0.000 0.002 0.093 0.582 0.316 0.006
18/3/2 64.180 54.700 6.607 6208.680
13.958 1.313 63.952 20.466 1.948 0.692
0.000 0.000 0.000 0.000 0.275 0.378 0.327 0.019
18/3/1 64.210 56.700 6.621 6221.990
14.000 1.310 63.628 20.317 1.914 0.271
0.000 0.000 0,000 0.000 0.310 0.368 0.298 0.025
18/6/5 66.240 57.200 7.677 7224.010
15.909 1.337 64,817 23.363 1.919 0.757
0.000 0.000 0.000 0.006 0.106 0.505 0.314 0.067 0.003
19119/5 63.040 58.100 6.123 5730.480
13.073 1.291 61.038 18.468 2.099 1.775
0.000 0.000 0.000 0.009 0.282 0.413 0.201 0.086 0.009 0.001
19/19/8 63.860 59.600 6.465 6069.100
13.731 1.295 63.527 22.309 2.869 17.998
0.000 0.000 0.002 0.049 0.215 0.288 0.389 0.057
34
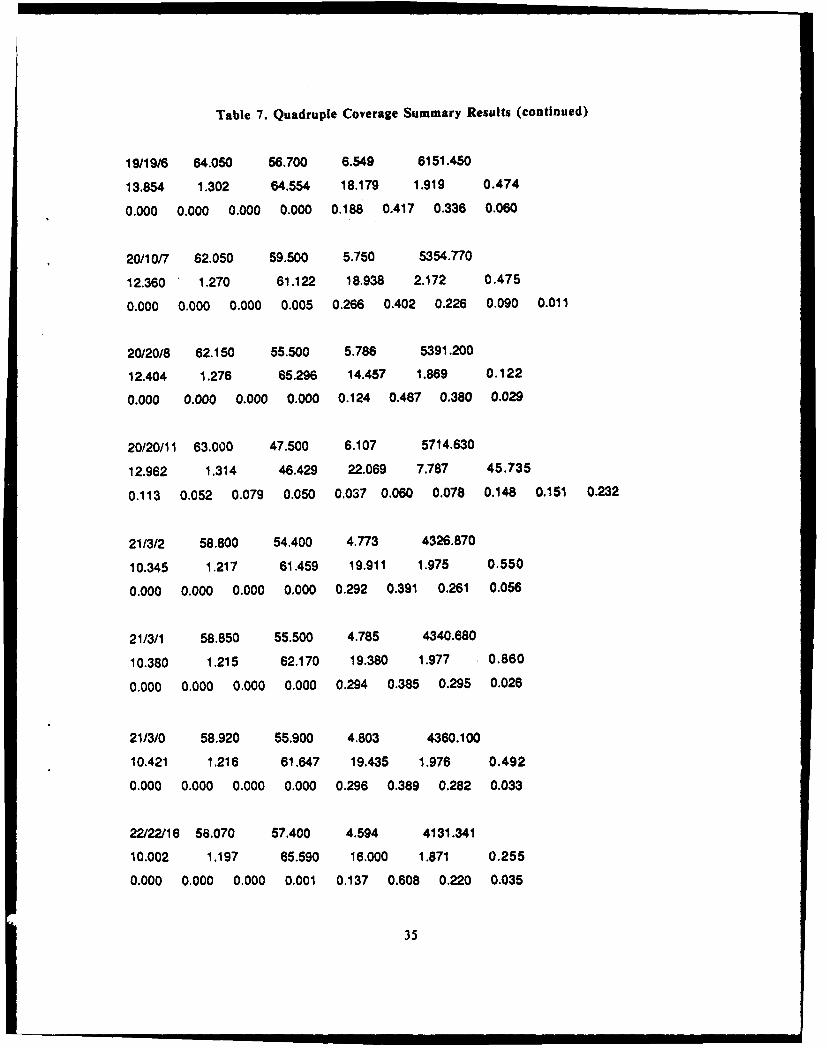
Table 7. Quadruple Coverage Summary Results (continued)
19/19/6 64.050 56.700 6.549 6151.450
13.854 1.302 64.554 18.179 1.919 0.474
0.000 0.000 0.000 0.000 0.188 0.417 0.336 0.060
20/10/7 62.050 59.500 5.750 5354.770
12.360 1.270 61.122 18.938 2.172 0.475
0.000 0.000 0.000 0.005 0.266 0.402 0.226 0.090 0.011
20/20/8 62.150 55.500 5.786 5391.200
12.404 1.276 65.296 14.457 1.869 0.122
0.000 0.000 0.000 0.000 0.124 0.467 0.380 0.029
20/20/11 63.000 47.500 6.107 5714.630
12.962 1.314 46.429 22.069 7.787 45.735
0.113 0.052 0.079 0.050 0.037 0.060 0.078 0.148 0.151 0.232
21/3/2 58.800 54.400 4.773 4326.870
10.345 1.217 61.459 19.911 1.975 0.550
0.000 0.000 0.000 0.000 0.292 0.391 0.261 0.056
21/3/1 58.850 55.500 4.785 4340.680
10.380 1.215 62.170 19.380 1.977 0.860
0.000 0.000 0.000 0.000 0.294 0.385 0.295 0.026
21/3/0 58.920 55.900 4.803 4360.100
10.421 1.216 61.647 19.435 1.976 0.492
0.000 0.000 0.000 0.000 0.296 0.389 0.282 0.033
22/22/16 58.070 57.400 4.594 4131.341
10.002 1.197 65.590 16.000 1.871 0.255
0.000 0.000 0.000 0,001 0.137 0.608 0.220 0.035
35

Table 7. Quadruple Coverage Summary Results (continued)
22/22/6 59.030 55.700 4.832 4390.850
10.477 1.219 55.856 20.268 2.445 1.095
0.000 0.000 0.000 0.000 0.193 0.377 0.367 0.051 0.011 0.001
22/22/9 59.980 61.000 5.090 4668.090
11.068 1.231 61.556 22.356 2.949 18.154
0.000 0.000 0.000 0.029 0.238 0.252 0.352 0.118 0.012
23/23/17 56.830 56.700 4.316 3823.450
9.382 1.180 60.904 22.966 2.594 5.823
0.000 0.000 0.000 0.018 0.274 0.370 0.247 0.075 0.015
23/2314 57.170 54.100 4.389 3905.010
9.522 1.187 65.287 19.681 1.864 0.240
0.000 0.000 0.000 0.001 0.126 0.508 0.299 0.065
23/23/16 58.660 60.020 4.737 4288.490
10.328 1.211 49.850 22.460 4.845 9.424
0.000 0.000 0.004 0.054 0.185 0.192 0.459 0.106
24/12/5 54.960 55.300 3.953 3409.490
8.569 1.145 65.073 19.490 1.974 2.472
0.000 0.000 0.001 0.013 0.203 0.472 0.263 0.048
24(3/2 55.060 54.400 3.971 3430.240
8.597 1.149 60.380 18.835 1.998 0.508
0.000 0.000 0.000 0.000 0.239 0.405 0.313 0.042 0.001
24/3/0 55.140 55.600 3.985 3446.950
8.641 1.149 59.542 19.367 2.065 0.568
0.000 0.000 0.000 0.000 0.264 0.403 0.267 0.064 0.002
36

Table 7. Quadruple Cov'erage Summary Results (continued)
24/6/4 55.170 54.600 3.991 3453.250
8.647 1.151 57.580 20.301 2.444 0.428
0.000 0.000 0.000 0.001 0.208 0.478 0.246 0.068 0.004
24/24/20 55.450 56.600 4.043 351 2.620
8.782 1.156 59.464 22.076 2.602 9.216
0.000 0.000 0.000 0.043 0.274 0.325 0.223 0.107 0.028
37

DISCUSSION
A sentinel system composed of a constellation of satellite platforms (Lightsats, perhaps) ispostulated and evaluated for its target location capability. The arguments are purely geometric withno consideration given to the complex command, control, and communication problems such a systemwould create. Basically, two questions were addressed in this study. The first question pertains to theproblem of continuous coverage and to the multiplicity of coverage. Satellite constellations that weredesigned to provide one-, two-, three-, and four-fold continuous ground coverage were analyzed inthis study. The second question addresses the accuracy with which ground target locations can beestimated from measurements collected from sensors located on the satellite platforms. The targetsensors are characterized by their measurement errors rather than by parametric specifications. Thesame is true of the location errors of the satellite platforms. Standard errors here were specified as1, 5, 10, or 15 meters in each of the three geocentric coordinates. One component of the sensorattitude system, namely the star camera, was specified. One reason for this is that the overall workeffort is in support of an ETL-initiated, USACE-approved NASA shuttle experiment intended tovalidate the concept of precision real time attitude keyed to a digital image stellar camera operatingin space. Standard errors in this case were specified as , 1, 2, or 3 seconds about each of the threemutually orthogonal platform reference axes.
A simple coverage evaluation was performed by allowing each of the constellations to operatefor 24 hours, where each of nine target points within five target regions was tested every 5 minutesto see if the programmed number of lines of sight occurred. Results are presented in tables 4, 5, 6,and 7 and are summarized below in table 8. Programmed coverage was achieved if: for singlecoverage P0 = 0; for double coverage Po = PI = 0; for triple coverage PO = P1
= P2 = 0; and forquadruple coverage Po = PI = P2 = Ps = 0. PO is the relative frequency of the target not being viewedby any of the satellites, P1 is the relative frequency of the target being viewed by exactly onesatellite, and so on.
Table 8. Fraction of Programmed Coverage
Percent of Full Coverage100% 99% 98% 95% 90%
Single 0.250 0.423 0.500 0.673 0.808Double 0.462 0.635 0.712 0.789 0.904Triple 0.295 0.773 0.864 0.955 0.977Quadruple 0.405 0.619 0.738 0.929 0.976
The column headings pertain to the percentages of times the tested constellations met coveragespecifications. For example, 40.5 percent of the 4-fold coverage constellations tested provided fullcoverage 100 percent of the time, whereas 92.9 percent of those tested provide full coverage 95percent of the time.
Of the 52 one-fold coverage constellations tested, 10 were such that all of the targets were notin view over 10 percent of the time. Three of the 10 were such that the targets were not in view over50 percent of the time. Of the 52 two-fold coverage constellations tested, 5 were such that theprogrammed coverage failed over 10 percent of the time. Of the 44 three-fold coverage constellationstested, only one was such that the programmed coverage failed over 10 percent of the time. The samewas true for the 42 four-fold coverage constellations tested.
A review of the data from which tables 4, 5, 6, and 7 were derived indicates that outages arefunctions of latitude. That is, if more than one target region recorded outages for a particularconstellation, then those regions were generally either at the lower or upper latitudes. Since theconstellations are symmetrically organized over the earth, it is highly likely that the outage regions
38

at a particular latitude would be regularly spaced in longitude. Test areas over the entire earth wouldhave to be evaluated to show this. However, such an effort is beyond the scope of this particularexperiment.
Four kinds of target location mensuration procedures were considered in this study. The first isa single station intersection of a target where the exterior orientation of the sensor is known, alongwith the slant range to a target identified at the principal point of a solid state imaging device. Thisis the only kind of target location mensuration that can be performed from a I-fold coverageconstellation in an exact manner. Single station intersection can be performed without knowing theslant range if the target height above the spheroid is known or estimated. The second method oftarget location mensuration is a two-station intersection scheme where the exterior orientation of bothstations is known along with the slant ranges to a target identified at the principal points of bothsolid state sensors. This method of target determination requires simultaneity of target observationfrom 2-fold coverage and larger constellations. The third method of target location mensuration issimilar to the second method, except that the slant range distances are not measured. The fourthmethod of target location mensuration is a three-station intersection scheme where the positions ofthe three stations are known along with the three individual slant ranges to the target. This methodof target mensuration requires simultaneity of target observation from 3-fold coverage and largerconstellations.
Some of the summary results given in tables 4, 5, 6, and 7 must be correlated with the tablesreferred to previously10 in order to produce target location error estimates. Errors associated with thefirst mensuration procedure can be obtained from table H-1 of that report. Errors in that report areexpressed as 99 percent spherical errors and are a function of reference system position errors,reference system attitude errors, target mensuration errors, and slant range errors. In addition, thetarget errors are characterized by the distance to the target from the satellites. Errors associated withthe second mensuration procedure can be obtained from tables H-2 through H-5. The target locationerrors are characterized exactly as before, but with an additional geometrical parameter, namely theangle between the two rays as measured at the target. Errors associated with the third mensurationprocedure can be obtained from tables H-14 and H-15. Note that the summary output in tables 4,5, 6, and 7 include the average distance to the target and associated standard deviation. Note, too,that the summary output in tables 5, 6, and 7 include the average angular separation of the two raysat the target and the associated standard deviation. Target location errors for the fourth mensurationtype can be estimated from the following formula:
SP (99%) = PEOP * 3.367 * SIGR3
wherePDOP Position Dilution of Precision
SIGR = Slant Range Measuring Error
The summary output in tables 6 and 7 include the average minimum PDOP and the associatedstandard deviation. The formula was evaluated for a range of SIGR and PDOP values and the resultsare presented below in table 9.
10 M.A. Crombie. Target Location Errors Derived From A Hypothetical Target Tracking System. U.S. Army Engineer
Topographic Laboratories, Fort Belvoir, Virginia, 22060-5546. Report ETL-0531, February 1989.
39

Table 9. Y99% Spherical Errors of Position
Slant Range Errors (meters)
PDOP 5 10 15 20 25
1.0 10 19 29 39 491.5 15 29 43 58 732.0 19 39 58 78 972.5 24 48 73 97 1213.0 29 58 88 117 1463.5 34 68 102 136 1704.0 39 78 117 156 1944.5 44 87 131 175 2195.0 49 97 146 194 2435.5 53 107 160 214 2676.0 58 117 175 233 2926.5 63 126 190 253 3167.0 68 136 204 272 3407.5 73 146 219 292 3648.0 78 156 233 311 3898.5 83 165 248 330 4139.0 87 175 262 350 4379.5 92 185 277 369 462
10.0 97 194 292 389 486
The results of this study are intended to be used together with the results described in the earlierreport" to evaluate the several constellations for their worth in surveillance and target locationestimation. In all, 190 constellations were tested and 67 satisfied the programmed coveragespecifications 100 percent of the time. The two sets of results can be combined in many ways toevaluate a variety of questions. For example, note from tables 4 and 5 that the constellationsdesignated as 12/2/1 and 12/3/1 satisfy the programmed coverage requirements for I-fold and 2-foldcoverage. Suppose the vehicle position standard error is 10 meters for each coordinate, the attitudestandard error is 2 arc seconds about each reference axis, and the target measuring error is 5 arcseconds. Suppose further that if a slant range measuring capability exists, then its standard error is10 meters. The appropriate average distances and average observation angles are taken from tables4 and 5 of this work and used as interpolation parameters in the previous work 12 to produce table 10of 99 percent confidence spheres about estimated target locations.
M.A. Crombie. Target Location Errors Derived From A Hypothetical Target Tracking System. U.S. Army EngineerTopographic Laboratories, Fort Belvoir, Virginia, 22060-5546. Report ETL-031, February 1989.
12 Ibid.
40

Table 10. Numerical Example
1-Fold
12/2/1 12/3/1
h 2597.96 nautical miles 2243.74 nautical milesi 46.50 degrees 50.73 degreesError 512 meters 462 meters
2-Fold
12/2/1 12/3/1
h 6262.16 nautical miles 3769.44 nautical milesi 45.00 degrees 57.00 degreesError (with Slant Range) 503 meters 337 metersError (without Slant Range) 1349 meters 986 meters
The results in table 10 and others like them can be used as one argument in a comparative analysisof competing target tracking systems. Considerations such as Cs sensor costs, vehicle costs, and launchcosts are beyond the scope of this work.
41
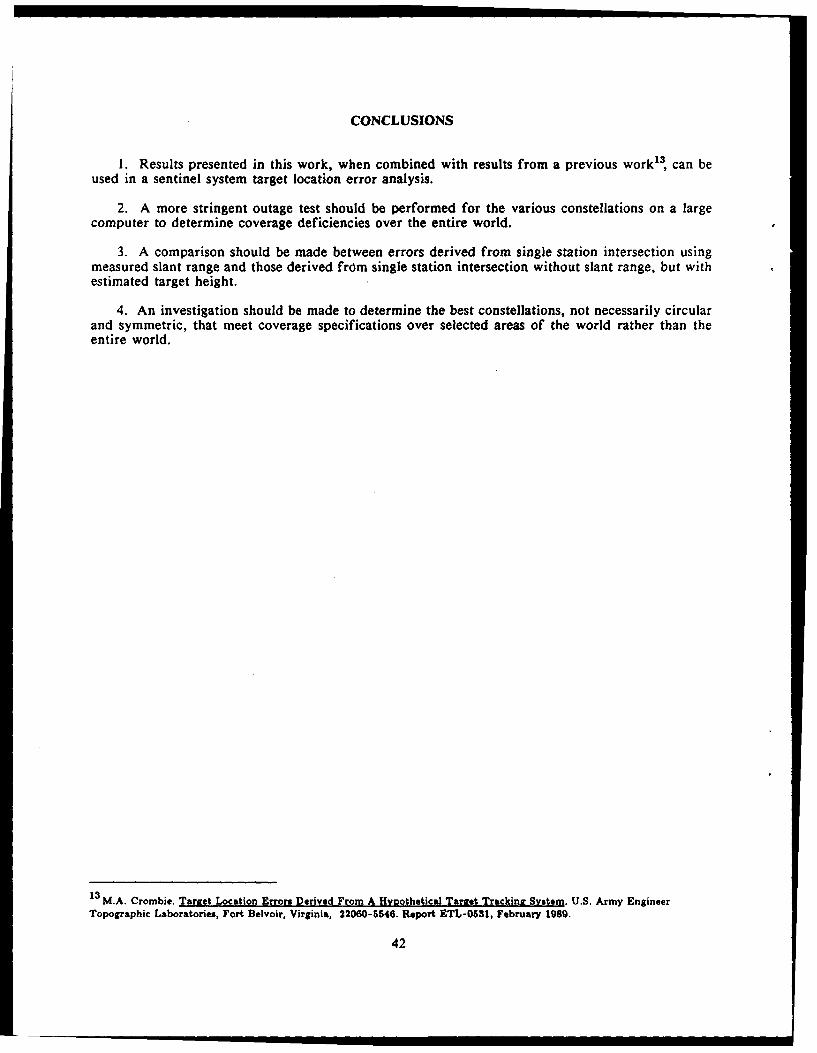
CONCLUSIONS
1. Results presented in this work, when combined with results from a previous work 3, can beused in a sentinel system target location error analysis.
2. A more stringent outage test should be performed for the various constellations on a largecomputer to determine coverage deficiencies over the entire world.
3. A comparison should be made between errors derived from single station intersection usingmeasured slant range and those derived from single station intersection without slant range, but withestimated target height.
4. An investigation should be made to determine the best constellations, not necessarily circularand symmetric, that meet coverage specifications over selected areas of the world rather than theentire world.
1 3 M.A. Crombie. Target Location Errors Derived From A Hypothetical Tarzet Tracking System. U.S. Army Engineer
Topographic Laboratories, Fort Belvoir, Virginia, 22060-5546. Report ETL-0531, February 1989.
42