optimizing bead size reduces errors in force measurements ... · optimizing bead size reduces...
TRANSCRIPT
Optimizing bead size reduces errors in force measurements in optical traps
Rebecca K. Montange,1 Matthew S. Bull,1,2 Elisabeth R. Shanblatt,1,2 Thomas T. Perkins1,3,*
1JILA, National Institute of Standards and Technology and University of Colorado, Boulder, Colorado 80309, USA 2Department of Physics, University of Colorado, Boulder, Colorado 80309, USA
3Department of Molecular, Cellular, and Developmental Biology, University of Colorado, Boulder, Colorado 80309, USA
Abstract: Optical traps are used to measure force (F) over a wide range (0.01 to 1,000 pN). Variations in bead radius (r) hinder force precision since trap stiffness (ktrap) varies as r3 when r is small. Prior work has shown ktrap is maximized when r is approximately equal to the beam waist (w0), which on our instrument was ~400 nm when trapping with a 1064-nm laser. In this work, we show that by choosing r ≈w0, we improved the force precision by 2.8-fold as compared to a smaller bead (250 nm). This improvement in force precision was verified by pulling on a canonical DNA hairpin. Thus, by using an optimum bead size, one can simultaneously maximize ktrap while minimizing errors in F.
©2013 Optical Society of America
OCIS codes: (140.7010) Laser trapping; (350.4855) Optical tweezers or optical manipulation; (170.0170) Medical optics and biotechnology.
References and links
1. W. J. Greenleaf, M. T. Woodside, and S. M. Block, “High-resolution, single-molecule measurements of biomolecular motion,” Annu. Rev. Biophys. Biomol. Struct. 36(1), 171–190 (2007).
2. J. R. Moffitt, Y. R. Chemla, S. B. Smith, and C. Bustamante, “Recent Advances in Optical Tweezers,” Annu. Rev. Biochem. 77(1), 205–228 (2008).
3. T. T. Perkins, “Optical traps for single molecule biophysics: a primer,” Laser Photon. Rev. 3(1-2), 203–220 (2009).
4. D. G. Grier, “A revolution in optical manipulation,” Nature 424(6950), 810–816 (2003). 5. J. Liphardt, B. Onoa, S. B. Smith, I. J. Tinoco, Jr., and C. Bustamante, “Reversible unfolding of single RNA
molecules by mechanical force,” Science 292(5517), 733–737 (2001). 6. J. Liphardt, S. Dumont, S. B. Smith, I. Tinoco, Jr., and C. Bustamante, “Equilibrium information from
nonequilibrium measurements in an experimental test of Jarzynski’s equality,” Science 296(5574), 1832–1835 (2002).
7. C. Cecconi, E. A. Shank, C. Bustamante, and S. Marqusee, “Direct observation of the three-state folding of a single protein molecule,” Science 309(5743), 2057–2060 (2005).
8. M. T. Woodside, P. C. Anthony, W. M. Behnke-Parks, K. Larizadeh, D. Herschlag, and S. M. Block, “Direct measurement of the full, sequence-dependent folding landscape of a nucleic acid,” Science 314(5801), 1001–1004 (2006).
9. M. T. Woodside, W. M. Behnke-Parks, K. Larizadeh, K. Travers, D. Herschlag, and S. M. Block, “Nanomechanical measurements of the sequence-dependent folding landscapes of single nucleic acid hairpins,” Proc. Natl. Acad. Sci. U.S.A. 103(16), 6190–6195 (2006).
10. J. Stigler, F. Ziegler, A. Gieseke, J. C. Gebhardt, and M. Rief, “The complex folding network of single calmodulin molecules,” Science 334(6055), 512–516 (2011).
11. H. Yu, X. Liu, K. Neupane, A. N. Gupta, A. M. Brigley, A. Solanki, I. Sosova, and M. T. Woodside, “Direct observation of multiple misfolding pathways in a single prion protein molecule,” Proc. Natl. Acad. Sci. U.S.A. 109(14), 5283–5288 (2012).
12. G. I. Bell, “Models for the Specific Adhesion of Cells to Cells,” Science 200(4342), 618–627 (1978). 13. M. T. Woodside and M. T. Valentine, “Single Molecule Manipulation Using Optical Traps,” in Handbook of
Single Molecule Biophysics, P. Hinterdorfer, and A. Van Oijen, eds. (Springer, 2009), pp. 341–367. 14. S. F. Tolić-No ̸rrelykke, E. Schäffer, J. Howard, F. S. Pavone, F. Jülicher, and H. Flyvbjerg, “Calibration of
optical tweezers with positional detection in the back focal plane,” Rev. Sci. Instrum. 77(10), 103101 (2006).
#176448 - $15.00 USD Received 18 Sep 2012; revised 12 Dec 2012; accepted 13 Dec 2012; published 2 Jan 2013(C) 2013 OSA 14 January 2013 / Vol. 21, No. 1 / OPTICS EXPRESS 39
15. K. Svoboda and S. M. Block, “Biological Applications of Optical Forces,” Annu. Rev. Biophys. Biomol. Struct. 23(1), 247–285 (1994).
16. K. Svoboda, C. F. Schmidt, B. J. Schnapp, and S. M. Block, “Direct observation of kinesin stepping by optical trapping interferometry,” Nature 365(6448), 721–727 (1993).
17. K. C. Neuman and S. M. Block, “Optical trapping,” Rev. Sci. Instrum. 75(9), 2787–2809 (2004). 18. A. Pralle, M. Prummer, E.-L. Florin, E. H. K. Stelzer, and J. K. H. Hörber, “Three-dimensional high-resolution
particle tracking for optical tweezers by forward scattered light,” Microsc. Res. Tech. 44(5), 378–386 (1999). 19. L. Nugent-Glandorf and T. T. Perkins, “Measuring 0.1-nm motion in 1 ms in an optical microscope with
differential back-focal-plane detection,” Opt. Lett. 29(22), 2611–2613 (2004). 20. K. Visscher, S. P. Gross, and S. M. Block, “Construction of multiple-beam optical traps with nanometer-
resolution position sensing,” IEEE J. Sel. Top. Quantum Electron. 2(4), 1066–1076 (1996). 21. K. C. Vermeulen, J. van Mameren, G. J. M. Stienen, E. J. G. Peterman, G. J. L. Wuite, and C. F. Schmidt,
“Calibrating bead displacements in optical tweezers using acousto-optic deflectors,” Rev. Sci. Instrum. 77(1), 013704 (2006).
22. L. P. Ghislain, N. A. Switz, and W. W. Webb, “Measurement of Small Forces Using an Optical Trap,” Rev. Sci. Instrum. 65(9), 2762–2768 (1994).
23. S. B. Smith, Y. Cui, and C. Bustamante, “Optical-trap force transducer that operates by direct measurement of light momentum,” Methods Enzymol. 361, 134–162 (2003).
24. A. Farré, F. Marsà, and M. Montes-Usategui, “Optimized back-focal-plane interferometry directly measures forces of optically trapped particles,” Opt. Express 20(11), 12270–12291 (2012).
25. R. M. Simmons, J. T. Finer, S. Chu, and J. A. Spudich, “Quantitative Measurements of Force and Displacement Using an Optical Trap,” Biophys. J. 70(4), 1813–1822 (1996).
26. A. Rohrbach, “Stiffness of optical traps: quantitative agreement between experiment and electromagnetic theory,” Phys. Rev. Lett. 95(16), 168102 (2005).
27. V. Bormuth, A. Jannasch, M. Ander, C. M. van Kats, A. van Blaaderen, J. Howard, and E. Schäffer, “Optical trapping of coated microspheres,” Opt. Express 16(18), 13831–13844 (2008).
28. M. D. Wang, H. Yin, R. Landick, J. Gelles, and S. M. Block, “Stretching DNA with optical tweezers,” Biophys. J. 72(3), 1335–1346 (1997).
29. D. H. Paik and T. T. Perkins, “Overstretching DNA at 65 pN Does Not Require Peeling from Free Ends or Nicks,” J. Am. Chem. Soc. 133(10), 3219–3221 (2011).
30. A. R. Carter, Y. Seol, and T. T. Perkins, “Precision Surface-Coupled Optical-Trapping Assay with One-Basepair Resolution,” Biophys. J. 96(7), 2926–2934 (2009).
31. A. R. Carter, G. M. King, T. A. Ulrich, W. Halsey, D. Alchenberger, and T. T. Perkins, “Stabilization of an optical microscope to 0.1 nm in three dimensions,” Appl. Opt. 46(3), 421–427 (2007).
32. F. Gittes and C. F. Schmidt, “Interference model for back-focal-plane displacement detection in optical tweezers,” Opt. Lett. 23(1), 7–9 (1998).
33. C. E. Aitken, R. A. Marshall, and J. D. Puglisi, “An oxygen scavenging system for improvement of dye stability in single-molecule fluorescence experiments,” Biophys. J. 94(5), 1826–1835 (2008).
34. M. P. Landry, P. M. McCall, Z. Qi, and Y. R. Chemla, “Characterization of photoactivated singlet oxygen damage in single-molecule optical trap experiments,” Biophys. J. 97(8), 2128–2136 (2009).
35. M. J. Schnitzer, K. Visscher, and S. M. Block, “Single kinesin molecules studied with a molecular force clamp,” Nature 400(6740), 184–189 (1999).
36. T. T. Perkins, R. V. Dalal, P. G. Mitsis, and S. M. Block, “Sequence-dependent pausing of single lambda exonuclease molecules,” Science 301(5641), 1914–1918 (2003).
37. Y. Seol, J. Li, P. C. Nelson, T. T. Perkins, and M. D. Betterton, “Elasticity of Short DNA Molecules: Theory and Experiment for Contour Lengths of 0.6-7 microm,” Biophys. J. 93(12), 4360–4373 (2007).
38. A. Buosciolo, G. Pesce, and A. Sasso, “New calibration method for position detector for simultaneous measurements of force constants and local viscosity in optical tweezers,” Opt. Commun. 230(4-6), 357–368 (2004).
39. A. Le Gall, K. Perronet, D. Dulin, A. Villing, P. Bouyer, K. Visscher, and N. Westbrook, “Simultaneous calibration of optical tweezers spring constant and position detector response,” Opt. Express 18(25), 26469–26474 (2010).
40. A. Farré and M. Montes-Usategui, “A force detection technique for single-beam optical traps based on direct measurement of light momentum changes,” Opt. Express 18(11), 11955–11968 (2010).
41. J. P. Rickgauer, D. N. Fuller, and D. E. Smith, “DNA as a metrology standard for length and force measurements with optical tweezers,” Biophys. J. 91(11), 4253–4257 (2006).
1. Introduction
Optical traps are widely used to apply forces and measure motions in biophysical [1–3] and soft condensed-matter [4] systems. In the last decade, optical traps have been used to study the folding and unfolding of biological molecules [5–11]. The rates for these processes depend exponentially on the applied force (F) [12]. This sensitivity is particularly pronounced when studying equilibrium fluctuations of biomolecules opening and closing under constant
#176448 - $15.00 USD Received 18 Sep 2012; revised 12 Dec 2012; accepted 13 Dec 2012; published 2 Jan 2013(C) 2013 OSA 14 January 2013 / Vol. 21, No. 1 / OPTICS EXPRESS 40
force [5]. The success of these and similar equilibrium studies have relied, in part, on increases in the stability of optical traps. For these equilibrium experiments, even a 1% change in F can alter the probability of a molecule being folded by ~30% around its F1/2, the force at which it is equally probable to be folded and unfolded [5]. While such fine force control is readily achievable in current advanced instruments for an individual bead, force precision between different beads is significantly worse. Ten percent differences in force between nominally identical beads can occur [13, 14]. This large variation hampers the field by requiring more molecules to be studied to average out unaccounted for differences in force. Further, this variation hinders the quantitative comparison between experiment and theory. Our paper focuses on improving the precision with which force can be applied across a biomolecule while using nominally identical individual beads.
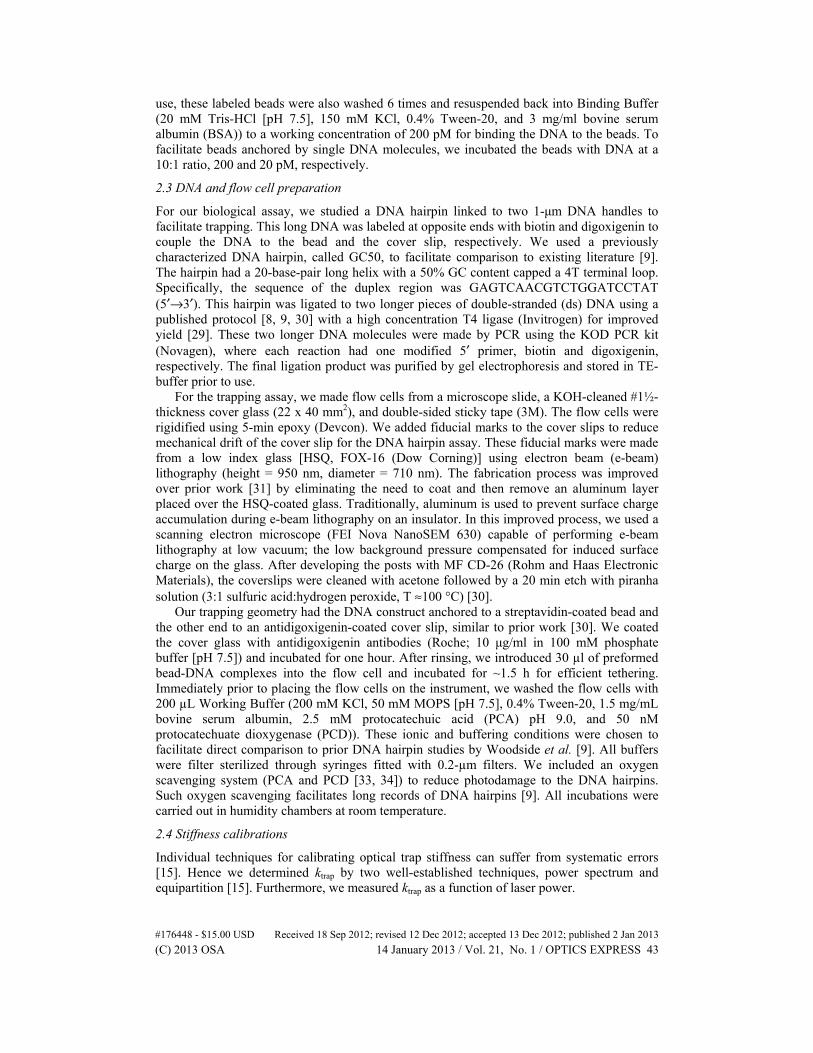
Force is typically determined by application of Hooke’s law [15]: F = -ktrapxbd, where ktrap is the trap stiffness, and xbd is the position of the trapped bead. The primary measurement is xbd. On advanced instruments, xbd can be measured at high bandwidth (>10 kHz) and with atomic-scale (0.1 nm) sensitivity [16–19]. This precision, coupled with the development of in situ sensitivity (volts per nm) calibration of individual beads, means the primary limit in force precision arises from inaccuracies in ktrap between individual beads [20, 21]. We note that for alternative trapping geometries, where F is directly measured [22–24], a precise measure of ktrap is needed to infer xbd. In both cases, difficulties in determining ktrap arise, in part, because ktrap depends nonlinearly on the bead’s radius (r) (Fig. 1) [25–27].
Small beads are attractive for high-precision measurements because they have faster response times due to reduced hydrodynamic drag and, therefore, improved force precision and time resolution within a given bandwidth. Yet, for small beads, ktrap varies as r3 when r << λtrap, the trapping laser wavelength (1064 nm). Most commercially available beads have root-mean-square (rms) variations in r of 3–6%, referred to as coefficient of variation (CV) by bead manufacturers. For a typical bead with a 4% variation, this r3-dependence leads to a 12% rms variation in ktrap between individual beads.
Fig. 1. Cartoon curve (magenta) illustrating the relationship between bead radius (r) and lateral trap stiffness (ktrap) previously described for a 1064-nm laser in water [25–27]. Blue-shaded regions represent the variation in r (δr), while green-shaded regions represent the resulting variation in ktrap (δk).
Unfortunately, practical issues often prevent the precise calibration of ktrap for each individual bead. For instance, in most DNA-based trapping assays, bead-DNA complexes are preformed and attached to the surface or another bead via a DNA molecule prior to pulling on them [3]. This extra linkage hinders precise calibration of ktrap. One approach to this problem is to rupture the slide-DNA-bead linkage and perform a stiffness calibration on the liberated bead [28]. This approach assumes that any DNA molecules remaining on the bead do not interfering with subsequent stiffness calibration. Moreover, such rupturing often requires a
#176448 - $15.00 USD Received 18 Sep 2012; revised 12 Dec 2012; accepted 13 Dec 2012; published 2 Jan 2013(C) 2013 OSA 14 January 2013 / Vol. 21, No. 1 / OPTICS EXPRESS 41

high force (> 40 pN) for a single streptavidin-biotin bond and is not practical when the DNA is attached to the bead and the coverslip by multiple bonds [29]. As a result, many groups, including ours, use one calibration of ktrap for all individual beads of a given size. This pre-calibration of ktrap is usually extensive and typically entails measuring ktrap as a function of laser power using multiple techniques including power spectrum, equipartition theorem, and hydrodynamic drag [15]. Nonetheless, using one average calibration curve leads to the aforementioned systematic error in ktrap due to inherent variations in r.
In this Letter, we focused on finding a bead size that minimized systematic errors in ktrap between individual beads. Prior work has shown a transition from ktrap ~r3 when r << λtrap to a maximum in ktrap when r ≈w0, the beam waist. As r is further increased, ktrap decreases from this maximum value [27]. The critical insight for this work is that ktrap is insensitive to small variations in r (δr) near this peak (Fig. 1). To test this concept, we measured ktrap as a function of r, reproducing the results of Bormuth et. al [27]. In our trap, ktrap peaked for beads with a radius of ~390 nm. At this bead size, the errors in ktrap decreased by 2.8-fold even though δr was approximately twice as great as that of the smallest size we tested. We verified this result by determining the F1/2 for a DNA hairpin [5, 8, 9], a biophysical assay sensitive to tiny (<1%) changes in F. This assay showed a twofold reduction in force error when using the optimally sized beads as compared to the smallest bead size tested.
2. Methods and materials
2.1 Experimental apparatus
We used a single-beam optical trap to probe the folding and unfolding of DNA hairpins using a surface-coupled assay [28]. To improve stability and precision, we actively stabilized the optical trap (1064 nm) and its detection laser (810 nm) using an acousto-optic modulator and other associated optics, as previously described [30, 31]. This allowed for electronic intensity control by changing the reference voltage, called AOM voltage, in the intensity stabilization feedback circuit. We added a second stabilized detection laser (850 nm) to eliminate drift of the coverslip [31]. To do so, we scattered the laser off a fiducial mark fabricated using a low-index glass [31] and measured the resulting signal using back-focal-plane (BFP) detection [18, 20, 32]. We then used a simple feedback loop to reposition the sample via a three axis piezoelectric stage. This held the stage still relative to the laser beam. On this instrument, we typically achieved stabilities of 0.3 nm in 3D (rms, Δf = 0.1–10 Hz).
2.2 Bead preparation
For consistency, we used one type of bead from one manufacturer [carboxylate modified latex (CML, Invitrogen)]. Beads are sold with a manufacturer-specified CV that was used to calculate the standard deviation of the radius (σr). We chose these beads based on availability. The specific bead radii used were 250 nm (CV = 2.2%; σr = 5.5 nm), 300 nm (CV = 4.8%; σr = 11.4 nm), 385 nm (CV = 2.0%; σr = 7.7 nm), 390 nm (CV = 2.7%; σr = 10.7 nm), 415 nm (CV = 2.8%; σr = 11.6 nm), and 445 nm (CV = 2.2%; σr = 9.8 nm). Since CV values vary from batch to batch, all measurements of a particular bead size were taken from single batch and it is that batch’s CV that is reported. To calibrate the trap, the beads were diluted from their stock solution to 5 pM in Phos-Tween buffer (0.1 M Na-Phosphate [pH 7.5] and 0.4% Tween-20). The beads were washed by spinning them in a microcentrifuge and resuspending the resulting pellet in ultrapure water to 5 pM. Next, the beads were sonicated for 15 min to reduce clumping. These sonicated beads were further diluted to a working concentration of 0.5 pM.
We wanted to verify improvements in the precision of ktrap using a biological assay. To do so, we labeled two bead sizes [250 nm (CV = 2.2%%; σr = 5.5 nm), and 390 nm (CV = 2.7%; σr = 10.7 nm)] with streptavidin to couple them to biotin-labeled DNA. Specifically, streptavidin (Vector labs) was coupled to the beads using EDC/Sulpho-NHS (Pierce). Before
#176448 - $15.00 USD Received 18 Sep 2012; revised 12 Dec 2012; accepted 13 Dec 2012; published 2 Jan 2013(C) 2013 OSA 14 January 2013 / Vol. 21, No. 1 / OPTICS EXPRESS 42
use, these labeled beads were also washed 6 times and resuspended back into Binding Buffer (20 mM Tris-HCl [pH 7.5], 150 mM KCl, 0.4% Tween-20, and 3 mg/ml bovine serum albumin (BSA)) to a working concentration of 200 pM for binding the DNA to the beads. To facilitate beads anchored by single DNA molecules, we incubated the beads with DNA at a 10:1 ratio, 200 and 20 pM, respectively.
2.3 DNA and flow cell preparation
For our biological assay, we studied a DNA hairpin linked to two 1-μm DNA handles to facilitate trapping. This long DNA was labeled at opposite ends with biotin and digoxigenin to couple the DNA to the bead and the cover slip, respectively. We used a previously characterized DNA hairpin, called GC50, to facilitate comparison to existing literature [9]. The hairpin had a 20-base-pair long helix with a 50% GC content capped a 4T terminal loop. Specifically, the sequence of the duplex region was GAGTCAACGTCTGGATCCTAT (5′→3′). This hairpin was ligated to two longer pieces of double-stranded (ds) DNA using a published protocol [8, 9, 30] with a high concentration T4 ligase (Invitrogen) for improved yield [29]. These two longer DNA molecules were made by PCR using the KOD PCR kit (Novagen), where each reaction had one modified 5′ primer, biotin and digoxigenin, respectively. The final ligation product was purified by gel electrophoresis and stored in TE-buffer prior to use.
For the trapping assay, we made flow cells from a microscope slide, a KOH-cleaned #1½-thickness cover glass (22 x 40 mm2), and double-sided sticky tape (3M). The flow cells were rigidified using 5-min epoxy (Devcon). We added fiducial marks to the cover slips to reduce mechanical drift of the cover slip for the DNA hairpin assay. These fiducial marks were made from a low index glass [HSQ, FOX-16 (Dow Corning)] using electron beam (e-beam) lithography (height = 950 nm, diameter = 710 nm). The fabrication process was improved over prior work [31] by eliminating the need to coat and then remove an aluminum layer placed over the HSQ-coated glass. Traditionally, aluminum is used to prevent surface charge accumulation during e-beam lithography on an insulator. In this improved process, we used a scanning electron microscope (FEI Nova NanoSEM 630) capable of performing e-beam lithography at low vacuum; the low background pressure compensated for induced surface charge on the glass. After developing the posts with MF CD-26 (Rohm and Haas Electronic Materials), the coverslips were cleaned with acetone followed by a 20 min etch with piranha solution (3:1 sulfuric acid:hydrogen peroxide, T ≈100 °C) [30].
Our trapping geometry had the DNA construct anchored to a streptavidin-coated bead and the other end to an antidigoxigenin-coated cover slip, similar to prior work [30]. We coated the cover glass with antidigoxigenin antibodies (Roche; 10 μg/ml in 100 mM phosphate buffer [pH 7.5]) and incubated for one hour. After rinsing, we introduced 30 µl of preformed bead-DNA complexes into the flow cell and incubated for ~1.5 h for efficient tethering. Immediately prior to placing the flow cells on the instrument, we washed the flow cells with 200 µL Working Buffer (200 mM KCl, 50 mM MOPS [pH 7.5], 0.4% Tween-20, 1.5 mg/mL bovine serum albumin, 2.5 mM protocatechuic acid (PCA) pH 9.0, and 50 nM protocatechuate dioxygenase (PCD)). These ionic and buffering conditions were chosen to facilitate direct comparison to prior DNA hairpin studies by Woodside et al. [9]. All buffers were filter sterilized through syringes fitted with 0.2-µm filters. We included an oxygen scavenging system (PCA and PCD [33, 34]) to reduce photodamage to the DNA hairpins. Such oxygen scavenging facilitates long records of DNA hairpins [9]. All incubations were carried out in humidity chambers at room temperature.
2.4 Stiffness calibrations
Individual techniques for calibrating optical trap stiffness can suffer from systematic errors [15]. Hence we determined ktrap by two well-established techniques, power spectrum and equipartition [15]. Furthermore, we measured ktrap as a function of laser power.
#176448 - $15.00 USD Received 18 Sep 2012; revised 12 Dec 2012; accepted 13 Dec 2012; published 2 Jan 2013(C) 2013 OSA 14 January 2013 / Vol. 21, No. 1 / OPTICS EXPRESS 43
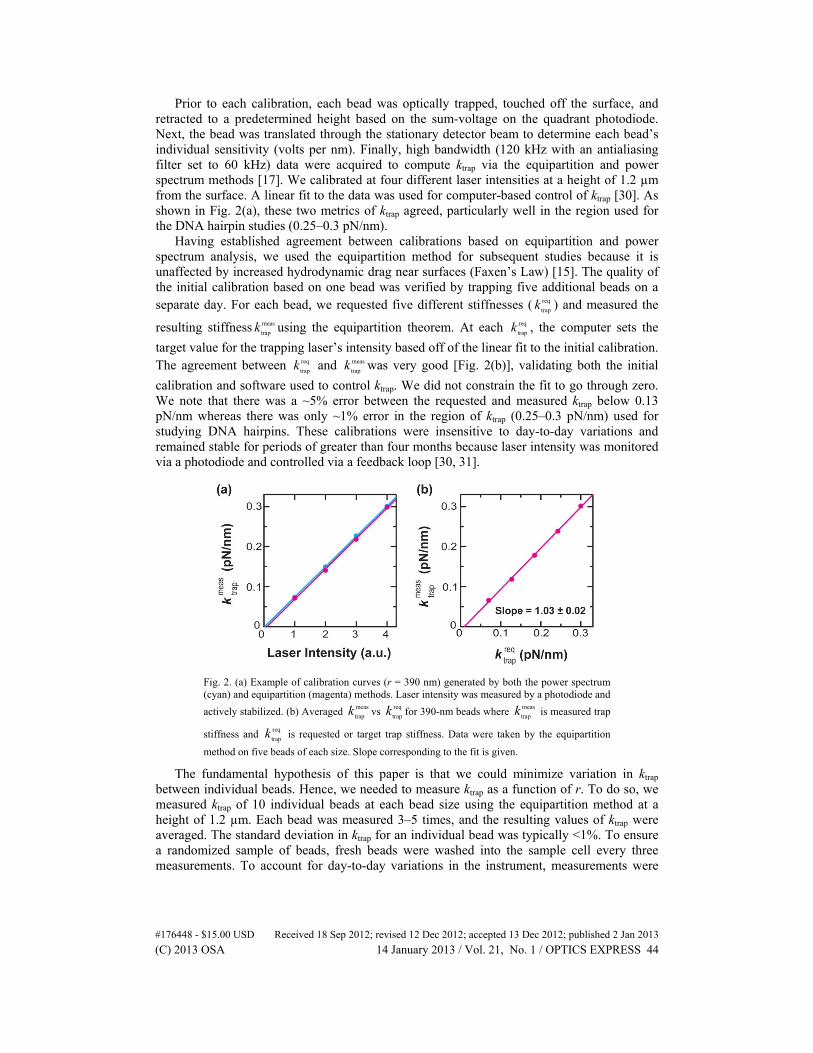
Prior to each calibration, each bead was optically trapped, touched off the surface, and retracted to a predetermined height based on the sum-voltage on the quadrant photodiode. Next, the bead was translated through the stationary detector beam to determine each bead’s individual sensitivity (volts per nm). Finally, high bandwidth (120 kHz with an antialiasing filter set to 60 kHz) data were acquired to compute ktrap via the equipartition and power spectrum methods [17]. We calibrated at four different laser intensities at a height of 1.2 µm from the surface. A linear fit to the data was used for computer-based control of ktrap [30]. As shown in Fig. 2(a), these two metrics of ktrap agreed, particularly well in the region used for the DNA hairpin studies (0.25–0.3 pN/nm).
Having established agreement between calibrations based on equipartition and power spectrum analysis, we used the equipartition method for subsequent studies because it is unaffected by increased hydrodynamic drag near surfaces (Faxen’s Law) [15]. The quality of the initial calibration based on one bead was verified by trapping five additional beads on a separate day. For each bead, we requested five different stiffnesses ( req
trapk ) and measured the
resulting stiffness meas
trapk using the equipartition theorem. At each req
trapk , the computer sets the
target value for the trapping laser’s intensity based off of the linear fit to the initial calibration. The agreement between req
trapk and meas
trapk was very good [Fig. 2(b)], validating both the initial
calibration and software used to control ktrap. We did not constrain the fit to go through zero. We note that there was a ~5% error between the requested and measured ktrap below 0.13 pN/nm whereas there was only ~1% error in the region of ktrap (0.25–0.3 pN/nm) used for studying DNA hairpins. These calibrations were insensitive to day-to-day variations and remained stable for periods of greater than four months because laser intensity was monitored via a photodiode and controlled via a feedback loop [30, 31].
Fig. 2. (a) Example of calibration curves (r = 390 nm) generated by both the power spectrum (cyan) and equipartition (magenta) methods. Laser intensity was measured by a photodiode and
actively stabilized. (b) Averaged meas
trapk vs req
trapk for 390-nm beads where meas
trapk is measured trap
stiffness and req
trapk is requested or target trap stiffness. Data were taken by the equipartition
method on five beads of each size. Slope corresponding to the fit is given.
The fundamental hypothesis of this paper is that we could minimize variation in ktrap between individual beads. Hence, we needed to measure ktrap as a function of r. To do so, we measured ktrap of 10 individual beads at each bead size using the equipartition method at a height of 1.2 µm. Each bead was measured 3–5 times, and the resulting values of ktrap were averaged. The standard deviation in ktrap for an individual bead was typically <1%. To ensure a randomized sample of beads, fresh beads were washed into the sample cell every three measurements. To account for day-to-day variations in the instrument, measurements were
#176448 - $15.00 USD Received 18 Sep 2012; revised 12 Dec 2012; accepted 13 Dec 2012; published 2 Jan 2013(C) 2013 OSA 14 January 2013 / Vol. 21, No. 1 / OPTICS EXPRESS 44
taken over a two-day period, with five beads of each size being measured on each day. A total of six bead sizes were investigated (r = 250–445 nm).
2.5 Determining F1/2 of DNA hairpins
We wanted to verify improvement in ktrap between individual beads with a biophysical assay. DNA hairpins are sensitive to tiny (<1%) changes in F, significantly more sensitive than our expected variation in ktrap. Hence, by determining the variation in F1/2 for a canonical DNA hairpin [5, 8, 9], we probed for variations in ktrap. In the context of this sensitive biological assay, we found a twofold reduction in force error when using optimally sized beads. We note that the force along the stretching axis was deduced from xbd in combination with the ratio of horizontal to vertical trap stiffness and the tether geometry [28]. Variations in precision of vertical trap stiffness with bead size were not investigated and neglected, since computations of F along the stretching axis are linear lateral trap stiffness but only have a quadratic correction term in vertical trap stiffness.
We determined F1/2 using an active force clamp [5, 25, 35] with the bead 400 nm above the surface. Before each experiment, we found the lateral tether point for each bead-DNA complex by performing a 2D elasticity-centering procedure [36]. This procedure also measures the persistence length (p) of the bead-DNA complexes, allowing beads anchored by multiple DNA to be excluded due to their low persistence length (p <40 nm). We also required the DNA to have the proper contour length (2025 ± 25 nm). This verified that DNA was anchored to the bead and cover slip as expected. Finally, we verified the integrity of each hairpin by requiring the change in contour length (ΔL) upon opening to be near its nominal value of ~18 nm [9]. While rare (~5%), some hairpins showed a significantly smaller ΔL (≈8–12 nm). We attribute these events to laser-induced oxidative damage of the hairpin, since they were more common when an oxygen-scavenging system was not used.
To facilitate rapid determination of F1/2, we initially increased F from 11 pN to 18 pN at 1 pN/s and then reversed the process. The force at which the DNA hairpin unfolded and folded was used as the initial estimate of F1/2 for the active force clamp. The force-clamp update rate was 500 Hz. We then adjusted the force in 0.1-pN intervals. Each force was monitored for a minimum of ~25 seconds. A histogram computed in real time allowed a rough estimation of when the hairpin was open approximately 50 ± 5% of the time. To refine this nominal value, we measured the hairpin dynamics at 0.1 pN above and below this force. The resulting three histograms were analyzed using an equation that estimates the probability of a two state system under an external force to be open [5]. The difference between these two determinations in F1/2 was 0.03 pN (N = 22, rms), significantly smaller than between different individual molecules. Traces that showed signs of photodamage (e.g., an abrupt change in the opening and closing probabilities) were excluded from the analysis.
3. Results
Optical traps are widely used in single molecule biophysics [1–3]. Yet, systematic errors in ktrap limit the precision and accuracy of force measurements, particularly between nominally identical individual beads. Here, we show that by choosing r to maximize ktrap, one can also reduce errors in ktrap by 2.8-fold (§3.1). We verified this improvement using a biophysical assay based on the equilibrium folding and unfolding of a DNA hairpin under force (§3.2).
3.1. Optimizing bead radius to minimize uncertainty in ktrap
Conceptually, variations in ktrap due to variations in r should be minimized at the maximum in ktrap as a function of r. As shown in Fig. 3, our data supports this conjecture. Specifically, ktrap reached a maximum when r was approximately equal to the trap waist w0, similar to prior results [27]. We also determined the variation in ktrap between individual beads by measuring 10 beads for each r and report the uncertainty in ktrap by calculating the standard error from these 10 measurements. As shown in Fig. 3(b), there was a broad minimum in the uncertainty
#176448 - $15.00 USD Received 18 Sep 2012; revised 12 Dec 2012; accepted 13 Dec 2012; published 2 Jan 2013(C) 2013 OSA 14 January 2013 / Vol. 21, No. 1 / OPTICS EXPRESS 45

around this maximum in ktrap. Interestingly, while the 300-nm beads had an absolute variation in r of almost twice that of the 250-nm beads, the uncertainty in ktrap for the larger beads was just 40% of that for the smaller beads. The minimum in uncertainty occurred at r = 390 nm, and was 2.8-fold less than the uncertainty at r = 250 nm. Thus, this rather simple measurement demonstrates the central point of this Letter: optimizing bead size can significantly reduce uncertainties in ktrap between individual beads. Fortunately, this optimization is not narrowly localized to a single r but extends over a broad region in r around the maximum in ktrap.
Fig. 3. (a) Lateral stiffness (ktrap) plotted against bead radius (r). The stiffnesses of 10 beads of each size were individually determined (grey-open circles) using the equipartition theorem. These values were averaged (magenta-open circles). The error bars in y represent one standard error of the mean while the error bars in x represent one standard deviation from the mean. (b) Standard error of the mean for ktrap (std. error) reported as a percentage (magenta circles) plotted against bead radius (r) calculated from the 10 beads measured at each size shown in (a).
3.2 Verifying improvements in the precision of ktrap using a DNA hairpin
The characteristic force for mechanically unfolding a DNA hairpin depends on its sequence [9] and can therefore serve as a biologically based standard by which to verify our reduced uncertainty in ktrap. The determination of F1/2, the force at which the hairpin spends half its time open, is particularly sensitive to variation in F. Previous work has shown that changes of less than 1% in F to a single individual hairpin can lead to ~30% changes in the probability of the DNA hairpin being open [5, 9, 30]. We chose to study the previously characterized hairpin GC50 [Fig. 4(a)] [9] using an active force clamp to stabilize the applied force. We measured 11 individual hairpins at each bead size for two different bead radii, 250 nm and 390 nm. The resulting data agrees with prior results, showing the expected bi-stable behavior and sensitivity to applied F [Fig. 4(b)].
Before comparing F1/2 between the different bead sizes, we performed a quality check on our data by comparing the average change in contour length (ΔL) for each bead size with the prior work [9]. Specifically, we measured 18.2 ± 0.6 nm (mean ± S.E.) and 18.0 ± 0.4 nm for the 250- and 390-nm beads, respectively. Woodside et al. measured 17.8 ± 0.3 nm and predicted 18.2 nm based on the worm-like-chain model [9]. Hence our data on the opening distance was in quantitative agreement with prior work and theoretical expectation.
Having established confidence in our raw data, we next demonstrated a twofold reduction in uncertainty of F1/2 when comparing the two bead sizes that showed the best and worst force precision. Individual determinations of F1/2 for different molecules showed significant scatter [Fig. 5(a)]; this variation in F1/2 was larger than the 0.1-pN precision achieved when determining the F1/2 for an individual hairpin (see §2.3). Quantitatively, analysis of F1/2 for the two bead sizes yielded 13.7 ± 0.4 pN (mean ± S.E.) and 13.6 ± 0.2 pN, for r = 250 and 390 nm, respectively. Like the ΔL values, these values of F1/2 are statistically indistinguishable from one another and in quantitative agreement with the literature value of 13.6 ± 0.4 pN [9].
#176448 - $15.00 USD Received 18 Sep 2012; revised 12 Dec 2012; accepted 13 Dec 2012; published 2 Jan 2013(C) 2013 OSA 14 January 2013 / Vol. 21, No. 1 / OPTICS EXPRESS 46

The key result is that the uncertainty in F1/2 for the optimally sized beads was twofold less [Fig. 5(b)]. We note that this improved determination of F1/2 occurred even though the absolute variation in bead radius for the 390-nm beads was almost twice that of the 250-nm beads. More generally, the reduced improvement in precision for F1/2 as compared to ktrap (2.0 vs 2.8) suggests that systematic errors in ktrap were the primary but not only source of variation affecting the determination of F1/2
Fig. 4. (a) Secondary structure of hairpin GC50. (b) DNA hairpin dynamics at three different forces with accompanying positional histograms. All three traces are from the same individual hairpin. Data was smoothed to 500 Hz (colors) and 10 Hz (black), respectively.
Fig. 5. (a) F1/2 for two different sized beads where F1/2 is defined as the force at which the hairpin is equally likely to be open or closed. Grey-open circles represent individual data points (N = 11 for each bead size). Green circles represent the averaged data. Error bars in y represent standard error of the mean. Error bars in x represent the standard deviation. (b) Standard error of the mean for the F1/2 (std. error) reported as a percentage (green circles) plotted against bead radius (r) calculated from the 11 individual hairpins at each bead size shown in (a).
In addition to F1/2, we determined the persistence length of each bead-DNA complex by measuring its force-extension curve. We found no difference in the fractional error in p for the different-sized beads [49.9 ± 0.8 nm (mean ± S.E.) and 48.6 ± 0.8 nm for 250- and 390-nm beads, respectively], even though p depends on ktrap through F. These values agree with the
#176448 - $15.00 USD Received 18 Sep 2012; revised 12 Dec 2012; accepted 13 Dec 2012; published 2 Jan 2013(C) 2013 OSA 14 January 2013 / Vol. 21, No. 1 / OPTICS EXPRESS 47
published values of p for DNA with an L = 2 µm [28, 37]. Hence, in our trapping assay, measurement of F1/2 is a more sensitive probe of variation in ktrap than p.
4. Conclusions
By appropriately choosing the size of the bead used in optical-trapping studies, one can reduce uncertainty in ktrap by a factor of 2.8 when studying nominally identical beads. This improvement in calibrating ktrap was verified by measuring F1/2 for a canonical DNA hairpin. Our calibration techniques used a separate laser aligned collinearly with the trapping beam. We expect that the approach described herein should be generalizable to other trap geometries and multiple methods for calibrating both trap stiffness and sensitivity [38, 39]. For example, force detection techniques use ktrap to determine xbd [23, 24, 40]. Hence, these detection techniques would also benefit from reducing variability in ktrap. Our optimally sized bead also leads to the highest ktrap per unit laser power [27], but experimental tradeoffs should be considered. Using smaller beads leads to better temporal resolution at the cost of increased laser power. Using larger beads offers the benefit of larger applied forces since the Hookean approximation remains valid at larger xbd [27]. However, these larger beads have less temporal resolution and pose significant geometric problems for surface-coupled assays [28]. Fortunately, the decreased variability in ktrap between individual beads exists over a broad range of r, allowing some flexibility in tailoring the choice of bead size for each application.
On a broader level, this work emphasizes the utility of DNA hairpins as an intrinsic force standard, similar to prior work based on DNA’s elasticity [41]. Our most precise value of F1/2 (13.6 ± 0.2 pN) was indistinguishable from the independent measurement of Woodside et al. (13.6 ± 0.4 pN) even though the measurements used a different trapping geometry and were taken with a different type of force clamp in different labs [9]. This quantitative agreement suggests that, not only does bead size optimization reduce force error, but it might also improve force accuracy.
Acknowledgments
The authors acknowledge helpful discussion and technical assistance from D. Hern Paik and Violet A. Roskens. This work was supported by NIST and the National Science Foundation (Phys-1125844). Mention of commercial products is for information only; it does not imply NIST’s recommendation or endorsement. T.T. Perkins is a staff member of NIST’s Quantum Physics Division.
#176448 - $15.00 USD Received 18 Sep 2012; revised 12 Dec 2012; accepted 13 Dec 2012; published 2 Jan 2013(C) 2013 OSA 14 January 2013 / Vol. 21, No. 1 / OPTICS EXPRESS 48