grip op de marketing performance
TRANSCRIPT

Grip op de marketing
performance
Ed Peelen

2
Agenda
> Marketing accountability: where do we stand and what are the consequences?
– Frequently used metrics
> Marketing map: towards an organization specific model
– Strategic and operational aspects
– Assets
– Relating activities, resources to results
– Risk
> Interface marketing – control
3

Current status? Effectiveness of controls by function
4
0 10 20 30 40 50 60 70 80 90 100
finance
customer service
manufacturing
supply chain
sales
R&D
marketing
marketing
finance
Source: Shaw and Frisk

Current status? Budgets most likely to be cut by finance
5
0
5
10
15
20
25
marketing HR Training R&D IT
Series1
Source: KPMG

Current status?
>Marketing driver of business success?
>Crises of confidence at the top?
>Marketing budgets are cure more than any other
>Marketing spending is volatile, swinging up an down year-to-year
>Marketing controls need overhaul
>Marketing resistance to controls
6
Source: Shaw and Merrick

Current status?
>Accountability
– 20% of the expenditures are responsible for 80% of the results?
>Decision making
– Fact based or a ‘damn good story’ to influence decision making?
7
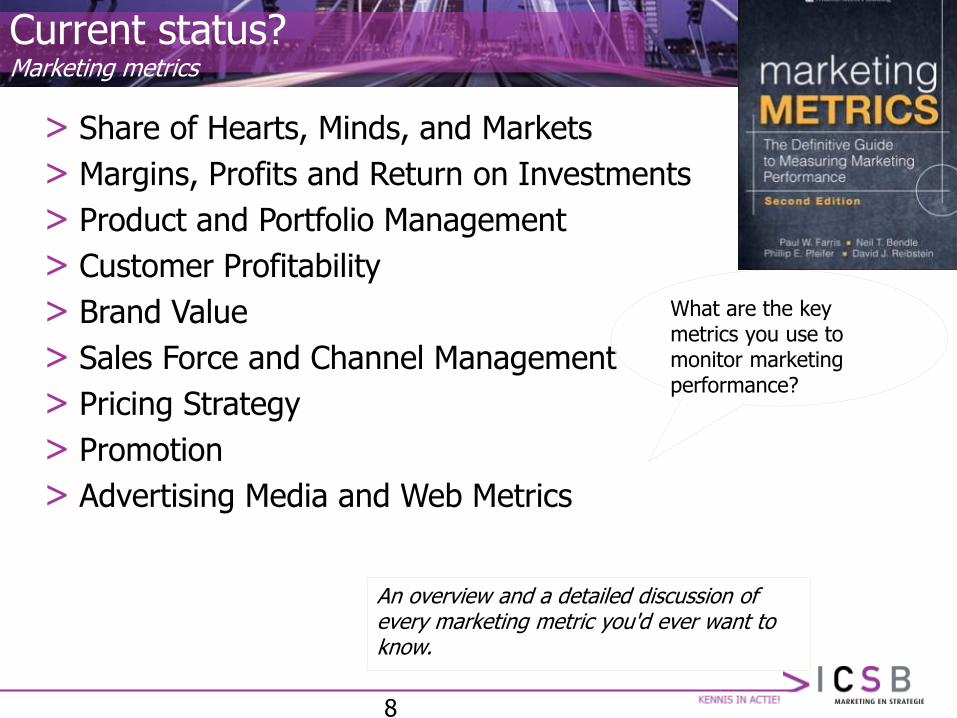
Current status? Marketing metrics
> Share of Hearts, Minds, and Markets
> Margins, Profits and Return on Investments
> Product and Portfolio Management
> Customer Profitability
> Brand Value
> Sales Force and Channel Management
> Pricing Strategy
> Promotion
> Advertising Media and Web Metrics
8
An overview and a detailed discussion of every marketing metric you'd ever want to know.
What are the key metrics you use to monitor marketing performance?

Current status? The magic numbers? Non financial…
9
0 10 20 30 40 50 60 70 80 90
awareness
market share
relative price
# complaints
satisfaction
availability
# customers
perceived quality
loyalty
relative perc. Qual.
% use
% reach board
% top rating
Source: Ambler
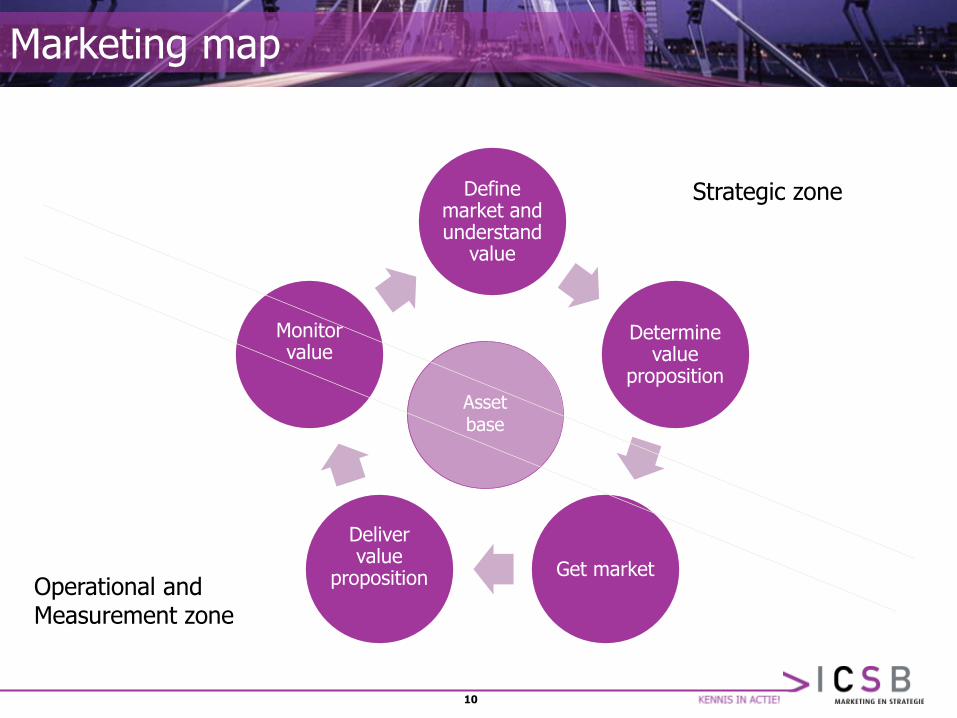
Marketing map
10
Define market and understand
value
Determine value
proposition
Get market
Deliver value
proposition
Monitor value
Asset base
Strategic zone
Operational and Measurement zone

Marketing map
11
Define market and understand
value
Determine value
proposition
Get market
Deliver value
proposition
Monitor value
Asset base
Strategic zone
Operational and Measurement zone
Operational efficiency is usually a necessary but insufficient condition for creating shareholder value and so strategic effectiveness becomes important

Marketing map
12
Define market and understand
value
Determine value
proposition
Get market
Deliver value
proposition
Monitor value
Asset base
Strategic zone
Operational and Measurement zone
Developing marketing expenditure is aimed at increasing the value of marketing assets such as brands, customers relations and channels of distribution
Maintenance marketing
Building a market

13

14
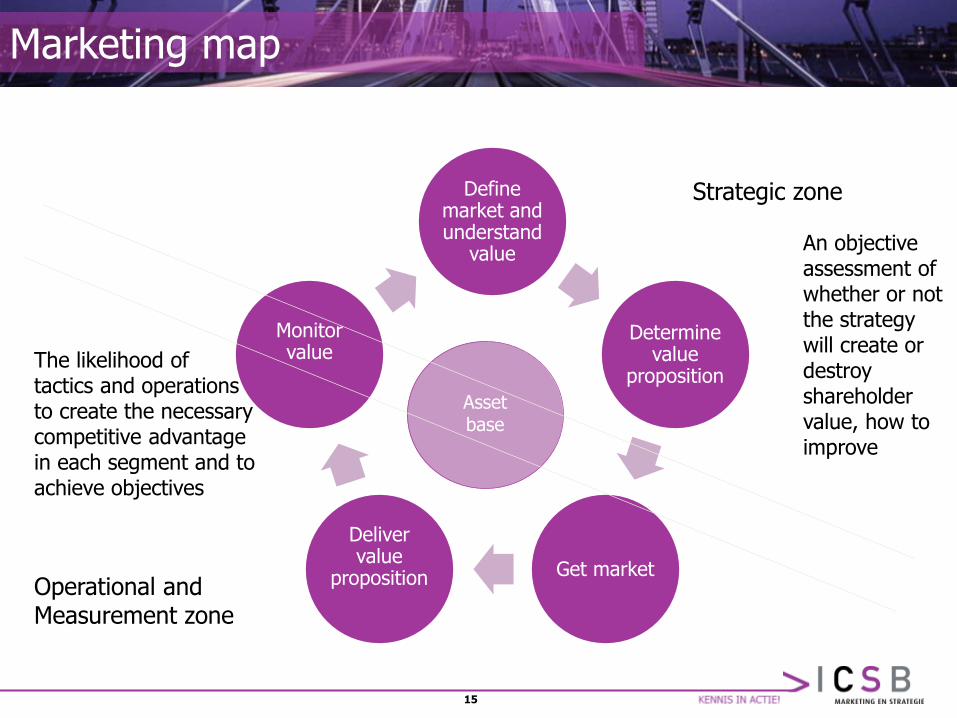
Marketing map
15
Define market and understand
value
Determine value
proposition
Get market
Deliver value
proposition
Monitor value
Asset base
Strategic zone
Operational and Measurement zone
An objective assessment of whether or not the strategy will create or destroy shareholder value, how to improve
The likelihood of tactics and operations to create the necessary competitive advantage in each segment and to achieve objectives

Marketing map Relating activities and resources to results
Strategy
Tactics and operations
R
W
Right (R) Wrong (W)
Doing the right things right

Calculating Customer Value An example of a Customer Life Cycle Profit Pattern in the Credit Card Industry
-80
40
66 7279
87 92 96 99 103 106 111 116 120 124 130137 142
148155
161
-100
-50
0
50
100
150
200
0 1 2 3 4 5 6 7 8 9 10 11 12 13 14 15 16 17 18 19 20
Years
Pro
fit
in $
Source: Reichheld

Impact of a 5% retention increase on Customer Net Present Value
So
ftw
are
Pu
bli
sh
ing
Offi
ce
bu
ild
ing
ma
na
ge
me
nt
Lif
e i
ns
ura
nc
e
Ind
us
tria
l d
istrib
uti
on
Cre
dit
ca
rd
Ad
ve
rti
sin
g a
ge
nc
y
Ind
us
tria
l b
ro
ke
ra
ge
Bra
nc
h b
an
k d
ep
os
its
Au
to/H
om
e i
ns
ura
nc
e
Au
to s
erv
ice
Ind
us
tria
l la
un
dry
0
10
20
30
40
50
60
70
80
90
100
Industry
Loyalty
pays off?
Source: Reichheld


Customer value map
Fair value zone
Worse value
Better value
Relative
price
H
L
L
1.0
H Relative quality
1.0
X
X
X
X
X
X
X

© ICSB,
0
20
40
60
0
10
0
250
ILLUSTRATION Moving 4 week data
Awareness Index
GRPs
7
2
Claimed recall
Model estimate.
Base level 7 7
10
Campaign A Campaign B
2½ years
AWARENESS INDEX
The % increase in awareness
at 100 GRP’s
Campaign B generates 3x as
Much advertising recall as
campaign A
BASE LEVEL
Result of past activities

Efficient Promotion
0
50000
100000
150000
200000
250000
300000
w1 w2 w3 w4 w5 w6 w7 w8 w9 w10 w11 w12 w13 w14 w15
exfact
exdc
scan
Source: Nielsen

Managing the sales process New customer acquisition
1/15 1/5 1/3 Order
1 15 3 +/- 250
1- st
visit
Various
tools
Finance
Database 225.000
- KvK
- Comp Profile
- Eigen bestand
Telemarketing
Lead info
enrichment
Salesman
selects -Postcode
-10-15 empl.
Call for
Appoint
ment
Training
Quotation
Call Negioti
ating
Standard
Quote Training
skills
Sales Lead Time 10 weeks

Marketing map
Marketing model
>Relating resources, efforts to results
– Distinguishing factors affecting the demand, the final result
– Time lag
– Indirect effects: economy, competitors, consumer trends
– Optimum
25

Risk assessment (quantification)
> Market risk
– Product category, market existence, sales volume, forecast, pricing
> Share risk
– Target market, proposition, swot, uniqueness, future
> Profit risk
– Profit pool, profit source, competitor impact, internal gross margin, other
26
Sensitivity to risks differs; depends on growths, market share, margins, competition
Normally, generating growth in sales revenues and profits leads to an increased risk profile in mature markets and for mature products
Risk assessment
>How to handle risk:
– Adjusting the discount rate for risk?
>Type of risk:
– Potential damage to investment results
– Potential damage to existing assets!
27

Organizing for the interface between controling and marketing
>Policeman
>Supporter, coach, advisor
>Complementing each other
>Informing, coordinating, decision making, monitoring
28