grid parity of photovoltaics in germany – a result of the
TRANSCRIPT
Grid Parity of Photovoltaics in Germany – a Result of
the Renewable Energy Act
Martin Ammon
IMRE Alumni Conference in Bandung, Indonesia
September 25th -30th, 2011, Institute of Technology Bandung- Indonesia
© Conergy AG

2
Agenda
1. The German Renewable Energy Act
2. Photovoltaic Headed to Grid Parity
3. Grid Parity of Photovoltaics in Indonesia

3
1. The German Renewable Energy Act

4
Development of EEG Electricity Amount and EEG Levy1.
0.0 €Cent/kWh
1.5 €Cent/kWh
3.0 €Cent/kWh
4.5 €Cent/kWh
6.0 €Cent/kWh
2000
2001
2002
2003
2004
2005
2006
2007
2008
2009
2010
2011
e
0 GWh
30,000 GWh
60,000 GWh
90,000 GWh
120,000 GWh
EEG electricity amount EEG levy
Sources: BDEW/ÜBN (2010)

5
EEG Levy 2010 and 2011: Allocation of Energy Sources1.
0.83
1.780.53
0.63
0.02
0.03
0.63
0.78
0.02
0.04
0.29
0.0 €Cent/kWh
1.0 €Cent/kWh
2.0 €Cent/kWh
3.0 €Cent/kWh
4.0 €Cent/kWh
2010 2011
Photovoltaic Wind onshoreWind offshore BiomassHydro power, gas, geothermal energy Adjustment
Source: BDEW 2011
2.05 €Cent/ kWh
3.53 €Cent/ kWh

6
Feed-in Tariff BAPV Systems in Germany 2000 – 20111.
54.00 54.00 54.00 54.00 54.00
48.7446.30
43.99
29.37
25.55 24.79
33.00
51.30
21.56
54.5351.80
49.21
43.01
39.14
34.05 33.03
46.75
57.4057.4057.4057.4057.40
28.74
10 €Cent/kWh
20 €Cent/kWh
30 €Cent/kWh
40 €Cent/kWh
50 €Cent/kWh
60 €Cent/kWh
70 €Cent/kWh
2000 2001 2002 2003 2004 2005 2006 2007 2008 2009 2010 Jul10
Oct10
2011
Sources: BUND (2000-2011)
7
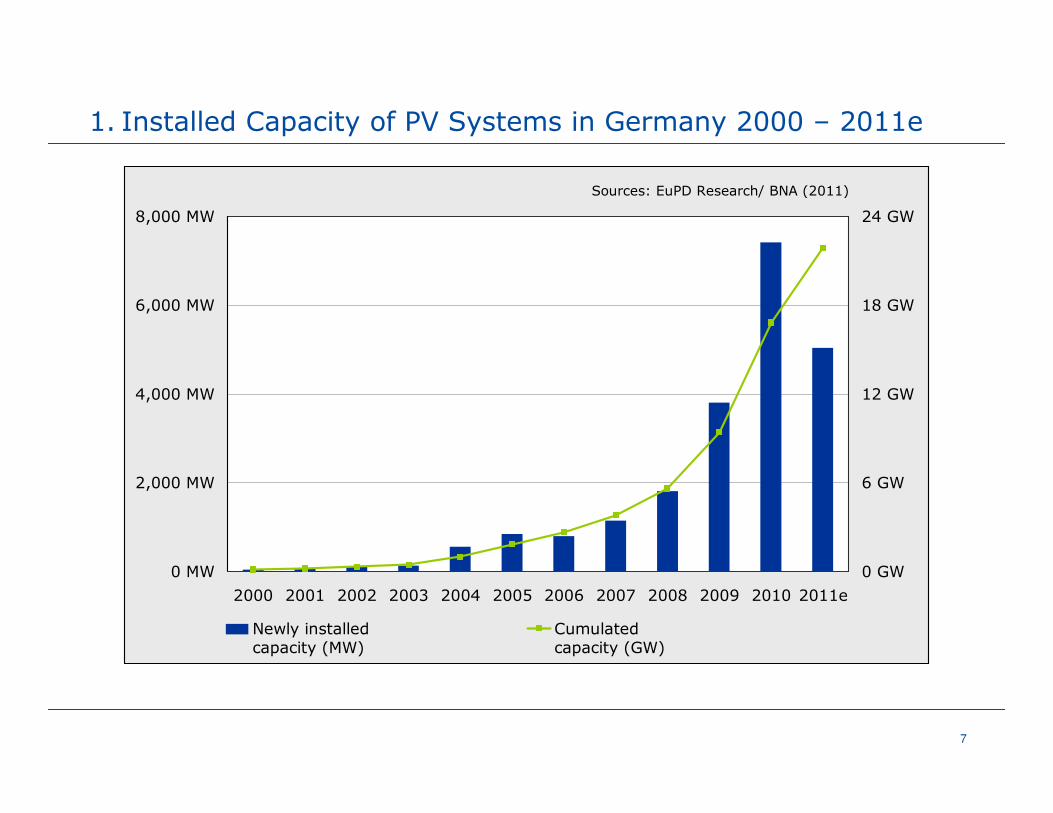
Installed Capacity of PV Systems in Germany 2000 – 2011e1.
0 MW
2,000 MW
4,000 MW
6,000 MW
8,000 MW
2000 2001 2002 2003 2004 2005 2006 2007 2008 2009 2010 2011e
0 GW
6 GW
12 GW
18 GW
24 GW
Newly installed capacity (MW)
Cumulated capacity (GW)
Sources: EuPD Research/ BNA (2011)

8
Newly Installed Capacity of PV Systems in 2010 und 20111.
0 MW
500 MW
1,000 MW
1,500 MW
2,000 MW
2,500 MW
Jan Feb Mrz Apr May Jun Jul Aug Sep Oct Nov Dec
2010 2011
Source: BNetzA (2011)

9
Development of PV System Prices in Germany and Learning Curve1.
4,906
4,382
3,602
2,455
2,956
4,559
5,6005,300
5,080
5,600
6,4006,540
100%
65%
60%
55%
46%
41%
34%
81%
30%
72%
94% 87%
2,000 €/kWp
3,000 €/kWp
4,000 €/kWp
5,000 €/kWp
6,000 €/kWp
7,000 €/kWp
2000 2001 2002 2003 2004 2005 2006 2007 2008 2009 2010 2011
30.00%
35.00%
40.00%
45.00%
50.00%
55.00%
60.00%
65.00%
70.00%
75.00%
80.00%
85.00%
90.00%
95.00%
100.00%
105.00%
PV System Price Germany (<10kWp)
Theoretical System Price Development (Learning Rate 20%) Depending on CumulativeWorldwide Installed Capacity
Sources: EPIA 2011/ EuPD Research 2011/ Bhandari 2010
10
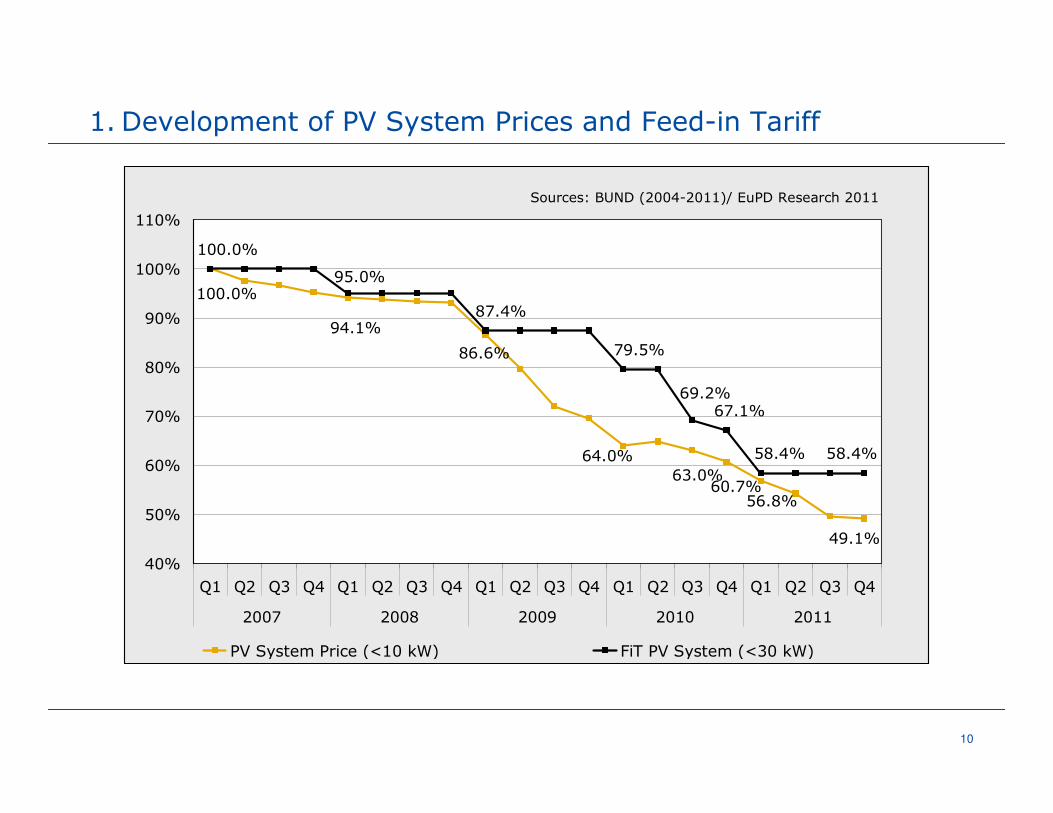
Development of PV System Prices and Feed-in Tariff 1.
49.1%
56.8%60.7%
63.0%64.0%
86.6%
94.1%
100.0%
58.4%58.4%
69.2%67.1%
79.5%
87.4%
95.0%
100.0%
40%
50%
60%
70%
80%
90%
100%
110%
Q1 Q2 Q3 Q4 Q1 Q2 Q3 Q4 Q1 Q2 Q3 Q4 Q1 Q2 Q3 Q4 Q1 Q2 Q3 Q4
2007 2008 2009 2010 2011
PV System Price (<10 kW) FiT PV System (<30 kW)
Sources: BUND (2004-2011)/ EuPD Research 2011
11
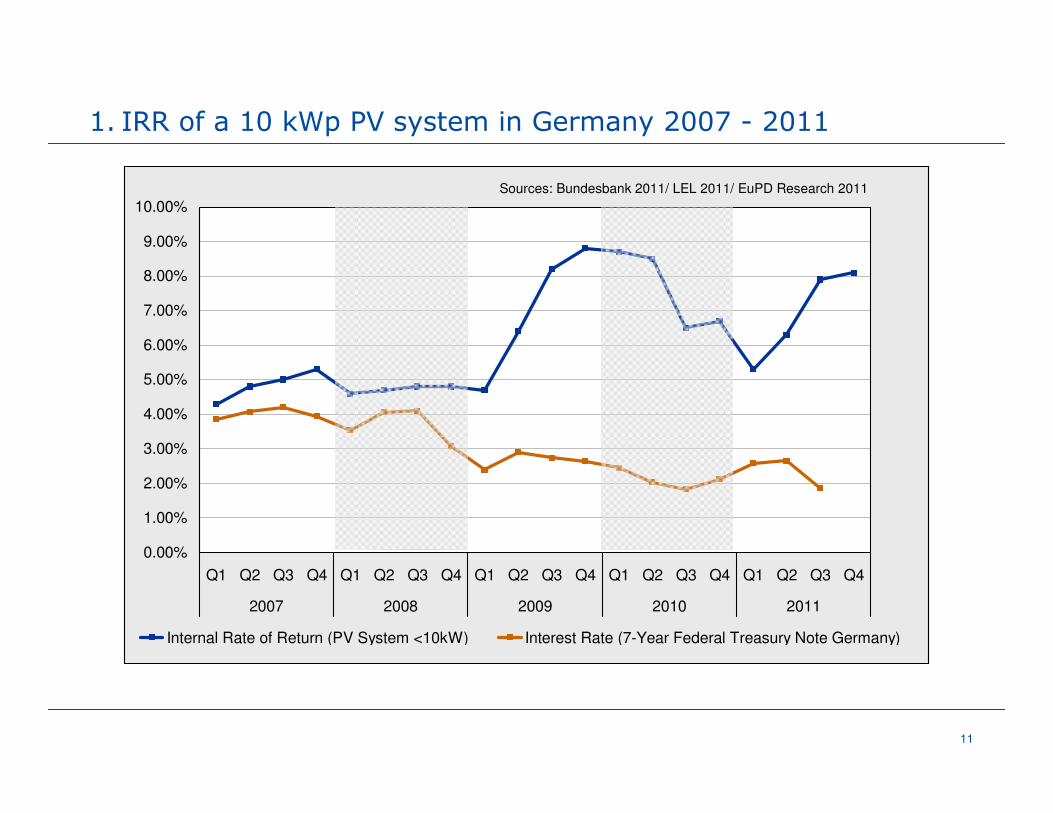
IRR of a 10 kWp PV system in Germany 2007 - 20111.
0.00%
1.00%
2.00%
3.00%
4.00%
5.00%
6.00%
7.00%
8.00%
9.00%
10.00%
Q1 Q2 Q3 Q4 Q1 Q2 Q3 Q4 Q1 Q2 Q3 Q4 Q1 Q2 Q3 Q4 Q1 Q2 Q3 Q4
2007 2008 2009 2010 2011
Internal Rate of Return (PV System <10kW) Interest Rate (7-Year Federal Treasury Note Germany)
Sources: Bundesbank 2011/ LEL 2011/ EuPD Research 2011

12
2. Photovoltaic Headed to Grid Parity
13
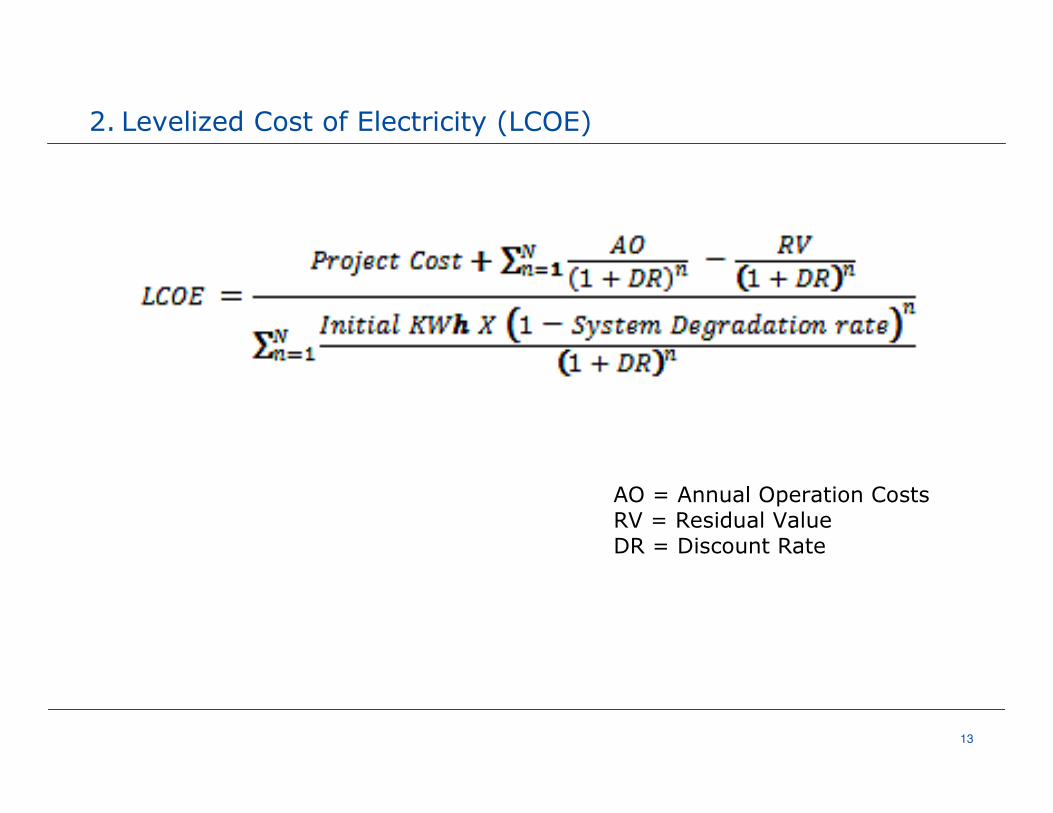
Levelized Cost of Electricity (LCOE) 2.
AO = Annual Operation CostsRV = Residual ValueDR = Discount Rate

14
Sensitivity Analysis of LCOE Calculation Parameter2.
110.0%
90.0%
99.1%
100.9%
107.7%
90.4%
111.1%
90.9%
99.1%
100.8%
107.4%
100.0%
99.7%100.3%
85.0%
90.0%
95.0%
100.0%
105.0%
110.0%
115.0%
System Price (€/kW) O&M Operation PeriodYield (kWh/ kW Interest Rate (Debt Capital) Credit PeriodDegradation
Source: Own Calculations

15
Reaching Grid Parity in the German PV Market2.
0.4224
0.2336 0.2375 0.2423 0.2470
0.2467
0.28280.3102
0.3058
0.49320.4770 0.4615 0.4582
0.3512
0.1949 0.1997
0.22880.22200.2172
0.1901
0.10 €Cent/kWh
0.20 €Cent/kWh
0.30 €Cent/kWh
0.40 €Cent/kWh
0.50 €Cent/kWh
Q1 Q2 Q3 Q4 Q1 Q2 Q3 Q4 Q1 Q2 Q3 Q4 Q1 Q2 Q3 Q4 Q1 Q2 Q3 Q4
2007 2008 2009 2010 2011
LCOE PV (<10 kW) Electricity Price (Private Households)
Source: EuPD Research 2011

16
Forecast of Worldwide Cumulated Installed Capacity and System Prices2.
0 GW
500 GW
1,000 GW
1,500 GW
2011 2012 2013 2014 2015 2016 2017 2018 2019 2020 2021 2022 2023 2024 2025
0 €/kW
1,000 €/kW
2,000 €/kW
3,000 €/kW
Worldwide Cumulated Installed Capacity Price Development of PV Systems (<10 kW)
Sources: EPIA 2011/ EREC 2010
17
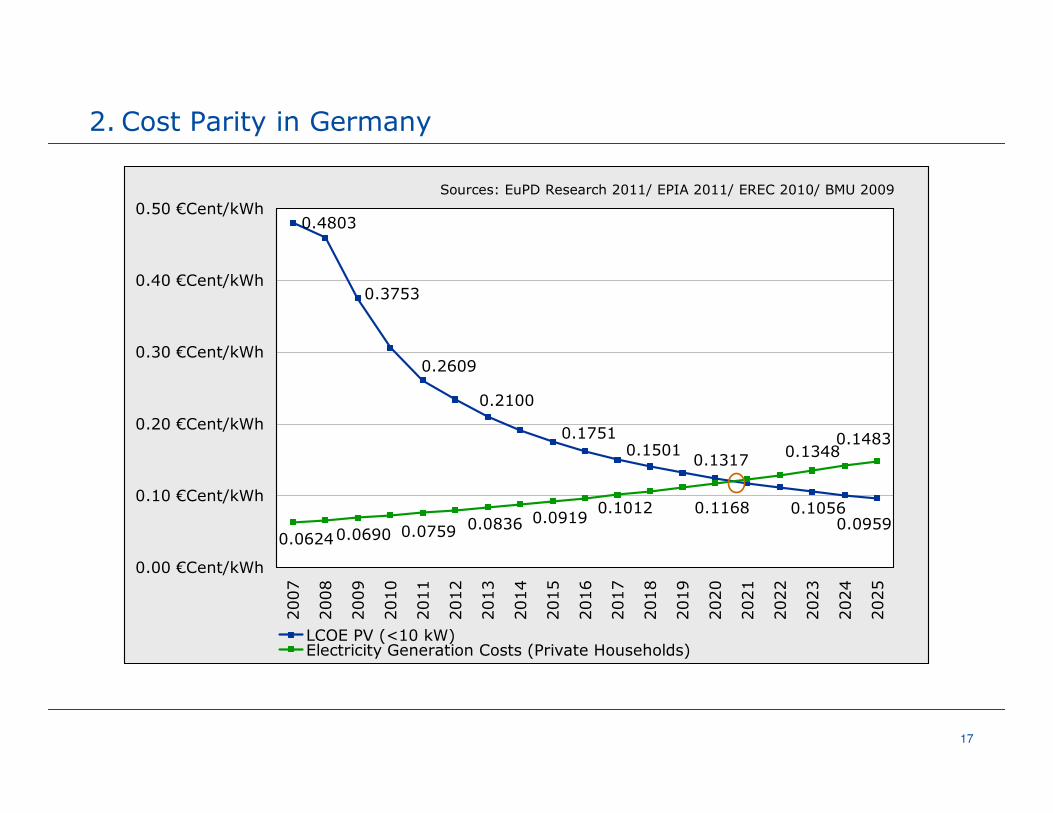
Cost Parity in Germany2.
0.4803
0.1348
0.3753
0.2609
0.15010.1751
0.2100
0.1317
0.10560.0959
0.1483
0.0836 0.09190.06240.0690 0.0759
0.11680.1012
0.00 €Cent/kWh
0.10 €Cent/kWh
0.20 €Cent/kWh
0.30 €Cent/kWh
0.40 €Cent/kWh
0.50 €Cent/kWh
2007
2008
2009
2010
2011
2012
2013
2014
2015
2016
2017
2018
2019
2020
2021
2022
2023
2024
2025
LCOE PV (<10 kW)Electricity Generation Costs (Private Households)
Sources: EuPD Research 2011/ EPIA 2011/ EREC 2010/ BMU 2009
18
3. Grid Parity of Photovoltaics in Indonesia
19
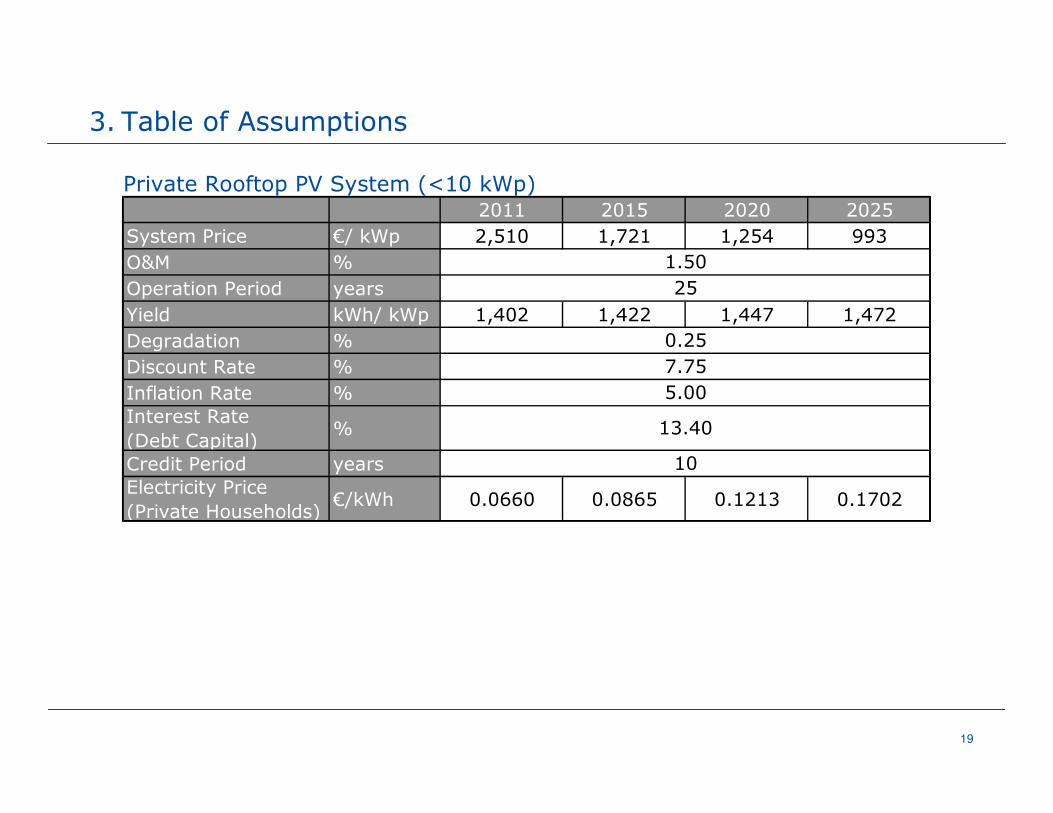
Table of Assumptions3.
Private Rooftop PV System (<10 kWp)2011 2015 2020 2025
System Price €/ kWp 2,510 1,721 1,254 993
O&M %
Operation Period years
Yield kWh/ kWp 1,402 1,422 1,447 1,472
Degradation %
Discount Rate %
Inflation Rate %Interest Rate (Debt Capital)
%
Credit Period yearsElectricity Price (Private Households)
€/kWh 0.0660 0.0865 0.1213 0.1702
5.00
13.40
10
1.50
25
0.25
7.75
20
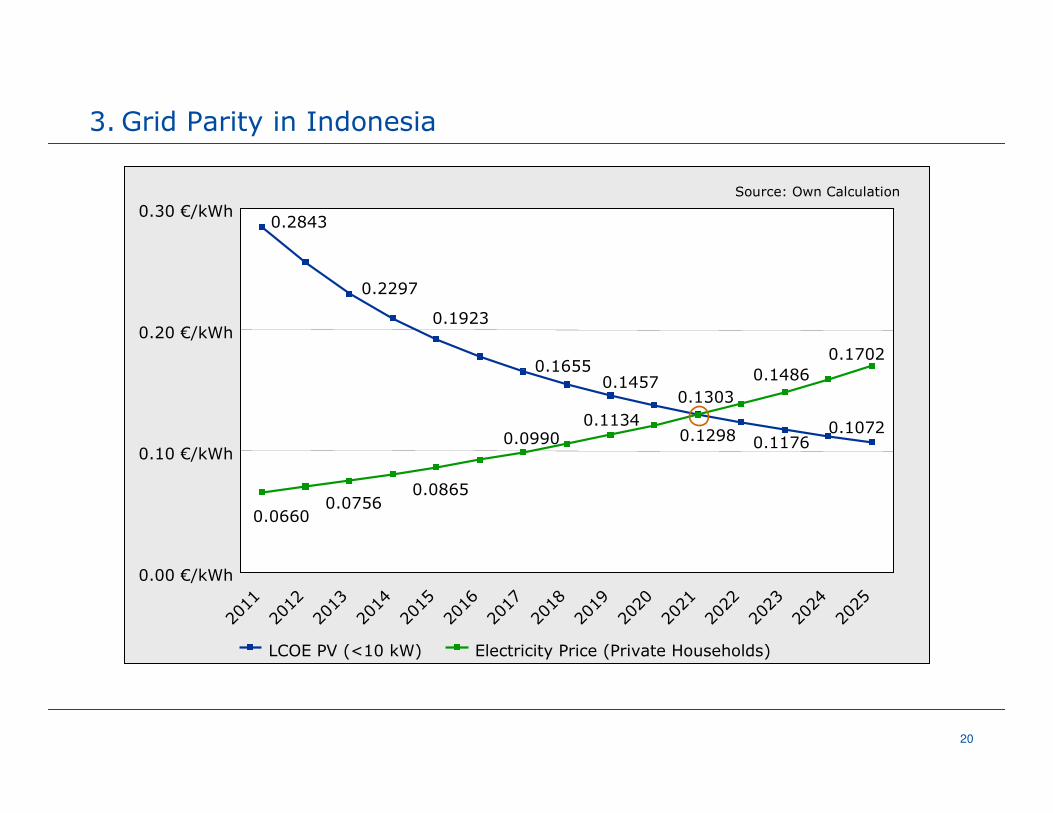
Grid Parity in Indonesia3.
0.07560.0865
0.14570.1303
0.1655
0.1923
0.2297
0.2843
0.10720.1176
0.14860.1702
0.0660
0.09900.1134
0.1298
0.00 €/kWh
0.10 €/kWh
0.20 €/kWh
0.30 €/kWh
2011
2012
2013
2014
2015
2016
2017
2018
2019
2020
2021
2022
2023
2024
2025
LCOE PV (<10 kW) Electricity Price (Private Households)
Source: Own Calculation

21
Fuel Parity in Indonesia 3.
Electricity Storage (NiCd)
2010 2015 2020
Storage cost €/ kWh 307 254 200
Operation Period years11.4 13.2 15.0
Efficiency %
Diesel Generator
2010 2015 2020
System Price Euro/kW
O&M Euro/kW
Operation Period years
Fuel Requirement
l/kWh
Fuel Price Euro/l 0.38 0.93 1.19
Utilization Period h/a
Degradation %
0.28
1,0000.00
90.0
480
35
20

22
Fuel Parity in Indonesia 3.
0.00 Euro/ kWh
0.20 Euro/ kWh
0.40 Euro/ kWh
0.60 Euro/ kWh
0.80 Euro/ kWh
1.00 Euro/ kWh
1.20 Euro/ kWh
2006
2007
2008
2009
2010
2011
2012
2013
2014
2015
2016
2017
2018
2019
2020
2021
2022
LCOE PV (<10 kW) LCOE PV (Storage)Electricity Price (Households) LCOE Diesel Generator
Sources: Meyer 2008/ Riegel 2011/ Wagner 2004

23
Thank You for Your Attention!