gri · 2017-12-07 · gri potashcorp uses the global reporting initiative (gri) sustainability...
TRANSCRIPT

GRI
PotashCorp uses the Global Reporting Initiative (GRI) sustainability reporting framework for reporting its economic, environmental and social performance. The company has early
adopted the GRI Sustainability Reporting Standards (2016), which will supersede the GRI G4 Guidelines previously used by the company. We have adopted the framework as part of
our company’s commitment to transparency and accountability.
Our Index is designed as a table of contents where you can find information related to each of our GRI disclosures which have been prepared in accordance with the GRI Standards:
Core option.
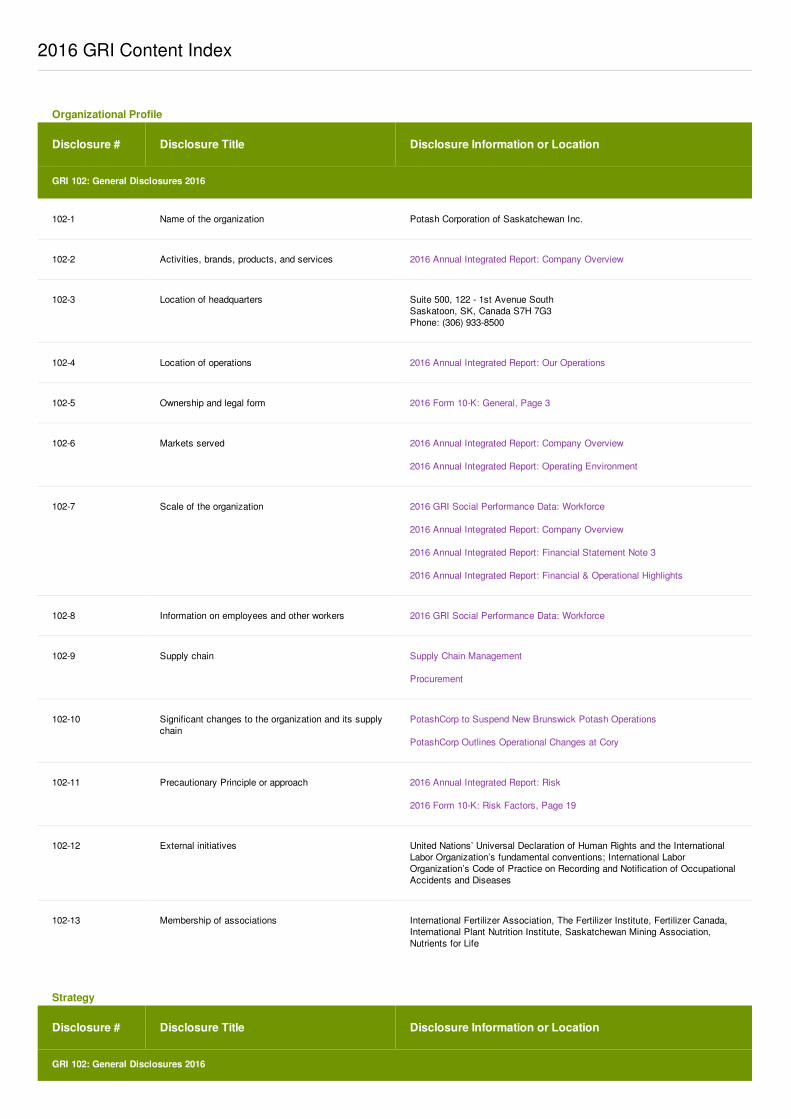
2016 GRI Content Index
Disclosure # Disclosure Title Disclosure Information or Location
GRI 102: General Disclosures 2016
102-1 Name of the organization Potash Corporation of Saskatchewan Inc.
102-2 Activities, brands, products, and services 2016 Annual Integrated Report: Company Overview
102-3 Location of headquarters Suite 500, 122 - 1st Avenue SouthSaskatoon, SK, Canada S7H 7G3 Phone: (306) 933-8500
102-4 Location of operations 2016 Annual Integrated Report: Our Operations
102-5 Ownership and legal form 2016 Form 10-K: General, Page 3
102-6 Markets served 2016 Annual Integrated Report: Company Overview
2016 Annual Integrated Report: Operating Environment
102-7 Scale of the organization 2016 GRI Social Performance Data: Workforce
2016 Annual Integrated Report: Company Overview
2016 Annual Integrated Report: Financial Statement Note 3
2016 Annual Integrated Report: Financial & Operational Highlights
102-8 Information on employees and other workers 2016 GRI Social Performance Data: Workforce
102-9 Supply chain Supply Chain Management
Procurement
102-10 Significant changes to the organization and its supplychain
PotashCorp to Suspend New Brunswick Potash Operations
PotashCorp Outlines Operational Changes at Cory
102-11 Precautionary Principle or approach 2016 Annual Integrated Report: Risk
2016 Form 10-K: Risk Factors, Page 19
102-12 External initiatives United Nations’ Universal Declaration of Human Rights and the InternationalLabor Organization’s fundamental conventions; International LaborOrganization’s Code of Practice on Recording and Notification of OccupationalAccidents and Diseases
102-13 Membership of associations International Fertilizer Association, The Fertilizer Institute, Fertilizer Canada,International Plant Nutrition Institute, Saskatchewan Mining Association,Nutrients for Life
Organizational Profile
Disclosure # Disclosure Title Disclosure Information or Location
GRI 102: General Disclosures 2016
Strategy
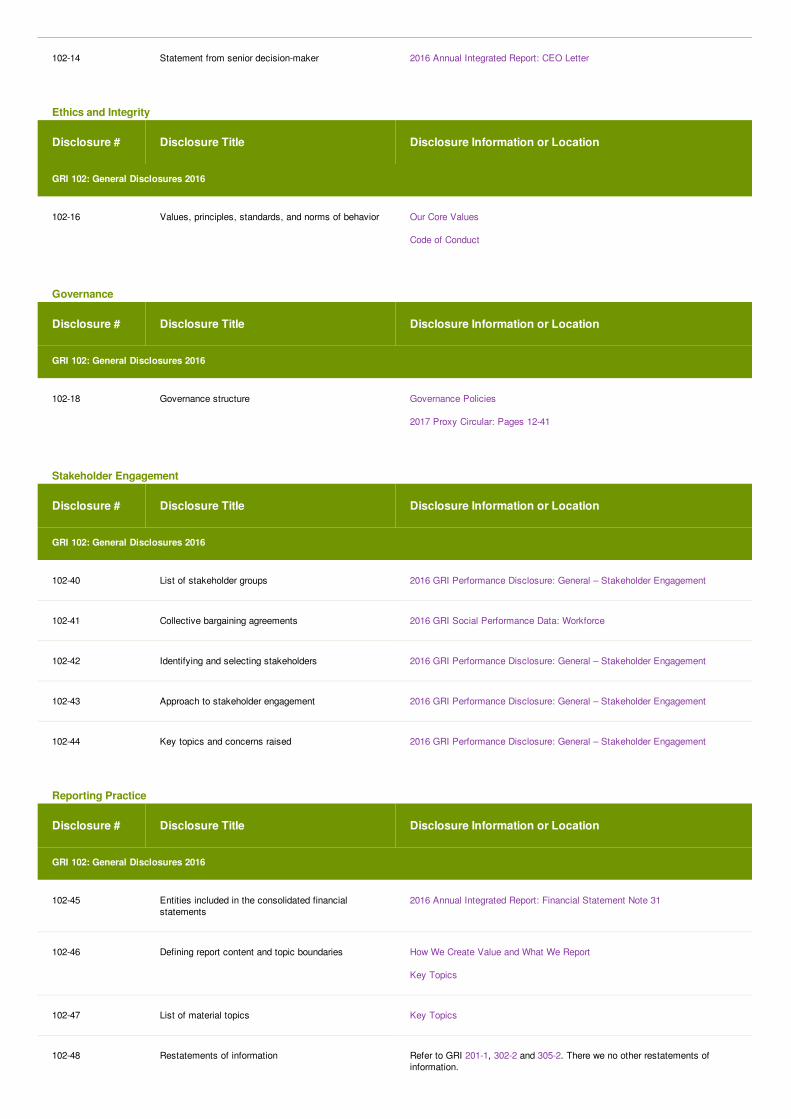
102-14 Statement from senior decision-maker 2016 Annual Integrated Report: CEO Letter
Disclosure # Disclosure Title Disclosure Information or Location
GRI 102: General Disclosures 2016
102-16 Values, principles, standards, and norms of behavior Our Core Values
Code of Conduct
Ethics and Integrity
Disclosure # Disclosure Title Disclosure Information or Location
GRI 102: General Disclosures 2016
102-18 Governance structure Governance Policies
2017 Proxy Circular: Pages 12-41
Governance
Disclosure # Disclosure Title Disclosure Information or Location
GRI 102: General Disclosures 2016
102-40 List of stakeholder groups 2016 GRI Performance Disclosure: General – Stakeholder Engagement
102-41 Collective bargaining agreements 2016 GRI Social Performance Data: Workforce
102-42 Identifying and selecting stakeholders 2016 GRI Performance Disclosure: General – Stakeholder Engagement
102-43 Approach to stakeholder engagement 2016 GRI Performance Disclosure: General – Stakeholder Engagement
102-44 Key topics and concerns raised 2016 GRI Performance Disclosure: General – Stakeholder Engagement
Stakeholder Engagement
Disclosure # Disclosure Title Disclosure Information or Location
GRI 102: General Disclosures 2016
102-45 Entities included in the consolidated financialstatements
2016 Annual Integrated Report: Financial Statement Note 31
102-46 Defining report content and topic boundaries How We Create Value and What We Report
Key Topics
102-47 List of material topics Key Topics
102-48 Restatements of information Refer to GRI 201-1, 302-2 and 305-2. There we no other restatements ofinformation.
Reporting Practice
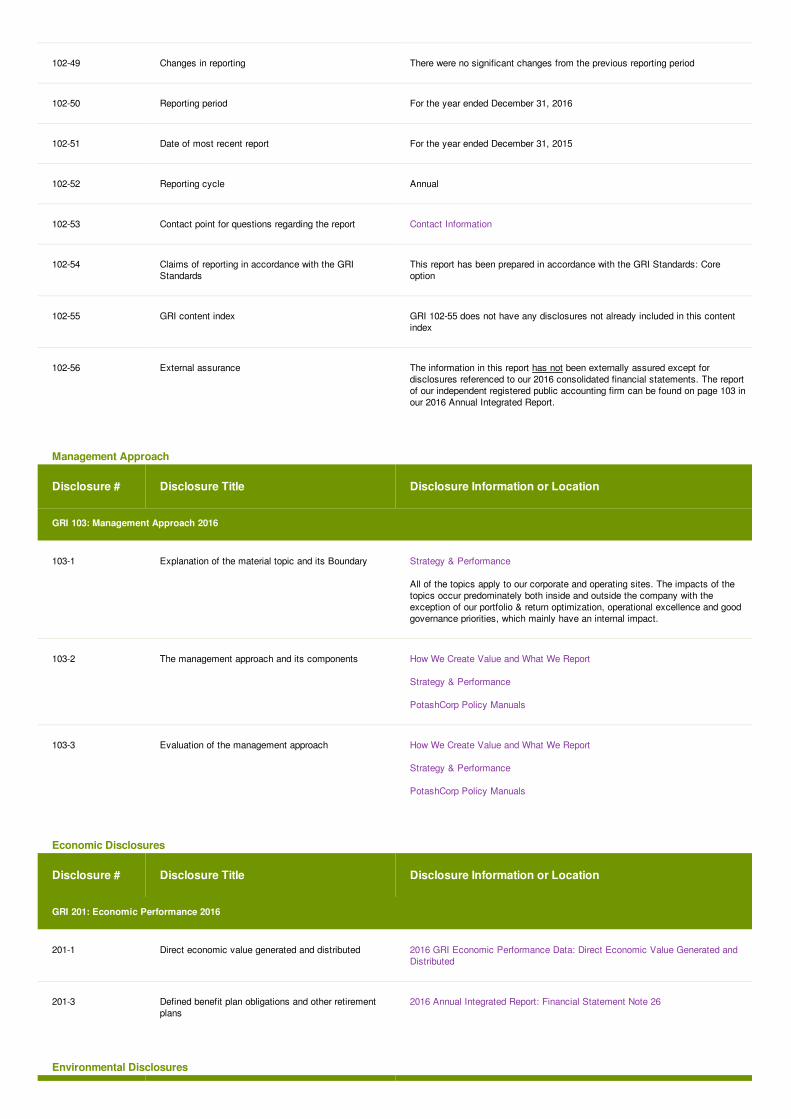
102-49 Changes in reporting There were no significant changes from the previous reporting period
102-50 Reporting period For the year ended December 31, 2016
102-51 Date of most recent report For the year ended December 31, 2015
102-52 Reporting cycle Annual
102-53 Contact point for questions regarding the report Contact Information
102-54 Claims of reporting in accordance with the GRIStandards
This report has been prepared in accordance with the GRI Standards: Coreoption
102-55 GRI content index GRI 102-55 does not have any disclosures not already included in this contentindex
102-56 External assurance The information in this report has not been externally assured except fordisclosures referenced to our 2016 consolidated financial statements. The reportof our independent registered public accounting firm can be found on page 103 inour 2016 Annual Integrated Report.
Disclosure # Disclosure Title Disclosure Information or Location
GRI 103: Management Approach 2016
103-1 Explanation of the material topic and its Boundary Strategy & Performance
All of the topics apply to our corporate and operating sites. The impacts of thetopics occur predominately both inside and outside the company with theexception of our portfolio & return optimization, operational excellence and goodgovernance priorities, which mainly have an internal impact.
103-2 The management approach and its components How We Create Value and What We Report
Strategy & Performance
PotashCorp Policy Manuals
103-3 Evaluation of the management approach How We Create Value and What We Report
Strategy & Performance
PotashCorp Policy Manuals
Management Approach
Disclosure # Disclosure Title Disclosure Information or Location
GRI 201: Economic Performance 2016
201-1 Direct economic value generated and distributed 2016 GRI Economic Performance Data: Direct Economic Value Generated andDistributed
201-3 Defined benefit plan obligations and other retirementplans
2016 Annual Integrated Report: Financial Statement Note 26
Economic Disclosures
Environmental Disclosures
Disclosure # Disclosure Title Disclosure Information or Location
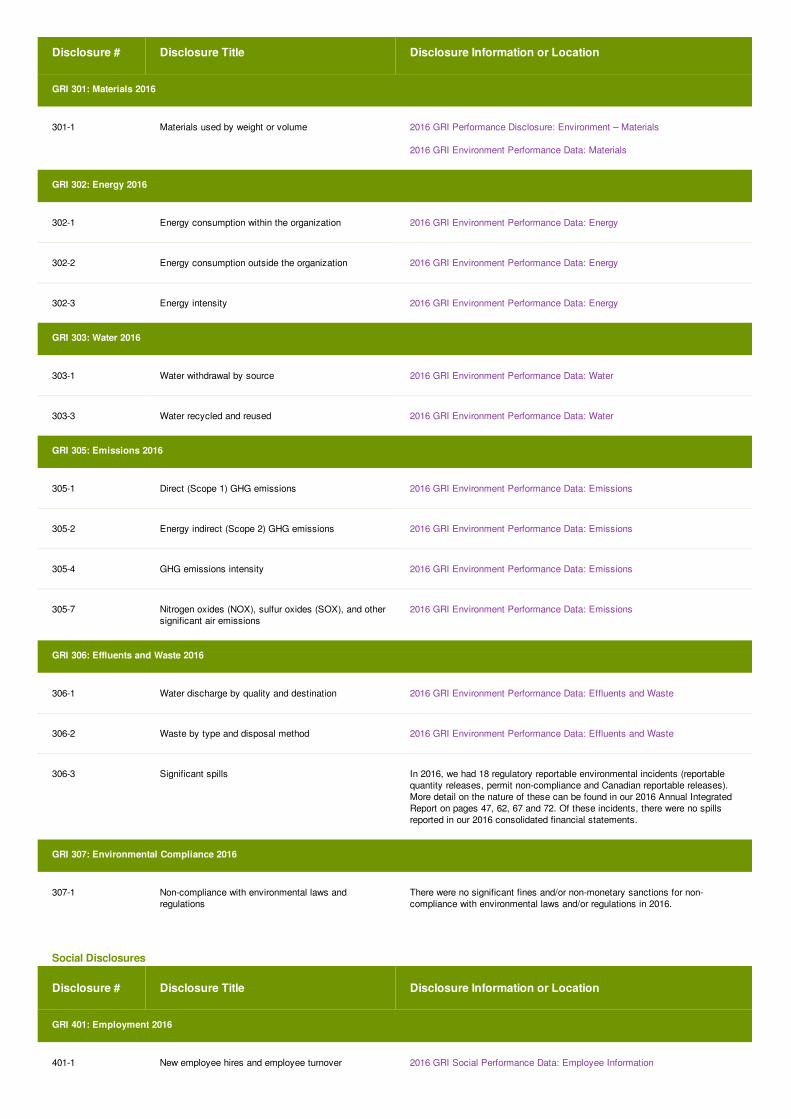
GRI 301: Materials 2016
301-1 Materials used by weight or volume 2016 GRI Performance Disclosure: Environment – Materials
2016 GRI Environment Performance Data: Materials
GRI 302: Energy 2016
302-1 Energy consumption within the organization 2016 GRI Environment Performance Data: Energy
302-2 Energy consumption outside the organization 2016 GRI Environment Performance Data: Energy
302-3 Energy intensity 2016 GRI Environment Performance Data: Energy
GRI 303: Water 2016
303-1 Water withdrawal by source 2016 GRI Environment Performance Data: Water
303-3 Water recycled and reused 2016 GRI Environment Performance Data: Water
GRI 305: Emissions 2016
305-1 Direct (Scope 1) GHG emissions 2016 GRI Environment Performance Data: Emissions
305-2 Energy indirect (Scope 2) GHG emissions 2016 GRI Environment Performance Data: Emissions
305-4 GHG emissions intensity 2016 GRI Environment Performance Data: Emissions
305-7 Nitrogen oxides (NOX), sulfur oxides (SOX), and othersignificant air emissions
2016 GRI Environment Performance Data: Emissions
GRI 306: Effluents and Waste 2016
306-1 Water discharge by quality and destination 2016 GRI Environment Performance Data: Effluents and Waste
306-2 Waste by type and disposal method 2016 GRI Environment Performance Data: Effluents and Waste
306-3 Significant spills In 2016, we had 18 regulatory reportable environmental incidents (reportablequantity releases, permit non-compliance and Canadian reportable releases).More detail on the nature of these can be found in our 2016 Annual IntegratedReport on pages 47, 62, 67 and 72. Of these incidents, there were no spillsreported in our 2016 consolidated financial statements.
GRI 307: Environmental Compliance 2016
307-1 Non-compliance with environmental laws andregulations
There were no significant fines and/or non-monetary sanctions for non-compliance with environmental laws and/or regulations in 2016.
Disclosure # Disclosure Title Disclosure Information or Location
GRI 401: Employment 2016
401-1 New employee hires and employee turnover 2016 GRI Social Performance Data: Employee Information
Social Disclosures
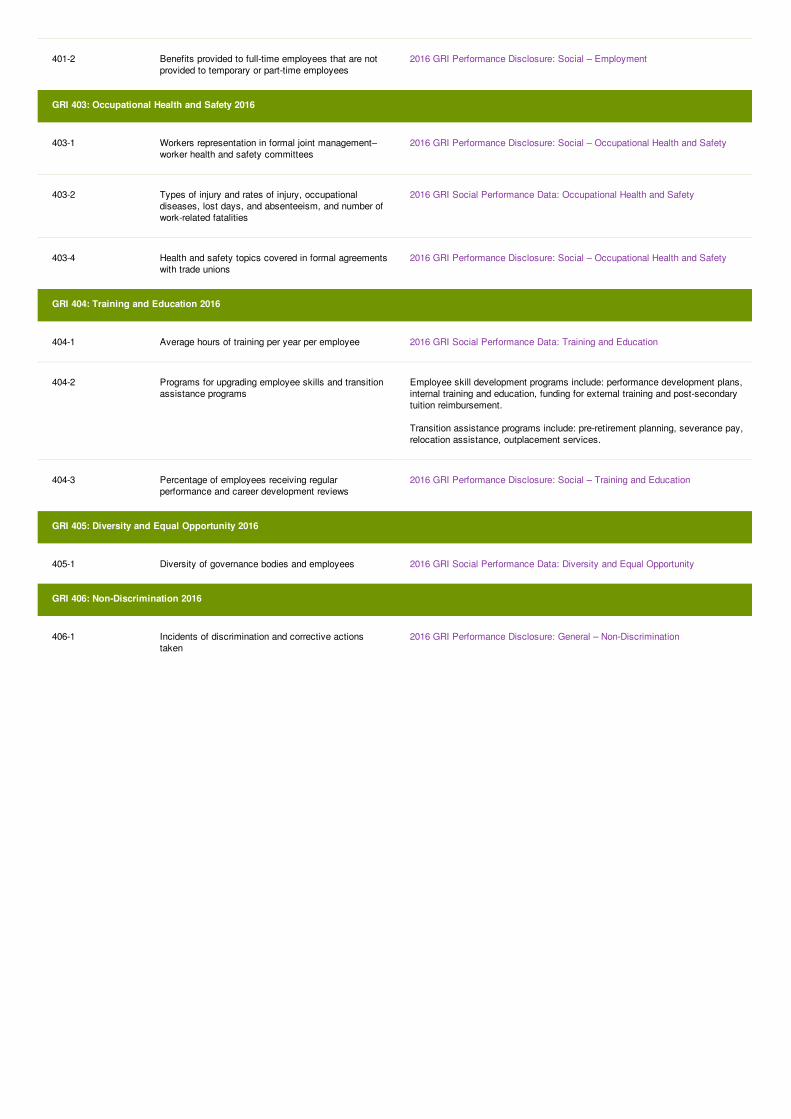
401-2 Benefits provided to full-time employees that are notprovided to temporary or part-time employees
2016 GRI Performance Disclosure: Social – Employment
GRI 403: Occupational Health and Safety 2016
403-1 Workers representation in formal joint management–worker health and safety committees
2016 GRI Performance Disclosure: Social – Occupational Health and Safety
403-2 Types of injury and rates of injury, occupationaldiseases, lost days, and absenteeism, and number ofwork-related fatalities
2016 GRI Social Performance Data: Occupational Health and Safety
403-4 Health and safety topics covered in formal agreementswith trade unions
2016 GRI Performance Disclosure: Social – Occupational Health and Safety
GRI 404: Training and Education 2016
404-1 Average hours of training per year per employee 2016 GRI Social Performance Data: Training and Education
404-2 Programs for upgrading employee skills and transitionassistance programs
Employee skill development programs include: performance development plans,internal training and education, funding for external training and post-secondarytuition reimbursement.
Transition assistance programs include: pre-retirement planning, severance pay,relocation assistance, outplacement services.
404-3 Percentage of employees receiving regularperformance and career development reviews
2016 GRI Performance Disclosure: Social – Training and Education
GRI 405: Diversity and Equal Opportunity 2016
405-1 Diversity of governance bodies and employees 2016 GRI Social Performance Data: Diversity and Equal Opportunity
GRI 406: Non-Discrimination 2016
406-1 Incidents of discrimination and corrective actionstaken
2016 GRI Performance Disclosure: General – Non-Discrimination
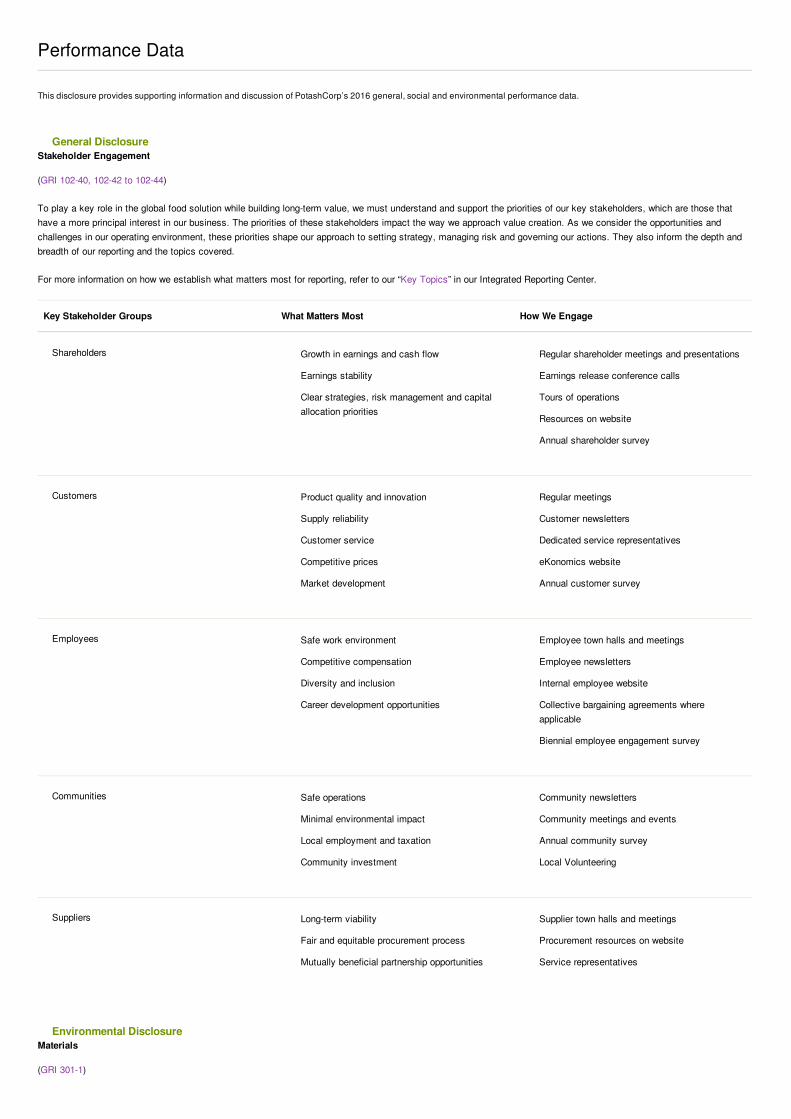
Performance Data
This disclosure provides supporting information and discussion of PotashCorp’s 2016 general, social and environmental performance data.
Stakeholder Engagement
(GRI 102-40, 102-42 to 102-44)
To play a key role in the global food solution while building long-term value, we must understand and support the priorities of our key stakeholders, which are those thathave a more principal interest in our business. The priorities of these stakeholders impact the way we approach value creation. As we consider the opportunities andchallenges in our operating environment, these priorities shape our approach to setting strategy, managing risk and governing our actions. They also inform the depth andbreadth of our reporting and the topics covered.
For more information on how we establish what matters most for reporting, refer to our “Key Topics” in our Integrated Reporting Center.
Key Stakeholder Groups What Matters Most How We Engage
Shareholders Growth in earnings and cash flow
Earnings stability
Clear strategies, risk management and capitalallocation priorities
Regular shareholder meetings and presentations
Earnings release conference calls
Tours of operations
Resources on website
Annual shareholder survey
Customers Product quality and innovation
Supply reliability
Customer service
Competitive prices
Market development
Regular meetings
Customer newsletters
Dedicated service representatives
eKonomics website
Annual customer survey
Employees Safe work environment
Competitive compensation
Diversity and inclusion
Career development opportunities
Employee town halls and meetings
Employee newsletters
Internal employee website
Collective bargaining agreements whereapplicable
Biennial employee engagement survey
Communities Safe operations
Minimal environmental impact
Local employment and taxation
Community investment
Community newsletters
Community meetings and events
Annual community survey
Local Volunteering
Suppliers Long-term viability
Fair and equitable procurement process
Mutually beneficial partnership opportunities
Supplier town halls and meetings
Procurement resources on website
Service representatives
General Disclosure
Materials
(GRI 301-1)
Environmental Disclosure
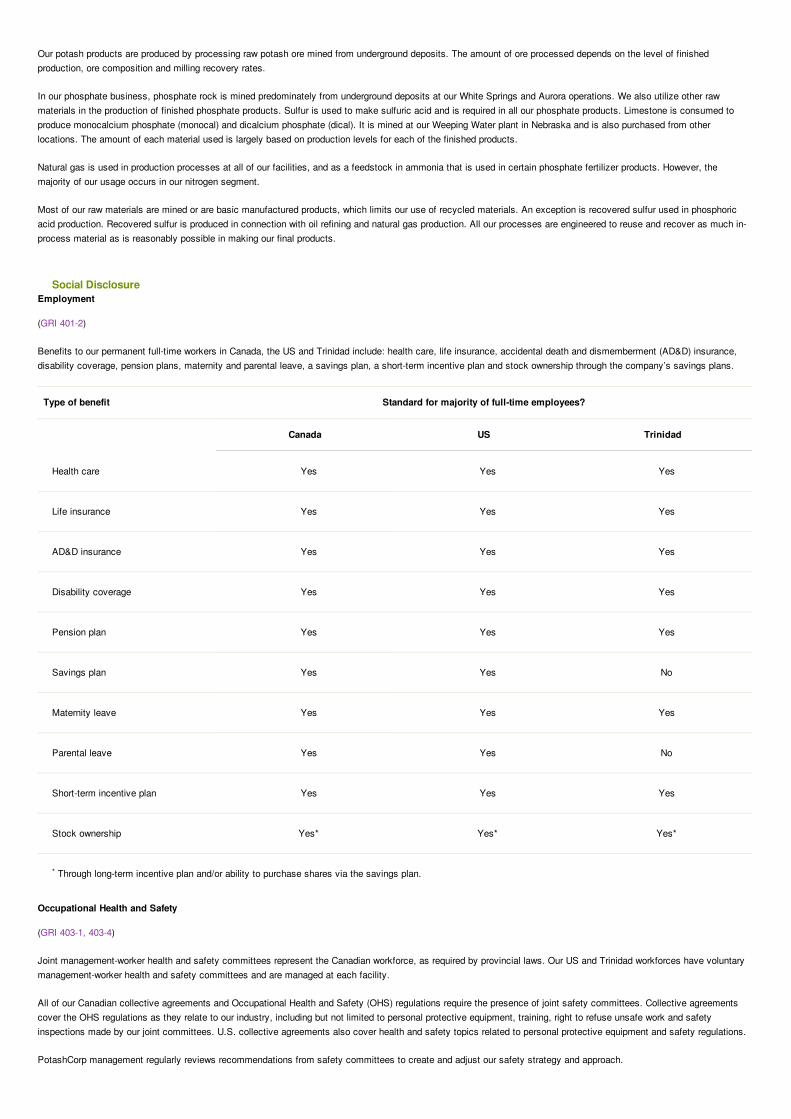
Our potash products are produced by processing raw potash ore mined from underground deposits. The amount of ore processed depends on the level of finishedproduction, ore composition and milling recovery rates.
In our phosphate business, phosphate rock is mined predominately from underground deposits at our White Springs and Aurora operations. We also utilize other rawmaterials in the production of finished phosphate products. Sulfur is used to make sulfuric acid and is required in all our phosphate products. Limestone is consumed toproduce monocalcium phosphate (monocal) and dicalcium phosphate (dical). It is mined at our Weeping Water plant in Nebraska and is also purchased from otherlocations. The amount of each material used is largely based on production levels for each of the finished products.
Natural gas is used in production processes at all of our facilities, and as a feedstock in ammonia that is used in certain phosphate fertilizer products. However, themajority of our usage occurs in our nitrogen segment.
Most of our raw materials are mined or are basic manufactured products, which limits our use of recycled materials. An exception is recovered sulfur used in phosphoricacid production. Recovered sulfur is produced in connection with oil refining and natural gas production. All our processes are engineered to reuse and recover as much in-process material as is reasonably possible in making our final products.
Employment
(GRI 401-2)
Benefits to our permanent full-time workers in Canada, the US and Trinidad include: health care, life insurance, accidental death and dismemberment (AD&D) insurance,disability coverage, pension plans, maternity and parental leave, a savings plan, a short-term incentive plan and stock ownership through the company’s savings plans.
Type of benefit Standard for majority of full-time employees?
Canada US Trinidad
Through long-term incentive plan and/or ability to purchase shares via the savings plan.
Health care Yes Yes Yes
Life insurance Yes Yes Yes
AD&D insurance Yes Yes Yes
Disability coverage Yes Yes Yes
Pension plan Yes Yes Yes
Savings plan Yes Yes No
Maternity leave Yes Yes Yes
Parental leave Yes Yes No
Short-term incentive plan Yes Yes Yes
Stock ownership Yes* Yes* Yes*
Occupational Health and Safety
(GRI 403-1, 403-4)
Joint management-worker health and safety committees represent the Canadian workforce, as required by provincial laws. Our US and Trinidad workforces have voluntarymanagement-worker health and safety committees and are managed at each facility.
All of our Canadian collective agreements and Occupational Health and Safety (OHS) regulations require the presence of joint safety committees. Collective agreementscover the OHS regulations as they relate to our industry, including but not limited to personal protective equipment, training, right to refuse unsafe work and safetyinspections made by our joint committees. U.S. collective agreements also cover health and safety topics related to personal protective equipment and safety regulations.
PotashCorp management regularly reviews recommendations from safety committees to create and adjust our safety strategy and approach.
Social Disclosure
*

Training and Education
(GRI 404-3)
In 2016, PotashCorp implemented a new standardized performance management process at both corporate office locations in which all salaried staff (approximately 12% oftotal employees) participated in the new review process. In 2017, this will be extended to all site locations in which salaried staff across the company will participate in thenew review process, which will be approximately 38% of total employees. Hourly employees may be subject to performance appraisals depending on their site and unionstatus.
Non-Discrimination
(GRI 406-1)
In 2016, PotashCorp investigated eight registered complaints of incidents of discrimination. Two of these complaints were found to be unsubstantiated and no longersubject to action while six were found to be substantiated and have either been remediated or remediation plans are being implemented.
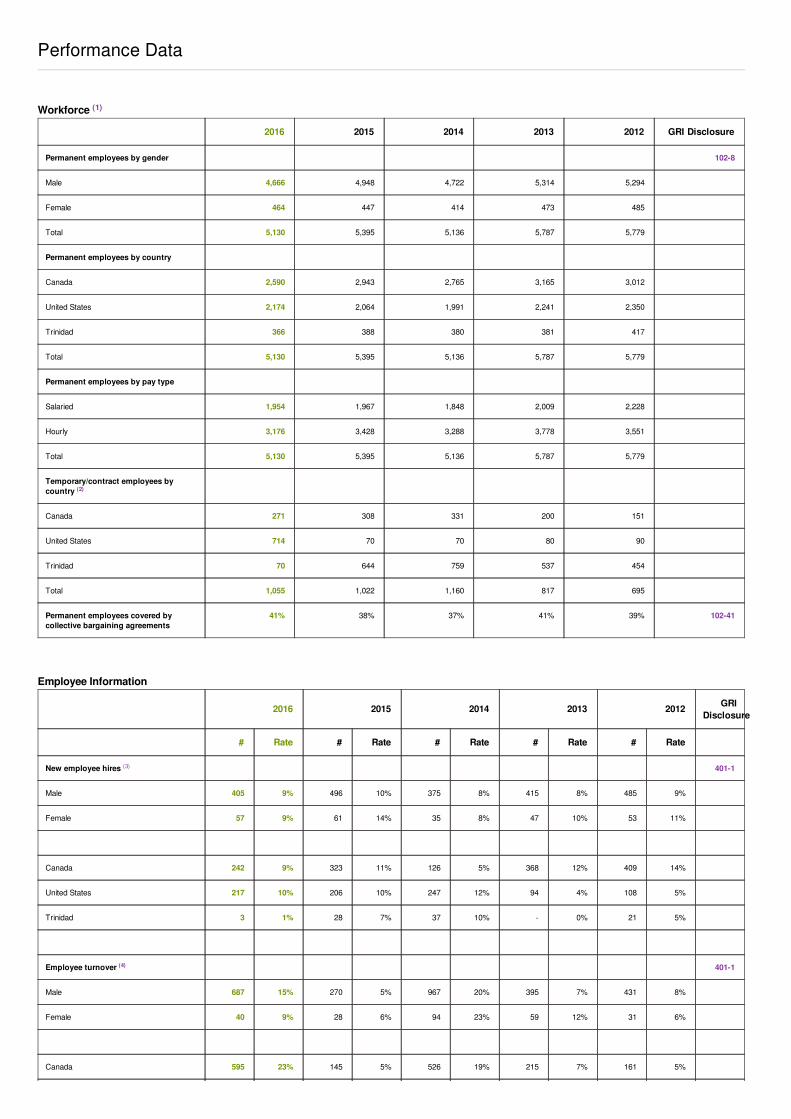
2016 2015 2014 2013 2012 GRI Disclosure
Permanent employees by gender 102-8
Male 4,666 4,948 4,722 5,314 5,294
Female 464 447 414 473 485
Total 5,130 5,395 5,136 5,787 5,779
Permanent employees by country
Canada 2,590 2,943 2,765 3,165 3,012
United States 2,174 2,064 1,991 2,241 2,350
Trinidad 366 388 380 381 417
Total 5,130 5,395 5,136 5,787 5,779
Permanent employees by pay type
Salaried 1,954 1,967 1,848 2,009 2,228
Hourly 3,176 3,428 3,288 3,778 3,551
Total 5,130 5,395 5,136 5,787 5,779
Temporary/contract employees bycountry
Canada 271 308 331 200 151
United States 714 70 70 80 90
Trinidad 70 644 759 537 454
Total 1,055 1,022 1,160 817 695
Permanent employees covered bycollective bargaining agreements
41% 38% 37% 41% 39% 102-41
2016 2015 2014 2013 2012 GRIDisclosure
# Rate # Rate # Rate # Rate # Rate
New employee hires 401-1
Male 405 9% 496 10% 375 8% 415 8% 485 9%
Female 57 9% 61 14% 35 8% 47 10% 53 11%
Canada 242 9% 323 11% 126 5% 368 12% 409 14%
United States 217 10% 206 10% 247 12% 94 4% 108 5%
Trinidad 3 1% 28 7% 37 10% - 0% 21 5%
Employee turnover 401-1
Male 687 15% 270 5% 967 20% 395 7% 431 8%
Female 40 9% 28 6% 94 23% 59 12% 31 6%
Canada 595 23% 145 5% 526 19% 215 7% 161 5%
Performance Data
(2)
(3)
(4)
Workforce (1)
Employee Information
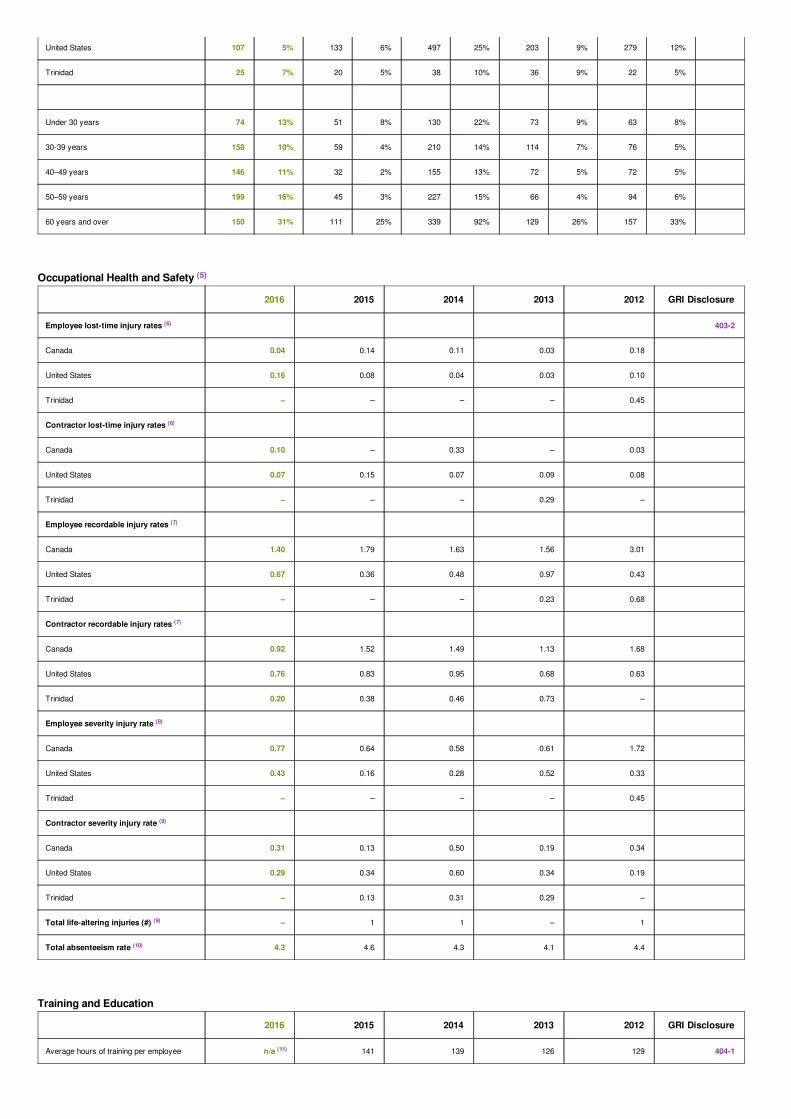
United States 107 5% 133 6% 497 25% 203 9% 279 12%
Trinidad 25 7% 20 5% 38 10% 36 9% 22 5%
Under 30 years 74 13% 51 8% 130 22% 73 9% 63 8%
30-39 years 158 10% 59 4% 210 14% 114 7% 76 5%
40–49 years 146 11% 32 2% 155 13% 72 5% 72 5%
50–59 years 199 16% 45 3% 227 15% 66 4% 94 6%
60 years and over 150 31% 111 25% 339 92% 129 26% 157 33%
2016 2015 2014 2013 2012 GRI Disclosure
Employee lost-time injury rates 403-2
Canada 0.04 0.14 0.11 0.03 0.18
United States 0.16 0.08 0.04 0.03 0.10
Trinidad – – – – 0.45
Contractor lost-time injury rates
Canada 0.10 – 0.33 – 0.03
United States 0.07 0.15 0.07 0.09 0.08
Trinidad – – – 0.29 –
Employee recordable injury rates
Canada 1.40 1.79 1.63 1.56 3.01
United States 0.67 0.36 0.48 0.97 0.43
Trinidad – – – 0.23 0.68
Contractor recordable injury rates
Canada 0.92 1.52 1.49 1.13 1.68
United States 0.76 0.83 0.95 0.68 0.63
Trinidad 0.20 0.38 0.46 0.73 –
Employee severity injury rate
Canada 0.77 0.64 0.58 0.61 1.72
United States 0.43 0.16 0.28 0.52 0.33
Trinidad – – – – 0.45
Contractor severity injury rate
Canada 0.31 0.13 0.50 0.19 0.34
United States 0.29 0.34 0.60 0.34 0.19
Trinidad – 0.13 0.31 0.29 –
Total life-altering injuries (#) – 1 1 – 1
Total absenteeism rate 4.3 4.6 4.3 4.1 4.4
2016 2015 2014 2013 2012 GRI Disclosure
Average hours of training per employee n/a 141 139 126 129 404-1
(6)
(6)
(7)
(7)
(8)
(8)
(9)
(10)
(11)
Occupational Health and Safety (5)
Training and Education
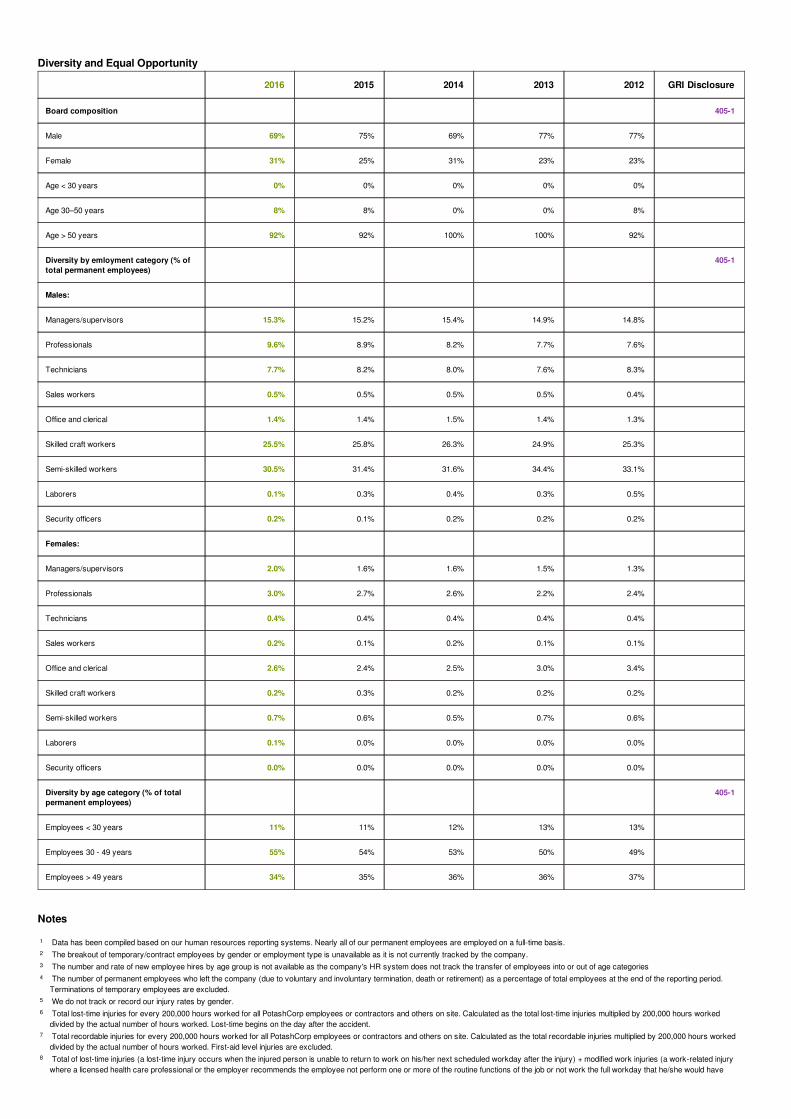
2016 2015 2014 2013 2012 GRI Disclosure
Board composition 405-1
Male 69% 75% 69% 77% 77%
Female 31% 25% 31% 23% 23%
Age < 30 years 0% 0% 0% 0% 0%
Age 30–50 years 8% 8% 0% 0% 8%
Age > 50 years 92% 92% 100% 100% 92%
Diversity by emloyment category (% oftotal permanent employees)
405-1
Males:
Managers/supervisors 15.3% 15.2% 15.4% 14.9% 14.8%
Professionals 9.6% 8.9% 8.2% 7.7% 7.6%
Technicians 7.7% 8.2% 8.0% 7.6% 8.3%
Sales workers 0.5% 0.5% 0.5% 0.5% 0.4%
Office and clerical 1.4% 1.4% 1.5% 1.4% 1.3%
Skilled craft workers 25.5% 25.8% 26.3% 24.9% 25.3%
Semi-skilled workers 30.5% 31.4% 31.6% 34.4% 33.1%
Laborers 0.1% 0.3% 0.4% 0.3% 0.5%
Security officers 0.2% 0.1% 0.2% 0.2% 0.2%
Females:
Managers/supervisors 2.0% 1.6% 1.6% 1.5% 1.3%
Professionals 3.0% 2.7% 2.6% 2.2% 2.4%
Technicians 0.4% 0.4% 0.4% 0.4% 0.4%
Sales workers 0.2% 0.1% 0.2% 0.1% 0.1%
Office and clerical 2.6% 2.4% 2.5% 3.0% 3.4%
Skilled craft workers 0.2% 0.3% 0.2% 0.2% 0.2%
Semi-skilled workers 0.7% 0.6% 0.5% 0.7% 0.6%
Laborers 0.1% 0.0% 0.0% 0.0% 0.0%
Security officers 0.0% 0.0% 0.0% 0.0% 0.0%
Diversity by age category (% of totalpermanent employees)
405-1
Employees < 30 years 11% 11% 12% 13% 13%
Employees 30 - 49 years 55% 54% 53% 50% 49%
Employees > 49 years 34% 35% 36% 36% 37%
Notes
Data has been compiled based on our human resources reporting systems. Nearly all of our permanent employees are employed on a full-time basis.1
The breakout of temporary/contract employees by gender or employment type is unavailable as it is not currently tracked by the company.2
The number and rate of new employee hires by age group is not available as the company's HR system does not track the transfer of employees into or out of age categories3
The number of permanent employees who left the company (due to voluntary and involuntary termination, death or retirement) as a percentage of total employees at the end of the reporting period.Terminations of temporary employees are excluded.
4
We do not track or record our injury rates by gender.5
Total lost-time injuries for every 200,000 hours worked for all PotashCorp employees or contractors and others on site. Calculated as the total lost-time injuries multiplied by 200,000 hours workeddivided by the actual number of hours worked. Lost-time begins on the day after the accident.
6
Total recordable injuries for every 200,000 hours worked for all PotashCorp employees or contractors and others on site. Calculated as the total recordable injuries multiplied by 200,000 hours workeddivided by the actual number of hours worked. First-aid level injuries are excluded.
7
Total of lost-time injuries (a lost-time injury occurs when the injured person is unable to return to work on his/her next scheduled workday after the injury) + modified work injuries (a work-related injurywhere a licensed health care professional or the employer recommends the employee not perform one or more of the routine functions of the job or not work the full workday that he/she would have
8
Diversity and Equal Opportunity

otherwise worked) for every 200,000 hours worked for all PotashCorp employees or contractors and others on site. Defined as a fatality or a work related injury severe enough to substantially change an employee's normal life function and/or result in the employee being placed on long-term disability, making theemployee unable to perform his or her duties.
9
Company-wide weighted average and includes hourly employees at our operations.10
In 2016, we designed a new talent management system which will more accurately track and capture training hours for all permanent salaried staff and hourly employees including by gender andemployee category beginning in 2017. As a result of the transition to the new system, we have not tracked average training hours by gender or category for 2016.
11
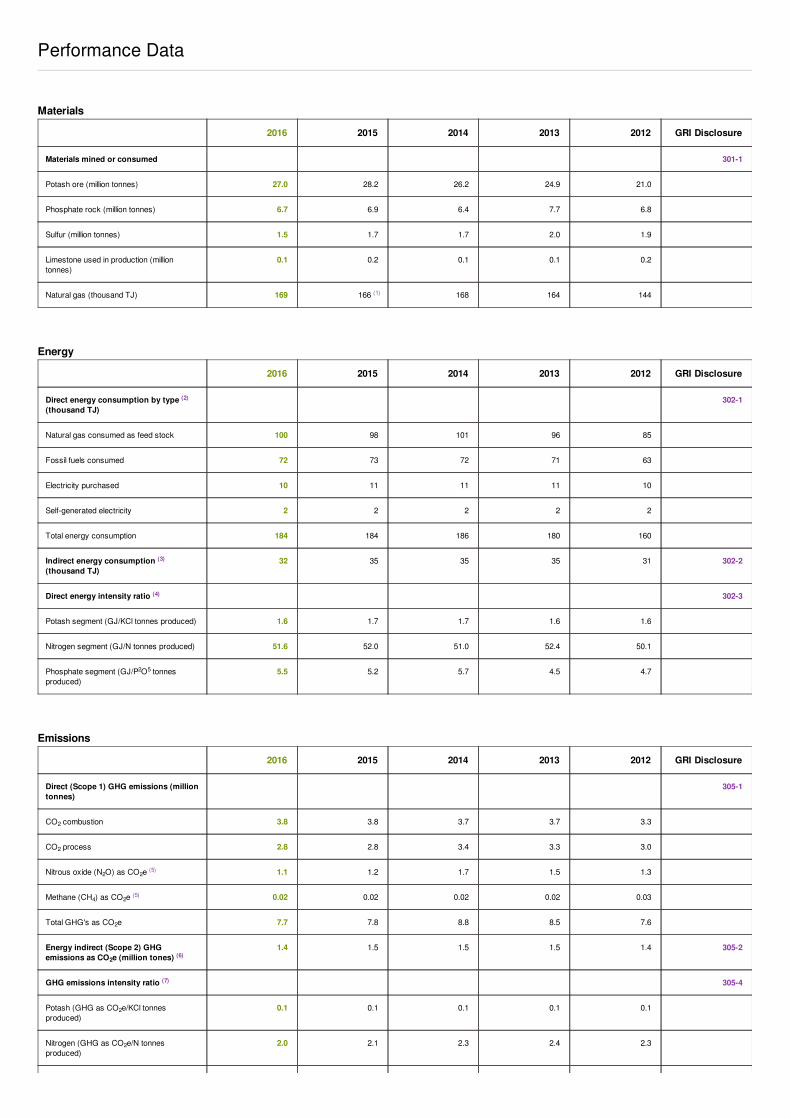
2016 2015 2014 2013 2012 GRI Disclosure
Materials mined or consumed 301-1
Potash ore (million tonnes) 27.0 28.2 26.2 24.9 21.0
Phosphate rock (million tonnes) 6.7 6.9 6.4 7.7 6.8
Sulfur (million tonnes) 1.5 1.7 1.7 2.0 1.9
Limestone used in production (milliontonnes)
0.1 0.2 0.1 0.1 0.2
Natural gas (thousand TJ) 169 166 168 164 144
2016 2015 2014 2013 2012 GRI Disclosure
Direct energy consumption by type (thousand TJ)
302-1
Natural gas consumed as feed stock 100 98 101 96 85
Fossil fuels consumed 72 73 72 71 63
Electricity purchased 10 11 11 11 10
Self-generated electricity 2 2 2 2 2
Total energy consumption 184 184 186 180 160
Indirect energy consumption (thousand TJ)
32 35 35 35 31 302-2
Direct energy intensity ratio 302-3
Potash segment (GJ/KCl tonnes produced) 1.6 1.7 1.7 1.6 1.6
Nitrogen segment (GJ/N tonnes produced) 51.6 52.0 51.0 52.4 50.1
Phosphate segment (GJ/P O tonnesproduced)
5.5 5.2 5.7 4.5 4.7
2016 2015 2014 2013 2012 GRI Disclosure
Direct (Scope 1) GHG emissions (milliontonnes)
305-1
CO combustion 3.8 3.8 3.7 3.7 3.3
CO process 2.8 2.8 3.4 3.3 3.0
Nitrous oxide (N O) as CO e 1.1 1.2 1.7 1.5 1.3
Methane (CH ) as CO e 0.02 0.02 0.02 0.02 0.03
Total GHG's as CO e 7.7 7.8 8.8 8.5 7.6
Energy indirect (Scope 2) GHGemissions as CO e (million tones)
1.4 1.5 1.5 1.5 1.4 305-2
GHG emissions intensity ratio 305-4
Potash (GHG as CO e/KCl tonnesproduced)
0.1 0.1 0.1 0.1 0.1
Nitrogen (GHG as CO e/N tonnesproduced)
2.0 2.1 2.3 2.4 2.3
Performance Data
(1)
(2)
(3)
(4)
2 5
2
2
2 2(5)
4 2(5)
2
2(6)
(7)
2
2
Materials
Energy
Emissions
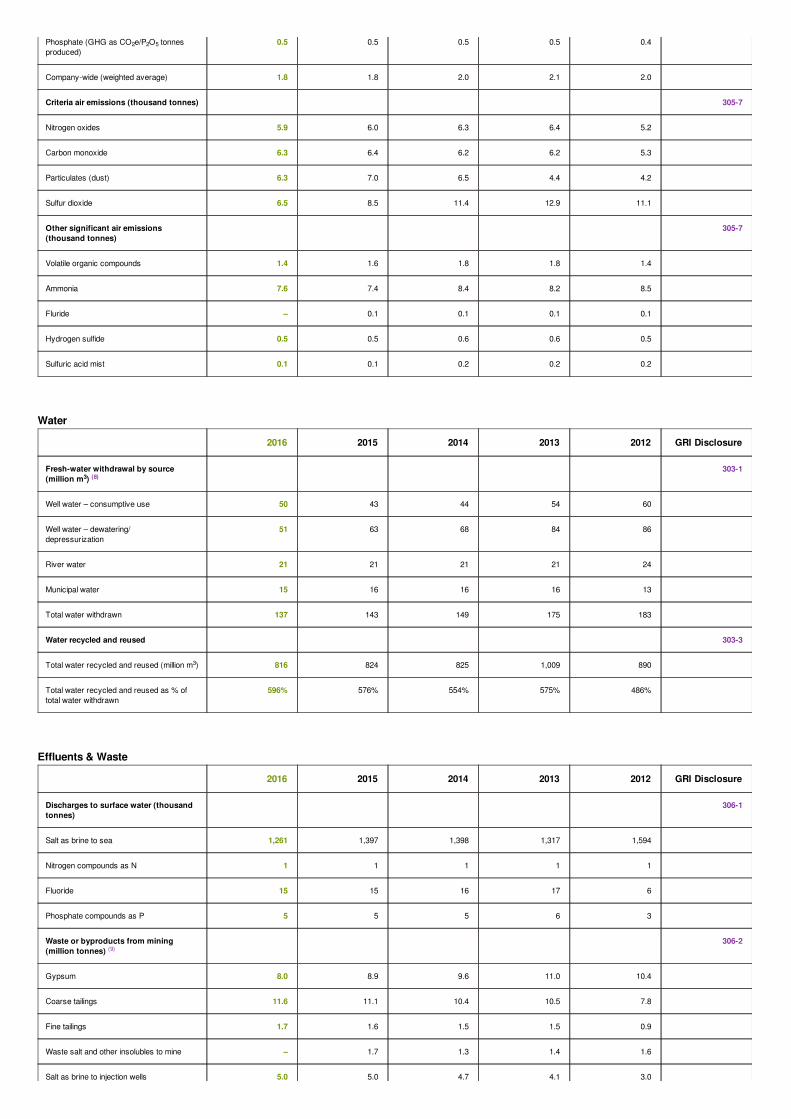
Phosphate (GHG as CO e/P O tonnesproduced)
0.5 0.5 0.5 0.5 0.4
Company-wide (weighted average) 1.8 1.8 2.0 2.1 2.0
Criteria air emissions (thousand tonnes) 305-7
Nitrogen oxides 5.9 6.0 6.3 6.4 5.2
Carbon monoxide 6.3 6.4 6.2 6.2 5.3
Particulates (dust) 6.3 7.0 6.5 4.4 4.2
Sulfur dioxide 6.5 8.5 11.4 12.9 11.1
Other significant air emissions(thousand tonnes)
305-7
Volatile organic compounds 1.4 1.6 1.8 1.8 1.4
Ammonia 7.6 7.4 8.4 8.2 8.5
Fluride – 0.1 0.1 0.1 0.1
Hydrogen sulfide 0.5 0.5 0.6 0.6 0.5
Sulfuric acid mist 0.1 0.1 0.2 0.2 0.2
2016 2015 2014 2013 2012 GRI Disclosure
Fresh-water withdrawal by source(million m )
303-1
Well water – consumptive use 50 43 44 54 60
Well water – dewatering/depressurization
51 63 68 84 86
River water 21 21 21 21 24
Municipal water 15 16 16 16 13
Total water withdrawn 137 143 149 175 183
Water recycled and reused 303-3
Total water recycled and reused (million m ) 816 824 825 1,009 890
Total water recycled and reused as % oftotal water withdrawn
596% 576% 554% 575% 486%
2016 2015 2014 2013 2012 GRI Disclosure
Discharges to surface water (thousandtonnes)
306-1
Salt as brine to sea 1,261 1,397 1,398 1,317 1,594
Nitrogen compounds as N 1 1 1 1 1
Fluoride 15 15 16 17 6
Phosphate compounds as P 5 5 5 6 3
Waste or byproducts from mining(million tonnes)
306-2
Gypsum 8.0 8.9 9.6 11.0 10.4
Coarse tailings 11.6 11.1 10.4 10.5 7.8
Fine tailings 1.7 1.6 1.5 1.5 0.9
Waste salt and other insolubles to mine – 1.7 1.3 1.4 1.6
Salt as brine to injection wells 5.0 5.0 4.7 4.1 3.0
2 2 5
3 (8)
3
(9)
Water
Effluents & Waste
Salt as brine to injection wells 5.0 5.0 4.7 4.1 3.0
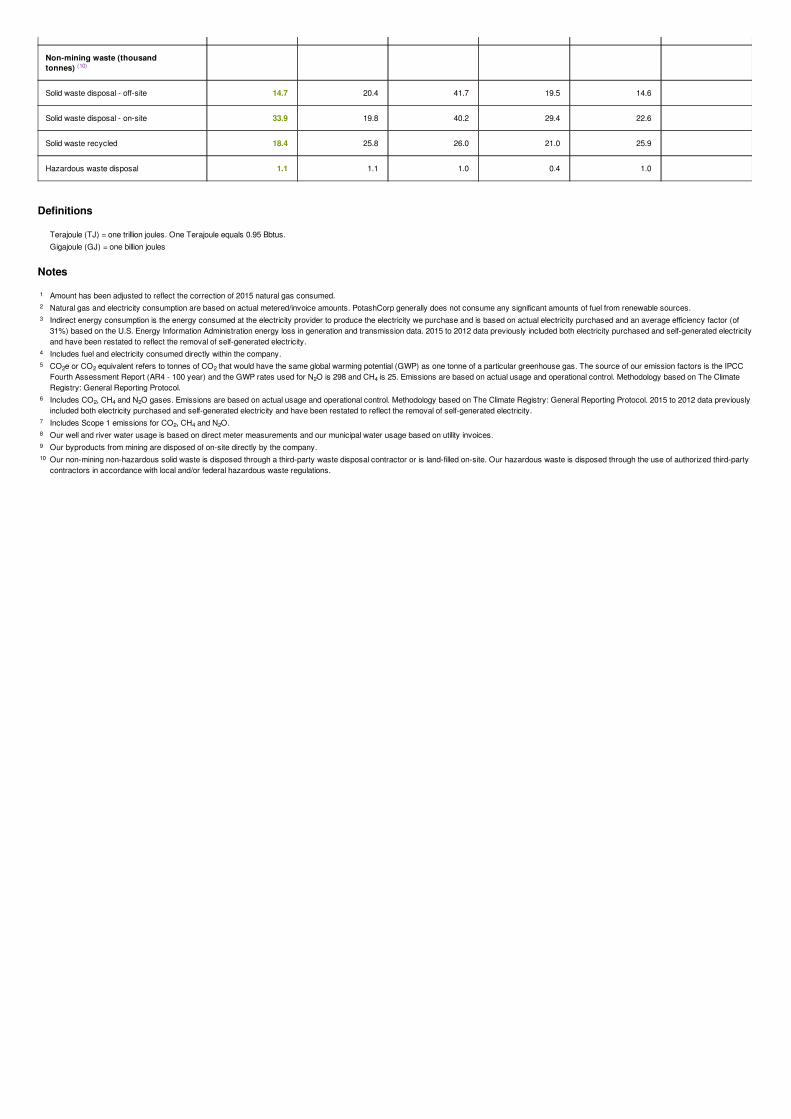
Non-mining waste (thousandtonnes)
Solid waste disposal - off-site 14.7 20.4 41.7 19.5 14.6
Solid waste disposal - on-site 33.9 19.8 40.2 29.4 22.6
Solid waste recycled 18.4 25.8 26.0 21.0 25.9
Hazardous waste disposal 1.1 1.1 1.0 0.4 1.0
Definitions
Notes
(10)
Terajoule (TJ) = one trillion joules. One Terajoule equals 0.95 Bbtus.Gigajoule (GJ) = one billion joules
Amount has been adjusted to reflect the correction of 2015 natural gas consumed.1
Natural gas and electricity consumption are based on actual metered/invoice amounts. PotashCorp generally does not consume any significant amounts of fuel from renewable sources.2
Indirect energy consumption is the energy consumed at the electricity provider to produce the electricity we purchase and is based on actual electricity purchased and an average efficiency factor (of31%) based on the U.S. Energy Information Administration energy loss in generation and transmission data. 2015 to 2012 data previously included both electricity purchased and self-generated electricityand have been restated to reflect the removal of self-generated electricity.
3
Includes fuel and electricity consumed directly within the company.4
CO e or CO equivalent refers to tonnes of CO that would have the same global warming potential (GWP) as one tonne of a particular greenhouse gas. The source of our emission factors is the IPCCFourth Assessment Report (AR4 - 100 year) and the GWP rates used for N O is 298 and CH is 25. Emissions are based on actual usage and operational control. Methodology based on The ClimateRegistry: General Reporting Protocol.
52 2 2
2 4
Includes CO , CH and N O gases. Emissions are based on actual usage and operational control. Methodology based on The Climate Registry: General Reporting Protocol. 2015 to 2012 data previouslyincluded both electricity purchased and self-generated electricity and have been restated to reflect the removal of self-generated electricity.
62 4 2
Includes Scope 1 emissions for CO , CH and N O.72 4 2
Our well and river water usage is based on direct meter measurements and our municipal water usage based on utility invoices.8
Our byproducts from mining are disposed of on-site directly by the company.9
Our non-mining non-hazardous solid waste is disposed through a third-party waste disposal contractor or is land-filled on-site. Our hazardous waste is disposed through the use of authorized third-partycontractors in accordance with local and/or federal hazardous waste regulations.
10
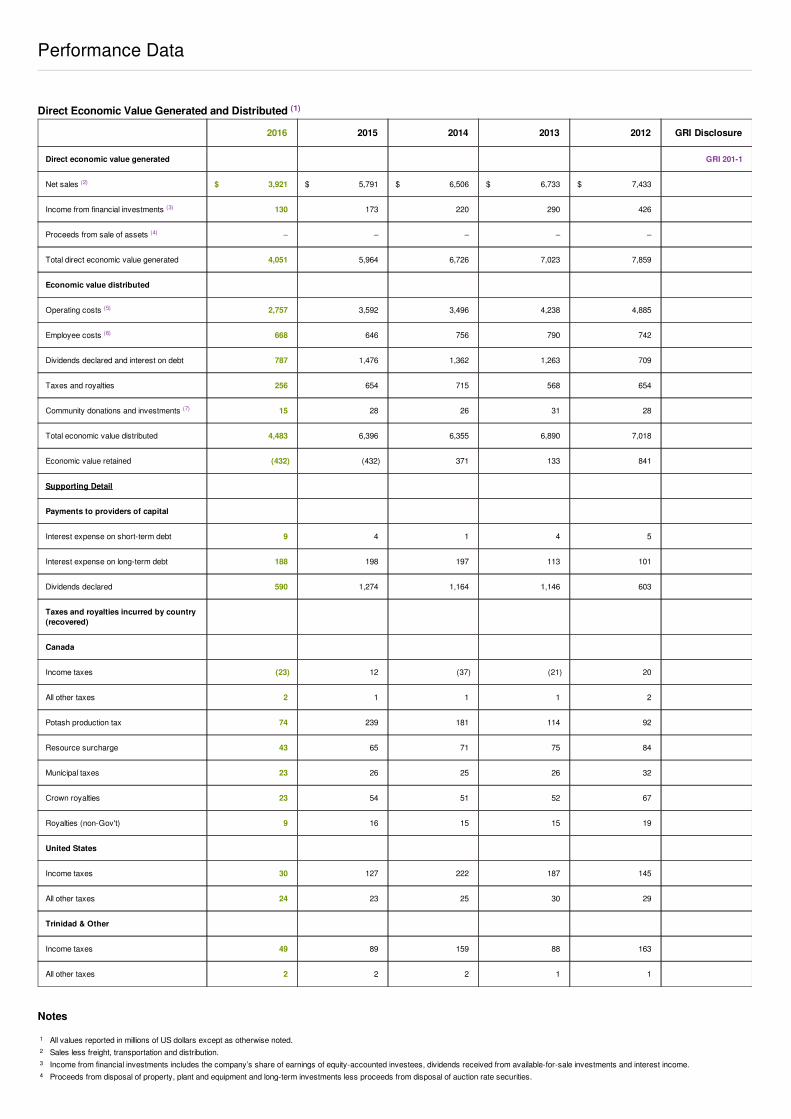
$ 3,921 $ 5,791 $ 6,506 $ 6,733 $ 7,433
2016 2015 2014 2013 2012 GRI Disclosure
Direct economic value generated GRI 201-1
Net sales
Income from financial investments 130 173 220 290 426
Proceeds from sale of assets – – – – –
Total direct economic value generated 4,051 5,964 6,726 7,023 7,859
Economic value distributed
Operating costs 2,757 3,592 3,496 4,238 4,885
Employee costs 668 646 756 790 742
Dividends declared and interest on debt 787 1,476 1,362 1,263 709
Taxes and royalties 256 654 715 568 654
Community donations and investments 15 28 26 31 28
Total economic value distributed 4,483 6,396 6,355 6,890 7,018
Economic value retained (432) (432) 371 133 841
Supporting Detail
Payments to providers of capital
Interest expense on short-term debt 9 4 1 4 5
Interest expense on long-term debt 188 198 197 113 101
Dividends declared 590 1,274 1,164 1,146 603
Taxes and royalties incurred by country(recovered)
Canada
Income taxes (23) 12 (37) (21) 20
All other taxes 2 1 1 1 2
Potash production tax 74 239 181 114 92
Resource surcharge 43 65 71 75 84
Municipal taxes 23 26 25 26 32
Crown royalties 23 54 51 52 67
Royalties (non-Gov't) 9 16 15 15 19
United States
Income taxes 30 127 222 187 145
All other taxes 24 23 25 30 29
Trinidad & Other
Income taxes 49 89 159 88 163
All other taxes 2 2 2 1 1
Performance Data
Notes
(2)
(3)
(4)
(5)
(6)
(7)
All values reported in millions of US dollars except as otherwise noted.1
Sales less freight, transportation and distribution.2
Income from financial investments includes the company’s share of earnings of equity-accounted investees, dividends received from available-for-sale investments and interest income.3
Proceeds from disposal of property, plant and equipment and long-term investments less proceeds from disposal of auction rate securities.4
Direct Economic Value Generated and Distributed (1)

Proceeds from disposal of property, plant and equipment and long-term investments less proceeds from disposal of auction rate securities.Includes cost of goods sold, selling and administrative expenses and cash outflows for additions to property, plant and equipment less employee costs, depreciation and amortization and taxes includedin cost of goods sold. 2015 operating costs have been restated to reflect the reclassification of certain costs to align to the operating cost definition.
5
Includes employee wages, benefits and share-based compensation.6
Community investment = cash disbursements + matching of employee gifts and in-kind contributions of equipment, goods, services and employee volunteerism (on corporate time).7