greensdn: energy efficiency in software defined … · 2016. 9. 22. · ictinformation and...
TRANSCRIPT

BRUNO BASTOS RODRIGUES
GREENSDN: ENERGY EFFICIENCY INSOFTWARE DEFINED NETWORKS
Dissertação apresentada à Escola Politéc-
nica da Universidade de São Paulo para
obtenção do Título de Mestre em Ciências.
São Paulo2016

BRUNO BASTOS RODRIGUES
GREENSDN: ENERGY EFFICIENCY INSOFTWARE DEFINED NETWORKS
Dissertação apresentada à Escola Politéc-
nica da Universidade de São Paulo para
obtenção do Título de Mestre em Ciências.
Área de Concentração:
Engenharia de Computação
Orientador:
Profa. Dra. Tereza C. M. B. Carvalho
São Paulo2016

Este exemplar foi revisado e alterado em relação à versão original, sob respon-sabilidade única do autor e com a anuência de seu orientador.
São Paulo, 24 de Agosto de 2016.
Assinatura do autor
Assinatura do orientador
FICHA CATALOGRÁFICA
Rodrigues, Bruno BGreenSDN: Energy E�ciency in Software De�ned Networks/ Bruno
Bastos Rodrigues. � ed. rev. � São Paulo, 2016.114 p.
Dissertação (Mestrado) � Escola Politécnica da Universidade de SãoPaulo. Departamento de Engenharia de Computação e Sistemas Digitais(PCS).
1. Redes de Computadores #1. 2. Redes De�nidas por Software#2. 3. E�ciência Energética #3. 4. Gerência de Redes #4. 5. Testbeds#5 I. Universidade de São Paulo. Escola Politécnica. Departamento deEngenharia de Computação e Sistemas Digitais (PCS). II. t.

Acknowledgments
First of all, I would like to thank God for being able to do what I love.
Thanks to my advisor, Prof. Dr. Tereza Cristina Melo de Brito Carvalho,
for the opportunity to undertake the mastering program and for all her support
during the development of this work. Also, I would like to thank my previous su-
pervisor, Prof. Dr. Charles Christian Miers, for his guidance and help during my
Bachelor's program and for his useful suggestions towards my mastering develop-
ment. To Dr. Catalin Meirosu for all his valuable tips and technical contributions
all along my master's program.
I would like to express my gratitude to everyone at LASSU (Laboratory of
Sustainability), LARC (Laboratory of Computer Networks and Architecture) and
Ericsson Research Sweden, who contributed with technical support during the
development of this research. Thanks to FDTE (Foundation for the Technological
Development of Engineering) and to Ericsson Brazil for the �nancial support of
this research.
I am heartily thankful to my parents and brothers for their a�ection and
support at all times. Further, to all my family and friends for their continuous
encouragement and understanding.

AGRADECIMENTOS
Primeiramente, gostaria de agradecer a Deus por ser capaz de fazer o queamo.
Obrigado à minha orientadora, Profa. Dr. Tereza Cristina Melo de BritoCarvalho, pela oportunidade de fazer o programa de mestrado e todo suporteoferecido durante o desenvolvimento deste trabalho. Também, gostaria de agra-decer ao meu primeiro orientador, Prof. Dr. Charles Christian Miers, por suaorientação e ajuda durante o bacharelado e suas importantes sugestões para omestrado. Ao Dr. Catalin Meirosu por todas suas valiosas dicas e contribuiçõestécnicas durante o período de mestrado.
Gostaria de expressar minha gratidão à todos colegas do LASSU (Laboratóriode Sustentabilidade), LARC (Laboratório de Arquitetura e Redes de Computa-dores) e Ericsson Research Suécia, que contribuíram com suporte técnico duranteo desenvolvimento desta pesquisa. Obrigado à FDTE (Fundação para o Desen-volvimento Tecnológico de Engenharia) e Ericsson Brasil pelo suporte �nanceirodado à esta pesquisa.
Agradeço de coração aos meus pais e irmãos por sua afeição e suporte durantetodo o tempo. Além disto, para toda minha família e amigos pela compreensãoe encorajamento contínuo.

ABSTRACT
A signi�cant number of protocols and capabilities have been proposed in re-cent years in response to the demand for reducing the amount of energy consumedby the network infrastructure. Besides rising economic issues, there is a wides-pread sensitivity to ecological impacts since both energy costs and electrical de-mands are in a upward trend. In this scenario, the development and validation ofenergy saving strategies are a key point of making networks more e�cient. Howe-ver, there is a lack of experimental environments designed speci�cally to emulateand to validate such energy e�ciency solutions. This work proposes an envi-ronment not only supporting the development and discussion of energy-savingsolutions but also management applications considering energy-saving primiti-ves. For this purpose, the environment is built considering the implementationof energy e�ciency capabilities that are representative of each network scope (in-terface, device, and network) in the Mininet environment taking as a basis theSoftware-de�ned Networking (SDN) paradigm. The environment proposed wasevaluated with di�erent experiments by comparing the energy savings obtainedby activating these energy-e�ciency capabilities.
Keywords: Computer Networks, Software-De�ned Networking, Energy-E�ciency, Network Management, Testbed

RESUMO
Um signi�cativo número de protocolos e funcionalidades foram propostos emresposta à crescente demanda de energia por infraestruturas de rede. Além degerar problemas econômicos, existe uma preocupação quanto aos impactos ambi-entais uma vez que maior a demanda por eletricidade, maior o impacto ambientalpara suprir esta demanda. Neste cenário, o desenvolvimento e validação de estra-tégias para economizar energia são um ponto chave para tornar infraestruturasde rede mais e�ciente. No entanto, há uma falta de ambientes desenvolvidosespeci�camente para emular e validar soluções para e�ciência energética. Comeste propósito este trabalho propõe um ambiente capaz de suportar não apenaso desenvolvimento de soluções para tornar redes mais e�cientes energeticamente,como também o desenvolvimento de aplicações de gerenciamento que baseiam-seem primitivas de economia de energia. Para este propósito, o ambiente é cons-truído considerando a implementação de funcionalidades orientadas à e�ciênciaenergética que são representativas para cada escopo de rede (interface, disposi-tivo e rede) no ambiente de emulação Mininet tomando como base o paradigmade redes de�nidas por software. O ambiente proposto foi validade por meio dediferentes experimentos comparando a economia de energia obtida pela ativaçãodestas funcionalidades.
Palavras-chave: Redes de Computadores, Redes De�nidas por Software,E�ciência Energética, Gerência de Redes, Testbed

LIST OF FIGURES
1 Global Emissions from ICT (ERICSSON b, 2014). . . . . . . . . . 18
2 The network infrastructure share in the energy consumption of a
data center. . . . . . . . . . . . . . . . . . . . . . . . . . . . . . . 19
3 Energy-optimization vs no optimization . . . . . . . . . . . . . . . 20
4 Organization and Methodology . . . . . . . . . . . . . . . . . . . 23
5 Taxonomy of Energy E�ciency Approaches for Wired Networks.
Source: (BOLLA et al., 2011) . . . . . . . . . . . . . . . . . . . . 25
6 Taxonomy for Energy E�ciency Approaches. Source: (BIANZINO
et al., 2012) . . . . . . . . . . . . . . . . . . . . . . . . . . . . . . 26
7 Architectural Scope of Energy E�ciency Capabilities . . . . . . . 29
8 Adaptive Link Rate. Source: (GUNARATNE et al., 2008). . . . . 34
9 Arriving jobs (a) without, and (b) with coalescing. Source: (CH-
RISTENSEN et al., 2010). . . . . . . . . . . . . . . . . . . . . . . 36
10 Synchronized Coalescing. Figure from (CHRISTENSEN et al.,
2010). . . . . . . . . . . . . . . . . . . . . . . . . . . . . . . . . . 37
11 SustNMS Architecture. Source: (COSTA et al., 2012). . . . . . . 38
12 SDN Architecture. Source: (ONF, 2013). . . . . . . . . . . . . . . 52
13 SOS orchestration method. Source: (RIEKSTIN et al., 2014) . . . 55
14 High-level view of the GreenSDN architecture and work�ow. . . . 60
15 GreenSDN Architecture (gray related works used in GreenSDN). . 63

16 User's thresholds for QoS and Energy Consumption. . . . . . . . . 65
17 Adaptive polling vs straight polling. . . . . . . . . . . . . . . . . . 67
18 Delay measurement with OpenFlow 1.0. . . . . . . . . . . . . . . 69
19 ALR Emulation Scheme. Parallel links with di�erent forwarding
rate interconnecting each pair of nodes. . . . . . . . . . . . . . . . 74
20 Synchronized Coalescing emulated through power models. . . . . . 76
21 SustNMS architecture adjusted to GreenSDN. . . . . . . . . . . . 78
22 Topology inspired by the RNP. Figure from (RODRIGUES et al.,
2015). . . . . . . . . . . . . . . . . . . . . . . . . . . . . . . . . . 82
23 ALR analytical dual versus single threshold evaluation using 10
and 20 samples . . . . . . . . . . . . . . . . . . . . . . . . . . . . 84
24 ALR analytical dual versus single threshold evaluation using 40
and 80 samples . . . . . . . . . . . . . . . . . . . . . . . . . . . . 85
25 SC threshold evaluation using workload F(x) = 3x+4 in which x
is a random number between -1 and 1. . . . . . . . . . . . . . . . 86
26 Energy consumed by energy e�ciency capabilities and a baseline
scenario (active nodes in standard mode of operation). Two �ows
sending 10 Mbps. . . . . . . . . . . . . . . . . . . . . . . . . . . . 88
27 Energy consumed by energy e�ciency capabilities and a baseline
scenario. Two �ows sending 30 Mbps. . . . . . . . . . . . . . . . . 88
28 Energy consumption of capabilities orchestrated by SOS. . . . . . 90
29 GreenSDN Topology Viewer. SustNMS-S + ALR (left) and
SustNMS-P (right). . . . . . . . . . . . . . . . . . . . . . . . . . . 90

30 Scenarios A and B, and capabilities selected by SOS. Scenario A
(left) with users sharing the same path. Scenario B (right) users
in distinct paths. . . . . . . . . . . . . . . . . . . . . . . . . . . . 91
31 Energy consumed by users in scenarios A and B. . . . . . . . . . . 92
32 QoS Statistics for Scenarios A and B. . . . . . . . . . . . . . . . . 93

LIST OF TABLES
1 Energy E�ciency Capabilities Classi�cation . . . . . . . . . . . . 31
2 Capabilities of the GreenSDN. . . . . . . . . . . . . . . . . . . . . 40
3 Comparison of well-known network experimentation platforms
across di�erent dimensions. . . . . . . . . . . . . . . . . . . . . . . 45
4 Comparison between SDN Controllers. Source: (BARROS et al.,
2015) . . . . . . . . . . . . . . . . . . . . . . . . . . . . . . . . . . 53
5 Table of Users Requirements. . . . . . . . . . . . . . . . . . . . . 64
6 Estimated impact of ALR transitions on latency. . . . . . . . . . . 85
7 Estimated impact of SC transitions on latency. . . . . . . . . . . . 87
8 Settings of the energy e�ciency capabilities experiment. . . . . . . 87
9 Settings to evaluate the energy consumed and saved by users. . . 91

LIST OF ALGORITHMS
1 Algorithm to calculate the energy consumed and saved by users. . . 73
2 Mechanism to activate or deactivate ALR in a certain port . . . . . 75
3 Synchronized Coalescing simulation through power models. . . . . 77

LIST OF ACRONYMS
ACPI Advanced Con�guration and Power Interface
ALR Adaptive Link Rate
API Application Programming Interface
CAPEX CAPital EXpenses
CARPO Correlation Aware Power Optimization
CLI Command Line Interface
CM Con�guration Manager
CPU Central Processing Unit
DB DataBase
DC Data Center
DE Decision Enforcement
DVFS Dynamic Voltage and Frequency Scaling
FIBRE Future Internet BRazilian Environment for experimentation
GENI Global Environment for Networking Innovations
GHG Green House Gases
GPON Gigabit-capable Passive Optical Networks
GUI Graphical User Interface
GREEN TEGreen Tra�c Engineering
LPI Low-Power Idle

NCP Network Con�guration Parameters
NSP Network Service Provider
MBPS Megabits Per Second
MIB Management Information Base
MIP Mixed Integer Linear Programming
MS MilliSecond
OVS Open vSwitch
OPEX OPerational EXpenses
OSPF Open Shortest Path First
PBNM Policy-Based Network Management
PE Power Enforcement
PBM Policy Based Management
QoS Quality of Service
ICT Information and Communication Technologies
IETF Internet Engineering Task Force
IP Internet Protocol
SDN Software De�ned Networks
SLA Service Level Agreement
SNMP Simple Network Management Protocol
SOHO Small Or Home-O�ce
SOS Sustainability-Oriented System
SC Synchronized Coalescing

TM Topology Manager
USA United States of America
WDM Wavelength Division Multiplexing
XML eXtensible Markup Language

CONTENTS
Acknowledgments . . . . . . . . . . . . . . . . . . . . . . . . . . . . . . ii
1 Introduction 17
1.1 Motivation . . . . . . . . . . . . . . . . . . . . . . . . . . . . . . . 20
1.2 Objective . . . . . . . . . . . . . . . . . . . . . . . . . . . . . . . 22
1.3 Methodology . . . . . . . . . . . . . . . . . . . . . . . . . . . . . 22
1.4 Organization . . . . . . . . . . . . . . . . . . . . . . . . . . . . . 23
2 Energy E�ciency in Wired Networks 24
2.1 Energy E�ciency Approaches . . . . . . . . . . . . . . . . . . . . 24
2.2 Architectural Scope . . . . . . . . . . . . . . . . . . . . . . . . . . 28
2.3 Energy E�ciency Capabilities . . . . . . . . . . . . . . . . . . . . 30
2.3.1 Subsystem scope: Adaptive Link Rate (ALR) . . . . . . . 34
2.3.2 System Scope: Synchronized Coalescing (SC) . . . . . . . 36
2.3.3 Network Scope: SustNMS . . . . . . . . . . . . . . . . . . 38
2.4 Chapter Final Remarks . . . . . . . . . . . . . . . . . . . . . . . . 39
3 Network Environment 41
3.1 Network Platforms . . . . . . . . . . . . . . . . . . . . . . . . . . 41
3.1.1 Testbeds . . . . . . . . . . . . . . . . . . . . . . . . . . . . 46
3.1.2 Simulators . . . . . . . . . . . . . . . . . . . . . . . . . . . 47

3.1.3 Emulators/Simulators . . . . . . . . . . . . . . . . . . . . 48
3.2 Software-De�ned Networking (SDN) . . . . . . . . . . . . . . . . 50
3.3 Sustainability-Oriented System (SOS) . . . . . . . . . . . . . . . . 54
3.4 Chapter Final Remarks . . . . . . . . . . . . . . . . . . . . . . . . 57
4 GreenSDN 59
4.1 Architecture . . . . . . . . . . . . . . . . . . . . . . . . . . . . . . 59
4.2 Full Architecture & Development Details . . . . . . . . . . . . . . 62
4.2.1 Con�guration Parameters . . . . . . . . . . . . . . . . . . 62
4.2.2 Topology Manager . . . . . . . . . . . . . . . . . . . . . . 65
4.2.3 QoS Services . . . . . . . . . . . . . . . . . . . . . . . . . 66
4.2.3.1 Dynamic Polling . . . . . . . . . . . . . . . . . . 66
4.2.3.2 Collecting Per-User QoS Statistics . . . . . . . . 67
4.2.3.3 Delay . . . . . . . . . . . . . . . . . . . . . . . . 68
4.2.3.4 Jitter . . . . . . . . . . . . . . . . . . . . . . . . 69
4.2.3.5 Packet Loss . . . . . . . . . . . . . . . . . . . . . 69
4.2.4 Power Emulation . . . . . . . . . . . . . . . . . . . . . . . 70
4.2.5 Per User Energy Measurement . . . . . . . . . . . . . . . . 71
4.2.6 Energy E�ciency Capabilities . . . . . . . . . . . . . . . . 73
4.2.6.1 Subsystem Scope: Adaptive Link Rate . . . . . . 73
4.2.6.2 System Scope: Synchronized Coalescing . . . . . 76
4.2.6.3 Network Scope: SustNMS . . . . . . . . . . . . . 78

4.3 Chapter Final Remarks . . . . . . . . . . . . . . . . . . . . . . . . 79
5 Experimental Evaluation 81
5.1 Testing Environment . . . . . . . . . . . . . . . . . . . . . . . . . 81
5.2 Energy E�ciency Capabilities . . . . . . . . . . . . . . . . . . . . 82
5.2.1 ALR Threshold Evaluation . . . . . . . . . . . . . . . . . . 83
5.2.2 SC Threshold Evaluation . . . . . . . . . . . . . . . . . . . 86
5.2.3 Individual Evaluation of Capabilities in GreenSDN . . . . 87
5.3 SOS Orchestration of Energy E�ciency Capabilities . . . . . . . . 89
5.4 Per User Energy Consumption and Savings . . . . . . . . . . . . . 91
5.5 Chapter Final Remarks . . . . . . . . . . . . . . . . . . . . . . . . 93
6 Concluding Remarks 96
6.1 Publications . . . . . . . . . . . . . . . . . . . . . . . . . . . . . . 99
6.2 Future Works . . . . . . . . . . . . . . . . . . . . . . . . . . . . . 101
References 104
A The GreenSDN Architecture 110

17
1 INTRODUCTION
Triggered by the increase of broadband and mobile access and a growing
number of new services and experiences such as online gaming and video strea-
ming, the rise in the power demand of data center infrastructures has become a
critical issue for Network Service Providers (NSPs) (BOLLA et al., 2011). Requi-
rements imposed by many services are driving the way data centers are designed,
involving high-performance and high-availability constraints. Besides demanding
power-hungry machines and supporting systems (e.g., cooling) to sustain their
operation, they also rely upon redundant architectures to endure peak loads and
unexpected conditions.
Meeting these requirements incurs not only high CApital and OPerational Ex-
penses (CAPEX and OPEX, respectively) but leads to signi�cant Green House
Gas (GHG)1 emissions. Ericsson presents this scenario in di�erent mobility re-
ports, in which the number of ICT (Information and Communication Technolo-
gies) devices is estimated to increase from 6 billion in 2013 to 12.5 billion devices
in 2020, being one of the main reasons of the growing carbon footprint by ICT.
Figure 1 presents the scenario for ICT �xed and mobile networks (ERICSSON b,
2014).
In 2013, Ericsson estimated the overall carbon footprint of the ICT sector
(�xed, mobile) in about 1.1 million tons by 2020. The scenario presented in 2014
1GHG: gases capable of absorbing infrared radiation, trapping heat in the atmosphere andmaking the Earth warmer.

18
1.4% of global emissions
1.1% of global emissions
20072008200920102011201220132014201520162017201820192020
0
100
200
300
400
500
600
700
800
Fixed ICT Networks
Milliontonnes
CO
2
Data Centers, data transmission and IP coreFixed Networks
Home Devices (�xed phones, CPE)
PCs (all types, excluding tables)
0.5% of global
0.2% of global
20072008200920102011201220132014201520162017201820192020
0
100
200
300
400
500
600
700
800
Mobile ICT Networks
Milliontonnes
CO
2
Data Centers, data transmission and IP coreMobile Access
PCs (all types, excluding tables)
Mobile Devices (including tablets)Connected Devices Scenario
Figure 1: Global Emissions from ICT (ERICSSON b, 2014).
holds this estimation. For �xed ICT networks, the share of GHG emissions is
estimated to be about 1.4% in 2020, and 0.5% for mobile networks, which also
con�rms the previous estimation (about 2%) of the ICT carbon footprint.
As one of the major categories in ICT, the data center power demand inclu-
ding servers, cooling and networking grew 7% from 2012 to 2013, reaching an
annual/yearly electricity consumption of about 350 TWh (COOK et al., 2014).
This amount is predicted to increase 81% by 2020, reaching almost 630 TWh
annually (COOK et al., 2015). Although there is no consensus on how much
the networking infrastructure contributes to the total data center power demand,
studies indicated that the numbers vary between 4% to 33 %. Figure 2 present
the view of the network consumption for many authors.
Even though there is no consensus on the network consumption within the
data center, the average increase over the years is remarkable. The increase is
leveraged mainly due to services such as Net�ix, which accounts for 37% of all
downstream Internet bandwidth in North America in peak periods, and at peak
times when it consumes more bandwidth than YouTube, Amazon, and Hulu2
2A free video streaming website. http://www.hulu.com/

19
96% 4%
(Emerson Eletric, 2009)
88%12%
(Abts et al., 2010)
67%
33%
(Kiliazovich et al., 2010)
91%9%
(Koutitas et al., 2012)
77%
23%
(Kachris, Tomkos, 2013)
80%
20%
(Cook et al., 2014)
Compute, storage, cooling and others
Network
Figure 2: The network infrastructure share in the energy consumption of a datacenter.
combined (ADHIKARI et al., 2012).
In response to the demand for reducing the amount of energy consumed by
networks, several energy e�ciency protocols and capabilities have been propo-
sed. Proposals range from re-engineering of particular chip-level components to
network tra�c consolidation capabilities operating at the network level. Howe-
ver, most projects are designed to run on speci�c network conditions or devices,
which may require an expensive or a large amount of external instrumentation. In
this scenario, there is a gap for testing the behavior of these capabilities without
the deployment of large and expensive dedicated infrastructures. Testing is es-
sential to prove concepts in conditions that approximate the real implementation
by initial explorations based on modeling and simulation/emulation, thus, faci-
litating the introduction of novel approaches or equipment into actual network
deployment.

20
1.1 Motivation
With the high number of connected devices increasing power demand and car-
bon footprint, networking systems are being designed and dimensioned according
to high-performance and high-availability requirements. On the NSP side, this
implies over-provisioning and redundancy of devices and links to endure against
peak load periods. As a result, during times of low network tra�c, the over-
provisioned networks are also over-energy-consuming which create opportunities
to employ energy optimization strategies, as illustrated in Figure 3.
No energy-optimizationPower Supply
T ime
Energy-optimization
t1
Time to Adjust
t2 t3 t4 t5 t6 t7
Power Supply
T ime
LoadPowerSavings
Figure 3: Energy-optimization vs no optimization
Non-optimized scenarios can be found in legacy network infrastructures, in
which the network devices consume an amount of power independently of the
workload, and besides the over-provisioning strategies, it is a common approach
to increase the overall electricity supply at peak times to prevent power outages.
However, in periods of low network tra�c, the adoption of energy optimization
strategies presents opportunities to save energy.
A signi�cant shift in networking research is required to introduce energy-

21
awareness in a controlled manner, without compromising the quality of service
or reliability requirements: adjusting the network capacity to meet current load
requires an adjustment time (t1, t2, ..., t6), putting devices in low energy states or
waking up from a sleeping state. Thus, at unexpected tra�c bursts, any delay to
(re)con�gure the network may compromise the quality of service and reliability
requirements. In this regard, Software De�ned Networks (SDNs) change the way
traditional systems are designed and managed (SEZER et al., 2013), providing
fast adjustments in response to sudden workload variations and better visibi-
lity (decoupling) and control (centralized management) to perform tasks such as
network diagnosis and troubleshooting than in traditional networks.
Simulations can provide insights into how a particular algorithm would per-
form in distinct network conditions. However, a linear combination of emulation
and implementation of major energy e�ciency capabilities can provide a closer
view of what may happen in a real scenario, facilitating the deployment of ex-
perimental features in real environments. While local network platforms allow a
quick development and evaluation of network features and services, a distributed
system platform can provide insight on how a particular feature would operate
in a scalable and distributed scenario, such as the Internet.
For instance, OFELIA (SALSANO et al., 2013), GENI (GENI, ) and Gre-
enStar Network (GSN, 2010) are examples of distributed network platforms that
allows researchers to experiment features in scale. While the �rst two provide
a general-purpose research infrastructure, the latter is designed to deliver cloud-
based ICT services based entirely on renewable energy sources such as solar, wind
and hydroelectricity. As examples of local network platforms, Mininet (LANTZ;
HELLER; MCKEOWN, 2010) and EstiNet (WANG; CHOU; YANG, 2013a) can
emulate a network infrastructure enabling rapid deployment and replication of
experiments (Section 3 provides details on related works).

22
1.2 Objective
The objective of this work is to leverage green networking by providing a
network platform comprising energy e�ciency capabilities implemented at dif-
ferent network scopes, such as network, the system (node-level) and subsys-
tem (chip-level/interfaces). Based on GreenSDN, researchers can develop ma-
nagement techniques and evaluate the impacts of energy e�ciency capabilities
on quality of service (QoS) requirements. Complementary, GreenSDN aims at
providing a fast prototyping and troubleshooting environment to enable fast
(re)con�guration of network experiments.
1.3 Methodology
This work is based on basic and applied research in which the theoretical
background related to the state-of-the-art in energy e�ciency capabilities was
obtained by a qualitative research. The applied research involves the steps rela-
ted to the design and development stages of GreenSDN applying techniques and
concepts related to network and distributed systems. Furthermore, the author
has taken part in correlated projects developed at Lassu (Laboratory of Sus-
tainability). To summarize, the research methodology employed consists in the
following steps:
1. Literature Review and Analysis: involves analyzing of the state of the
art in energy e�ciency capabilities and protocols, network emulation envi-
ronments, and concepts related to software-de�ned networks and network
monitoring.
2. Architecture Proposal: based on the network platform and the require-
ments imposed by energy e�ciency capabilities, it comprises the design of

23
an architecture able to ful�ll our prede�ned objectives and leverage network
management oriented to energy e�ciency;
3. Development: once the architecture is designed, this stage involves de-
veloping and troubleshooting GreenSDN, considering that the development
process reveals conditions not observed in the proposal;
4. Experimental evaluation: aims at evaluating if the proposed goals were
met and reports the bene�ts and related problems of GreenSDN.
1.4 Organization
The core chapters are highlighted in Figure 4. Chapter 2 describes and classi-
�es approaches towards energy e�ciency in wired networks and energy e�ciency
capabilities. Chapter 3 tackles topics related to the network platform choices and
software-de�ned networking.
Methodology
Content
Literature
Review and Analysis
GreenSDN
Design and DevelopmentEvaluation
Chapter 2 Chapter 3 Chapter 4 Chapter 5
Energy
E�ciency
Network
Environment
GreenSDN
Architecture
Development
Details
Experimental
Results
Figure 4: Organization and Methodology
Chapter 4 describes the proposed architecture and provides details on the
development of selected capabilities and core components on the architecture.
Chapter 5 presents the GreenSDN experimental validation. To conclude, Chapter
6 presents the concluding remarks and future works.

24
2 ENERGY EFFICIENCY IN WIRED
NETWORKS
This chapter provides an overview of the di�erent approaches to obtain energy
e�ciency in wired networks to understand how to classify the energy e�ciency ca-
pabilities based on their characteristics and network scope (Section 2.1). Further,
according to pre-de�ned criteria, we outline three representative to be developed
in GreenSDN (Section 2.3) detailing their functioning. Then, we summarize the
chapter providing the �nal remarks.
2.1 Energy E�ciency Approaches
There are di�erent approaches to managing a network focusing on energy
e�ciency. However, the largest part of undertaken approaches is founded on a
few basic concepts, which are usually inspired by energy-saving mechanisms and
power management criteria already available in computing systems (BOLLA et
al., 2011). Among the existing taxonomies to classify energy e�ciency approa-
ches, two main taxonomies are highlighted herein: one presented in Bolla et al.
(2011), and the second in Bianzino et al. (2012). Bolla et al. (2011), presen-
ted a survey of existing approaches for energy e�ciency in wired networks and
Bianzino et al. (2012) developed an overview of green networking research pro-
viding a general view of current methods, comprising both network and compute
resources.

25
Bolla et al. (2011) summarizes existing approaches into three general appro-
aches, including techniques employed at each general approach. The objective is
to classify procedures designed especially for wired networks. The taxonomy is
presented in Figure 5.
Bolla et al.
Re-engineering
Energy-E�cientSilicon
ComplexityReduction
DynamicAdaptation
PerformanceScaling
Idle Logic
SmartSleeping
ProxyingNetworkPresence
Figure 5: Taxonomy of Energy E�ciency Approaches for Wired Networks.Source: (BOLLA et al., 2011)
• Re-engineering: this category aims at designing network elements that
are more energy-e�cient. Specially, it focuses on including new energy
e�cient silicon technology or reducing the complexity to execute embedded
software. This approach is one which can achieve higher energy savings,
however, it is the most challenging regarding innovation;
• Dynamic Adaptation: comprises capabilities that can modulate the
power capacity of internal components (e.g., packet-processing engines and
network interfaces) to meet a load proportional usage. Most of the current
approaches require a hardware interface, either to dynamically scale the
performance or to enforce the idle logic. The idle logic allows reducing the
energy consumption by shutting down, for a time frame, sub-components
when no activities are performed.
• Smart Sleeping: it is similar to the idle logic. However, it enables devices
or parts of them to turn o� almost entirely, entering a very low energy
26
consumption state. As a consequence, once most of its functionalities and
applications are shut down, one cannot maintain network connectivity. In
this regard, smart sleeping techniques consist in transferring the network
presence to another host/device when entering in such deep sleep modes.
This taxonomy focuses on approaches that operate in a single node; not
considering capabilities that require a broad network view, such as green tra�c
engineering methods. However, it is precise to describe the set of techniques that
fall under one of the approaches. For instance, when it represents the di�erence
between idle logic and smart sleeping, in which both present similar behavior, but
one may achieve higher savings by shutting down more internal sub-components.
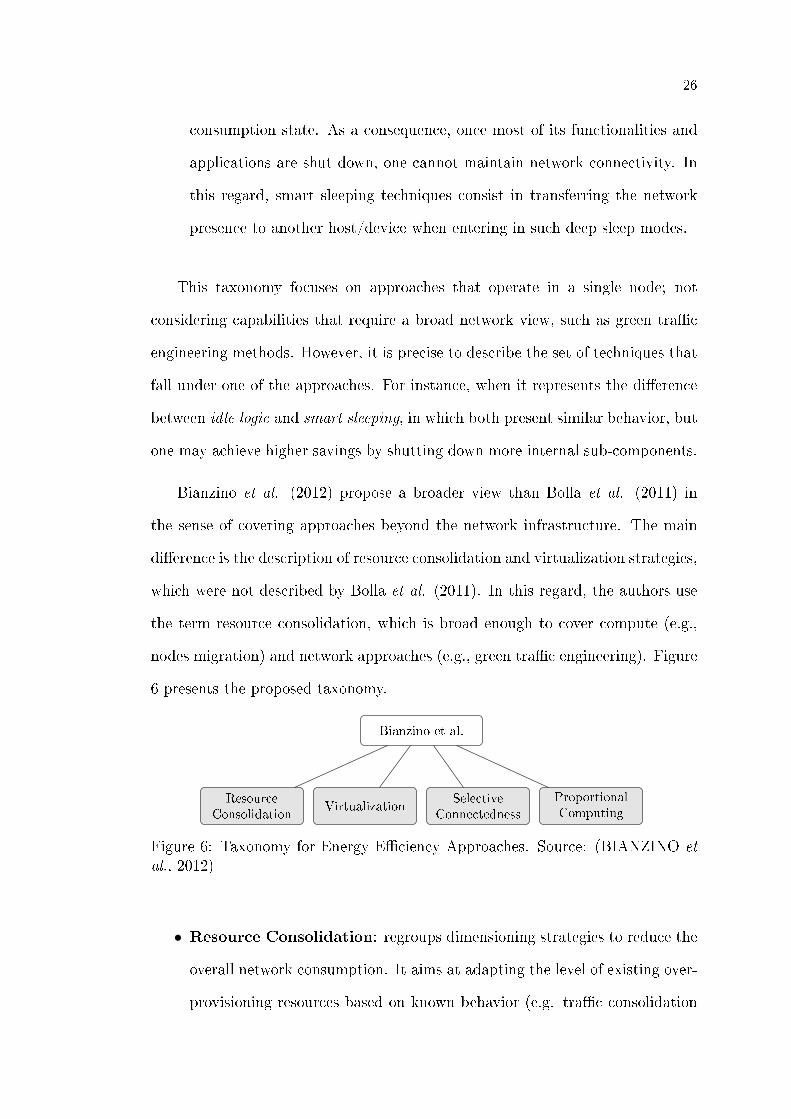
Bianzino et al. (2012) propose a broader view than Bolla et al. (2011) in
the sense of covering approaches beyond the network infrastructure. The main
di�erence is the description of resource consolidation and virtualization strategies,
which were not described by Bolla et al. (2011). In this regard, the authors use
the term resource consolidation, which is broad enough to cover compute (e.g.,
nodes migration) and network approaches (e.g., green tra�c engineering). Figure
6 presents the proposed taxonomy.
Bianzino et al.
ResourceConsolidation
VirtualizationSelective
Connectedness
ProportionalComputing
Figure 6: Taxonomy for Energy E�ciency Approaches. Source: (BIANZINO etal., 2012)
• Resource Consolidation: regroups dimensioning strategies to reduce the
overall network consumption. It aims at adapting the level of existing over-
provisioning resources based on known behavior (e.g. tra�c consolidation

27
based on traces of the network tra�c), dimensioning resources to meet
current tra�c load;
• Virtualization: allows consolidating multiple services to operate on the
same hardware. A typical example of virtualization consists of sharing
servers in data centers, thus reducing hardware, energy, and cooling costs
and improving energy management. In this regard, lightweight/container-
based virtualization such as Docker1 is a trend in hardware virtualization,
removing layers of software and providing a more e�cient usage of hardware
resources;
• Selective Connectedness: it is similar to the smart sleeping technique,
allowing the equipment to go into deep idle states for some time while
proxying its network presence to maintain network connectivity;
• Proportional Computing: is based on the idea of a system consuming
energy in proportion to its utilization. It was �rst proposed by (BARROSO;
HÖLZLE, 2007), and can be applied to a system as a whole, network pro-
tocols, and devices.
The taxonomy proposed by Bianzino et al. (2012) cover approaches that are
either for network or compute resources, being one of the most employed taxo-
nomies in the current state-of-the-art. For instance, Bilal, Khan, Zomaya (2013)
and Garg and Buyya (2012) use this taxonomy to describe their approaches in
the context of green cloud computing.
On one side, Bolla et al. (2011) is more precise about addressing energy e�ci-
ency techniques that are unique to the network infrastructure than Bianzino et al.
(2012), which describes methods involving both network and compute resources.
For instance, Bolla et al. (2011) more throughly describe techniques deployed at
1https://www.docker.com

28
lower network layers (physical and data link), presenting a relatively detailed level
on re-engineering approaches, which is not addressed by Bianzino et al. (2012).
However, Bolla et al. (2011) lacks of approaches to managing the network in a
holistic view, i.e., approaches that administer a set of nodes to consolidate tra�c
into energy e�cient routes given a particular network utilization.
2.2 Architectural Scope
Recognizing energy e�ciency approaches is important to understand how a
given capability operates. Additionally, knowing the architectural scope enable
us to understand where it works. In this regard, rather than just describing
approaches for energy e�ciency, Bianzino et al. (2012) presents a view that
takes the network layer into account. It considers the TCP/IP protocol stack,
in which the solutions can either be implemented as a single layer or require
cross-layer interaction. Also, Bianzino et al. (2012) highlight the infrastructure
scope to describe solutions that advocate a clean state redesign of the network
architecture or incorporate resource consolidation approaches into their routing
protocols.
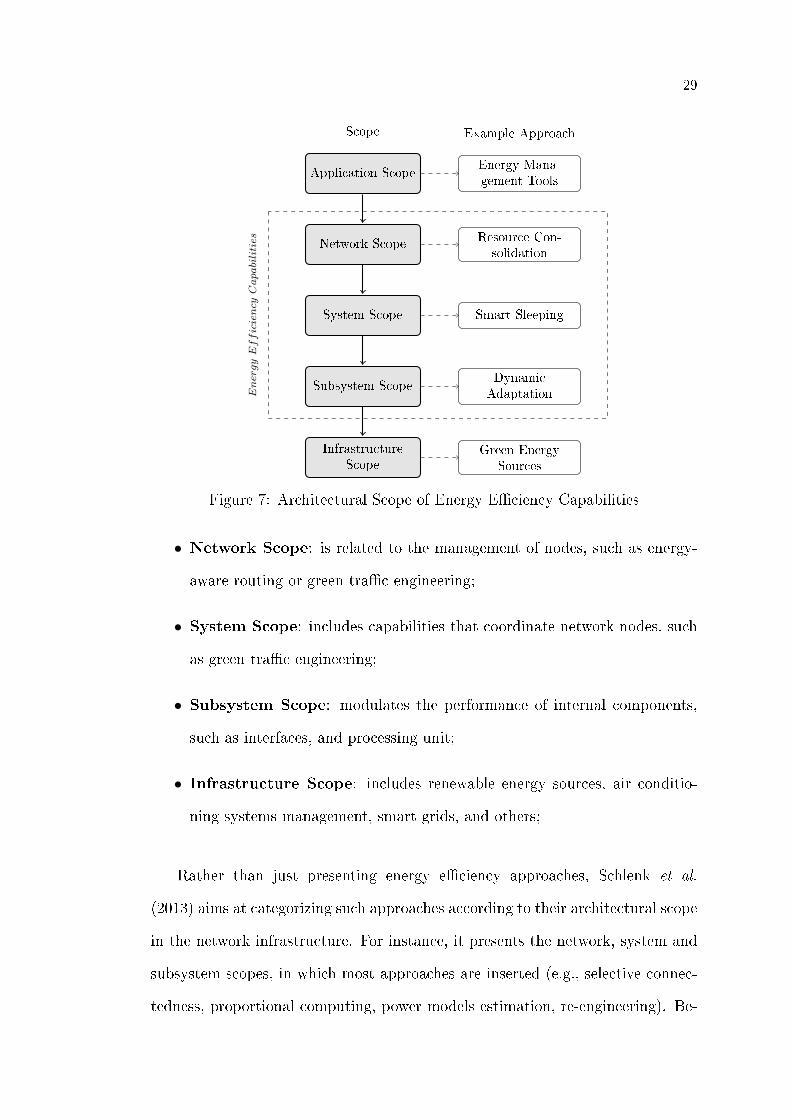
Schlenk et al. (2013) presented a similar classi�cation summarizing the ca-
pabilities by their architectural scope (i.e., describing where the approaches are
deployed using a network architectural view). It takes into account the following
ranges: network, the system (network elements) and subsystems (components of
the elements). The architectural view, including the application and infrastruc-
ture scopes, is illustrated in Figure 7.
• Application Scope: includes research e�orts that incorporate energy-
awareness in the software design, e.g., coordination/orchestration of
network scope capabilities;
29
Application Scope
Network Scope
System Scope
Subsystem Scope
InfrastructureScope
Energy Mana-gement Tools
Resource Con-solidation
Smart Sleeping
DynamicAdaptation
Green EnergySources
EnergyEfficiencyCapabilities
Scope Example Approach
Figure 7: Architectural Scope of Energy E�ciency Capabilities
• Network Scope: is related to the management of nodes, such as energy-
aware routing or green tra�c engineering;
• System Scope: includes capabilities that coordinate network nodes, such
as green tra�c engineering;
• Subsystem Scope: modulates the performance of internal components,
such as interfaces, and processing unit;
• Infrastructure Scope: includes renewable energy sources, air conditio-
ning systems management, smart grids, and others;
Rather than just presenting energy e�ciency approaches, Schlenk et al.
(2013) aims at categorizing such approaches according to their architectural scope
in the network infrastructure. For instance, it presents the network, system and
subsystem scopes, in which most approaches are inserted (e.g., selective connec-
tedness, proportional computing, power models estimation, re-engineering). Be-

30
sides, Bianzino et al. (2012) complement this view by including the application
and infrastructure scopes, which may respectively include, network management
approaches and the usage of green energy sources.
2.3 Energy E�ciency Capabilities
As network platforms may comprise several working modules (e.g., monito-
ring, topology manager) and there are many di�erent capabilities per network
scope we considered selecting one of the following scopes to be implemented:
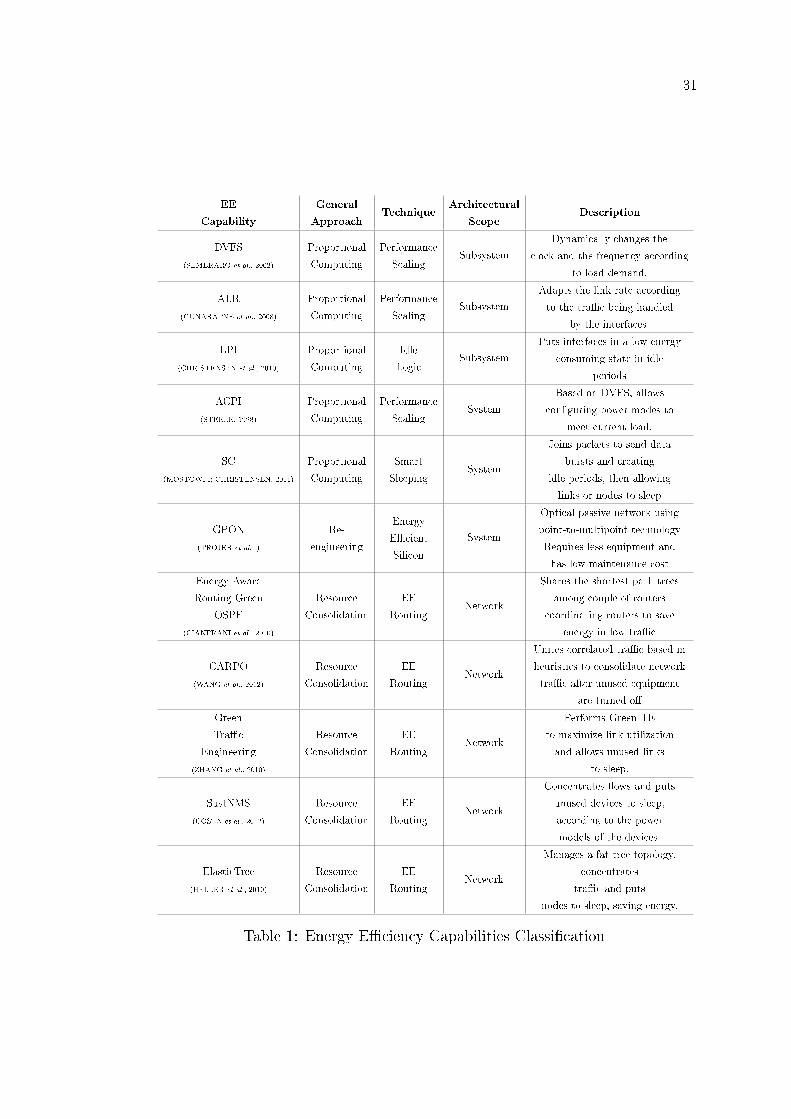
network, system, and subsystem. Furthermore, three most important aspects
were taken into account as criteria to select the capabilities: a) open source code,
b) documentation or related works providing enough information to implement
its logic, c) description of existing energy saving results. Table 1 presents an
overview considering the following aspects: i) general approach and ii) technique
is taken from the approaches' taxonomy; iii) the architectural scope and iv) a
brief description.
Dynamic Voltage and Frequency Scaling (DVFS) (SEMERARO et al., 2002)
take into account that the power consumption of an electronic circuit is propor-
tional to its operating frequency and the square of the voltage. It consists in
intentionally decreasing or increasing the performance of a processor by dynami-
cally changing the frequency and the voltage. Next, the Adaptive Link Rating
(ALR) deals with the underutilization of links dynamically modulating the ca-
pacity of network interfaces by scaling up or down existing Ethernet data rates.
Similarly to DVFS, it employs the performance scaling approach.
Low-Power Idle (LPI) (CHRISTENSEN et al., 2010) is a capability that puts
network interfaces into a lower energy consumption state (subsystem scope) in
periods of low link utilization. It allows for rapid transitions back to the active
31
EE
Capability
General
ApproachTechnique
Architectural
ScopeDescription
DVFS
(SEMERARO et al., 2002)
Proportional
Computing
Performance
ScalingSubsystem
Dynamically changes the
clock and the frequency according
to load demand.
ALR
(GUNARATNE et al., 2008)
Proportional
Computing
Performance
ScalingSubsystem
Adapts the link rate according
to the tra�c being handled
by the interfaces.
LPI
(CHRISTENSEN et al., 2010)
Proportional
Computing
Idle
LogicSubsystem
Puts interfaces in a low energy
consuming state in idle
periods
ACPI
(STEELE, 1998)
Proportional
Computing
Performance
ScalingSystem
Based on DVFS, allows
con�guring power modes to
meet current load.
SC
(MOSTOWFI; CHRISTENSEN, 2011)
Proportional
Computing
Smart
SleepingSystem
Joins packets to send data
bursts and creating
idle periods, then allowing
links or nodes to sleep
GPON
(TROJER et al., )
Re-
engineering
Energy
E�cient
Silicon
System
Optical passive network using
point-to-multipoint technology
Requires less equipment and
has low maintenance cost
Energy-Aware
Routing Green
OSPF
(CIANFRANI et al., 2010)
Resource
Consolidation
EE
RoutingNetwork
Shares the shortest path trees
among couple of routers
coordinating routers to save
energy in low tra�c
CARPO
(WANG et al., 2012)
Resource
Consolidation
EE
RoutingNetwork
Unites correlated tra�c based in
heuristics to consolidate network
tra�c after unused equipment
are turned o�
Green
Tra�c
Engineering
(ZHANG et al., 2010)
Resource
Consolidation
EE
RoutingNetwork
Performs Green TE
to maximize link utilization
and allows unused links
to sleep.
SustNMS
(COSTA et al., 2012)
Resource
Consolidation
EE
RoutingNetwork
Concentrates �ows and puts
unused devices to sleep,
according to the power
models of the devices.
ElasticTree
(HELLER et al., 2010)
Resource
Consolidation
EE
RoutingNetwork
Manages a fat tree topology,
concentrates
tra�c and puts
nodes to sleep, saving energy.
Table 1: Energy E�ciency Capabilities Classi�cation

32
state in case of high-performance data transmission. Advanced Con�guration
and Power Interface (ACPI) (STEELE, 1998) de�ne di�erent states of energy
that can be applied to systems during their operation. The most relevant ones
are the C-states and P-states. C-states describe power consumption states in
which a CPU can be, for instance, C0 (operation state), C1 (halt), C3 (stop the
clock); P-states describe the processor performance state representing di�erent
DVFS settings combinations.
Synchronized Coalescing (SC) (MOSTOWFI; CHRISTENSEN, 2011) is a
system scope capability intended for low utilization periods in which it is possible
to put into sleep mode internal components of a device. It orchestrates LPI modes
of all individual interfaces to coalesce incoming packets, creating short periods in
which internal components (e.g., packet processor) can be put into sleep mode,
and then coalesced packets are sent in bursts.
Gigabit-capable Passive Optical Networks (GPON) (TROJER et al., ) is a
�ber network that only uses �ber and passive components such as splitters and
combiners rather than active components. It deploys the optical technique Wave-
length Division Multiplexing (WDM) so that a single �ber can be used for both
downstream and upstream data, thus using less equipment than an Ethernet-
based network.
The Energy-Aware OSPF (Open Shortest Path First) (CIANFRANI et al.,
2010) is a green tra�c engineering capability based on OSPF-based mechanism
that supports energy-aware tra�c engineering solutions. It addresses the optimi-
zation problem based on the Multiple Commodity Flows (MCF) constraints with
a weighted objective considering both energy consumption and network perfor-
mance regarding maximum link utilization.
CARPO (Correlation Aware Power Optimization) (WANG et al., 2012) is
a network level capability that provides a scheme to consolidate tra�c �ows

33
based on a correlation analysis of �ows in a data center network. It proposes an
optimization algorithm that dynamically combines tra�c �ows into a small set of
links and switches and then shuts down unused devices for higher energy savings.
While Energy-Aware OSPF is based on OSPF to include power constraints to
�nd energy-e�cient shortest paths, CARPO performs a correlation between �ows
utilization focusing on minimizing the number of active links and devices for a
data center network.
Similarly to CARPO, GreenTE (Green Tra�c Engineering) (ZHANG et al.,
2010) is a network level capability aiming to reduce the number of active devices
and links in response to demand and performance constraints. The optimization
problem is solved as a Mixed Integer Linear Programming (MIP) with the total
network power saving as the objective to be maximized, being the performance
requirements and network delay considered constraints to this formulation. Howe-
ver, di�erently from CARPO, GreenTE provides a formal model that maximizes
the number of links to be put into sleeping mode under the constraints of link
utilization and path length, and additionally balances the network load.
SustNMS (COSTA et al., 2012) and ElasticTree (HELLER et al., 2010)
are network level capabilities focusing on data center networks, as in CARPO.
SustNMS was designed by our research group at LASSU aiming to strike a ba-
lance between quality of service requirements and energy e�ciency. It considers
the manual input of routes by a network administrator, who sets a path based
on user requirements. ElasticTree introduces energy proportionality in data cen-
ter networks by turning o� as many unneeded links and switches as possible. It
consists of three logical modules - optimizer, routing, and power control. The
optimizer's role is to �nd the minimum power network subset which satis�es cur-
rent tra�c conditions and outputs a set of active components to both the power
control and routing modules.

34
Given that the literature contains good technical descriptions of ALR (Adap-
tive Link Rate) and SC (Synchronized Coalescing) to guide its implementation
while SustNMS is a previous work performed by our research group, the source
code was available. Furthermore, capabilities and techniques that operate at the
infrastructure level such as Smart Grids access, which aims to optimize the power
supply in a data center, or the management of air �ows between racks, are outside
the scope of this work.
2.3.1 Subsystem scope: Adaptive Link Rate (ALR)
ALR is a capability that deals with the underutilization and over-provisioning
of Ethernet links by dynamically changing data rates in response to tra�c levels
(GUNARATNE et al., 2008). Figure 8 presents the ALR functioning.
Figure 8: Adaptive Link Rate. Source: (GUNARATNE et al., 2008).
It is designed to modulate the capacity of network interfaces scaling up or
down existing Ethernet data rates (i.e., 10 Mbps, 100 Mbps, 1 Gbps). ALR
consists of a mechanism and policy. The mechanism determines how the data
rate changes by a link negotiation, and the policy determines when to change
the data rate, aiming to maximize the time spent at a low data rate and saving
energy without packet losses (GUNARATNE et al., 2008).
The policy is based on a dual threshold policy in addition to counting the
number of transmitted bytes (tn) in time (tutil). If tn is less than the de�ned

35
threshold (qLow - queue low and qHigh - queue high in bytes), and then the link
rate switch process is invoked. When the queue length in an interface exceeds the
qHigh threshold, then it is requested to increase the link data rate. Conversely,
when the queue length becomes lower than the qLow threshold, a request is sent
to reduce the link data rate. Thus, if a low tra�c level is detected, a low data
rate should be used. Otherwise, a high link data rate is necessary.
The authors performed experiments using distinct tra�c patterns to observe
policies and link negotiation behavior. Results presented that on average ALR
can achieve power savings of about 8 to 20%, depending on link utilization tutil.
In average, the lower the tutil, the higher the savings are (around 5% of link
utilization to reach 20% of energy savings). Therefore, whenever ALR is active,
the use of the following power model is considered:
AdaptivePower = Powerchassis + Numlinecards ∗ Powerlinecard
+
nPorts∑i=0
port ∗ workload - 15%
(2.1)
According to Ricca et al. (2013), ALR can save up to 21% of the studied equip-
ment. Furthermore, Ricciardi et al. (RICCIARDI et al., 2011) studied the functi-
onality and discovered that the energy spent after reducing the link rate depends
on the native interface speed. The authors also state that half of the energy is
due to the �xed part, and that, using ALR, the savings could reach 15%. ALR is
interesting to use in scenarios in which the load is greater since it spends much less
time to wake up the interfaces (microseconds order of magnitude, while waking
up a node from a sleep mode can take minutes). Additionally, the functioning of
ALR is well documented and studied, e.g. surveys on ALR techniques (BILAL
et al., 2013) and (MAHADEVAN; BANERJEE; SHARMA, 2010).

36
2.3.2 System Scope: Synchronized Coalescing (SC)
SC is a capability intended for low utilization periods of network devices,
such as Small Or Home-O�ce networks (SOHO). Despite presenting low energy
consumption, the number of SOHO devices deployed around the world is so huge
that their consumption becomes signi�cant overall (CHRISTENSEN et al., 2010).
The SC objective is to prevent links connected to a node to forward data for a
while, creating a time opportunity to turn o� internal components. Figure 9
present its functioning.
Figure 9: Arriving jobs (a) without, and (b) with coalescing. Source: (CHRIS-TENSEN et al., 2010).
Example (a) in Figure 9 presents a case in which the packets arrival rate
does not present a tgap large enough to enforce LPI (Low Power Idle). LPI is a
mode for Ethernet links (de�ned by IEEE 802.3az) used for reducing the energy
consumption of interfaces in a switch or router when no data is transmitted
(CHRISTENSEN et al., 2010). In Figure 9 (b), arriving packets are coalesced
creating tgap large enough to enforce LPI. Ts and Tw are, respectively, times
required to activate and deactivate SC.
SC uses a mechanism to orchestrate LPI modes of all individual interfaces,
coalescing packets during the tgap such that an entire switch may be put into
lower consumption mode. The capability improves the e�ciency of IEEE 802.3az
by coalescing incoming packets and forwarding them into bursts, making the

37
number of transitions between LPI and active modes decrease (MOSTOWFI;
CHRISTENSEN, 2011). Figure 10 details its operation sequence.
Figure 10: Synchronized Coalescing. Figure from (CHRISTENSEN et al., 2010).
SC capability de�nes a DutyCycle, i.e., the total cycle time of SC considering
the tOn (the time the node must stay in operation mode). The tOff (time
the capability is inactive) is given by: tOff =(
tOnDutyCycle
− tOn). While
SC is active, incoming packets are bu�ered, and a packet counter (pktCount)
is initialized with the tOn. When tOn expires, two cases may happen: 1) the
maximum elements of pktCount is greater or equal to thresh (to compare to
the maximum of all packets), in which Pause Noti�cations are sent in all links,
tOFF is reset, and starts to count down, and the switch enters into OFF state
for another OFF period; or 2) the maximum elements of pktCount is less than
thresh, in which case: tOn is reset to its initial value and starts to count down,
all the elements of pktCount are set to 0, and the switch remains in ON state for
another ON period. Upon the expiration of tOFF , the tOn is set to its initial
value and starts to count down, all the elements of pktCount are set to 0, the
switch returns to ON state and the entire procedure is repeated. The authors
presented energy savings about 40% for SC, considering that the capability was
intended for small or home o�ce devices.
38
2.3.3 Network Scope: SustNMS
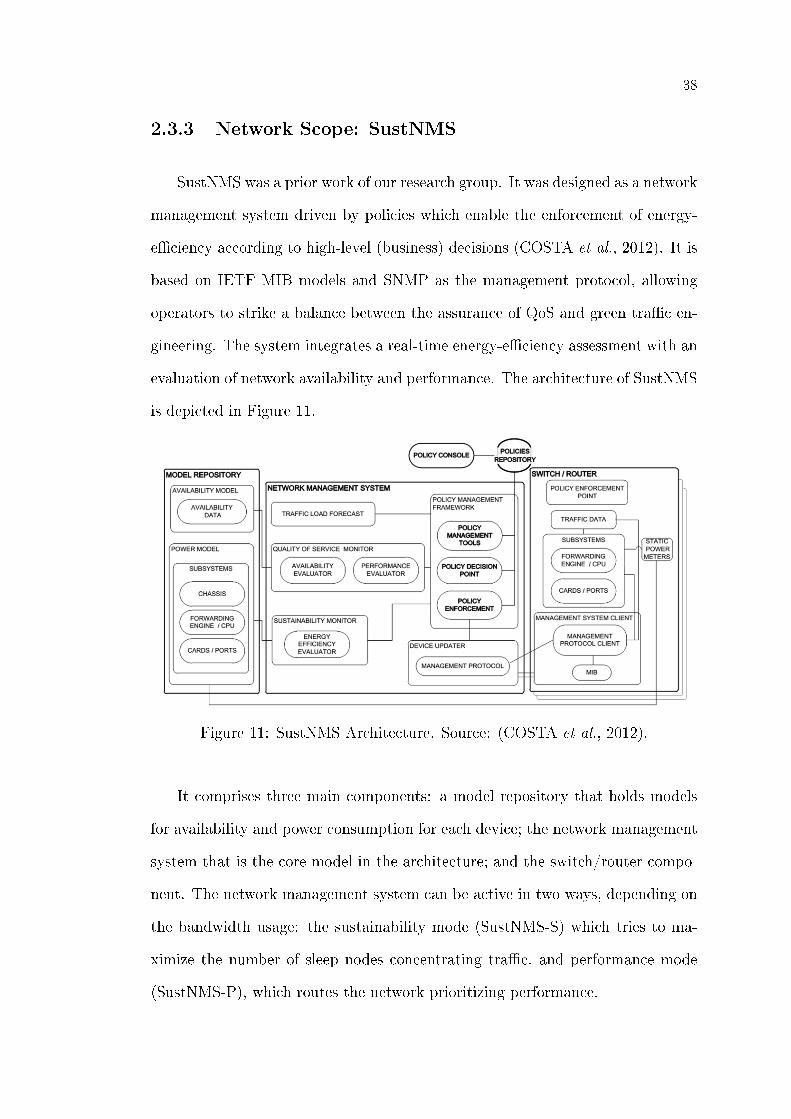
SustNMS was a prior work of our research group. It was designed as a network
management system driven by policies which enable the enforcement of energy-
e�ciency according to high-level (business) decisions (COSTA et al., 2012). It is
based on IETF MIB models and SNMP as the management protocol, allowing
operators to strike a balance between the assurance of QoS and green tra�c en-
gineering. The system integrates a real-time energy-e�ciency assessment with an
evaluation of network availability and performance. The architecture of SustNMS
is depicted in Figure 11.
Figure 11: SustNMS Architecture. Source: (COSTA et al., 2012).
It comprises three main components: a model repository that holds models
for availability and power consumption for each device; the network management
system that is the core model in the architecture; and the switch/router compo-
nent. The network management system can be active in two ways, depending on
the bandwidth usage: the sustainability mode (SustNMS-S) which tries to ma-
ximize the number of sleep nodes concentrating tra�c, and performance mode
(SustNMS-P), which routes the network prioritizing performance.

39
2.4 Chapter Final Remarks
This chapter presented an overview of undertaken approaches towards energy
e�ciency and a characterization of energy e�ciency capabilities based on their
actuation scope in the network. Understanding these ways to reduce energy
expenditure is important to classify the energy e�ciency capabilities based on
their characteristics. For instance, if a given capability operates in a single node
putting internal components to sleep in case of low utilization, it is a capability
that implements the Smart Sleeping strategy. However, if a capability manages
some nodes in the network being able to move workloads and putting nodes in a
path to sleep, it would be a Resource Consolidation capability.
Another key aspect to understand how much energy a network equipment
consumes under the possible operating conditions is to model the nodes con-
sumption using power pro�les. From this abstraction, it is possible to design
algorithms to perform tra�c engineering based on energy requirements. For Gre-
enSDN, two power models are taken into account. One of them considers nodes
in which the power consumption is proportional to the workload (i.e., the higher
the workload, the higher the energy being consumed is). The second one deploys
a constant power pro�le representing devices in which the power consumed does
not vary with the workload. Thus, it is possible to calculate the amount of energy
being consumed by a given node at a given point in time. Furthermore, based
on network usage traces one may enforce energy e�ciency capabilities in advance
of an event, predicting a given behavior at a given point in time (e.g., during
non-o�ce hours).
Moreover, this Section provided an overview of approaches towards energy ef-
�ciency introducing basic concept and techniques related to energy e�ciency, and
selecting energy e�ciency capabilities representative of their network scope. The

40
criteria to determine a representative capability was the availability of support
and documentation, which enable a precise development of selected capabilities.
As a consequence, well-known capabilities such as ALR and SC provide enough
information on their functioning and expected behavior. Moreover, SustNMS (a
network-scope capability) was a previous research work led at LASSU, therefore,
the source code and documentation were available. To conclude, Table 2 ou-
tlines the characteristics of the selected capabilities to be implemented by the
GreenSDN.
Capability Scope Objective Restrictions Achievable Savings
ALR SubsystemAdjusting the link rate atinterfaces in order tomeet current workload
Operating with existingEthernet data rates10 Mbps/100Mbps
1Gbps
Up to 15%
SC System
Coalescing packets to createidle periods in which thedevice can be put into
sleep mode.
Intended for lowbandwidth utilizationbeing most commonfor SOHO devices
Up to 40%
SustNMS NetworkAggregating tra�c puttingunused nodes into sleep
mode
Requires manualinput of alternative
routes to strike a balancebetween QoS and energy
e�ciency
Relies onthe network
usage
Table 2: Capabilities of the GreenSDN.
Achievable energy savings by SustNMS rely on how the network is being
used, i.e. during o�ce hours in which the network usage is usually higher than
non-o�ce hours, energy savings may not be possible. However, during the night
it is possible to put nodes to sleep and to maintain a minimal graph to keep
the network connected. Also, it is possible to combine capabilities of di�erent
approaches to increase energy savings during o�ce hours and non-o�ce hours.
For instance, during o�ce hours in which it may not be possible to use green
tra�c engineering, adjusting the link rate in order to meet current workload may
be the most e�cient strategy.

41
3 NETWORK ENVIRONMENT
As the demand for network services increases, it is necessary not only to ful�ll
the current requirements, but also to anticipate and to plan for satisfying future
requirements and trends on network services. Nevertheless, the deployment of
novel algorithms and protocols in real systems is di�cult due to potential side-
e�ects in critical services. Thus, decoupling experimental research from real de-
ployment has become essential to avoid side-e�ects and leverage network research.
This Chapter thus reviews current network platforms to be used as the baseline
for GreenSDN, concepts related to network management and Software-De�ned
Networking (SDN).
3.1 Network Platforms
For many years, experimental research platforms have been designed to study
theoretical concepts at/in scale. Software-based simulations have always been
considered an e�cient approach to study physical systems (SIATERLIS; GAR-
CIA; GENGE, 2013). However, they do not provide an accurate analysis of the
diversity and complexity of the network protocol stack. In this regard, hardware-
based emulation is considered a �exible and powerful approach to provide a closer
view of how a particular capability would operate in a real deployment (PEDIA-
DITAKIS; ROTSOS; MOORE, to be published).
As the widespread adoption of new technologies and services (i.e., video strea-

42
ming and online gaming) highlights limitations in current network infrastructures,
it also puts similar e�orts towards the development of experimental network plat-
forms. As a consequence, several works have explored the various properties of
such systems under di�erent requirements, this work exploits energy e�ciency as-
pects. As requirements to be addressed by a network platform, Pediatikis, Rotsos
and Moore et al. (2014) and Holibaugh et al. (1988) identi�ed the following key
requirements:
• Scalability: is the ability to support and to manage network experiments
of growing size while still providing increased throughput and reduced res-
ponse time. Thus, scalability is not de�ned as a �xed number, but as a
function de�ned over minimum QoS (Quality of Service) levels associated
with an overall throughput. However, based on Pediatikis, Rotsos and
Moore (2014) the related works were classi�ed taking into account the fol-
lowing metrics based on the network platforms category and their capacity
to increase the overall throughput while maintaining QoS levels:
� High: simulation-based network platforms based on mathematic mo-
dels to deploy and to evaluate experiments;
� Average: emulation/simulation platforms implementing the network
behavior on software and still being considered software-based experi-
ments; and
� Low: testbeds and real deployment network platforms.
• Reproducibility: is de�ned as the ability to export and to replicate ex-
perimental scenarios and their results. The capacity to migrate the same
experiment to a di�erent environment and obtain the same results without
major modi�cations was considered (3or 7);
• Usability: corresponds to the ease to use, to modify and to deploy experi-

43
ments, including Graphical User Interface (GUI) (if any) and documenta-
tion;
� Good: has an intuitive GUI to setup and to deploy experiments and,
APIs accessed via CLI (Command Line Interface), in addition to pro-
viding support either by documentation and/or user community;
� Average: does not provide GUI to setup or to deploy experiments
but contains APIs and support either from documentation or user
community; and
� Bad: does not provide GUI or documentation/community support.
• Compatibility: corresponds to a particular requirement to ensure that the
environment is compliant with a given technology. In the case of GreenSDN,
the support of OpenFlow and SDN is considered(3or 7).
• Availability: since a few platforms are outdated and do not have commu-
nity support, we considered (3or 7); and
• Hardware Requirements: de�ne the minimal hardware con�guration to
run experiments. As the scalability requirement, the minimal hardware re-
quirement to run an experiment is closely related to the type of the network
platform:
� High: considers testbeds and real deployment network platforms.
� Average: comprises platforms that are purely based on emulation;
and
� Low: contains platforms that are simulated and combines emulation
and simulation.
Another requirement de�ned in (PEDIADITAKIS; ROTSOS; MOORE, to
be published) is �delity : as the ability of the experiment to replicate speci�c

44
system behavior with accuracy. However, the evaluation of this requirement
demands a comparison between the emulation and the deployment in the real
environment. Other requirements can be found in (HOLIBAUGH; PERRY; SUN,
1988), such as extensibility, which is the ability to integrate new functions and
tools; and adaptability that relates to the portability of the experiment, which
can be understood as a reproducibility (the reason why it is not considered in the
evaluation).
In addition, the network platform should be open source or available (if pro-
prietary) and straightforward to deploy/replicate experiments. Thus, it has to
enable quick adjustments in the experiment settings and, straightforward deploy-
ment or replication related to environments that run locally (e.g., a server or
multiple VMs hosted in a single server). Based on the highlighted requirements,
Table 3 presents an evaluation of main network platforms in distinct categories.
Given the growth of network infrastructures virtualization in network infras-
tructures, there are e�orts to emulate or to simulate programmable networks to
provide environments supporting realistic user tra�c, in scale, and with interac-
tive behavior. Table 3 presents three categories of network platforms: testbeds,
simulators, and emulators/simulators. Testbeds (Subsection 3.1.1) are examples
of the global environment providing a broad range of network features through
network slices. Simulators (Subsection 3.1.2) are software-based network experi-
ments that allow an evaluation of protocols and involves modeling the underlying
state of the target. Emulation (Subsection 3.1.3) is still a software-based network
experiment, however, it is the process of mimicking the hardware or software of
a real network environment to test the performance of real applications over a
virtual network.

45
Environment Scalability Reproducibility UsabilityCompatibility
SDN SupportAvailability
Hardware
Requirements
Testbeds
Emulab
(WHITE et al., 2002)
Low 3 Good 3 3 Average
OFELIA
(SALSANO et al., 2013)
Average n.a. Good 3 3 High
Planetlab
(ROSCOE, 2002)
Average n.a. Average Custom OVS 3 High
FIBRE
(FIBRE, 2016)
Average 3 Good 3 3 High
GENI
(GENI, )
Average n.a. Good 3 3 High
AKARI
(AKARI, 2007)
Low n.a. Average 3 3 High
FIRE
(GAVRAS et al., 2007)
Average 3 Good 3 3 High
CANARIE (GSN, 2010) Average n/a Good 3 3 High
Simulation
ns2
(NS2, 2016)
High 3 Low 7 3 Low
ns3
(NS3, 2016)
High 3 Low Partial 3 Low
OMNeT++
(OMNET, 2016)
High 3 Low 7 3 Low
FS-SDN
(GUPTA; SOMMERS; BARFORD, 2013)
High 3 Average 3 3 Low
Emulation/Simulation (Hybrid)
Mininet
(LANTZ; HELLER; MCKEOWN, 2010)
Average 3 Good 3 3 Low
EstiNet
(WANG; CHOU; YANG, 2013b)
High 3 Good 3 Proprietary Low
ModelNet
(VAHDAT et al., 2002)
Average 7 Bad 7 Outdated Average
DummyNet
(CARBONE; RIZZO, 2010)
Average 7 Average 7 3 Average
Selena
(PEDIADITAKIS; ROTSOS; MOORE, to be published)
High 3 Average 3 3 Low
Table 3: Comparison of well-known network experimentation platforms acrossdi�erent dimensions.
46
3.1.1 Testbeds
Emulab (WHITE et al., 2002) is a management system for a network-rich
cluster that provides a space and time-shared hardware for studying networked
and distributed systems; one of its goals is to transparently integrate a variety
of experimental environments, including support to emulate/simulate OpenFlow
and SDN environments. OFELIA (SALSANO et al., 2013) is an initiative of
the European Union 7th Framework Programme (FP7)1 that provides a diverse
OpenFlow-enabled infrastructure to allow Software De�ned Networking (SDN)
experimentation. It is currently composed of ten sub-testbeds (called islands),
most of them in Europe and one in Brazil, which deploys SDN.
PlanetLab (ROSCOE, 2002) is a global research network established since
2002 that supports the development of new network services being composed
by several compute nodes around the world. Currently, PlanetLab consists of
1353 nodes at 717 sites around the world. FIBRE (Future Internet Brazilian
Environment for Experimentation) (FIBRE, 2016) is a federated research facility
funded by the 2010 Brazil-EU (European Union) Coordinated Call in ICT to test
new applications and network architecture models, being composed of 11 testbeds
(also called islands or nodes) among USA (United States of America), Brazil and
Europe. On the Brazilian side, the primary objective of FIBRE was to build a
Future Internet Testbed federated with other worldwide Testbed initiatives.
Similar to Emulab and Planetlab, GENI (Global Environment for Networking
Innovations) (GENI, ) is a project funded by the USA that involves several nodes
around the world to promote research on Future Internet topics and to accelerate
the transfer of this research results to the industry creating products and servi-
ces. Other initiatives with similar research purposes are AKARI (AKARI, 2007)
project in Japan, FIRE (GAVRAS et al., 2007) for EU and CANARIE (GSN,
1https://ec.europa.eu/research/fp7/

47
2010) for Canada.
As these platforms were conceived to leverage the Future Internet research,
all the testbeds mentioned above provide support to experiments based on the
OpenFlow protocol and SDN. However, by using compute nodes and/or swit-
ches spread across di�erent locations within the world or a country, the hardware
requirements to execute an experiment are elevated and, in most cases, the allo-
cated resources are scheduled to perform for a pre-de�ned time slot. Also, due
to hardware restrictions in the di�erent nodes or islands, the reproducibility of
the experiment may be limited. For instance, if an operation requires the latest
version of a given network protocol or imposes a particular compute requirement,
the experiment may not be easily reproduced in other islands.
3.1.2 Simulators
NS2 (NS2, 2016) and NS3 (NS3, 2016) are widely deployed network simula-
tors based on discrete events used for simulating network protocols with di�erent
network topologies. NS2 was built in C++2 language and provides the simula-
tion interface using OTcl3, an object-oriented dialect of Tcl. As NS2, the NS3
is an open source, discrete event network simulator, but it supports parallel si-
mulations and can be implemented in pure C++. By default, neither NS2 nor
NS3 supports OpenFlow or SDN-based networking, however, NS3 can support
OpenFlow relying on an external library OpenFlow switch library (OFSID)4.
The motivation behind the development of OMNET++(OMNET, 2016) was
to produce a powerful open source discrete event simulation tool that can be used
by academic, educational and research-oriented commercial institutions for simu-
lating computer networks, distributed and parallel systems. Unlike NS2 and NS3,
2http://www.cplusplus.com/doc/tutorial/3https://en.wikipedia.org/wiki/OTcl4https://www.nsnam.org/docs/release/3.13/models/html/open�ow-switch.html

48
OMNET++ is not only designed for network simulations. It can be used for mo-
deling multiprocessors, distributed hardware systems and performance evaluation
of complex software systems (BILALB; OTHMANA et al., 2013).
FS-SDN (GUPTA; SOMMERS; BARFORD, 2013) is a simulation tool for
prototyping and evaluating new SDN-based applications. It is based on the FS5
simulation platform, a network �ow record generator containing a discrete event
simulation core to generate the �ow records, which relies on existing TCP th-
roughput models to drive the simulation. FS-SDN extends the underlying FS
simulation engine by seamlessly incorporating the POX (POX, 2009) OpenFlow
controller framework and API, and switch components that can be controlled and
con�gured through the OpenFlow control protocol.
In general, network simulators are designed to test network protocols and
applications at scale due to their modeling nature. For this reason, all network
simulation platforms provide higher scalability levels in contrast to testbeds and
emulation platforms. However, not all simulators provide full support to novel
protocols such as OpenFlow, which may be a limiting factor to Future Internet
research. Thus, to overcome this problem NS3 implemented a library that models
a switch with OpenFlow capabilities, and initiatives such as FS-SDN are designed
speci�cally for network simulation of SDN environments. To conclude, reprodu-
cibility is one of the main strength of simulation platforms in comparison with
other platforms, and simulation allows adjusting settings quickly in the modeled
nodes and reproduce experiments in scale.
3.1.3 Emulators/Simulators
Among the Emulators/Simulators, EstiNet (WANG; CHOU; YANG, 2013a)
was the best choice of network platform. However, the solution is proprietary and
5https://github.com/jsommers/fs

49
not available for academic research. In this regard, Mininet (LANTZ; HELLER;
MCKEOWN, 2010) combines the desirable features of simulators, testbeds, and
emulators, being considered the most popular and the easiest to use due to its
capability to execute locally in a virtual machine, also allowing faster implemen-
tations. It is readily available as open source, and straightforward replication of
experiments is one of its main strengths. Mininet includes data plane switching
functionality from Open vSwitch (OVS) (PFAFF; PETTIT; SHENKER, 2009).
However, the OVS code is relatively complex and, therefore, di�cult to modify.
Instead, in GreenSDN we opted for implementing the interface and node-level
green capabilities emulation at the control plane.
The ModelNet (VAHDAT et al., 2002) project established an approach in
scalable emulation of Internet topologies, using edge hosts running unmodi�ed
applications, with nodes emulating virtual network topologies using DummyNet
(CARBONE; RIZZO, 2010). ModelNet improved scalability by increasing hard-
ware requirements and could only parallelize execution provided that a particular
application and topology allowed it. Despite being one of the pioneers in scalable
network emulation, ModelNet is outdated and does not support SDN/OpenFlows
experiments.
DummyNet (CARBONE; RIZZO, 2010) is a tool for bandwidth management
and testing networking protocols implemented in FreeBSD6 but portable to other
protocol stacks. It works by intercepting packets in their way through the proto-
col stack and passing them through one or more pipes which simulate the e�ects
of bandwidth limitations, propagation delays, bounded-size queues, packet los-
ses, and so on. Selena is a network emulation framework based on Xen7 which
o�ers reproducible experiments via an automation interface for con�guring all
experimental details. To emulate faster and larger networks, it adopts the tech-
6https://www.freebsd.org/7http://www.xenproject.org/

50
nique of time-dilation and transparently slows down the passage of time for guest
operating systems. Furthermore, it can emulate links by creating pairs of guest
network interface devices bridged in Dom08.
By combining the advantages of emulation and simulation, it is possible to
validate experimental models against real tra�c loads, to evaluate real applica-
tions against repeatable tra�c derived from a rich variety of existing simulation
models and to scale to larger topologies. However, emulating real networking
software imposes higher hardware requirements than simulation platforms and
a�ect the experiment scalability, which is the case of ModelNet and DummyNet.
3.2 Software-De�ned Networking (SDN)
As network infrastructures expand in response to a growing number of users
and services, the management task increases in complexity. The heterogeneity of
devices and technologies imposes the need for trained personnel to understand
and to deploy new and old features (VERMA, 2009). Fundamentally, network
management is the process of monitoring and controlling network resources to
ensure that it is operational and compliant with user requirements (SUBRAMA-
NIAN, 1999). It is usually divided into three abstraction layers (GREENBERG
et al., 2005): i) data plane; ii) control plane; and iii) management plane. The
data plane is responsible for forwarding packets based on local forwarding states;
the control plane computes and coordinates forwarding states of the data plane,
involving the coordination with the rest of the network; and the management
plane visualizes and con�gures data provided by the control plane.
In the context of networks oriented to energy e�ciency the management com-
plexity grows. Implementing and coordinating some existing features poses a
challenging task for network operators (RIEKSTIN et al., 2015a). In traditional
8Privileged domain that starts �rst and manages the unprivileged domains.

51
networks, the control and data planes are combined into a single node and pro-
tocol. Once a forwarding policy is de�ned, the only way to make an adjustment
to the policy is via changes to the devices con�guration (SEZER et al., 2013).
However, this approach is restrictive to provide fast changes in response to sudden
workload variations. In this regard, SDNs change the way traditional networks
are designed and managed. Through the global awareness given by a centralized
controller, SDNs can optimize the management of �ows in response to events.
Feamster, Rexford and Zegura (2014) de�nes two key features of SDNs: i)
it decouples the control plane (which decides how to handle the tra�c) from the
data plane (which forwards tra�c according to decisions that the control plane
makes); ii) an SDN consolidates the control plane, so that a single software con-
trol program controls multiple data plane elements. Such characteristics provide
better visibility (decoupling) and control (centralized management) to perform
tasks such as network diagnosis and troubleshooting.
In addition to SDNs, the OpenFlow protocol (MCKEOWN et al., 2008) leve-
rage network management by providing a programmable and standardized inter-
face between data plane and control plane. Many vendors including, HP, NEC,
NetGear, and IBM, produce OpenFlow-capable devices. Moreover, a standard
interface between data and control planes prevents the implementation of several
speci�c interfaces, therefore simplifying network operations while driving down
hardware costs. Figure 12 presents a high-level SDN architecture.
Applications are programs that explicitly communicate and negotiate requi-
rements with the control plane by one or more northbound interfaces, receiving
updates about the desired network states. The controller is the central piece
of an SDN architecture, translating and coordinating application requirements
down to the data plane, by policies de�ned by SLAs (Service Level Agreements).
Data plane nodes are devices that expose, by a southbound interface, the con-

52
Application
Plane
Application
App Logic
Interface
Application
App Logic
Interface
Application
App Logic
Interface
Northbound protocols, e.g., REST, Java, Python
ControlPlane
SDNController
Northbound Interface
Control Logic
Southbound Interface
Managem
entPlane
Contract
SLAs
Con�gurePolicies
Monitor
QoS
Element
Setup
Southbound protocols, e.g., OpenFlow, SNMP, Netconf
Data
Plane
Node1 Interface
ForwardingPlane N
odeN Interface
ForwardingPlane
Figure 12: SDN Architecture. Source: (ONF, 2013).
trol of its forwarding capacities and data processing capabilities. In traditional
networks, forwarding capabilities are not managed directly by a controller. Usu-
ally, forwarding policies are sent to be updated in each separate device. Lastly, the
management plane is responsible for controlling the relationship between client
and provider, transforming high-level business requirements into low-level actions
to be monitored and enforced at the data plane.
SDN introduces more programmability and �exibility to the control plane by
introducing a centralized management point, aware of the whole network. It,
thus, allows the development of more sophisticated management techniques in an
easier way as compared to legacy networks. Energy e�ciency can be improved by
the high accuracy and �exibility of the data plane management in contrast with
traditional networks. Accuracy can be achieved by eliminating device-by-device
con�gurations, by a standard southbound interface, and �exibility by the logic
implemented at the control plane, thus allowing single or multiple controllers.

53
Therefore, control decisions can be made based on a current and global view of
the network state, rather than distributed and isolated as in traditional networks.
An SDN controller is a software platform where all the network control appli-
cations are deployed. Controllers are the "brains"of an SDN environment, acting
as the strategic control point in the network responsible for relaying information
to the switches, routers, and other network devices via southbound APIs and the
applications and business logic via northbound APIs.
Controllers in SDN have two operational modes, reactive and proactive. In
the reactive approach, packets of each new �ow coming to switch are forwarded
to the controller to decide how to manage the �ow. This method takes a consi-
derable time for installing rules. The amount of latency can be a�ected by the
resources of a controller, their performance, and the controller-switch distance.
In the proactive approach, rules are already installed in the switches; therefore
the numbers of packets sent to the controller are reduced. In this method, the
performance becomes better and therefore the scalability. Both approaches were
evaluated in (FERNANDEZ, 2013), in which a hybrid approach was presented
to gain the bene�ts of both reactive and proactive approaches.
Further, SDN controllers comprise a set of modules that can provide di�e-
rent network services, such as routing, topology management, host tracking and
others. Barros et al. 2015 presented an evaluation of current SDN controllers
outlining the key features of the described open source SDN controllers in Table
4:
CharacteristicsNOX
(GUDE et al., 2008)
POX
(POX, 2009)
Ryu
(Ryu, 2015)
Floodlight
(Floodlight, 2015)
ODL
(Linux Foundation, 2015)
Language C++ Python Python Java Java
Performance High Low Low High High
Distributed No No Yes Yes Yes
OpenFlow 1.0 1.0 1.0 - 1.4 1.0 - 1.3 1.0 - 1.3
Learning curves Moderate Easy Moderate Steep Steep
Table 4: Comparison between SDN Controllers. Source: (BARROS et al., 2015)

54
The programming language used to build the controller platform is an impor-
tant feature to be observed in the choice of the network controller as it directly
in�uence metrics such as performance and learning curve. The controller per-
formance is also determinant when choosing the correct platform for production
purposes; it can be a�ected by di�erent factors, including the programming lan-
guage, design patterns adopted and hardware compatibility. The learning curve
is a fundamental metric to consider when starting a project, being important to
measure the necessary experience to learn the SDN controller platform and to
build the necessary skills. Further, it directly in�uences the time to develop a
project and also the availability of skilled developers.
3.3 Sustainability-Oriented System (SOS)
The SOS orchestration method is a previous work of our research group at
LASSU. It has two primary objectives. First, it aims at coordinating di�erent
energy e�ciency capabilities considering the possible combinations and con�icts
among them, as well as the best option for a given bandwidth utilization and
network characteristics (RIEKSTIN et al., 2014). Secondarily, it examines the
expression of business-level policies and its translation into device-level actions
and con�guration, increasing the automation level of the network management,
rendering it less error prone and complex (RIEKSTIN et al., 2015c).
SOS functioning consists of a few main steps. First, high-level policies given
by a network administrator are re�ned down to network-level parameters. The
re�nement process takes into consideration the usage of table lookup techniques
(RIEKSTIN et al., 2015c). Next, the re�ned parameters are combined with dis-
tinct network conditions (e.g., time condition) to provide the best combination
of capabilities to be enforced at a given point in time. In details, the re�ned
parameters are used as input to analytical solvers (one for each energy saving

55
capability) that evaluate the best combination of capabilities for each network
condition. As a result, decision trees are generated. Then, the last step consists
of con�guring the decision trees and translated policies in GreenSDN. Figure 13
presents a high-level view of its functioning.
Parameters
System Level
IF usage less than 50% | IF time between 10pm and
6:50am | Use Energy Efficiency on green networks
Best functionality (-ties) for each workload
Info.
Models
(UML)
Random
WorkloadsTopology
EE Functionalities
available and details
Decision Tree
ElasticTree
+ALRElasticTree
ALR in
all nodes
10%
20%
45%
... ...
Policy Decision Point
Apply ElasticTree in the network and ALR in the nodes
that remain powered ON
Decision Tree deployed inside the controller
Decision Tree
Translation
Network Workload
Now = 10%Topology
EE Functionalities
available and details
Controller
instructions
Controller at runtime
Dynamic Policies Monitoring
In case a node changes to other sub-network, change
the policy parameters
𝑼𝑭 = 𝒑𝒍 ∗ 𝟏 𝑬𝒏𝒆𝒓𝒈𝒚𝑨𝒇𝒕𝒆𝒓𝑺𝒂𝒗𝒊𝒏𝒈𝒔𝑹𝒐𝒖𝒕𝒆𝒓 𝒌𝒏𝒌=𝟎 𝑬𝒏𝒆𝒓𝒈𝒚𝑩𝒂𝒔𝒆𝒍𝒊𝒏𝒆𝑹𝒐𝒖𝒕𝒆𝒓 𝒌𝒏𝒌=𝟎
1
23
4
56
1
Figure 13: SOS orchestration method. Source: (RIEKSTIN et al., 2014)
Illustrating the SOS functioning, a use case is presented in Figure 13. Num-
bers 1-6 represent the architecture module being used. An operational policy
is translated, giving to the network level some information such as the environ-
ment conditions (it should save energy only if the network load is less than 50%),
the period of the day the energy e�ciency capabilities will take place (during
the night), and the particular network or subnetwork in which they are going
to be applied. A fat tree topology with 1Gbps edges and aggregation nodes,
and 10Gbps core nodes is assumed. The method takes as input power pro�les
considering the �xed and variable power spent and a set of random workload to
train the method. These workloads are combined with a set of possible energy
e�ciency capabilities.
In the example, the possible capabilities considering the fat tree topology are
ALR (Adaptive Link Rating), SC (Synchronized Coalescing), and ElasticTree
(HELLER et al., 2010). The possible combinations of the capabilities could lead
to con�icts during operation if one tries to put a node to sleep while the other is

56
expecting this same node to be fully operational.
Considering a 10% workload, a typical scenario during low-usage periods,
ALR would reduce interfaces speed from 1Gbps to 100Mbps. Considering the
expected savings, in our example, ALR would save approximately 20% of the
original power demanded. SC, considering the experiments in Mostow� and Ch-
ristensen (2011) for the percentage of time the switch stays turned on as a function
of load, the ON time for an amount of 10% is around 20%.
Executing ElasticTree in a 20% occupancy network scenario, the authors
on Heller et al. (2010) reported 38% of energy savings (minimum spanning tree
topology to ensure connectivity). This value would be similar for a 10% workload
since the minimum spanning tree topology should be respected. The savings, in
this case, are expected to be greater than with SC because the latter does not
comprise a tra�c engineering functionality while ElasticTree does. ElasticTree
will relocate the tra�c to allow more switches to sleep, thus saving more energy.
Besides, by coordinating ElasticTree energy saving capabilities with ALR,
it is possible to potentially increase the savings ratio (reducing the link rate to
100Mbps). Therefore, the best option for this scenario is ElasticTree plus ALR.
Dividing the possible savings with ALR for the whole network by the total number
of nodes and then multiplying the result by the number of remained powered
nodes after ElasticTree, the savings can reach 50% for a 10% load scenario and
the given topology.
As SOS, the GreenSDN design takes into consideration the two modules: i)
a decision point to coordinate capabilities based on one or more decision trees
generated by SOS; and ii) a component that adjusts the current decision tree
based on time and scenario changes (e.g., during the night use a decision tree
DTB, if a node disconnects, change DTB).

57
3.4 Chapter Final Remarks
This chapter presented an overview of primary network platforms and con-
cepts related to network management and SDN, considering the GreenSDN ope-
ration in conjunction with the SOS orchestration method. In the �rst part, an
overview of experimental network platforms to select a baseline environment to
build GreenSDN was brie�y presented. Testbeds leverage large-scale experiments
(e.g., Internet routing), emulators and simulators provide fast deployment and
con�guration of network experiments, which is in alignment with our objectives.
Thus, to enhance the development and con�guration of the selected energy saving
capabilities (and possible further management strategies), the Mininet network
emulator with the POX controller were selected.
Since there is an ongoing transition towards software-de�ned infrastructures,
the second part outlines the relevance of combining SDNs and OpenFlow. While
OpenFlow provides a standard/open interface between data and control planes,
the SDN paradigm concentrate on a single management point a software abs-
traction that facilitates the network management and the development of energy
saving capabilities at the control plane.
In the last part of this chapter we brie�y presented the SOS orchestration
method, which was built based on GreenSDN and published in (RIEKSTIN et al.,
2014; RIEKSTIN et al., 2015c) and demonstrated in (RIEKSTIN et al., 2015b).
Based on the implementation of energy saving capabilities in GreenSDN, SOS
coordinate the decision-making process regarding whether to enforce a single or
a combination of capabilities given a network condition and a set of constraints
provided by a network administrator.
The next Chapter presents the GreenSDN architecture based on the ONF
(Open Network Foundation) standard architecture and the Mininet platform

58
using POX as a controller. Also, SOS is shown in the architecture as an applica-
tion that coordinates the functioning of available energy e�ciency capabilities.

59
4 GREENSDN
This chapter describes the technical details involved in the design and ope-
ration of GreenSDN considering the selected energy e�ciency capabilities and
worker modules required for the functioning of such capabilities. In this regard,
we �rst introduce the architecture and its main components detailing how they
relate to each other (Section 4.1) and then we present the full architecture and the
development details in Section 4.2. Lastly, we summarize the chapter presenting
the concluding remarks in Section 4.3.
4.1 Architecture
The architecture based on the SDN reference architecture (ONF, 2013) and
encompassing the objectives and requisites is presented in Figure 14. It comprises
four abstraction planes: i) data, ii) control, iii) application and iv) management:
• i) data plane: includes Open vSwitches (OVS) running in kernel mode to
switch packets across the interfaces, and parallel links interconnecting each
pair of nodes;
• ii) control plane: presents the worker modules of GreenSDN, such as the
Topology Manager, QoS Services Monitoring, Power Emulation, Database
Manager, and the SustNMS capability. Such modules, except SustNMS,
are responsible for obtaining and preparing data for the management layer

60
(which e�ectively takes decisions);
• iii) application plane comprises part of the SOS architecture and the
Graphical User Interface (GUI) elements, such as the topology viewer,
charts presenting the network utilization, and a screen to gather user para-
meters related to QoS and energy requirements; and
• iv) management plane: contains the modules responsible for managing
the network, such as the Decision Enforcement.
As follows, we present a high-level view of GreenSDN architecture and a
work�ow illustrating how components are related to each other.
SOS GUI
Ap
p.
Pla
ne
SustNMS Databases
(DB)
Power Emulation (PE)
Topology Manager (TM)
QoS Monitoring (QoS Mon)
ALR SC
Management Layer
Configuration Management
(CM)
DecisionEnforcement
(DE)Dynamic Policies
Co
ntr
ol P
lan
e
SOS
DB
Decision Trees Requirements
Config.
Users
NCP DE CM
QoSMon
Request config
Decision
TM
SustNMS/ARL/SC
RequestStats Config
Nodes
PE QoS Stats
QoS StatsEnergyStats
1
2
6
7
8
93
45
Architecture Workflow
Dat
a P
lan
e Open vSwitch
ALROpen
vSwitch
Open vSwitch
ALROpen
vSwitch
8
93
4
5
7 6
Management Cycle
12
Input andconfiguration
Net. Config. Param (NCP)
Figure 14: High-level view of the GreenSDN architecture and work�ow.
The �rst step of the work�ow requires input from SOS and user con�gura-
tion parameters. Before the GreenSDN operation, SOS performs a training stage

61
to decide the best combination of energy e�ciency capabilities to be applied.
Then, SOS outputs a decision tree for each scenario given by a network adminis-
trator. Users may input QoS requirements and energy use to generate parameters
to set usage policies in GreenSDN. In the second step, the NCP (Network Con-
�guration Parameters) receives and parses parameters provided in the �rst step.
Then, the NCP con�gures the parameters in databases to be queried by the DE
(Decision Enforcement).
The third step is the beginning of the management cycle. In this step, the
monitoring module not only detects when a workload is being sent on the network
but also calculates QoS parameters (e.g. delay and jitter) injecting probe packets
on the network. The fourth step is related to the organization and sending of
the information to the PE (Power Enforcement) module and storage in the DB
(Database).
In the �fth step, the PE receives usage statistics and calculates the energy
consumed and saved by the network infrastructure and users. Later, the module
stores the energy information in the DB (Database). After this, in the sixth
step the DE (Decision Enforcement) collects usage statistics to assess whether
it is necessary to adjust the network by con�gured policies. At this point, two
di�erent checks are performed. First it is evaluated whether the user requirements
are met, then, the de�ned actions in the decision tree given by SOS.
In the seventh step the CM (Con�guration Management) carries out de-
cisions determined by the DE. Despite represented in the management plan, its
operation is spread by features that produce changes in the network behavior,
such as the energy e�ciency features. In the eighth step, information related to
changes is forwarded to the TM (Topology Manager). In the ninth and last step,
the information is received by the TM and converted into corresponding actions
by the OpenFlow. Then, the messages are forwarded to the nodes and the ma-

62
nagement cycle is restarted. Figure 15 presents the full GreenSDN architecture.
The full description is available in Appendix A.
4.2 Full Architecture & Development Details
This section presents details of the main components of the GreenSDN archi-
tecture. First, it describes the con�guration parameters of SOS and users (SLA
settings) and how the system is con�gured; then, as a key to enforce energy e�-
ciency capabilities and QoS requirements, the QoS Service module is introduced.
To calculate energy metrics the Power Emulation module is presented, it takes
network statistics from the QoS Services and calculate the power usage. Lastly,
the implementation of the energy e�ciency capabilities is described.
4.2.1 Con�guration Parameters
This component is responsible for receiving and parsing user's requirements
and the decision trees that are provided by the SOS orchestration method. SOS
performs a training stage before the GreenSDN starts and requires a workload
generator and to create evaluate possible combination of capabilities for each
scenario de�ned by a user. Also, it deploys the network topology graph and the
business policies re�ned and deployed in the system.
In SOS, the re�ned policies determine when GreenSDN should switch a par-
ticular decision tree according to the environment (e.g., if usage is high or low),
time (e.g. during the night or during the day) or scenario (changes in the network
graph) conditions. For instance, a network administrator may determine policies
for each condition which are re�ned from high-level/business policies into network
commands. Then, a utility function is used to decide on the best combination
of capabilities for each de�ned condition. As a result, the SOS creates decision
trees whereas each branch is equivalent to a particular workload and each leaf,

63
Management Layer
Decision Enforcement
Dynamic Policy Configuration
Python APIPython API
Co
ntr
ol P
lan
e
(PO
X)
OpenFlow v1.0
Ap
plic
atio
n
Pla
ne
SOS (RIEKSTIN, 2015b)
User Config
Info.
Models
(UML)
Network Characteristics
Random Workloads
Refined Policies
Decision Trees construction
Analytical Solvers
ALRSC SustNMS
UtilityFunction
XML socket@localhost
SustNMS (COSTA et al., 2012)
Traffic load Forecast
QoS Monitor
Availability Evaluator
PerformanceEvaluator
Sustainability Monitor
Energy Efficiency Evaluator
Python API Python API
.txt/SQL
Databases
PoliciesRepository
NetworkLog (QoS, Energy)
PowerModels
SLAs
MySQL-db Manager
SQL SQL
SQL
Power Emulation
ALR Policy SC Adaptive
Energy Measurements
Topology Manager
Network Graph
Dat
a P
lan
e
(Min
ine
t) Open vSwitch ALR ALROpen vSwitch Open vSwitch
Open vSwitch ALR ALROpen vSwitch Open vSwitch
Python APIPython API
Protocol Parser
HostAnalyzer
HandleRequests
DeviceUpdater
Proactive Flows
Configuration
Hosts SLA
NetworkSettings
SOS Parser(XML à Python)
Data Parser(Python ßà Socket)
Graphic User Interface
Topology(Tkinter)
QoS Charts
(Matplot)
Hosts(Iperf/
Tkinter)
Data Parser(Python ßà Socket)
QoS Services Monitoring
Statistics HandlerConnection Up/Down Handler
(NIELS et al., 2014)
Sample QoSConfigurationParameters
(NIELS et al., 2014)
Probe Delay
Flows Ports
Adaptive Polling
Data Output and Formatting PDP
DeviceUpdater
Configuration Parameters
TS
TS
TSTS
TS TS
TS
TSTS: T
raff
ic
Shap
er
QoS Evaluation DecisionTrees
Time ConditionEnvironment
Condition
Figure 15: GreenSDN Architecture (gray related works used in GreenSDN).

64
to a decision. Decision trees and re�ned policies are then deployed via XML
(eXtensible Markup Language) inside GreenSDN.
User information describing acceptable QoS parameters and energy consump-
tion thresholds are manually set into the database. QoS parameters are de�ned
as: bandwidth (Mbps), delay (ms), Jitter (ms), packet loss (%). Among the QoS
parameters, the bandwidth is the one with a direct impact on the power consump-
tion, meaning that, the higher the provisioned bandwidth on a set of nodes, the
higher the probability of SLA violations is. Energy parameter is determined as a
maximum amount of Watts to be consumed. Table 5 presents the parameters.
SLAType
Bandwidth(Mbps)
Delay(ms)
Jitter(ms)
PacketLoss(%)
MaxEnergy(Watts)
S1 B1 D1 J1 J1 W1
S2 B2 D2 J2 J2 W2
S3 B3 D3 J3 J3 W3
Table 5: Table of Users Requirements.
Considering a network infrastructure comprising devices in which their con-
sumption pro�les are load-proportional (i.e., their network devices present a load
proportional energy consumption behavior), the maximum available bandwidth
becomes a key parameter towards determining the overall power consump-
tion. Therefore, we consider a hierarchy among the di�erent plans, whereas
B1 > B2 > B3. As parameters such as Delay (Di), Jitter (Ji) and Packet Loss
(PLi) relies on the user application, they are con�gured according to application
requirements. The Maximum Energy (W ), represents the number of Watts to be
spent by the user. For instance, if a certain amount of energy is reached, the user
can switch to more restricted SLA in terms of energy consumption, or renewal
policies can be used to increase the number of Watts to be spent automatically.
Figure 16 presents the thresholds for QoS parameters and energy consumption.

65
Energy (Watts)
QoS
(QoS − k)
QoS
(E − k) E
X1 SLA
Best Effort
X2 Warning
X3 SLA V iolation
Figure 16: User's thresholds for QoS and Energy Consumption.
4.2.2 Topology Manager
The Topology Manager (TM) is a critical component in the GreenSDN func-
tioning dealing with nodes and ports management, and installing or removing
�ows whenever a change is required by the control plane. It also de�nes switches
and port states (e.g. standard operation mode, sleep, active ALR or SC) being
a useful input for the Power Manager to calculate the energy being consumed
at a certain point in time. Furthermore, the TM provides network information
to the QoS Services component, such as hosts location and paths) and enforces
topology changes that may be required by SustNMS. Also, it comprises two main
functionalities: a) building a schematic description of the network modeling it as
a graph, and b) installing/modifying forwarding rules to pre-de�ned users.
A schematic network view (network graph) is built by intercepting messages
triggered by a standard discovery component (provided by the POX controller)
at the control-plane the LLDP (Link Layer Discovery Protocol)1. In addition to
the user QoS information, GreenSDN requires user network information as input
such as the node and port to which the user is connected, and IP/MAC addresses.
1LDDP (Link Layer Discovery Protocol): messages to discover links between the OpenFlowswitches.

66
Based on this information, forwarding rules are reactively installed whenever a
workload is sent.
4.2.3 QoS Services
The QoS Services are responsible for collecting and for providing network
statistics. To query information from nodes regarding �ows and ports usage, the
message OFPT_FEATURES_REQUEST is used to request the properties of
OFPC−FLOW−STATS and OFPC−PORT−STATS. These are messages of
the OpenFlow protocol used to respectively request statistics of �ows and ports
of a particular node. However, there are several ways to request data plane
information. In this regard, subsection 4.2.3.1 presents a strategy to optimize the
query for node's statistics. Subsection 4.2.3.2 show how per-user statistics are
collected.
4.2.3.1 Dynamic Polling
A straight polling of all nodes (i.e., request for statistics at a �xed time
interval) albeit precise, has the potential to generate signi�cant amounts of control
tra�c and consequently to increase overall network energy consumption. It can
be addressed similarly to Adrichem, Doerr, Kuipers (2014) and Chowdhury et
al. (2014) , by adapting the polling time interval and the number of nodes in the
"query-list". Initially, to detect incoming workload, only edge-nodes are queried
at a �xed time interval. Based on Adrichem, Doerr, Kuipers (2014) , according
to the throughput, the polling time interval can be decreased (down to a lower
bound time) or increased (up to an upper bound). The result was based on the
RNP topology (presented in the Experimental Evaluation in Chapter 5) can be
observed in Figure 17.
As the topology contains seventeen nodes and four border nodes (with hosts

67
Figure 17: Adaptive polling vs straight polling.
connected), a simple measurement without workload presents the di�erence
between the number of messages requested to the data plane using a straight
polling and the adaptive polling. Once a workload is detected, nodes in the path
are also queried. Paths are obtained either from the initial �ow instantiation
or from the SustNMS output, in case it is active. Also, based on the historical
usage of �ows, it is possible to increase the expiration time from individual �ows
that are more frequently utilized to optimize the �ow-tables (a problem known
as �nding Hierarchical Heavy Hitter �ows, explored in (JOSE; YU; REXFORD,
2011)).
4.2.3.2 Collecting Per-User QoS Statistics
To precisely match user packets and account for network statistics a sim-
ple MAC-based �ows instantiation is used. However, this has the potential to
�ood �ow-tables since if there are N active users in the network, it is possible
to have N2 �ows. Therefore, based on prior knowledge of user routes, it is pos-
sible to use two distinct rules to forward �ows. One particular for edge nodes,
specifying source and destination MAC address, i.e., if there are source and des-

68
tination MAC addresses, then forward to an out_port), and other less speci�c
for interconnection nodes (specifying only the target MAC).
Moreover, to proportionally account, the network statistics is required to
count the number of shared nodes between the users. Once power models are
represented by a �xed (CPU, memory, fans) and variable (interfaces) parts, it is
required to 'split' the �xed power consumption parts among users sharing that
node. By crossing the paths of active users, it is possible to account for shared
nodes. Thus, to keep track of the common nodes (i.e., nodes being used by
multiple active users), a dictionary of counters is maintained. Once a user is
active, nodes in his/her path are incremented, otherwise decremented.
To obtain QoS parameters such as Delay and Jitter probe packets are injected
using the OpenFlow capabilities. The delay is measured by calculating the di�e-
rence between the packet departure and arrival times, subtracting the estimated
latency from the switch-to-controller delays. Whenever a workload is detected
for each user, and given the prior knowledge of their active routes, probe packets
with a timestamp in their payload are injected to the destination.
4.2.3.3 Delay
Upon the packet arrival, another time-stamp is used to compare with the
payload. Then, the switch-to-controller delay is estimated by determining its
RTT (Round-Trip Time) injecting packets that are immediately returned to the
controller, dividing the RTT by two to account for the bi-directionality of the
given answer. The total path delay is given by: tdelay = (tarrival − tsent −12(RTTs1 + RTTs2)). Despite creating additional tra�c (OpenFlow 1.0 does not
allow to tag packets), injecting probe packets is the most certain strategy to infer
the path delay in OpenFlow 1.0 without external instrumentation. Figure 18
illustrates the delay measurement strategy.

69
RTT 1 (ms)
Payload:tSent(ms)
Sw 1 Sw NSw ...
RTT 2 (ms)GreenSDN
Inject probe-packetIntercept probe packet
tArrival (ms)
Figure 18: Delay measurement with OpenFlow 1.0.
4.2.3.4 Jitter
Jitter is obtained by calculating the absolute value of the di�erence between
consecutive samples of delay. Given at least two delay samples delay =
[ti, ti+1, ...., tk], jitter is calculated as the average of absolute values ofTk∑t=1
(ti −
ti+1) + (ti+1 − tk) in a period of measuring time.
4.2.3.5 Packet Loss
Per-�ow packet loss is estimated by polling �ow statistics from the source and
the destination node of each path. It follows the delay probe-packet using control
�ags to detect when to subtract polling statistics from destination and source.
When the packet is sent, a �ag is marked. Upon the arrival at its destination,
another �ag is marked, and when both are marked the packet loss is calculated.
This is done by subtracting the increase of the source switch packet counter from
the increase of the packet counter of the destination switch.

70
4.2.4 Power Emulation
Virtual switches such as OVS have no capabilities to provide power consump-
tion information be it at the port level or at the overall process level. As the SDN
controller has an inventory of all switches in the network, the environment ap-
plies a power management application (Power Emulation) using power models as
a way to parameterize energy consumption by the network utilization. Two types
of power pro�les were de�ned (in Chapter 2) to simulate real equipment: a load
proportional (AdaptivePower), which is more energy e�cient and desirable, and
a constant (StaticPower), more common in legacy equipment, with a constant
energy consumption independent of the workload.
Based on measurements and on values described in (JANUARIO et al., 2013;
RICCA et al., 2013; RICCIARDI et al., 2011) the functions described in Equati-
ons (4.1) and (4.2) were considered for powered and sleeping nodes, respectively.
The Powerchassis energy consumption is 200 Watts when the node is active, whe-
reas when internal components are powered o� it is 120 Watts. Energy consump-
tion from interfaces is given by the fraction(50030
)Watts varying according to the
workload.
PPon = 200 +
(500
30
)∗ workload (4.1)
PPsleeping = 120 (4.2)
The power model for active nodes is combined with ALR savings (15%), as
presented in Equation (4.3). For SC, the power model with the time is on or off
as described by (MOSTOWFI; CHRISTENSEN, 2011) in Equation (4.4).

71
PPALR = PPon − 15% (4.3)
PPSC = PPsleeping ∗(
tOn
DutyCycle− tOn
)+ PPon ∗ tOn (4.4)
4.2.5 Per User Energy Measurement
The energy measurements module calculates the energy consumption and
savings from users considering the node states to apply a particular power model,
and the user workload. Information on current workload and path are received as
input from the QoS Services module. Then, the component checks the states of
nodes in the user path, applying a particular power model. Energy consumption
and savings are calculated based on the following models:
PP ′on =
(200
NumUsers
)+
(500
30
)∗ UserWorkload (4.5)
PP ′sleep =
(120
NumUsers
)(4.6)
PP ′ALR = PP ′
on − 15% (4.7)
PP ′SC = PP ′
sleep ∗(
tOn
DutyCycle− tOn
)+ PP ′
on ∗ tOn (4.8)
Considering that several users can share the same nodes, their consumption
can be obtained by splitting the �xed2 consumption part among users sharing the
node. In this regard, Equation 4.5 is applied when a node is active, Equation 4.7
when ALR or SC is being used. To measure the energy consumed by a user,
the following models are considered:
2Representing the internal components such as the forwarding engine.

72
Ac (W ) =
Nswitches∑i=1
PP ′on (Wuser)(4.9)
Bc (W ) =
Nswitches∑i=1
PP ′(ALR or SC) (Wuser)(4.10)
Cc (W ) =
Nswitches∑i=1
PP ′sleep(4.11)
Dc (W ) = A+B + C(4.12)
Ac: consumption from nodes powered on
Bc: consumption from nodes enforcing ALR or SC
Cc: consumption from nodes sleeping
In Ac the energy consumed from active nodes is obtained. Bc calculates the
number of Watts consumed from nodes applying either ALR or SC. Cc returns
the Watts consumed for sleeping nodes. As SustNMS requires concentrating the
tra�c on a certain path while unused nodes are put to sleep, energy savings from
a�ected users are obtained from nodes in sleep mode. In the last step, Dc performs
the sum of the user's consumption. Savings per user is achieved by comparing
their consumption with the maximum workload allowed in the network (Wmax).
Energy savings per user is measured as follows:
As (W ) =
Nswitches∑i=1
PP ′on(Wmax)−Ac(4.13)
Bs (W ) =
Nswitches∑i=1
PP ′on(Wmax)−Bc(4.14)
Cs (W ) =
Nswitches∑i=1
PP ′on(Wmax)− Cc(4.15)
Ds (W ) = A+B + C(4.16)
S (%) = (Ds ∗ 100)/Ds(4.17)
As: savings nodes powered on
Bs: savings nodes enforcing ALR or SC
Cs: Savings nodes sleeping
Ds: Sum of savings
The di�erence between the energy saving models and the energy consumption
models is the consumption with the user workload subtracted from the consump-
tion of the maximum workload used as a reference. To illustrate the operation of
the module, Algorithm 1 presents the consumption measurements.

73
Algorithm 1: Algorithm to calculate the energy consumed and saved byusers.Input: active_hosts ←− dictionary of active usersInput: sharedNodes ←− dictionary of shared nodesOutput: Energy consumed (W) and savings (%) per user
1 begin/* Loop active users */
2 for each user ∈ active_hosts:/* Loop nodes in the user path */
3 for each node ∈ user.path:/* Calculate the Energy Consumed */
4 Ac ←− user.workload, node, sharedNodes5 Bc ←− user.workload, node, sharedNodes6 Cc ←− user.workload, node, sharedNodes
/* Calculate the Energy Saved */
7 As ←− user.workload, node, sharedNodes8 Bs ←− user.workload, node, sharedNodes9 Cs ←− user.workload, node, sharedNodes
/* Sum of the energy consumed */
10 Dc ←− Ac +Bc + Cc/* Sum of the energy saved */
11 Ds ←− As +Bs + Cs/* Percentage of the energy saved */
12 S ←− Ds ∗ 100/Ds
/* Store the result */
13 energyCS[user]←− [Dc, S]
14 Return energyCS
4.2.6 Energy E�ciency Capabilities
This Section presents implementation details of the energy e�ciency capa-
bilities. ALR is presented in Subsection 4.2.6.1, SC in Subsection 4.2.6.2, and
SustNMS in Subsection 4.2.6.3.
4.2.6.1 Subsystem Scope: Adaptive Link Rate
The ALR capability uses a policy and a mechanism to adjust the link rate.
The policy decides when to change the link rate and the mechanism e�ectively
switches the rate. As originally proposed by the author's, mechanisms and policies

74
should be inherent to the network device. However, as we use standard OVS
(Open vSwitch) nodes, and OVS does not provide native support for changing
link rates, a di�erent strategy has to be implemented to emulate the link rating
capability.
To emulate the link rating functionality, we de�ned parallel links con�gured
with di�erent maximum rates between each pair of nodes, as represented in Figure
19.
“request/responseStatistics”
“modify-state msg”
S1 S2
ALR3
4
GreenSDN
S1 S2
3
4
S1 Flow-Table1: Anything to S2 goes to port 3
S1 Flow-Table1: Anything to S2 goes to port 4
Figure 19: ALR Emulation Scheme. Parallel links with di�erent forwarding rateinterconnecting each pair of nodes.
The standard link (i.e., ALR deactivated) represented by the continuous line
was con�gured with a 30 Mbps maximum rate limit and a parallel link represented
by the dotted line set with 10 Mbps maximum speed. Only one of these links
forwards tra�c at a given point in time. Algorithm 11 presents the mechanism
implementation that switches the links.
The ALR dual threshold policy is implemented inside the Decision Enfor-
cement, which receives requests to enable/disable ALR and determine the best
moment at which to reduce or to increase the link rate. Furthermore, the stan-
dard path was con�gured to use the odd ports of the node, while the alternative
path was set to use the even ports. Every time ALR is enabled, the out_port on

75
Algorithm 2: Mechanism to activate or deactivate ALR in a certain portInput: target_node, target_port ←−Node and port in which ALR will
be activated or deactivatedInput: ALR_command ←−activate or deactivateOutput: OpenFlow message to activate or deactivate ALR
1 begin2 for each node ∈ active_nodes:
/* Search in the set of active nodes the target */
3 if node == target_node:4 for each port ∈ node:
/* Search the targeted port within the node */
5 if node.port == target_port and
port is not attached to host:/* Activate (forward to an even port) or deactivate
(forward to an odd port) ALR */
6 if ALR_command == True and node.port is odd:7 even_port← port+ 18 msg = OpenF lowMsg ← even_port
9 elif node.port is even:10 odd_port← port− 111 msg = OpenF lowMsg ← odd_port
all the rules associated with the node is incremented. The same process is execu-
ted to disable ALR, but decrementing out_port, so that the tra�c is forwarded
to the normal path.

76
4.2.6.2 System Scope: Synchronized Coalescing
The Synchronized Coalescing is a system scope capability demanding the
coordination of all the subsystem scope capabilities in a node. As originally
proposed, SC coordinates the Low Power Idle (LPI) modes at all the interfaces of
a node when it is active and coalesce incoming packets to put internal components
of a node in sleep mode, when a duty cycle is reached coalesced packets are sent
in bursts. However, there is no way to implement LPI without altering the Open
vSwitch functioning, since it does not natively support some capabilities required
by SC, such as the LPI and tra�c bursts.
An alternative for tra�c bursts support would be to use the control plane
to intercept packets when SC is active via Packet-In messages and resend them
in bursts, emulating the bu�er/queuing functionality. Yet it is not feasible since
the controller cannot handle all the data plane tra�c and this would introduce
enormous latency in the network. The approach was adopted to simulate the
energy-related e�ects of SC as an application to the controller based on informa-
tion from the power models, as depicted in Figure 20.
GreenSDN
“ofp_port_stats request/response”
Power ModelsWorkload
ConsumptionSC
Load
P
rop
ortio
nal
ALR
Sleep
EnergyMeasure
ments
Figure 20: Synchronized Coalescing emulated through power models.
Therefore, when the workload in a node is below a certain threshold, its
energy consumption is calculated by a power model. The adaptive part of SC
is implemented as described in Algorithm 13. It aims to check if the number of
packets per second, is higher than a threshold. If so, SC is disabled, and the node

77
operates in the standard mode to handle the incoming workload without losing
packets, while the number of packets per second are still lower than the bu�er
capacity, incoming packets are coalesced to maximize savings.
Algorithm 3: Synchronized Coalescing simulation through power models.Input: set of active nodes, port_statisticsInput: tOn ←− duration of the period with the device active (ms)Input: DutyCycle ←− percentage of cycle time the device must be active
tO� ←− (tOn / DutyCycle) - tOnOutput: Nodes with SC on Consumption in Watts
1 begin2 node←− event.connection.dpid
/* Traverse the list of active nodes to check wheter enable or
disable SC */
3 for node in active_nodes:4 port_list←− port_statistics[node]
/* Traverse the list of ports statistics to accumulate the rx
workload */
5 for rx_workload in port_list:6 packets/second←− packets/second+ rx_workload
/* Threshold verification */
7 if packets/second >= qHigh:8 SC[node]←− OFF
9 elif packets/second <= qLow:10 SC[node]←− ON11 WattsON ← power consumption node ON12 WattsSLEEP ← power consumption node SLEEP
/* DutyCycle, 50% on and 50% off */
13 Energy ← WattsON ∗ tOn + WattsSLEEP ∗ tOff

78
4.2.6.3 Network Scope: SustNMS
SustNMS demands the prede�ned routes to be e�cient. The idea of the al-
gorithm is to perform green tra�c engineering considering all the �ows being
executed at a given moment T , the set of alternate routes to be used, and the set
of switches to be in sleep mode based on a set of prede�ned routes. In the context
of GreenSDN, only the forwarding capabilities of SustNMS are required. There-
fore, its architecture was simpli�ed. For instance, the Switch/Router component,
previously designed for SNMP/MIB-based devices, is not necessary once SDNs
decouple the forwarding logic from devices. Figure 21 presents the SustNMS ar-
chitecture within the GreenSDN scope (details in Chapter 4 - GreenSDN Design).
GREENSDN
POLICY MANAGEMENT SYSTEM
MODULES
TOPOLOGY MANAGER
UPDATER
MONITORING
LOGIC
Active Paths
SUSTNMS
TRAFFIC LOAD FORECAST
SUSTAINABILITY MONITOR
ENERGYEFFICIENCYEVALUATOR DEVICE UPDATER
POLICY DECISION POINT
QUALITY OF SERVICE MONITOR
AVAILABILITYEVALUATOR
PERFORMANCEEVALUATOR
Network info,SustNMS Policy
Figure 21: SustNMS architecture adjusted to GreenSDN.
In this architecture, SustNMS operates as a component that receives network
information and returns a set of paths to be used. It receives as input prede�ned
routes from GreenSDN de�ning main and alternative routes. The functioning
of the QoS monitor is preserved. However, it receives network information (e.g.
current workload on prede�ned routes) directly from the GreenSDN monitoring
component. Moreover, the input contains high-level policies to be enforced by
SustNMS by the network state. The SustNMS device updater, responsible for

79
setting active paths by SNMP commands, was altered to return the set of current
paths instead of enforcing the routing decision.
4.3 Chapter Final Remarks
This chapter presented the GreenSDN architecture comprising the develop-
ment details of its core modules (i.e., monitoring, topology management) and the
energy saving capabilities. The architecture was inspired by the standard ONF
architecture aiming to provide a separation between the control and management
planes to leverage the development of independent applications and management
strategies based on energy e�ciency capabilities. As an example, the SOS or-
chestration method was deployed on top of the GreenSDN environment.
The energy e�ciency capabilities were designed to operate independently
upon an "enforcement"decision by the Decision Enforcement module3. It receives
network statistics and analyzes which capability to enforce based on prede�ned
rules. In our current deployment, SOS was in charge of the decision about when
(the best moment) and how (one or a combination) to enforce the energy e�ciency
capabilities given a set of policies.
The Adaptive Link Rate (ALR) capability (subsystem scope) was built using
a combination of emulation and simulation. The link rating functionality was
emulated using parallel links (con�gured with di�erent Ethernet rates) intercon-
necting each pair of nodes, and the mechanism to e�ectively change the rating)
was simulated using forwarding policies to route tra�c through an individual link
depending on the current workload. To decide when to change the ALR mecha-
nism, a dual threshold policy (upper and lower thresholds) policy was declared in
the Decision Enforcement module, or, it is activated when required by the SOS
orchestration method.3The �rst version of GreenSDN was published by the author in Rodrigues et al. 2015

80
Syncronized Coalescing, was implemented using a simulation strategy once
it requires the implementation of functionalities not natively supported by Open
vSwitches (OVS), such as packet coalescing, tra�c bursts and the Low Power Idle
(LPI) capability. Energy savings from SC were simulated in the control plane
using power models. The network scope capability, SustNMS, was adjusted from
its original SNMP-based architecture to operate in GreenSDN. However, it still
maintains its main functionalities to �nd the best route given a set of prede�ned
tunnels and a routing policy (performance or sustainability).
The components to collect network statistics and to calculate energy con-
sumption were based on a �ne-grained measurement of statistics. The energy
consumed and saved is calculated using power models describing the behavior
of the network nodes under di�erent circumstances, such as active, sleep mode
and enforcing an energy saving capability. Then, based on mathematical models
the energy being consumed and saved by each user was calculated based on the
network state.
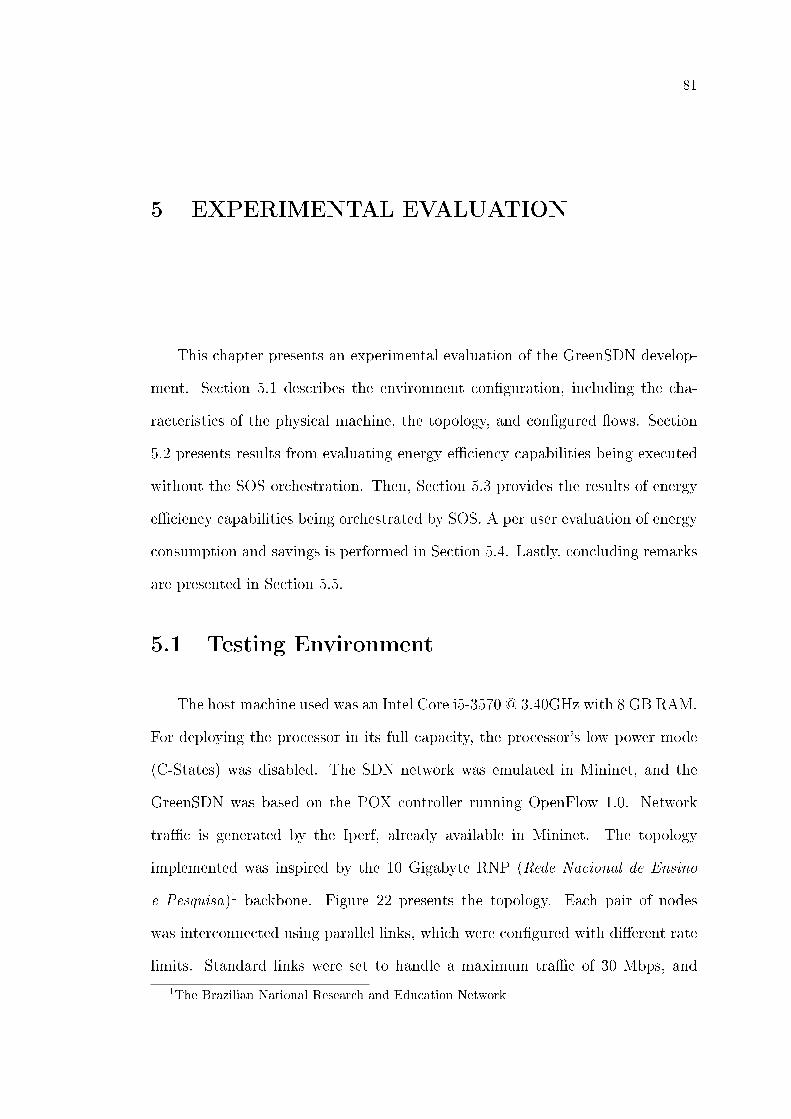
81
5 EXPERIMENTAL EVALUATION
This chapter presents an experimental evaluation of the GreenSDN develop-
ment. Section 5.1 describes the environment con�guration, including the cha-
racteristics of the physical machine, the topology, and con�gured �ows. Section
5.2 presents results from evaluating energy e�ciency capabilities being executed
without the SOS orchestration. Then, Section 5.3 provides the results of energy
e�ciency capabilities being orchestrated by SOS. A per user evaluation of energy
consumption and savings is performed in Section 5.4. Lastly, concluding remarks
are presented in Section 5.5.
5.1 Testing Environment
The host machine used was an Intel Core i5-3570 @ 3.40GHz with 8 GB RAM.
For deploying the processor in its full capacity, the processor's low power mode
(C-States) was disabled. The SDN network was emulated in Mininet, and the
GreenSDN was based on the POX controller running OpenFlow 1.0. Network
tra�c is generated by the Iperf, already available in Mininet. The topology
implemented was inspired by the 10 Gigabyte RNP (Rede Nacional de Ensino
e Pesquisa)1 backbone. Figure 22 presents the topology. Each pair of nodes
was interconnected using parallel links, which were con�gured with di�erent rate
limits. Standard links were set to handle a maximum tra�c of 30 Mbps, and
1The Brazilian National Research and Education Network

82
15 16 14 3
2
17
4
6
5
78910
13 11
12
1
30 Mbps10 Mbps
Edge
Sink
Sink
Source
Source
Figure 22: Topology inspired by the RNP. Figure from (RODRIGUES et al.,2015).
ALR links at 10 Mbps. To send data across the network, GreenSDN considered
two main �ows. From North to South and West to East, placing two Sources in
North extremes and two Sinks in southern extremes. The generation of tra�c
between the hosts was the Iperf tool task, already available in Mininet. In the
experiments, a load proportional Power Pro�le (PP) was used for all nodes based
on (JANUARIO et al., 2013) as described previously (Equations 4.1, 4.2, 4.3 and
4.4).
5.2 Energy E�ciency Capabilities
This Section presents the analytical evaluation of thresholds for the ALR
(Subsection 5.2.1) and SC capabilities (Subsection 5.2.2), followed by emulated

83
evaluation of all three capabilities operating in GreenSDN (Subsection 5.2.3).
5.2.1 ALR Threshold Evaluation
To evaluate ALR policies an analytical solver to activate/deactivate ALR was
considered, based on the dual policies and the single policy. As ALR is con�gu-
red to operate with current Ethernet rates, the main threshold was con�gured
with a 10 Mbps rate and two auxiliary thresholds qHigh and qLow respectively
con�gured with 11 and 9 Mbps. Thus, when the incoming workload is below
qLow the ALR is activated, and it is deactivated if and only if the workload ex-
ceeds qHigh; likewise, the same occurs when the workload is above qHigh. The
single threshold policy is a simple threshold in which ALR can be activated or
deactivated. We evaluate both policies to contrast the di�erence between both
implementations.
The experiment considered four di�erent workloads varying (increasing) the
number of samples, in which each run was con�gured to 30 seconds. By increasing
the number of samples per second, highlighting the relevance of the dual threshold
policy against the single threshold policy is expected. In the scenarios a) and
b) of Figure 24, ten samples (calls to the de�ned function) for 30 seconds of
the experiment were generated, which was equivalent to 0.33 workload samples
per second. As a result, the experiment a) presented low workload variation
performing only four transitions of the ALR mechanism for both policies, and
thus a good scenario using the single threshold policy (scenario b) due to the low
workload variation.
The number of transitions represents the number of times in which the ALR
capability is activated or deactivated.
In scenario b) (Figure 24) the number of samples was duplicated (0.66 samples
per second), and the number of ALR transitions was similar to scenario a) due

84
2 4 6 8 10 12 14 16 18 20 22 24 26 28 30
5
10
15
20ARL Inactive
ARL Active
qHigh
ALR
qLow
Time(s)
Workload(M
bps)
(a) Dual. 10 samples, 4 transitions
2 4 6 8 10 12 14 16 18 20 22 24 26 28 30
5
10
15
20ARL Inactive
ARL Active
ALR
Time(s)
Workload(M
bps)
(b) Single. 10 samples, 4 transitions
2 4 6 8 10 12 14 16 18 20 22 24 26 28 30
5
10
15
20ARL Inactive
ARL Active
qHigh
ALR
qLow
Time(s)
Workload
(Mbps)
(c) Dual. 20 samples, 5 transitions
2 4 6 8 10 12 14 16 18 20 22 24 26 28 30
5
10
15
20ARL Inactive
ARL Active
ALR
Time(s)
Workload
(Mbps)
(d) Single. 20 samples, 8 transitions
Figure 23: ALR analytical dual versus single threshold evaluation using 10 and20 samples
to the randomness of the samples generated, and the number of changes of the
single policy threshold (5 transitions) was slightly higher than the dual threshold
(8 transitions). However, in scenario a) depicted in Figure 24 this di�erence
increases, not as signi�cantly as in the scenario c). With more than two samples
per second (2.66 samples) the di�erence between the dual and single threshold
policies was almost duplicated (22 dual thresholds and 40 single thresholds).
Table 6 presents a summary of the impacts on delay due to the ALR mechanism
considering 20ms delay to adjust the link rating (SCHLENK et al., 2013).
Despite being important to characterize the workload generated, the number
of samples per second does not have a direct relation to the number of ALR
transitions. This because the randomly generated workload may often remain
below or above a certain threshold for some samples in sequence, as it can be

85
2 4 6 8 10 12 14 16 18 20 22 24 26 28 30
5
10
15
20ARL Inactive
ARL Active
qHigh
ALR
qLow
Time(s)
Workload(M
bps)
(a) Dual.40 samples, 12 transitions
2 4 6 8 10 12 14 16 18 20 22 24 26 28 30
5
10
15
20ARL Inactive
ARL Active
ALR
Time(s)
Workload(M
bps)
(b) Single. 40 samples, 18 transitions
2 4 6 8 10 12 14 16 18 20 22 24 26 28 30
5
10
15
20ARL Inactive
ARL Active
qHigh
ALR
qLow
Time(s)
Workload
(Mbps)
(c) Dual. 80 samples, 22 transitions
2 4 6 8 10 12 14 16 18 20 22 24 26 28 30
5
10
15
20ARL Inactive
ARL Active
ALR
Time(s)
Workload
(Mbps)
(d) Single. 80 samples, 40 transitions
Figure 24: ALR analytical dual versus single threshold evaluation using 40 and80 samples
Scenario SamplesSamples/Second
LatencySamples/Second
PolicyNum.
TransitionsAggregatedLatency
A 10 0.33 20msDual 4 80msSingle 4 80ms
B 20 0.66 20msDual 5 100msSingle 8 160ms
C 40 1.33 40msDual 12 240msSingle 18 360ms
D 80 2.66 60msDual 22 440msSingle 40 800ms
Table 6: Estimated impact of ALR transitions on latency.
observed in Figure 24 scenarios a) and c). However, as observed in Table 6,
the number of transitions has a direct impact on the latency to adjust the link
rating. For the analytical evaluation the reference value per change of 20ms was
considered; yet in GreenSDN this value might be signi�cantly higher due the
simulation of the ALR policies in the control plane, and the emulation of the

86
ALR mechanism in the data plane (with parallel links). Switching the link rate
implies adding the monitoring latency and e�ectively switching the forwarding
rule in the data plane, which according to Schlenk et al. (2013) may increase the
latency to the level of network capabilities (ranging from 400ms to 1s).
5.2.2 SC Threshold Evaluation
Similarly to ALR, an analytical solver was adopted to activate/deactivate
SC including the dual threshold approach. The experiment considered a function
F (x) = Ax+C with x as a random number between -1 and 1. SC dual thresholds
were de�ned as 5 Mbps for the main SC threshold, and 6 Mbps for qHigh and 4
Mbps for qLow. Therefore, A and C constants were de�ned as A = 3 and C = 4.
Figure 25 presents a SC evaluation.
(a) 10 samples (b) 20 samples
(c) 40 samples (d) 80 samples
Figure 25: SC threshold evaluation using workload F(x) = 3x+4 in which x is arandom number between -1 and 1.

87
As the dual threshold has proven to be a more e�cient strategy than the
single threshold, the same strategy was implemented in SC. Furthermore, the
main di�erence between the ALR and SC experiment is how energy consumption
is calculated when SC is active with the DutyCycle. As SC was simulated instead
of emulated, its functioning in GreenSDN, becomes simpler.
SamplesSamples/Second
LatencyLow Power
IdleTransitions
LatencyBackgroundTra�cBu�ering
PolicyNum.
TransitionsAggregatedLatency
10 0.33 25ms 20us Dual 2 50ms
20 0.66 25ms 20us Dual 5 125ms
40 1.33 50ms 20us Dual 9 225ms
80 2.66 75ms 20us Dual 14 350ms
Table 7: Estimated impact of SC transitions on latency.
5.2.3 Individual Evaluation of Capabilities in GreenSDN
The results in (RODRIGUES et al., 2015), showed the energy consumption for
two runs with di�erent workloads to three capabilities and the baseline consump-
tion (without savings). Table 8 presents the settings used in the experiments.
RunTime(s)
Workload(Mbps)
Path
1 90 10[15-16-14-7][1-14-10-13-12]
2 90 30[15-16-14-7][1-14-10-13-12]
SC Con�gurationtOn(ms) 11 (MOSTOWFI; CHRISTENSEN, 2011)
DutyCycle(%) 50
Table 8: Settings of the energy e�ciency capabilities experiment.
Since SC and ALR are capabilities intended to operate with lower workloads
(equal or less than 10 Mbps), the �rst run was con�gured to send two �ows at
10 Mbps. The second run, sending 30 Mbps, was chosen to verify the SustNMS
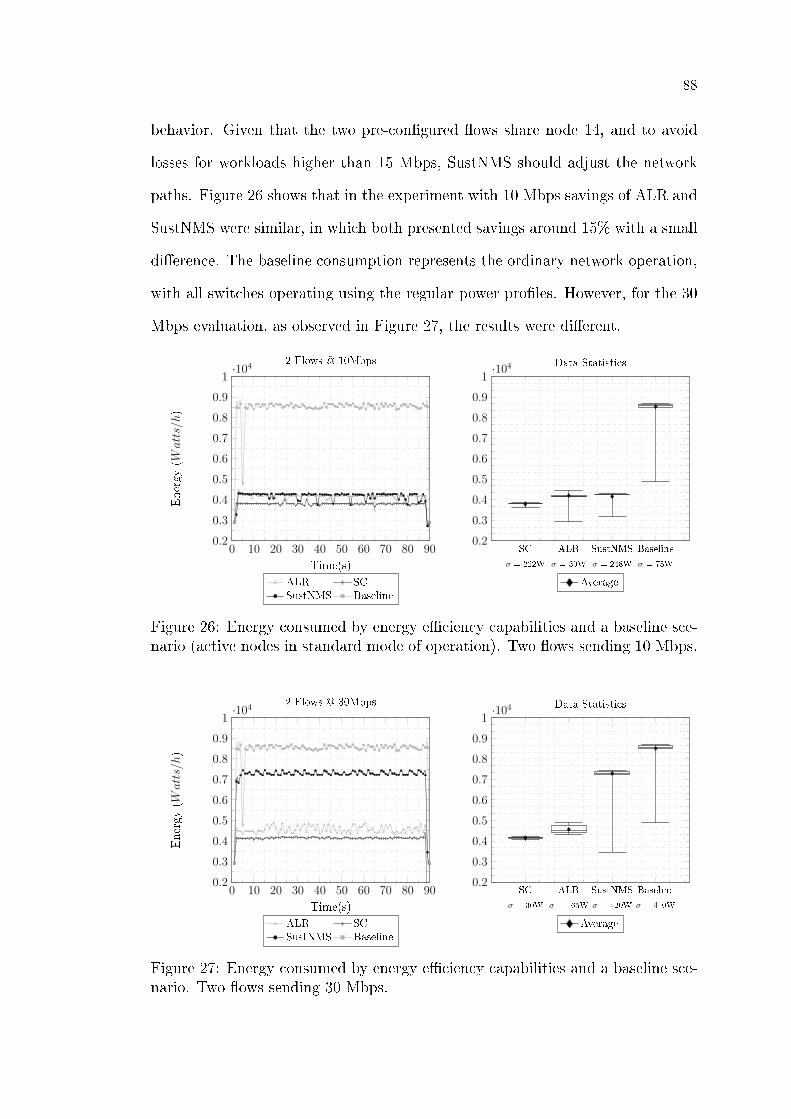
88
behavior. Given that the two pre-con�gured �ows share node 14, and to avoid
losses for workloads higher than 15 Mbps, SustNMS should adjust the network
paths. Figure 26 shows that in the experiment with 10 Mbps savings of ALR and
SustNMS were similar, in which both presented savings around 15% with a small
di�erence. The baseline consumption represents the ordinary network operation,
with all switches operating using the regular power pro�les. However, for the 30
Mbps evaluation, as observed in Figure 27, the results were di�erent.
0 10 20 30 40 50 60 70 80 900.2
0.3
0.4
0.5
0.6
0.7
0.8
0.9
1·104
Time(s)
Energy(W
atts/h)
2 Flows @ 10Mbps
ALR SCSustNMS Baseline
SC
σ = 222W
ALR
σ = 30W
SustNMS
σ = 248W
Baseline
σ = 75W
0.2
0.3
0.4
0.5
0.6
0.7
0.8
0.9
1·104 Data Statistics
Average
Figure 26: Energy consumed by energy e�ciency capabilities and a baseline sce-nario (active nodes in standard mode of operation). Two �ows sending 10 Mbps.
0 10 20 30 40 50 60 70 80 900.2
0.3
0.4
0.5
0.6
0.7
0.8
0.9
1·104
Time(s)
Energy(W
atts/h)
2 Flows @ 30Mbps
ALR SCSustNMS Baseline
SC
σ = 30W
ALR
σ = 165W
SustNMS
σ = 420W
Baseline
σ = 410W
0.2
0.3
0.4
0.5
0.6
0.7
0.8
0.9
1·104 Data Statistics
Average
Figure 27: Energy consumed by energy e�ciency capabilities and a baseline sce-nario. Two �ows sending 30 Mbps.

89
Aware of links capacity, SustNMS modi�ed the routing for workloads gre-
ater than 15 Mbps to avoid losses due to �ows sharing switches, such as node
14 of Figure 22. For workloads smaller than 15 Mbps, the 10 Mbps evaluation,
SustNMS maximized the savings concentrating tra�c on the de�ned �ows. Con-
sidering that ALR is intended for Ethernet speeds, and working with 30 Mbps
link capacity, the experiment operated as expected. ALR presented savings in 10
Mbps and massive packet losses in 30 Mbps evaluation (65%). The SC capability
was the most aggressive functionality regarding savings; in the evaluation it was
con�gured with a DutyCycle of 50%, meaning that nodes were 50% of the time on
and 50% o�; also the packet threshold (1000 packets/second) and bu�er capacity
were con�gured with a maximum of 80 packets.
5.3 SOS Orchestration of Energy E�ciency Capa-
bilities
Since SOS results were published in (RIEKSTIN et al., 2015c) and demons-
trated with GreenSDN in (RIEKSTIN et al., 2015b), this Section does not detail
the functioning of the SOS orchestration. Figure 28 consolidates the energy con-
sumption results for two �ows sending workloads of 10 Mbps and 20 Mbps for 90
seconds.
Since the SOS decision trees determine a combination of capabilities to be
enforced in response to a given workload, energy consumption results were com-
pared with the same workloads without SOS. In 10 Mbps run the combination
selected by SOS was SustNMS-S2 and ALR. While SustNMS-S concentrated �ow
and deactivated unused nodes, ALR adjusted the link rate in �ows being used.
The di�erence in enforcing ALR in conjunction with SustNMS can be observed
by contrasting a baseline against SustNMS-S without ALR. Figure 29 presents
2SustNMS could be activated in two di�erent ways. SustNMS-S, which concentrates �ows,and a SustNMS-P, which spread �ows over distinct paths to avoid losses.

90
0 10 20 30 40 50 60 70 80 900.2
0.3
0.4
0.5
0.6
0.7
0.8
0.9
1·104
Time (s)
Energy(W
atts/h)
SOS- 2 Flows
SustNMS-S+ALR @10 MbpsBaseline @10 MbpsSustNMS-S @10 MbpsSustNMS-P @20 MbpsBaseline @20 Mbps
SustNMS+ALR
σ=132W Su
stNMS
σ=248W
Baseline10Mbps
σ=11W
Baseline20Mbps
σ=11W
SustNMS20Mbps
σ=11W
0.2
0.3
0.4
0.5
0.6
0.7
0.8
0.9
1·104 Data Statistics
Average
Figure 28: Energy consumption of capabilities orchestrated by SOS.
both SustNMS-S and SustNMS-P operation.
Figure 29: GreenSDN Topology Viewer. SustNMS-S + ALR (left) and SustNMS-P (right).
For workloads greater than 15 Mbps the SOS choose the SustNMS-P to avoid
losses. The energy consumption of the 20 Mbps run was compared to a baseline
energy consumption. SustNMS-P and the baseline present a similar energy con-
sumption. However, the di�erence was that SustNMS-P still deactivates unused
paths, as observed in SustNMS-P in Figure 29 (gray nodes were in sleep mode).

91
5.4 Per User Energy Consumption and Savings
Settings to perform user measurements are presented in Table 9. The expe-
riment considered four users based on three SLAs, one user for full performance,
one for an intermediary (midterm between performance and economy), and two
users based on the economic SLA (greener SLA).
Links were con�gured to handle a maximum of 30 Mbps load, the maximum
reachable workload for each SLA was divided among users to provide a 100% of
link utilization in case of four users sharing the same path. Considering a 100%
of link utilization, it is possible to observe the e�ects caused by the QoS levels,
as well as the decisions enforced by SOS in two scenarios. Figure 30 presents the
scenarios.
UserWorkload(Mbps)
Scenario APath
Scenario BPath
Time(s)
Performance 15 [15-16-14-7] [1-14-7] 30Intermediary 9 [15-16-14-7] [15-16-14-7] 30Economy A 3 [15-16-14-7] [15-16-14-10-13-12] 30Economy B 3 [15-16-14-7] [15-16-14-10-13-12] 30
Table 9: Settings to evaluate the energy consumed and saved by users.
Figure 30: Scenarios A and B, and capabilities selected by SOS. Scenario A (left)with users sharing the same path. Scenario B (right) users in distinct paths.
Besides presenting the scenarios for the experiment, Figure 30 shows the
capabilities selected by SOS. In Scenario A (Figure 30 left), the users forward

92
data using the path [15-16-14-7] to Sink 7. As the aggregated workload on the
path varied around 30 Mbps, SustNMS-S is the best decision to optimize the
network. In Scenario A, it is interesting to observe the side e�ects on QoS values
due to using 100% of the link capacity.
In Scenario B (Figure 30 right) it is interesting to evaluate the SOS behavior
when users forward data using distinct paths. In case of the Performance user
data from Source 1 was forwarded to Sink 7 using the path [1-14-7]. For an
intermediary user it was con�gured with the same path as in Scenario B. Finally,
for Economy data was forwarded using [15-16-14-10-13-12] to Sink 3. Results for
both scenarios are depicted in Figure 31.
0 10 20 30 40 50 60 70 800
200
400
600
800
1,000
1,200
1,400
1,600
Consumption Reference Wmax
Scenario A
Savings 23%
Savings 33%
Scenario B
Savings 20%
Savings 38%
Time (s)
Energy(W
atts/h)
Energy Consumed and Saved by Users
Performance @ 15Mbps Intermediary @ 9MbpsEconomy A @ 3Mbps Economy B @ 3Mbps
Performance
σ = 153.5W
Intermediary
σ = 124.9W
Economy
σ = 63.1W
0
200
400
600
800
1,000
1,200
1,400
1,600Data Statistics.
Average
Figure 31: Energy consumed by users in scenarios A and B.
Since the aggregated tra�c did not allow applying neither ALR or SC,
SustNMS-S was enforced by SOS to concentrate the tra�c and put unused no-
des into sleep mode. Hence, the energy consumed by all users in Scenario A
was proportional to their network usage. Energy savings were calculated taking
into account the nodes in sleep mode (savings were distributed among users),
and a comparison with the energy consumed by a reference user con�gured the
maximum bandwidth allowed (Wmax).
In Scenario B, as distinct routes were used, individual decisions were enforced.

93
Even though here the user's consumption was lower than in Scenario A, the overall
network consumption was higher because more nodes were active. For instance,
despite consuming more energy, the Intermediary user had lower savings than
in Scenario A. As more nodes were activated, the lower was the distribution of
savings from deactivated nodes. However, this was di�erent for the Economy
users because of the enforcement of SC+ALR in nodes 10, 13 and 12. Figure 32
presents the QoS statistics for both scenarios.
0 10 20 30 40 50 60 70 80 900
50
100
150
200
250
300
350
400
450
500
550
600
Scenario A
Scenario B
Time(s)
Delay
(Ms)
End-to-end Delay
PerformanceIntermediary
Economy (x2)
0 10 20 30 40 50 60 70 80 900
5
10
15
20
Scenario A
Scenario B
Time (s)
Jitter(M
s)
Jitter
PerformanceIntermediary
Economy (x2)
0 10 20 30 40 50 60 70 80 900
5
10
15
20
Scenario A
Scenario B
Time (s)
Loss
(%)
Packet Loss
PerformanceIntermediary
Economy (x2)
Figure 32: QoS Statistics for Scenarios A and B.
Side e�ects of link utilization and the queue bu�er con�gured in 1000 packets
size are presented in Figure 32. As users were con�gured with the same path,
their statistics were similar to those in Scenario A. When a node is unable to
forward packets immediately, and it starts to queue them. When a queue is
saturated, packets are dropped. Furthermore, the higher the queue utilization,
the higher the delay to forward packets was. This is the situation presented in
Scenario A with all hosts con�gured with the same path and nearing 100% of link
utilization. However, the opposite is observed for Scenario B, in which di�erent
routes were con�gured for the di�erent users, and thus the nodes/links were not
oversubscribed.
5.5 Chapter Final Remarks
This chapter presented an evaluation of the main aspects of GreenSDN, such
as the energy e�ciency capabilities. The �rst part presented an evaluation of th-

94
reshold approaches (or policies) for ALR and SC to reduce errors when enforcing
a capability due to workload variations. Two policies were evaluated: single and
dual threshold. While the single threshold policy presents a simpler implementa-
tion through a basic if-then-else code, it was not as precise as the dual threshold
when it comes to environments with highly varying workloads. For both ALR
and SC, the number of capabilities activation/deactivation was signi�cantly lower
with the dual rather than the single threshold as the number of samples incre-
ased during the experiment, which, induces a lower adjustment latency in the
network. Thus, the dual threshold technique was adopted to control the ALR
and SC activation/deactivation.
During the capabilities evaluation presented in Subsection 5.2.3, the dual
threshold policy was not e�ective due the constant workloads generated by the
use of Iperf. Either the dual or the single threshold policies would present the
same performance as there was no workload variation. However, the evaluation
was e�ective to show how the selected capabilities performed under the di�erent
workloads, for instance, during the 10 Mbps evaluation the SC capability presen-
ted the highest energy savings, but due to its amount of activation/deactivation
(DutyCycle con�gured in 50% on/o�), it was not the best capability for workloads
greater than 5 Mbps.
By using analytical solvers, in a similar approach, the SOS method discovers
whether a single or a combination of capabilities are more energy e�cient in a
certain network condition without compromising the quality of service. Results
of combining SOS and GreenSDN were presented in Subsection 5.3 and published
in (RIEKSTIN et al., 2015c), proving that SOS is more e�cient than applying
the capabilities separately.
As a way to provide di�erent levels of green services based on the energy
saving capabilities and the SOS orchestration method, the GreenSDN architec-

95
ture was modi�ed to calculate the energy consumed and saved per user in the
network. Subsection 5.4 presented the an evaluation comprising four users with
di�erent requirements in terms of energy consumption, using the RNP-based to-
pology. In addition, these changes in the GreenSDN architecture were presented
in (RODRIGUES et al., 2016). In this sense, the tests considered two di�erent
cases to evaluate energy consumption and savings of these users providing useful
information for orchestration components to organize the network more e�ciently.

96
6 CONCLUDING REMARKS
To handle a massive number of data, network infrastructures have been de-
signed considering high-performance and high-availability requirements. In these
network infrastructures, the inadvertent use of energy saving mechanisms may
compromise performance and availability parameters and strike a balance between
e�ciency and QoS provided by these networks. Given that it is critical to have
experimental network platforms, which enable and facilitate network innovation
allowing researchers to design and to evaluate novel approaches regarding sustai-
nability, and more speci�cally energy e�ciency guaranteeing precise and reliable
network adjustments without compromising loss of QoS. Based on this context,
GreenSDN was proposed.
GreenSDN aims to leverage green networking providing a network platform
comprising energy e�ciency capabilities as a baseline towards the development of
applications and management strategies. To attain these goals, this work was de-
veloped taking as a basis di�erent steps of a methodology, the main contributions
of which are listed below:
1. Literature Review and Analysis: this step involved the elaboration of
Chapters 2 and 3 of this thesis providing the theoretical basis for its Design
and Development stage.
• Chapter 2: presented an overview of approaches to obtain energy
e�ciency in network infrastructures and a table summarizing di�erent

97
energy e�ciency capabilities based on such approaches. The main con-
tribution of this chapter is categorizing energy e�ciency capabilities
according to their approaches and network scope, which is important
to understand how and where a particular capability operates in the
network. Therefore, this categorization serves as a guide to unders-
tanding approaches to save energy in networks.
• Chapter 3: using the same approach of Chapter 2, it introduced
network platforms that could be used as the basis for GreenSDN deve-
lopment and concepts related to network management and SDN. The-
refore, its main contribution is the evaluation of network platforms
according to criteria established in the literature, such as hardware
requirements and scalability. Thus, it is a useful input towards evalua-
ting a target network platform according to the desired characteristics.
For instance, to deploy GreenSDN we considered a network emulation
platform that is open source and provides fast deployment of network
experiments.
2. Design and Development: the main step in the methodology was the
technical solution to meet our goal regarding the creation of a testbed for
experimenting energy e�ciency network capabilities, as described in Chap-
ter 4.
• Chapter 4: introduced the GreenSDN architecture and its main com-
ponents detailing how each component relate to each other. The ar-
chitecture was based on the ONF (Open Network Foundation) SDN
aiming to provide a separation between the control and management
planes to leverage the development of independent applications and
management strategies based on energy e�ciency capabilities. The
main contribution of this Chapter was the architecture and its techni-
98
cal description.
3. Evaluation: the experimental evaluation of GreenSDN was described in
Chapter 5.
• Chapter 5: presented an evaluation simulating thresholding techni-
ques for activating/deactivating of ALR and SC in which the dual
thresholding method was the most e�cient for high workload varia-
tion; an individual evaluation of capabilities in GreenSDN using the
Iperf tra�c generator in which it was possible to observe the beha-
vior of each capability under a particular workload; an assessment of
GreenSDN being orchestrated by SOS; and the per-user evaluation in
order to verify the models and monitoring components to collect per-
user statistics. In addition to the Design and Development stage, this
Chapter contributes with the evaluation of the architecture and the
energy e�ciency capabilities.
In this regard, GreenSDN was able to meet its primary goal providing the
basis for developing and enforcing the SOS orchestration method and Policy-
Based Network Management strategies. As a result, many publications were
possible (as presented in Section 6.1). However, GreenSDN also requires some
improvements to automate basic functionalities and introduces many research
directions (as presented in Section 6.2).
Furthermore, this thesis is the result of the author's collaboration in the pro-
jects Sustainability-Oriented System based on Dynamic Policies with Automated
Policy Re�nement (SOS) and Energy E�ciency to Clouds (E2C) at the Labo-
ratory of Sustainability (LASSU). Both projects were developed in collaboration
with Ericsson Telecomunicações S.A., Brazil, and Ericsson Research Sweden.

99
6.1 Publications
As contributions directly related with this thesis, the following can be men-
tioned:
• 2014 - Short Paper/Published - Riekstin, A.C.; Januario, G.C.; Ro-
drigues, B.B.; Nascimento, V.T.; Pirlea, M. R.; Carvalho, T.C.M.B.; Mei-
rosu, C.. Orchestration of Energy E�ciency Functionalities for a
Sustainable Network Management, in Network Computing and Ap-
plications (NCA), 2014 IEEE 13th International Symposium on, vol., no.,
pp.157-161, 21-23 Aug. 2014.
• 2015 - Experience Paper/Published - Rodrigues, B.B.; Riekstin,
A.C.; Januario, G.C.; Nascimento, V.T.; Carvalho, T.C.M.B.; Meirosu,
C. GreenSDN: Bringing energy e�ciency to an SDN emulation
environment, in Integrated Network Management (IM), 2015 IFIP/IEEE
International Symposium on , vol., no., pp.948-953, 11-15 May 2015.
• 2015 - Demo/Published - Riekstin, A.C.; Rodrigues, B.B.; Januario,
G.C.; Nascimento, V.T.; Carvalho, T.C.M.B.; Meirosu, C., A demons-
tration of energy e�ciency capabilities orchestration in networks,
in Integrated Network Management (IM), 2015 IFIP/IEEE International
Symposium on , vol., no., pp.1149-1150, 11-15 May 2015.
• 2015 - Journal/Published - Riekstin, A. C., Januario, G., Rodrigues,
B.B., Nascimento, V., Carvalho, T., Meirosu, C. (2015). A Survey of Po-
licy Re�nement Methods as a Support for Sustainable Networks,
in Communications Surveys and Tutorials, IEEE, PP, n.99, p.1-1, 2015.
• 2015 - Journal/Published - Riekstin, A. C., Januario, G. C., Rodri-
gues, B. B., Nascimento, V. T., Carvalho, T. C., Meirosu, C. (2015). Or-

100
chestration of energy e�ciency capabilities in networks. Journal of
Network and Computer Applications, pp, n.99, p.1-1, 2015.
• 2015 - Poster/Published - Rodrigues, B.B., Miers, C. C., Carvalho,
T.C.M.B. GreenSDN: an Emulation Environment Towards the De-
velopment of Network Energy E�ciency Capabilities. IV Workshop
de Pos-Graduação da Area de Concentração Engenharia de Computação
(IV WPG-EC). October, 2015.
• 2016 - Paper/Published - Rodrigues, B. B., Rojas, M. A. T., Nasci-
mento, V. T., Carvalho, T. C., Meirosu, C.Green Service Levels in Soft-
ware De�ned Networks. Brazilian Symposium on Computer Networks
and Distributed Systems (SBRC 2016). June, 2016.
• 2016 - Journal/Accepted - Riekstin, A. C., Rodrigues, B. B., Progetti,
Claudia, Nascimento, V. T., Carvalho, T. C., Meirosu, C. Sustainability
Information Model for Energy E�ciency Policies. IEEE Commu-
nications Magazine (COMMAG), Green Communications and Computing
Network Series. To appear.
In addition, the following items were submitted:
• 2015 - Patent/Submitted - Meirosu, C., Rodrigues, B. B., Carvalho,
T. C. M. B, Nascimento, V. T., Riekstin, A. C.Virtual Software-De�ned
Power. PCT/IB2015/055362. Submitted in July, 2015.
• 2016 - Patent/Submitted - Meirosu, C., Rodrigues, B. B., Carvalho,
T. C. M. B, Rojas, M. A. T. Power Manager and Method Performed
thereby for Managing Power of a Datacentre. PCT/SE2016/050686.
Submitted in July, 2016.

101
• 2016 - Patent/Submitted - Meirosu, C., Rodrigues, B. B., Carvalho,
T. C. M. B, Rojas, M. A. T., Pereira, R. M, Sousa, R. M. Network Pre-
diction Driven DVFS. PCT/SE2016/050721. Submitted in July, 2016.
As result of the author undergrad �nal work under the advisor of Professor Dr.
Charles C. Miers, the book chapter entitled "Security Analysis for Cloud Compu-
ting Solutions"was published during the master's period, but not being directly
related to this thesis subject:
• 2014 - Book Chapter/Published - Miers, C. C.; Koslovski, G. P.; Sim-
plicio, M.; Carvalho, T.C.M.B.; Redigolo, F. F.; Rodrigues, B. B.; Barros,
B. M., Gonzalez, N. M.; Rojas, M. A. T.; Iwaya, L. H. Analise de Segu-
rança para Soluções de Computação em Nuvem. Em: Joni da Silva
Fraga, Frank Siqueira, Carlos Alberto Maziero. (Org.). Minicursos / XX-
XII Simposio Brasileiro de Redes de Computadores e Sistemas Distribuidos
(SBRC 2014). 1ed.Porto Alegre/RS: Sociedade Brasileira de Computacao
(SBC), 2014, v. 1, p. 194-243.
6.2 Future Works
Despite providing a baseline environment towards the mitigation of energy
e�ciency aspects, GreenSDN requires improvements on its basic functionalities,
such as forwarding and monitoring. Some potential future works worth being
mentioned are:
• Forwarding and Monitoring: despite providing forwarding and monito-
ring capabilities, GreenSDN still requires further improvements towards the
automation of these core modules, i.e., providing dynamic forwarding and
monitoring capabilities regardless of external topology information. Curren-
tly, forwarding capabilities in GreenSDN requires hosts information (e.g., as

102
node and port to which the host is connected to) for reactively con�guring
�ows, and by extension, the monitoring module relies on this information to
con�gure border nodes and monitored paths. Besides, the development of
automated forwarding and monitoring capabilities are not straightforward.
In this regard, the improvement of such capabilities in GreenSDN is in-
tended as future work. To provide forwarding and monitoring capabilities
regardless of external information about hosts, a spanning tree algorithm
is required. An evaluation in GreenSDN was conducted using a topology
inspired on the Facebook (Alexey Andreyev, 2014)1 data center topology.
However, during the experiments the standard spanning tree algorithm pro-
vided in the POX library did not work as expected. Thus, the improvement
of spanning tree algorithm provided on the POX library is also meant as
future work, possibly replacing its Floyd-Warshall-based packet forwarding
by an implementation based on Kruskall or Prim algorithms.
• GUI Improvements: Also, GreenSDN requires improvements on its GUI,
to display the network topology and its active capability(ies) and the mo-
nitoring information. Currently, the GUI implemented in GreenSDN is a
based on Tkinter2, a standard Python library to build GUIs. However, it
does not provide enough tools in its library to address the dynamicity pre-
sented in GreenSDN. In this regard, the development of a web-based GUI
interface for displaying the network topology is also meant as future work.
• Prediction Engine: based on information collected by the monitoring
and power components, algorithms to forecast energy consumption can
be used to anticipate a network behavior. Instead of reactively adjusting
the network, proactive con�guration of energy e�ciency capabilities can be
made to increase power e�ciency.
1The topology was implemented by the author in (RODRIGUES et al., 2016)2https://wiki.python.org/moin/TkInter

103
Furthermore, this thesis provides a baseline environment towards the research
and development of novel energy management strategies, such as the SOS. The
further investigation of trade-o�s considering the energy e�ciency aspect, and
QoS topics is very important.

104
REFERENCES
ADHIKARI, V. et al. Unreeling net�ix: Understanding and improving multi-cdnmovie delivery. In: INFOCOM, 2012 Proceedings IEEE. [S.l.: s.n.], 2012. p.1620�1628. ISSN 0743-166X.
ADRICHEM, N. L. M. van; DOERR, C.; KUIPERS, F. A. Opennetmon:Network monitoring in open�ow software-de�ned networks. In: IEEE. NetworkOperations and Management Symposium (NOMS). [S.l.], 2014. p. 1�8.
AKARI. New generation network architecture. Citeseer, 2007.
Alexey Andreyev. Introducing Data Center Fabric, the Next-Generation Facebook Data Center Network. [S.l.], 2014. Dispo-nível em: <https://code.facebook.com/posts/360346274145943/introducing-data-center-fabric-the-next-generation-facebook-data-center-network/>.
BARROS, B. et al. Applying software-de�ned networks to cloud computing. In:Simposio Brasileiro de Redes de Computadores e Sistemas Distribuidos. [S.l.:s.n.], 2015. p. 1�54.
BARROSO, L. A.; HÖLZLE, U. The case for energy-proportional computing.Computer, IEEE, n. 12, p. 33�37, 2007.
BIANZINO, A. et al. A survey of green networking research. CommunicationsSurveys Tutorials, IEEE, v. 14, n. 1, p. 3�20, First 2012. ISSN 1553-877X.
BILAL, K. et al. A survey on green communications using adaptive link rate.Cluster Computing, v. 16, n. 3, p. 575�589, 2013.
BILAL, K.; KHAN, S. U.; ZOMAYA, A. Y. Green data center networks:Challenges and opportunities. In: IEEE. Frontiers of Information Technology(FIT), 2013 11th International Conference on. [S.l.], 2013. p. 229�234.
BILALB, S. M.; OTHMANA, M. et al. A performance comparison of networksimulators for wireless networks. arXiv preprint arXiv:1307.4129, 2013.
BOLLA, R. et al. Energy e�ciency in the future internet: A survey ofexisting approaches and trends in energy-aware �xed network infrastructures.Communications Surveys Tutorials, IEEE, v. 13, n. 2, p. 223�244, Second 2011.ISSN 1553-877X.
CARBONE, M.; RIZZO, L. Dummynet revisited. ACM SIGCOMM ComputerCommunication Review, ACM, v. 40, n. 2, p. 12�20, 2010.

105
CHOWDHURY, S. et al. Payless: A low cost network monitoring framework forsoftware de�ned networks. In: Network Operations and Management Symposium(NOMS), 2014 IEEE. [S.l.: s.n.], 2014. p. 1�9.
CHRISTENSEN, K. et al. IEEE 802.3az: the road to energy e�cient ethernet.Communications Magazine, IEEE, v. 48, n. 11, p. 50�56, Nov 2010. ISSN0163-6804.
CIANFRANI, A. et al. An energy saving routing algorithm for a green ospfprotocol. In: IEEE. INFOCOM IEEE Conference on Computer CommunicationsWorkshops, 2010. [S.l.], 2010. p. 1�5.
COOK, G. et al. Clicking Clean: How Companies are Creating the GreenInternet. [S.l.], 2014. Disponível em: <http://www.greenpeace.org/usa/Global/usa/planet3/PDFs/clickingclean.pdf>.
COOK, G. et al. Clicking Clean: A Guide to Building the Green Internet. [S.l.],2015. Disponível em: <http://www.greenpeace.org/usa/wp-content/uploads/legacy/Global/usa/planet3/PDFs/2015ClickingClean.pdf>.
COSTA, C. H. et al. SustNMS: Towards service oriented policy-based networkmanagement for energy-e�ciency. In: SustainIT'12. [S.l.: s.n.], 2012. p. 1�5.
ERICSSON b. Ericsson Energy and Carbon Report - Including Results fromthe First-ever National Assessment of the Environmental Impact of ICT.In: . [s.n.], 2014. Disponível em: <http://www.ericsson.com/res/docs/2014/ericsson-energy-and-carbon-report.pdf>.
FEAMSTER, N.; REXFORD, J.; ZEGURA, E. The road to sdn: an intellectualhistory of programmable networks. ACM SIGCOMM Computer CommunicationReview, ACM, v. 44, n. 2, p. 87�98, 2014.
FERNANDEZ, M. P. Comparing open�ow controller paradigms scalability:Reactive and proactive. In: Advanced Information Networking and Applications(AINA), 2013 IEEE 27th International Conference on. [S.l.: s.n.], 2013. p.1009�1016. ISSN 1550-445X.
FIBRE. Future internet brazilian environment for experimentation. 2016.Disponível em: <https://�bre.org.br/>.
Floodlight. Floodlight OpenFlow Controller. 2015. Disponível em: <http://www.project�oodlight.org/�oodlight/>.
GARG, S. K.; BUYYA, R. Green cloud computing and environmentalsustainability.
GAVRAS, A. et al. Future internet research and experimentation: the �reinitiative. ACM SIGCOMM Computer Communication Review, ACM, v. 37,n. 3, p. 89�92, 2007.
GENI. Global environment for network innovations. Disponível em:<http://www.geni.net/>.

106
GREENBERG, A. et al. A clean slate 4d approach to network control andmanagement. ACM SIGCOMM Computer Communication Review, ACM, v. 35,n. 5, p. 41�54, 2005.
GSN. Greenstar network. 2010. Disponível em: <http://www.greenstarnetwork.com/>.
GUDE, N. et al. Nox: towards an operating system for networks. ACMSIGCOMM Computer Communication Review, ACM, v. 38, n. 3, p. 105�110,2008.
GUNARATNE, C. et al. Reducing the Energy Consumption of Ethernet withAdaptive Link Rate (ALR). Computers, IEEE Transactions on, v. 57, n. 4, p.448�461, Apr 2008.
GUPTA, M.; SOMMERS, J.; BARFORD, P. Fast, accurate simulation for sdnprototyping. In: ACM. Proceedings of the second ACM SIGCOMM workshop onHot topics in software de�ned networking. [S.l.], 2013. p. 31�36.
HELLER, B. et al. Elastictree: Saving energy in data center networks. In:NSDI'10. [S.l.: s.n.], 2010. p. 17�17.
HOLIBAUGH, R. R.; PERRY, J. M.; SUN, L. Phase i testbed description:Requirements and selection guidelines. 1988.
JANUARIO, G. C. et al. Evaluation of a policy-based network managementsystem for energy-e�ciency. In: IEEE. Integrated Network Management (IM2013), 2013 IFIP/IEEE International Symposium on. [S.l.], 2013. p. 596�602.
JOSE, L.; YU, M.; REXFORD, J. Online measurement of large tra�c aggregateson commodity switches. In: Proceedings of the 11th USENIX Conference onHot Topics in Management of Internet, Cloud, and Enterprise Networks andServices. Berkeley, CA, USA: USENIX Association, 2011. (Hot-ICE'11), p.13�13. Disponível em: <http://dl.acm.org/citation.cfm?id=1972422.1972439>.
LANTZ, B.; HELLER, B.; MCKEOWN, N. A network in a laptop: Rapidprototyping for software-de�ned networks. In: Proceedings of the 9th ACMSIGCOMM Workshop on Hot Topics in Networks. New York, NY, USA: ACM,2010. (Hotnets-IX), p. 19:1�19:6. ISBN 978-1-4503-0409-2. Disponível em:<http://doi.acm.org/10.1145/1868447.1868466>.
Linux Foundation. OpenDaylight, a Linux Foundation Collaborative Project.2015. Disponível em: <http://www.opendaylight.org/>.
MAHADEVAN, P.; BANERJEE, S.; SHARMA, P. Energy proportionality ofan enterprise network. In: ACM. Proceedings of the �rst ACM SIGCOMMworkshop on Green networking. [S.l.], 2010. p. 53�60.
MCKEOWN, N. et al. Open�ow: Enabling innovation in campus networks.SIGCOMM Comput. Commun. Rev., ACM, New York, NY, USA, v. 38,n. 2, p. 69�74, mar. 2008. ISSN 0146-4833. Disponível em: <http://doi.acm.org/10.1145/1355734.1355746>.

107
MOSTOWFI, M.; CHRISTENSEN, K. Saving energy in LAN switches: Newmethods of packet coalescing for Energy E�cient Ethernet. In: IGCC'11. [S.l.:s.n.], 2011. p. 1�8.
NS2. The network simulator - ns2. 2016. Disponível em: <http://www.isi.edu/nsnam/ns/>.
NS3. The network simulator - ns3. 2016. Disponível em: <https://www.nsnam.org/>.
OMNET. Omnet discrete event simulator. 2016. Disponível em: <https://omnetpp.org/>.
ONF (Ed.). Open Network Foundation: SDN Architecture Overview. [S.l.], 2013.
PEDIADITAKIS, D.; ROTSOS, C.; MOORE, A. W. Faithful reproduction ofnetwork experiments. In: ANCS'14. [S.l.: s.n.], to be published.
PFAFF, B.; PETTIT, J.; SHENKER, S. Extending networking into thevirtualization layer. In: . [S.l.: s.n.], 2009.
POX. Python-based open�ow controller. 2009. Disponível em: <http://www.noxrepo.org/pox/about-pox/>.
RICCA, M. et al. An assessment of power-load proportionality in networksystems. In: Sustainable Internet and ICT for Sustainability (SustainIT), 2013.[S.l.: s.n.], 2013. p. 1�8.
RICCIARDI, S. et al. Analyzing local strategies for energy-e�cient networking.In: Proceedings of the IFIP TC 6th International Conference on Networking.Berlin, Heidelberg: Springer-Verlag, 2011. (NETWORKING'11), p. 291�300.ISBN 978-3-642-23040-0. Disponível em: <http://dl.acm.org/citation.cfm?id=2039912.2039944>.
RIEKSTIN, A. et al. Orchestration of energy e�ciency functionalities for asustainable network management. In: Network Computing and Applications(NCA), 2014 IEEE 13th International Symposium on. [S.l.: s.n.], 2014. p.157�161.
RIEKSTIN, A. et al. A survey of policy re�nement methods as a support forsustainable networks. Communications Surveys Tutorials, IEEE, PP, n. 99,p. 1�1, 2015. ISSN 1553-877X.
RIEKSTIN, A. et al. A demonstration of energy e�ciency capabilitiesorchestration in networks. In: Integrated Network Management (IM), 2015IFIP/IEEE International Symposium on. [S.l.: s.n.], 2015. p. 1149�1150.
RIEKSTIN, A. C. et al. Orchestration of energy e�ciency capabilities innetworks. Journal of Network and Computer Applications, p. �, 2015. ISSN1084-8045. Disponível em: <http://www.sciencedirect.com/science/article/pii/S1084804515001435>.

108
RODRIGUES, B. et al. Greensdn: Bringing energy e�ciency to an sdn emulationenvironment. In: Integrated Network Management (IM), 2015 IFIP/IEEEInternational Symposium on. [S.l.: s.n.], 2015. p. 948�953.
RODRIGUES, B. et al. Green Service Levels in Software De�ned Networks. In:. [S.l.: s.n.], 2016. p. 1�14.
ROSCOE, T. (Ed.). PlanetLab Phase 0: Technical Speci�cation. [S.l.], 2002.
Ryu. Component-based Software-de�ned Networking Framework. 2015. Disponívelem: <http://osrg.github.io/ryu/>.
SALSANO, S. et al. Information centric networking over sdn and open�ow:Architectural aspects and experiments on the ofelia testbed. Comput. Netw.,Elsevier North-Holland, Inc., New York, NY, USA, v. 57, n. 16, p. 3207�3221,nov. 2013. ISSN 1389-1286. Disponível em: <http://dx.doi.org/10.1016/j.comnet.2013.07.031>.
SCHLENK, R. et al. Taxonomy of dynamic power saving techniques in �xedbroadband networks. In: Photonic Networks, 14. 2013 ITG Symposium.Proceedings. [S.l.: s.n.], 2013. p. 1�8.
SEMERARO, G. et al. Energy-e�cient processor design using multiple clockdomains with dynamic voltage and frequency scaling. In: High-PerformanceComputer Architecture, 2002. Proceedings. Eighth International Symposium on.[S.l.: s.n.], 2002. p. 29�40. ISSN 1530-0897.
SEZER, S. et al. Are we ready for sdn? implementation challenges forsoftware-de�ned networks. Communications Magazine, IEEE, v. 51, n. 7, p.36�43, July 2013. ISSN 0163-6804.
SIATERLIS, C.; GARCIA, A.; GENGE, B. On the use of emulab testbeds forscienti�cally rigorous experiments. Communications Surveys Tutorials, IEEE,v. 15, n. 2, p. 929�942, Second 2013. ISSN 1553-877X.
STEELE, J. Acpi thermal sensing and control in the pc. In: Wescon/98. [S.l.:s.n.], 1998. p. 169�182. ISSN 1095-791X.
SUBRAMANIAN, M. Network management: An introduction to principles andpractice. Addison-Wesley Longman Publishing Co., Inc., 1999.
TROJER, E. et al. Current and next-generation pons: A technical overview ofpresent and future pon technology.
VAHDAT, A. et al. Scalability and accuracy in a large-scale network emulator.ACM SIGOPS Operating Systems Review, ACM, v. 36, n. SI, p. 271�284, 2002.
VERMA, D. C. Principles of computer systems and network management. [S.l.]:Springer, 2009.
109
WANG, S.-Y.; CHOU, C.-L.; YANG, C.-M. Estinet open�ow network simulatorand emulator. Communications Magazine, IEEE, IEEE, v. 51, n. 9, p. 110�117,2013.
WANG, S.-Y.; CHOU, C.-L.; YANG, C.-M. Estinet open�ow network simulatorand emulator. Communications Magazine, IEEE, v. 51, n. 9, p. 110�117,September 2013. ISSN 0163-6804.
WANG, X. et al. A survey of green mobile networks: Opportunities andchallenges. Mobile Networks and Applications, Springer US, v. 17, n. 1, p.4�20, 2012. ISSN 1383-469X. Disponível em: <http://dx.doi.org/10.1007/s11036-011-0316-4>.
WHITE, B. et al. An integrated experimental environment for distributedsystems and networks. In: USENIXASSOC. OSDI02. Boston, MA, 2002. p.255�270.
ZHANG, M. et al. GreenTE: Power-aware tra�c engineering. In: IEEE. NetworkProtocols (ICNP), 2010 18th IEEE International Conference on. [S.l.], 2010. p.21�30.

110
A THE GREENSDN ARCHITECTURE
• Application Plane
Graphical User Interface (GUI): exchange data with the control
plane to display topology information, network status, and obtain user
requirements.
∗ Topology: present the network topology, current energy e�ci-
ency capabilities and state of links;
∗ QoS Charts: build energy and QoS charts based on the Matplot
library.
∗ Hosts Param.: interface to select QoS and energy requirements
(e.g., an amount of Watts to be spent) and send workloads.
∗ Data Parser: communication interface with the control plane. It
send user requirements and receive data regarding network usage
both from users and the network.
• Management Plane
Data Parser: implement a socket to receive and parse information
from the Hosts GUI.
Con�guration Parameters: receive and parse settings both from
SOS and users.
∗ Hosts SLA: update QoS and energy consumption requirements,

111
as well as users network information (i.e., the node and interface
the user is connected); and
∗ Network Settings: receive network settings from SOS (policies,
decision trees), a proactive �ow instantiation, and users policies
and requirements.
SOS Parser: parse XMLs describing environment condition, time and
actions to be enforced by network policies.
Dynamic Policy Con�guration: update policies when conditions
or requirements are modi�ed. Conditions are due to time or scenario
(i.e., a node is disconnected) changes and requirements when new goals
are con�gured both for users and overall network.
Decision Enforcement: verify network or user conditions to select
decisions for meeting user SLA requirements or high-level network go-
als.
∗ Time and Environment Condition: as SOS produces two de-
cision trees (day and night periods), the management layer imple-
ments a clock that verify when it is required to switch decision
trees. Scenario may require for changes in the active tree, adjus-
ting to the number of active nodes;
∗ QoS Evaluation: implement thresholds to avoid the enforcement
of erroneous decisions. This component may implement a dual
threshold (based on ALR thresholds) to enforce decisions.;
∗ Hosts: check for SLA violations; and
∗ Decision Trees: given a network condition (time and network
workload) select a rule in the decision tree to enable or disable
energy e�ciency capabilities.
• Control Plane
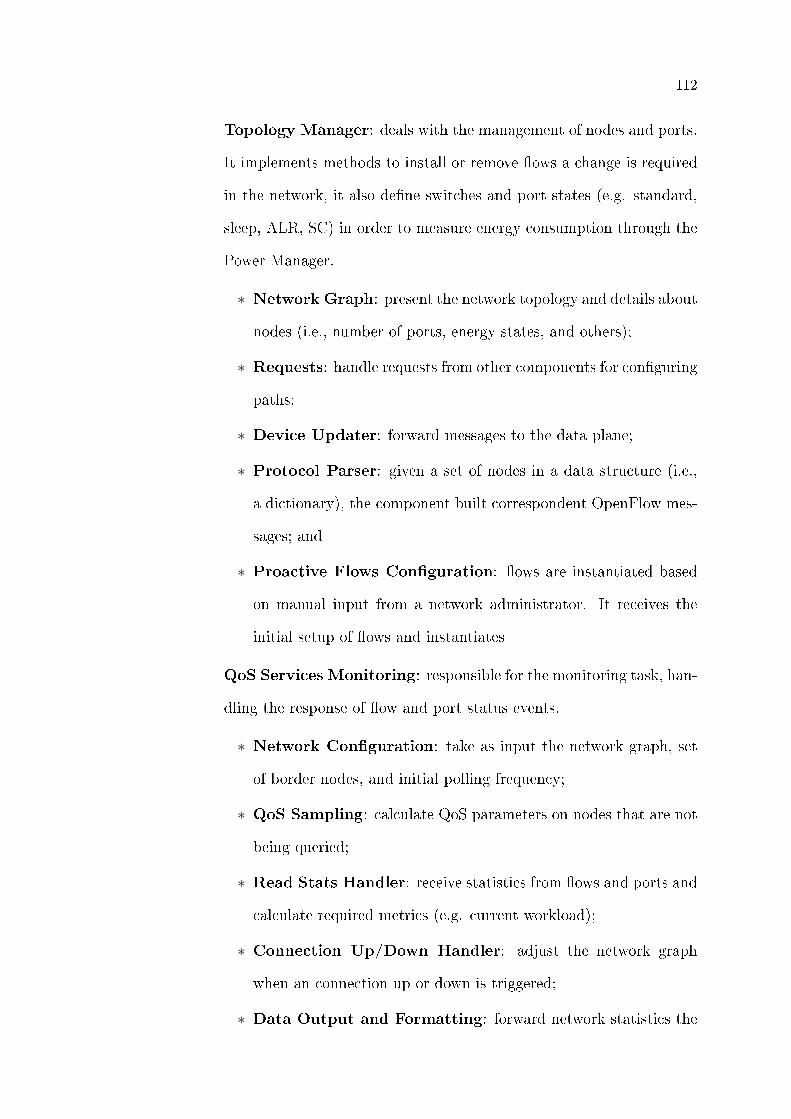
112
Topology Manager: deals with the management of nodes and ports.
It implements methods to install or remove �ows a change is required
in the network, it also de�ne switches and port states (e.g. standard,
sleep, ALR, SC) in order to measure energy consumption through the
Power Manager.
∗ Network Graph: present the network topology and details about
nodes (i.e., number of ports, energy states, and others);
∗ Requests: handle requests from other components for con�guring
paths;
∗ Device Updater: forward messages to the data plane;
∗ Protocol Parser: given a set of nodes in a data structure (i.e.,
a dictionary), the component built correspondent OpenFlow mes-
sages; and
∗ Proactive Flows Con�guration: �ows are instantiated based
on manual input from a network administrator. It receives the
initial setup of �ows and instantiates
QoS Services Monitoring: responsible for the monitoring task, han-
dling the response of �ow and port status events.
∗ Network Con�guration: take as input the network graph, set
of border nodes, and initial polling frequency;
∗ QoS Sampling: calculate QoS parameters on nodes that are not
being queried;
∗ Read Stats Handler: receive statistics from �ows and ports and
calculate required metrics (e.g. current workload);
∗ Connection Up/Down Handler: adjust the network graph
when an connection up or down is triggered;
∗ Data Output and Formatting: forward network statistics the

113
Data Parser (to be plotted) and the Network Log database through
the MySQL-db Manager; and
∗ Adaptive Polling: based on the nodes throughput and set of
active paths, it is able to adjust the polling frequency and set of
nodes to be queried.
Power Manager: component used to implement ALR policies, the
adaptive part of SC and calculate power consumption either from the
network or hosts.
∗ ALR Policy: implement the policy to e�ectively adjust the link
rate;
∗ SC Adaptive: emulate the adaptive part of SC (dutycycle); and
∗ Per-user Energy Measurements: infers the overall energy con-
sumption and in a per-user basis given the nodes utilization.
Databases: store information regarding policies, users QoS and
energy requirements, power models, and logging of network informa-
tion both overal and in a per-user basis (energy consumption and QoS
parameters).
∗ MySQL-db Manager: framework to manage tables and plain
text documents;
∗ Policies Repository: keep information regarding network poli-
cies (given from SOS) and user energy policies;
∗ SLAs: maintain users requirements regarding energy consump-
tion (amount of Watts to be spent) and QoS requirements;
∗ Network Log: logging of energy consumption and QoS parame-
ters both for network and users; and
∗ Power Models: store the nodes energy pro�les.
• Data Plane

114
Open vSwitch: standard OVS nodes running in kernel mode (i.e., no-
des are mapped as a process in a process-based virtualization (LANTZ;
HELLER; MCKEOWN, 2010)).
Tra�c Shaper: since OpenFlow 1.0 is not able to fully con�gure
queues on OVS (only enqueue �ows and set minimum rate queues), it
was used an external con�guration (based on Linux Hierarchical Token
Bucket1) to emulate a tra�c shape functionality for users exceeding a
determined amount of Watts.
ALR: parallel links interconnecting each pair of nodes to emulate the
ALR mechanism.
1The Linux Documentation Project: http://tldp.org/HOWTO/Tra�c-Control-HOWTO