greenhouse indicator annual report 2010
TRANSCRIPT

Greenhouse Indicator
Annual Report: 2010
THE CLEAN REVOLUTION
This is part of

The Greenhouse Indicator - Annual Report 2010 1
TABLE OF CONTENTS Introduction page 2
Overview of 2010 results page 2
Electricity export/import analysis page 5
Temperatures, GSP and population growth page 6
Victoria analysis page 8
New South Wales analysis page12
Queensland analysis page 16
South Australia analysis page 20
Additional section: Tasmania page 24
Contact page 27
Annex: Results Summary Table page 28

The Greenhouse Indicator - Annual Report 2010 2
INTRODUCTION The Climate Group is now in its fifth year of tracking
greenhouse gas emissions from energy use in
Victoria, New South Wales (NSW), Queensland and
South Australia on a weekly basis through the
Greenhouse Indicator.
The Greenhouse Indicator provides accurate and real
time information on greenhouse gases produced each
week from energy use. It is a unique tool designed to
bring greater understanding to the issue of climate
change and to help track greenhouse gas emissions
in selected Australian states.
Each and every week we release greenhouse gas
emissions into the atmosphere. Because they can’t be
seen, it is difficult to understand how much is being
produced.
All countries provide a detailed annual report of their
greenhouse gas emissions but such reports are
normally released long after the emissions have
occurred. Thus this information, while comprehensive
and critical for policy planning and scientific
assessment, arrives much later than the emissions
are produced. The Greenhouse Indicator puts a figure
on what is happening now, and enables everyone to
follow how much they are collectively emitting in their
state, each and every week.
This Annual Report covers greenhouse emissions
from energy during 2010 and compares them with
emissions from 2009, as well as previous years.
The Greenhouse Indicator was recently expanded to
Tasmania and there is a separate section on
Tasmania included at the back of this report. The
state is not included in the body of this report as we
do not have a complete set of data for 2009 with
which to make accurate comparisons with 2010.
2010 RESULTS Across Victoria, NSW, Queensland and South
Australia annual emissions from energy in 2010 were
298.97 million tonnes - 6.64 million tonnes less than in
2009. This is a fall of 2.2 per cent for the year.
Individually, all four states saw a decrease in
emissions although the size of the decrease varied
from state to state. This was on top of a fall of 1.8 per
cent the previous year.
Annual emissions in NSW registered the largest
decrease with a 4.98 per cent fall, or 5.3 million
tonnes compared with 2009. Victoria and Queensland
both registered reductions of 0.7 per cent: 671,000
tonnes and 566,000 tonnes respectively. Emissions in
South Australia fell by 0.68 per cent or 129,000
tonnes.
In NSW, all of the decrease was due to a reduction in
emissions from coal-fired electricity. Emissions from
coal fell by 10.02 per cent or around 6.26 million
tonnes. This was the single biggest relative and total
decrease in emissions from any fuel category across
all states. This decrease was slightly offset by a
smaller rise in emissions from gas and petroleum of
5.3 per cent (481,000 tonnes) and 1.5 per cent
(503,000 tonnes) respectively. This year’s decrease in
emissions was on top of a 3.1 per cent decline in
NSW emissions in 2009 – largely due to a 4.2 per
cent decline in emissions from coal that year. This
means emissions from coal have decreased by 15.7
per cent in NSW over the last two years.
Emissions from coal also fell substantially in
Queensland in 2010 – by 4.2 per cent or 1.8 million
tonnes of emissions. Again this was partially offset by
a substantial relative rise in emissions from gas of
14.1 per cent or 1.25 million tonnes. This was the
largest single rise in emissions from any fuel category
across the states – and represents a major increase
in gas-fired generation in Queensland. Queensland’s

The Greenhouse Indicator - Annual Report 2010 2
petrol emissions fell marginally by 13,000 tonnes. In
2009 Queensland emissions also fell, by 1.1 per cent
overall.
Coal emissions also fell in both South Australia and
Victoria, by 4.5 per cent and 0.7 per cent. However,
unlike NSW and Queensland, emissions from gas
also fell in both states. They were1.9 per cent lower in
Victoria (232,000 tonnes) and a 1.5 per cent lower in
South Australia (104,000 tonnes). South Australia saw
a 2.4 per cent increase in emissions from petroleum
products while Victoria’s emissions from petroleum
products were virtually unchanged since 2009.
As with the other two states, this is the second year in
a row that emissions have fallen in Victoria and South
Australia. In 2009 emissions fell by 4.2 per cent and
0.5 per cent in South Australia and Victoria
respectively. The fall in gas emissions in 2010 also
continues the trend seen in these states in 2009,
when emissions from gas fell by 5.7 per cent in
Victoria and 13.7 per cent in South Australia.
Compared with 2000 levels, all states’ emissions from
energy were higher, although only marginally in
Victoria’s case – by 0.2 per cent. Collectively all states
were up 12.7 per cent on 2000 levels.
0.000
20.000
40.000
60.000
80.000
100.000
120.000
2009 2010 2009 2010 2009 2010 2009 2010
VIC NSW QLD SA
Emissions From Energy Summary By State 2009/2010
Petroleum
Gas
Coal
Tonnes CO2e (Mil)

The Greenhouse Indicator - Annual Report 2010 3
However, this hides some marked differences
between the states. Queensland’s emissions were
40.4 per cent above 2000 levels, while NSW and
South Australia were 9.3 per cent and 10.3 per cent
above respectively.
The gap in emissions above 1990 was more
substantial in all states - collectively 42.3 per cent
above 1990 levels. Queensland was 116 per cent
above 1990 levels, while Victoria, NSW and South
Australia were 29.2 per cent, 26.3 per cent and 15.2
per cent higher than 1990 respectively.
PETROLEUM Total emissions from petroleum‐based fuels across all
four states were 96.299 million tonnes, up from
95.630 million tonnes in 2009 (a rise of 0.7 per cent).
This is in contrast with the previous year which saw a
similar sized decrease in petroleum emissions
compared with 2008, of 0.73 per cent.
Among the different fuel types, results were mixed.
The use of and resulting emissions from diesel and
aviation fuel grew across the four states by 1.7 per
cent and 8.2 per cent respectively, while the
emissions from petrol and LPG both fell by 1.4 per
cent and 1.9 per cent respectively.
This trend was not uniform in all states. Emissions
from petroleum grew in both South Australia and New
South Wales by 2.4 per cent (184,000 tonnes) and 1.5
per cent, or (503,000 tonnes) respectively.
Victoria and Queensland’s emissions from petroleum
products were virtually the same as 2009, with both
recording very small falls in emissions of 5000 tonnes
and 13,000 tonnes respectively. For Victoria this is a
contrast with last year, when petroleum emissions fell
by 2.2 per cent, or around 502,000 tonnes compared
with 2008.
ELECTRICITY Across the four states the total amount of scheduled
electricity generated during 2010 was 1.1 per cent or
2.07 million MWh lower – continuing the trend from
2009 when scheduled electricity generation was 1.9
per cent or 3.84 million MWh less than in 2008.
Coal was responsible for 84.3 per cent of total
scheduled electricity generation, down from 87.8 per
cent in 2009. This represents a five per cent fall in
electricity generation from coal on 2009, continuing
the trend seen the previous year, when coal-fired
generation fell by 3.1 per cent on 2008.
The share of gas-fired generation across the states
rose from 9.3 per cent to 11.4 per cent of total
generation, representing an additional 3.87 million
MWh of electricity. This was a 21 per cent relative
increase in gas-fired generation – building on the 9.2
per cent rise in gas-fired generation seen the previous
year. The greenhouse intensity of gas generation also
improved by 4.4 per cent – reflecting the impact of
newer, more greenhouse efficient stations.
Scheduled renewable generation increased by 50 per
cent compared with 2009, generating an additional
2.78 million MWh of emissions-free electricity than in
2009. This was a substantially larger increase than
during 2009, when scheduled renewable generation
only increased by 1.7 per cent compared with 2008.
During 2010 renewables accounted for around 4.3 per
cent of the scheduled electricity generation mix across
the four states.
It should be noted that this report only looks at
scheduled electricity generation due to the lack of
accurate information on non-scheduled generation
this early in the year. A good proportion of renewable
generation in each state is non-scheduled: in 2009,
non-scheduled renewables accounted for 85 per cent
of total renewable generation in Victoria, 33 per cent

The Greenhouse Indicator - Annual Report 2010 4
in New South Wales, 60 per cent in Queensland and
46 per cent in South Australia. As a result, total
renewable generation in each state is higher than
stated in this report and the greenhouse intensity of
overall electricity generation will be lower than stated
here.
The Climate Group produces a more detailed
Electricity Generation Report for Australia that
includes scheduled and non-scheduled electricity
generation. You can download this at
www.theclimategroup.org/indicator.
GREENHOUSE INTENSITY As a result of the movement in the coal, gas and
petroleum generation categories, the overall
greenhouse intensity of scheduled electricity
generated across the four states declined by 2.8 per
cent from last year to 0.906 tonnes CO2e/MWh. In
2009, greenhouse intensity of scheduled electricity
generation was 0.9322 tonnes CO2e/MWh.
ELECTRICITY DEMAND AND GENERATION Across all four states, electricity demand fell by 0.5
per cent (or 0.97 million MWh) – a continuation of the
0.6 per cent decline seen across the four states the
previous year. This was despite strong growth in
population and GSP across the four states in 2010
[see population and GSP table below].
In Victoria, electricity demand fell by 0.2 per cent in
2010. This compared with a 2 per cent fall the
previous year. Generation from brown coal fell by 0.6
per cent while gas-fired generation fell by almost 60
per cent on the previous year. Increased scheduled
renewable generation of 63 per cent made up for
some of this decrease, although renewables held a
small overall share of just 1 per cent of Victoria’s
scheduled electricity generation.
The fall in generation combined with a smaller fall in
demand for electricity meant that Victoria’s net
exports of electricity to other states fell from 4.6 per
cent of electricity produced in 2009 to 2.8 per cent in
2010.
In NSW, electricity demand fell by 0.7 per cent,
continuing the 1.2 per cent fall seen during 2009.
Generation from black coal fell by 9.6 per cent while
gas-fired generation grew by 20.6 per cent. This
change in the generation mix continued from 2009,
when black coal‐fired generation fell by 6.1 per cent,
and gas‐fired generation grew substantially by 191
per cent, albeit from a very low base. Much stronger
generation from the state’s hydro-electric stations
meant that scheduled generation from renewables
rose in NSW by 74.7 per cent producing 5.55 million
MWh of scheduled generation in 2010.
The overall fall in generation coupled with a much
smaller fall in electricity demand meant that NSW
increased its imports of electricity from other states by
63.8 per cent. NSW now imports just over 9 per cent
of its total electricity demand.
In Queensland, electricity demand fell by 0.8 per cent
in 2010, compared with a rise in demand of 1.5 per
cent the previous year. Generation from black coal fell
by 3.8 per cent, continuing a 3.0 per cent fall in the
previous year. Gas-fired generation increased by 68.1
per cent – by far the largest absolute increase in
generation in any sector across the four states –
representing some 4.4 million additional MWh. This
was because of the commissioning of new gas plants
at Condamine and Yarwun. Gas now makes up 18
per cent of Queensland’s generation mix.
The increase in electricity generation in Queensland
of 4.2 per cent coupled with the decrease in demand
meant that overall the state’s exports of electricity
increased by 60.5 per cent compared with the

The Greenhouse Indicator - Annual Report 2010 5
previous year, with the state now exporting 12.5 per
cent of its electricity – up from 8.1 per cent and 10.5
per cent in 2009 and 2008 respectively.
In South Australia, electricity demand increased by
0.7 per cent, the only state to see a rise in demand in
2010. Generation from coal‐fired generators fell by
2.6 per cent, a similar fall to that seen in 2009 (2.8 per
cent). The amount of electricity produced from gas
also fell by 2.9 per cent with scheduled renewable
generation growing strongly by 21.2 per cent, making
up 12 per cent of South Australia’s scheduled
generation.
The overall increase in demand coupled with lower
generation meant that South Australia imported 26
per cent more electricity than in 2009 (or 146,545
more MWh). The state now imports just over 5.2 per
cent of its electricity demand.
GAS (DOMESTIC AND INDUSTRIAL USE) In contrast with the rise in gas use for electricity
generation, the emissions from gas used for domestic
purposes (heating and cooking) and for industrial
purposes fell by around 1 per cent overall across the
four states, or just under 270,000 tonnes of
emissions.
The trend was not uniform across all states. Domestic
and industrial gas use grew by 3.5 per cent (398,000
tonnes) and by 2.4 per cent (172,000 tonnes) in
Victoria and NSW respectively. In contrast, it fell by 14
per cent (768,000 tonnes) and 2.9 per cent (72,000
tonnes) in Queensland and South Australia
respectively.
‐8,000,000
‐6,000,000
‐4,000,000
‐2,000,000
0
2,000,000
4,000,000
6,000,000
8,000,000
10,000,000
VIC NSW QLD SA
Electricity Export Balance (MWh) By State
2009
2010

The Greenhouse Indicator - Annual Report 2010 6
TEMPERATURES Australia recorded its 8th warmest year on record for
minimum temperatures. The national anomaly was
+0.59 °C above average with each of the four states
covered in this report also posting above average
minimum temperatures of between +0.31 and +0.78
°C. Despite being above average, minimum
temperatures were cooler than in 2009 when the
national average was +0.76 above the long term
average.
Maximum temperatures for 2010 were below the long
term average, with an average anomaly of −0.21 °C.
All of the four states posted below average
maximums with the exception of Victoria, which was
0.31°C above average. This contrasts with last year
when maximum temperatures were 1.04 °C above
average nationally, with three of the four states in this
report posting maximums of over 1.3 °C above
average.
When compared with last year, the likely effect of
these temperatures is reduced demand for air
conditioning in summer when temperatures are at
their highest. It is likely that this has contributed to the
reduced electricity demand in Victoria, NSW and
Queensland compared with 2009. However, given the
overall cooler minimum temperatures than in 2009, it
is likely that this effect will have been tempered by
slightly increased demand for heating during the
winter.
Temperature Summary 2010 and 2009
Maximum Temperatures Minimum Temperatures Area 2010 Anomaly
(°C) 2009 Anomaly
(°C) Area 2010 Anomaly
(°C) 2009 Anomaly
(°C)
National ↓0.21 ↑1.04 National ↑0.59 ↑0.76
VIC ↑0.3 ↑1.36 VIC ↑0.67 ↑0.71
NSW ↓0.47 ↑1.53 NSW ↑0.6 ↑1.13
QLD ↓0.85 ↑0.85 QLD ↑0.78 ↑0.57
SA ↓0.3 ↑1.33 SA ↑0.31 ↑1.19
Source: Bureau of Meteorology. Anomalies are calculated with respect to the period 1961 – 1990. Extremes of temperature in both summer and winter have a strong correlation to higher electricity use. In summer,
high temperatures result in an increased need for cooling, with emissions from energy often increasing as a result.
The same result occurs during winter due to increased demand for heating.

The Greenhouse Indicator - Annual Report 2010 7
POPULATION Emissions have decreased across all states, despite
growth in the population of each state during June
2009 – June 2010. This means per capita emissions
from energy have continued to fall in 2010 – carrying
on the trend from the previous year. 2010 emissions
from energy were 15.779 tonnes per capita across the
four states, a fall of 4.2 per cent on the previous year.
GROSS STATE PRODUCT Data from the last financial year of June 2009 to June
2010 indicates that all states recorded growth in GSP
of between 1.5 and 2.0 per cent. While these are
higher growth rates than last year, they are
reasonably low compared with previous years, which
will reduce upward pressure on emissions levels.
Growth Summary from June 09 to June 101
State Gross State Product (%) Population
(%) VIC 2.0 1.8 NSW 1.7 1.5 QLD 1.6 2.0 SA 1.5 1.2
1 GSP figures: Source ABS 5220.0 Australian National Accounts: State Accounts. Population figures:
Source ABS 3101.0 Australian Demographic Statistics, June 2010. Please note that population figures are
as of June 2010.

The Greenhouse Indicator - Annual Report 2010 8
Victoria 2010 emissions: 99.052 million tonnes CO2e, down 671,000 tonnes, or 0.67 per cent on 2009. Coal-fired electricity: 62.334 million tonnes; down 0.69 per cent or 434,000 tonnes on 2009
Natural gas: 12.125 million tonnes; down 1.88 per cent or 232,000 tonnes on 2009
Petroleum: 24.594 million tonnes; down 0.02 per cent or 5000 tonnes on 2009
The Greenhouse Indicator accounts for just about all of Victoria’s emissions from energy and about 85 per cent of
the state’s total greenhouse gas emissions. Remaining emissions come from agriculture, waste and industrial
processes. Forestry also acts as a sink for about 2 per cent of the total emissions. Greenhouse gas emissions in
Victoria not included by the Indicator are estimated to be approximately 20 million tonnes for the year as a whole.
As a result, total annual emissions in 2010 were around 117 million tonnes.
Total weekly emissions fluctuated over the year
between 1.69 and 2.15 million tonnes – a marginally
larger range than in 2009. The Indicator peaked
during the first week of July, which was the second
highest week of the year for emissions from coal as
well as for gas. The week was particularly cold
causing increased demand for electricity for heating
across the National Electricity Market. July is
traditionally a peak month for the Indicator in Victoria
and other states for this reason – as highlighted by
the graph below.
The lowest weekly emissions occurred during the
third week of April which was also one of the lowest
levels of emissions from coal for the year.
The average weekly emissions in Victoria were 1.905
million tonnes – less than last two years but very
similar to 2007 weekly emissions levels.
63%12%
25%
2010 Emissions By SourceCoal Gas Petroleum

The Greenhouse Indicator - Annual Report 2010 9
Electricity from coal accounted for 63 per cent of all
emissions in Victoria and 97.7 per cent of scheduled
electricity generation compared with 96.3 per cent last
year.
The total annual emissions from coal-fired power
stations were 62.334 million tonnes, 434,000 tonnes
less than the previous year. Emissions from coal
peaked at 1.308 million tonnes during the third week
of March with a particularly emissions intense
generation unit coming online. The lowest weekly
level recorded occurred in the third week of May and
was 0.976 million tonnes with a number of generation
units offline at the time.
The use of natural gas caused the lowest level of
emissions of the three energy sources in Victoria –
making up 12 per cent of total emissions from energy.
Natural gas is used in industrial and commercial
applications as well as for domestic use (largely
heating) and to fuel electricity generation. In 2010, the
average weekly emissions from gas use were
233,000 tonnes, down 1.88 per cent or 232,000
tonnes less than in 2010. This was due to a fall in the
amount electricity generated from gas of 60 per cent
(or 630,000 tonnes emissions), more than
compensating for a 3.5 per cent increase in emissions
from gas being used for domestic and industrial
purposes.
Petroleum emissions in 2010 were on average
473,000 tonnes per week, virtually identical to 2009.
Petrol emissions include sales of LPG, automotive
transport fuels, aviation fuel, industrial diesel and fuel
oil. Emissions from the use of petrol and LPG both
fell, by 1.1 per cent and 4.9 per cent respectively. In
1.500
1.600
1.700
1.800
1.900
2.000
2.100
2.200
2.300W1
W3
W5
W7
W9
W11
W13
W15
W17
W19
W21
W23
W25
W27
W29
W31
W33
W35
W37
W39
W41
W43
W45
W47
W49
W51
Victoria Weekly Greenhouse Indicator 2007-10
2007
2008
2009
2010
Tonnes CO2e (Mil)

The Greenhouse Indicator - Annual Report 2010 10
contrast, emissions from aviation fuel and diesel rose
by 4.5 per cent and 4.1 per cent respectively.
Electricity demand fell by 0.2 per cent in 2010. This
compared with a 2 per cent fall the previous year.
Average maximum temperatures were lower in 2010
than in 2009 (which was 1.3 °C above the 1961 -
1990 average). This is likely to have reduced upward
pressure on electricity demand due to less demand
for air conditioning during the hottest days. In
contrast, despite being 0.69°C higher than the long
term average, minimum temperatures were lower
than last year (0.71°C above average) which may
have increased demand for heating in the colder
months.
Electricity generation from brown coal‐fired
generators fell by 0.6 per cent while gas-fired
generation fell by almost 60 per cent on the previous
year. Increased scheduled renewables generation of
63 per cent made up for some of this decrease,
although the impact was limited as renewables held a
small overall share of just 1 per cent of Victoria’s
scheduled electricity generation.
Imports/Exports: The fall in generation combined
with a smaller fall in demand for electricity meant that
while Victoria remains a net exporter of electricity,
exports to other states fell from 4.6 per cent of
electricity produced in 2009 to 2.8 per cent in 2010.
1990/2000 comparisons: Victoria’s emissions are 29
per cent above 1990 levels – with an additional 22.4
million tonnes emitted. However the state’s emissions
are only marginally above 2000 levels by 219,000
tonnes over the course of the year.
GSP and Population: Victoria registered solid growth
in Gross State Product during the last financial year of
2.0 per cent, the highest of any of the four states.
Victoria’s population also grew by 1.8 per cent.
Despite this, overall electricity demand fell marginally
in the state, by 0.2 per cent.

The Greenhouse Indicator - Annual Report 2010 11
0.000
10.000
20.000
30.000
40.000
50.000
60.000
70.000
Coal Gas Petroleum
Victoria 2010 Emissions By Source
2009
2010
Tonnes CO2e (Mil)
76.639
98.833 99.076100.251 99.723 99.052
60.000
70.000
80.000
90.000
100.000
110.000
1990 2000 2007 2008 2009 2010
Victoria Total Yearly EmissionsTonnes CO2e (Mil)

The Greenhouse Indicator - Annual Report 2010 12
New South Wales 2010: 100.726 million tonnes CO2e, down 5.277 million tonnes, or 4.98 per cent on 2009. Coal-fired electricity: 56.210 million; down 10.02 per cent or 6.261 million tonnes on 2009
Natural Gas: 9.513 million; up 5.33 per cent or 481,000 tonnes on 2009
Petroleum: 35.003 million; up 1.46 per cent or 503,000 tonnes on 2009
The Greenhouse Indicator accounts for more than 90 per cent of NSW’s emissions from energy and 65 per cent of
the State’s total greenhouse gas emissions. Remaining emissions come from agriculture, land use, waste, industrial
processes and fugitive emissions from coal mining. Greenhouse gas emissions in NSW not included by the Indicator
are estimated to be approximately 57 million tonnes for the year as a whole. As a result, total annual emissions in
2010 were around 156 million tonnes.
The Weekly Greenhouse Indicator in NSW ranged
between 1.57 and 2.22 million tonnes during the year.
Total emissions for NSW in 2010 fell by 4.98 per cent
due entirely to a substantial decline in emissions from
coal-fired generation.
The Weekly Indicator peaked at 2.22 million tonnes
during the first week of July. This coincided with the
highest week of the year for emissions from coal and
gas in NSW, as well as the highest level of demand
for electricity across the National Electricity Market as
a whole, due to low winter temperatures, particularly
in NSW and Victoria. Emissions in January and
February were noticeably lower in 2010 than in 2009,
when there is a traditional peak associated with high
energy demand for cooling. This was due to lower
emissions from coal compared with the previous year,
as well as lower consumption of petroleum.
The lowest Weekly Indicator recorded was 1.57
million tonnes during the final week of December and
56%
9%
35%
2010 Emissions By SourceCoal Gas Petroleum

The Greenhouse Indicator - Annual Report 2010 13
was due to the reduced industry and business taking place over the holiday season.
Electricity from coal causes the most emissions
from energy in NSW and accounted for 86.3 per cent
of electricity generated in 2010. The average weekly
emissions from coal‐fired power stations were 1.081
million tonnes, down 10.02 per cent or 6.26 million
tonnes as a whole on the previous year. This was the
result of a 9.6 per cent fall in coal-fired electricity
generation over the entire year with all coal-fired
power stations operating at significantly reduced
capacity, with the exception of Mount Piper. This
continued a 6.1 per cent fall in coal-fired generation
during 2009.
Emissions from coal peaked in the first week of July.
The lowest emissions from coal came during the final
week of December with 753,000 tonnes emitted that
week.
The use of natural gas causes the lowest level of
emissions of the three energy sources, contributing
9.4 per cent of the state’s total annual emissions, up
from 8.5 per cent the previous year. During 2010 the
average weekly emissions from gas use were
183,000 tonnes. The amount of electricity generated
from gas rose by 20.6 per cent in 2010, continuing the
trend from 2009 when gas-fired generation grew by
191 per cent.
Petroleum emissions during 2010 were on average
673,000 tonnes per week and accounted for 34.8 per
cent of total emissions from energy. Petroleum
emissions include sales of LPG, automotive fuels,
aviation fuel, industrial diesel and fuel oil. Emissions
from diesel and LPG rose marginally, while emissions
from aviation fuel rose by more than 10 per cent
1.500
1.600
1.700
1.800
1.900
2.000
2.100
2.200
2.300
W1
W3
W5
W7
W9
W11
W13
W15
W17
W19
W21
W23
W25
W27
W29
W31
W33
W35
W37
W39
W41
W43
W45
W47
W49
W51
NSW Weekly Greenhouse Indicator 2009/10
2009
2010
Tonnes CO2e (Mil)

The Greenhouse Indicator - Annual Report 2010 14
compared to 2009. Emissions from petrol fell by 0.7
per cent on 2009.
Electricity demand fell by 0.7 per cent, continuing
the 1.2 per cent fall seen during 2009.
2010 maximum temperatures were 0.47°C below the
long term average; 2°C lower than 2009 when
maximum temperatures were 1.53 higher than
average. This is likely to have reduced upward
pressure on electricity demand due to less demand
for air conditioning during the hottest days. In
contrast, despite being 0.6°C higher than the long
term average, minimum temperatures were lower
than last year (1.13°C above average), which may
have increased demand for heating in the colder
months.
Total electricity generation fell by 4.6 per cent. The
change in the generation mix continued from 2009,
with black coal‐fired generation falling and gas‐fired
generation increasing, albeit from a low base.
Scheduled generation from renewables rose in NSW
by 74.7 per cent – with renewables producing 5.55
million MWh of scheduled generation in 2010 with
much more hydro-electric generation compared with
2009.
Import/export: The overall fall in generation, coupled
with a much smaller fall in electricity demand, meant
that NSW increased its imports of electricity from
other states by 63.8 per cent. NSW now imports just
over 9 per cent of its total electricity demand from
other states, offsetting the reduced electricity
production from black coal generators in the state.
1990/2000 comparisons: NSW’s emissions are 26.3
per cent above 1990 levels and 9.3 per cent above
2000 levels. This is the equivalent of an additional
21.0 million tonnes and 8.55 million tonnes emitted
last year compared with 1990 and 2000 respectively.
GSP and Population: The overall decline in
emissions occurred despite positive growth in both
population (1.7 per cent) and Gross State Product
(1.5 per cent).

The Greenhouse Indicator - Annual Report 2010 15
0.000
10.000
20.000
30.000
40.000
50.000
60.000
70.000
Coal Gas Petroleum
NSW Emissions By Source 2009/10
2009
2010
79.762
92.171
106.003
100.726
40.000
50.000
60.000
70.000
80.000
90.000
100.000
110.000
1990 2000 2009 2010
NSW - Total Yearly Emissions
Tonnes CO2e (Mil)
Tonnes CO2e (Mil)

The Greenhouse Indicator - Annual Report 2010 16
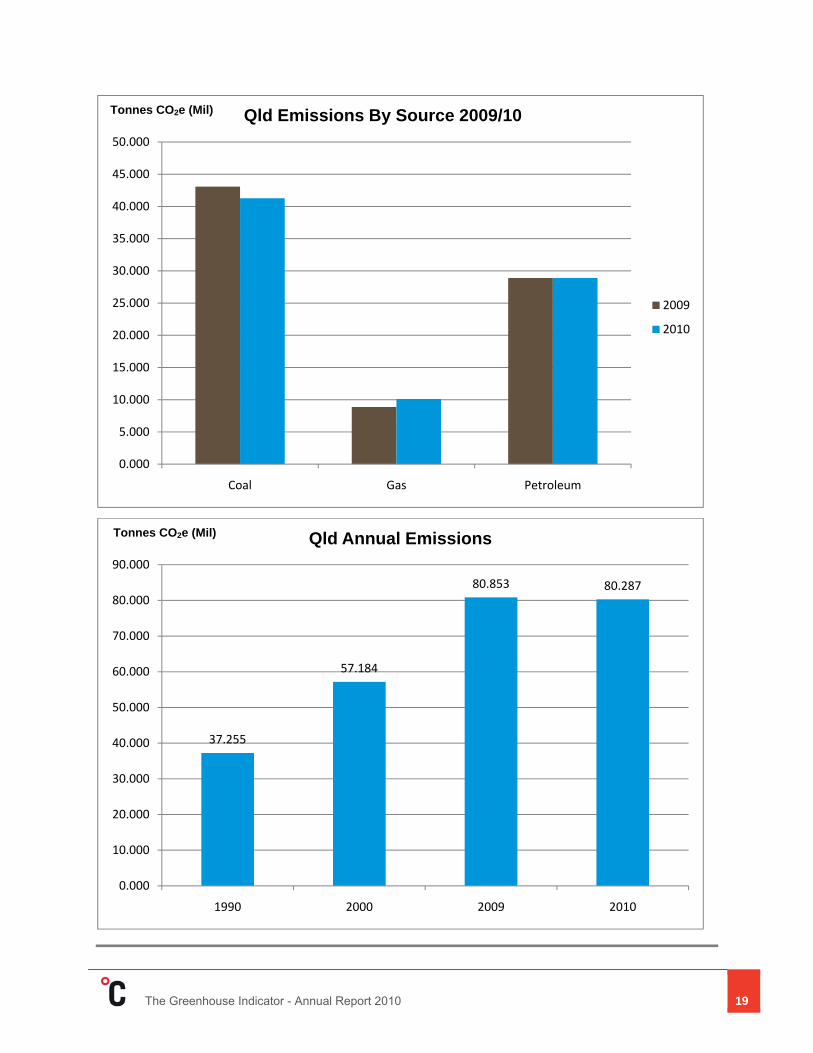
Queensland 2010: 80.287 million tonnes CO2e, down 0.566 million tonnes or 0.70 per cent on 2009. Coal-fired electricity: 41.277 million; down 4.19 per cent or 1.805 million tonnes on 2009
Natural gas: 10.120 million; up 14.12 per cent or 1.252 million tonnes on 2009
Petroleum: 28.890 million; down 0.04 per cent or 13,000 on 2009
The Weekly Indicator accounts for about 80 per cent of Queensland’s total energy emissions and 45 per cent of
the state’s total greenhouse gas emissions. Remaining emissions come from agriculture, land use, waste,
industrial processes, electricity generated on-site by industry and fugitive emissions from coal mining.
Greenhouse gas emissions in Queensland not included by the Indicator are estimated to be approximately 99
million tonnes for the period as a whole. As a result, total annual emissions in 2010 were around 179 million
tonnes.
The Weekly Greenhouse Indicator in Queensland
ranged between 1.43 and 1.66 million tonnes in 2010,
a greater range than in 2009. Queensland’s total
emissions fell compared with last year by 0.7 per
cent. As with the previous year, this was primarily due
to a fall in coal emissions of 4.19 per cent
The highest Weekly Indicator recorded was 1.663
million tonnes in the second week of January. This
coincided with the peak in coal-fired emissions in the
state at 906,000 tonnes for that week, as well as
being one of the highest weeks for emissions from
petroleum. December and January are traditionally
the peak months for emissions in Queensland when
the hot weather across the eastern states increases
electricity demand for cooling across the National
Electricity Market. As the graph below shows, this
was the case in both 2009 and 2010.
51%
13%
36%
2010 Emissions By Source
Coal Gas Petroleum

The Greenhouse Indicator - Annual Report 2010 17
The lowest Weekly Indicator was during the third
week of April at 1.433 million tonnes, which was also
the lowest week for emissions in 2009. April and May
are traditionally low emissions months with generally
more comfortable temperatures across the eastern
states reducing demand for electricity. As the graph
shows, Queensland did have an unexpected dip in
emissions during the final four weeks of the year,
which contrasts with emissions levels at the same
time the previous year. This was because of lower
coal-fired emissions corresponding with significantly
lower demand across the NEM.
Electricity from coal accounted for 51 per cent of
emissions in Queensland and 80.6 per cent of
scheduled electricity generated in 2010 – a 3.8 per
cent fall in generation on the previous year, continuing
a 3.0 per cent decline in 2009. The average weekly
emissions from coal were 794,000 tonnes, down 4.19
per cent or 1.805 million tonnes over the year as a
whole. Peak emissions from coal occurred during the
second week in January with a number of stations
operating at high capacity. The lowest level of
emissions for coal was in the last week of December
– at 688,000 tonnes for the week. That week was one
of the lowest weeks for overall emissions in
Queensland during the year.
The use of natural gas caused the lowest level of
emissions at 195,000 tonnes on average per week.
Total gas-fired generation was up by 68.1 per cent on
2009, producing 4.4 million additional MWh and 2.02
million tonnes of additional emissions, due to the
commissioning of new gas power plants at
Condamine and Yarwun. This was the largest
absolute increase in generation in any sector across
the four states. Gas makes up 18 per cent of
Queensland’s scheduled electricity generation mix.
While the amount of electricity generated from gas
increased, other uses of gas (mainly industrial and
1.400
1.450
1.500
1.550
1.600
1.650
1.700
W1
W3
W5
W7
W9
W11
W13
W15
W17
W19
W21
W23
W25
W27
W29
W31
W33
W35
W37
W39
W41
W43
W45
W47
W49
W51
Qld Weekly Greenhouse Indicator 2010
2009
2010
Tonnes CO2e (Mil)

The Greenhouse Indicator - Annual Report 2010 18
domestic) fell, with 768,000 tonnes less emissions for
the year (or 14 per cent less).
Petroleum emissions averaged 556,000 tonnes per
week. The highest weekly emissions were 588,000
tonnes for the week and the lowest 488,000 tonnes.
Emissions from petrol and LPG both fell in 2010 by
2.9 per cent and 1.1 per cent respectively, while
emissions from aviation fuel rose by 5.9 per cent.
Emissions from diesel were similar to 2009.
Electricity demand fell by 0.8 per cent in 2010,
compared with a rise in demand of 1.5 per cent the
previous year. An overall increase in electricity
generation in Queensland of 4.2 per cent coupled with
the decrease in demand meant that the state’s
exports of electricity increased by 60.5 per cent
compared with the previous year, with the state now
exporting 12.5 per cent of its electricity (7.43 million
MWh) – up from 8.1 per cent and 10.5 per cent in
2009 and 2008 respectively.
2010 maximum temperatures were 0.85°C below the
long term average, and 1.7°C lower than 2009, when
maximum temperatures were 0.85°C higher than
average. This is likely to have reduced upward
pressure on electricity demand due to less demand
for air conditioning during the hottest days. Warmer
minimum temperatures (0.78°C above average) than
in 2009 (0.57°C above average) are also likely to
have reduced demand for heating in the colder
months.
1990/2000 comparisons: Queensland’s emissions
are 116 per cent above 1990 levels – with an
additional 43.032 million tonnes emitted in 2010 than
in 1990. The state’s emissions are 40.4 per cent
above 2000 levels, resulting in 23.103 million tonnes
extra emissions in 2010 than in 2000.
GSP and population: The overall decline in
emissions occurred despite positive growth in both
population (2 per cent) and Gross State Product (1.6
per cent).
The Greenhouse Indicator - Annual Report 2010 19
0.000
5.000
10.000
15.000
20.000
25.000
30.000
35.000
40.000
45.000
50.000
Coal Gas Petroleum
Qld Emissions By Source 2009/10
2009
2010
37.255
57.184
80.853 80.287
0.000
10.000
20.000
30.000
40.000
50.000
60.000
70.000
80.000
90.000
1990 2000 2009 2010
Qld Annual Emissions
Tonnes CO2e (Mil)
Tonnes CO2e (Mil)

The Greenhouse Indicator - Annual Report 2010 20
South Australia 2010: 18.899 million tonnes CO2e, down 129,000 tonnes or 0.68 per cent on 2009.
Coal-fired electricity: 4.380 million; down 4.54 per cent or 208,000 tonnes on 2009
Natural gas: 6.707 million; down 1.53 per cent or 104,000 tonnes on 2009
Petroleum: 7.812 million; up 2.41 per cent or 184,000 tonnes on 2009
The Weekly Indicator accounts for around 90 per cent of South Australia’s emissions from energy and about 65 per
cent of the State’s total greenhouse gas emissions. Remaining emissions come from agriculture, waste and industrial
processes. Greenhouse gas emissions in South Australia not included by the Indicator are estimated to be
approximately 10 million tonnes for the year as a whole. As a result, total annual emissions in 2010 were around 29
million tonnes.
The Weekly Greenhouse Indicator in South
Australia ranged between 313,000 and 415,000
tonnes in 2010, a smaller range than in 2009. Total
emissions fell by 0.68 per cent (or 129,000 tonnes)
compared with 2009 due to a decrease in emissions
from both gas and coal. This continues the trend in
2009, which saw a 4.2 per cent decrease in emissions
on 2008, with a big fall in gas-fired generation
particularly.
The highest Weekly Indicator recorded was 415,000
tonnes in the first week of February. This peak was
due to high emissions from coal, combined with peak
petroleum emissions for the season. The lowest
Weekly Indicator, 313,000 was in the final week of
December with less business and industrial activity at
the start of the holiday period meaning less demand
for cooling. This was the lowest week of electricity
demand across the National Electricity Market.
23%
36%
41%
2010 Emissions By SourceCoal Gas Petroleum
The Greenhouse Indicator - Annual Report 2010 21
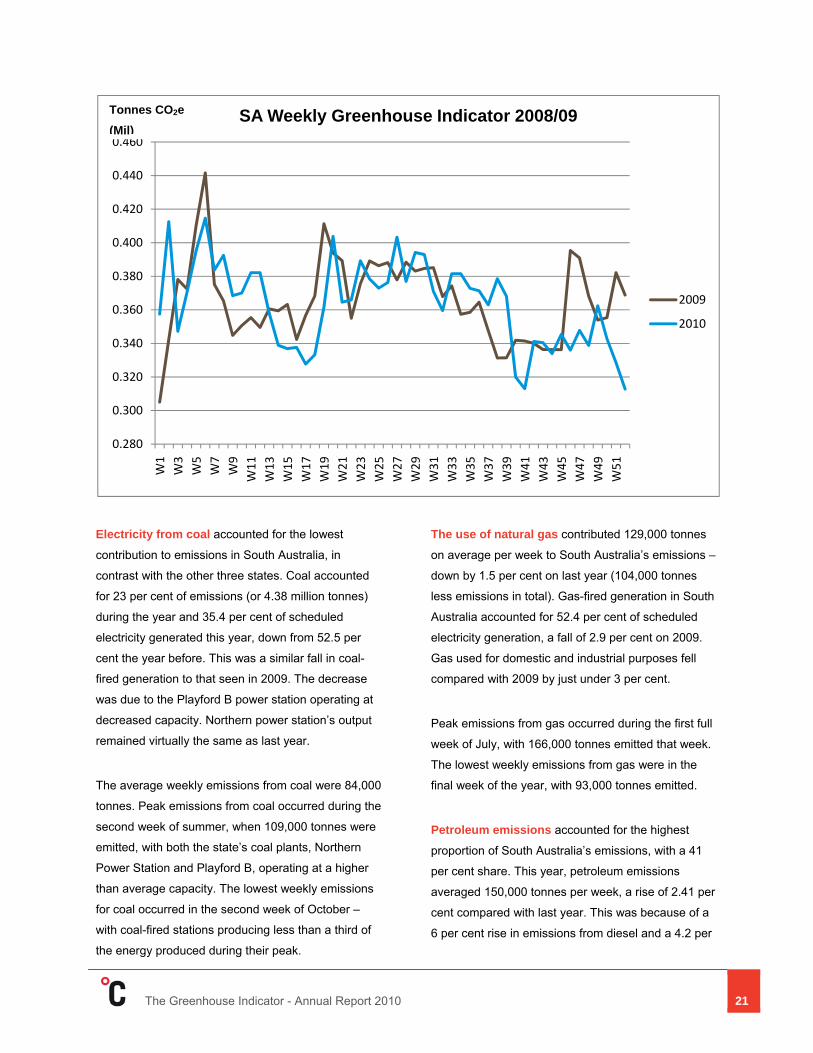
Electricity from coal accounted for the lowest
contribution to emissions in South Australia, in
contrast with the other three states. Coal accounted
for 23 per cent of emissions (or 4.38 million tonnes)
during the year and 35.4 per cent of scheduled
electricity generated this year, down from 52.5 per
cent the year before. This was a similar fall in coal-
fired generation to that seen in 2009. The decrease
was due to the Playford B power station operating at
decreased capacity. Northern power station’s output
remained virtually the same as last year.
The average weekly emissions from coal were 84,000
tonnes. Peak emissions from coal occurred during the
second week of summer, when 109,000 tonnes were
emitted, with both the state’s coal plants, Northern
Power Station and Playford B, operating at a higher
than average capacity. The lowest weekly emissions
for coal occurred in the second week of October –
with coal-fired stations producing less than a third of
the energy produced during their peak.
The use of natural gas contributed 129,000 tonnes
on average per week to South Australia’s emissions –
down by 1.5 per cent on last year (104,000 tonnes
less emissions in total). Gas-fired generation in South
Australia accounted for 52.4 per cent of scheduled
electricity generation, a fall of 2.9 per cent on 2009.
Gas used for domestic and industrial purposes fell
compared with 2009 by just under 3 per cent.
Peak emissions from gas occurred during the first full
week of July, with 166,000 tonnes emitted that week.
The lowest weekly emissions from gas were in the
final week of the year, with 93,000 tonnes emitted.
Petroleum emissions accounted for the highest
proportion of South Australia’s emissions, with a 41
per cent share. This year, petroleum emissions
averaged 150,000 tonnes per week, a rise of 2.41 per
cent compared with last year. This was because of a
6 per cent rise in emissions from diesel and a 4.2 per
0.280
0.300
0.320
0.340
0.360
0.380
0.400
0.420
0.440
0.460W1
W3
W5
W7
W9
W11
W13
W15
W17
W19
W21
W23
W25
W27
W29
W31
W33
W35
W37
W39
W41
W43
W45
W47
W49
W51
SA Weekly Greenhouse Indicator 2008/09
2009
2010
Tonnes CO2e (Mil)

The Greenhouse Indicator - Annual Report 2010 22
cent rise in emissions from aviation fuel. These rises
were slightly offset by a 3.6 per cent fall in emissions
from LPG in the state.
Electricity demand increased by 0.7 per cent, with
South Australia the only state to see a rise in demand
in 2010. The fall in generation from coal and gas was
somewhat offset by a rise in scheduled renewable
generation of 21.2 per cent. Scheduled renewable
generation now makes up 12 per cent of South
Australia’s scheduled generation.
The overall increase in demand coupled with the
lower overall generation meant that South Australia
imported 26 per cent more electricity than in 2009 (or
146,545 more MWh). The state now imports just over
5.2 per cent of its electricity demand.
2010 maximum temperatures were 0.3°C below the
long term average, and 1.63°C lower than 2009 when
maximum temperatures were 1.33 higher than
average. This is likely to have reduced upward
pressure on electricity demand due to less demand
for air conditioning during the hottest days. Despite
being 0.31°C warmer than average, cooler minimum
temperatures than in 2009 (which were 1.19°C above
average) are likely to have increased demand for
heating in the colder months.
1990/2000 comparisons: South Australia’s
emissions are 15.2 per cent above 1990 levels – with
an additional 2.496 million tonnes emitted in 2010
than in 1990. The state’s emissions were 10.3 per
cent or 1.768 million tonnes above2000 levels.
GSP and Population: The overall decline in
emissions occurred despite positive growth in both
population (1.2 per cent) and Gross State Product
(1.5 per cent).
0.000
1.000
2.000
3.000
4.000
5.000
6.000
7.000
8.000
9.000
Coal Gas Petroleum
SA Annual Emissions By Source 2009/10
2009
2010
Tonnes CO2e (Mil)

The Greenhouse Indicator - Annual Report 2010 23
16.403
17.131
19.02918.899
15.000
15.500
16.000
16.500
17.000
17.500
18.000
18.500
19.000
19.500
1990 2000 2009 2010
SA - Total Annual EmissionsTonnes CO2-e (Mil)

The Greenhouse Indicator - Annual Report 2010 24
ADDITIONAL SECTION: TASMANIA The Greenhouse Indicator recently expanded to
include Tasmania and weekly reports are now
available from The Climate Group’s website
(www.theclimategroup.org/indicator) and our weekly
email service. They are also published in the Hobart
Mercury each Tuesday. Tasmania is not included in
the body of the report above as we do not have a
complete set of emissions data for 2009 with which to
make accurate comparisons. However, a complete
set of data for 2010 along with brief analysis is set out
below.
Tasmania 2010: 3.092 million tonnes CO2e
Natural gas: 0.854 million tonnes
Petroleum: 2.237 million tonnes
The Indicator accounts for around 63 per cent of Tasmania’s emissions from energy and about 34 per cent of the
state’s total greenhouse gas emissions. Remaining emissions come from agriculture, waste and industrial processes.
Greenhouse gas emissions in Tasmania not included by the Indicator are estimated to be approximately 6 million
tonnes for the year. As a result, total annual emissions in 2010 were around 9.1 million tonnes.
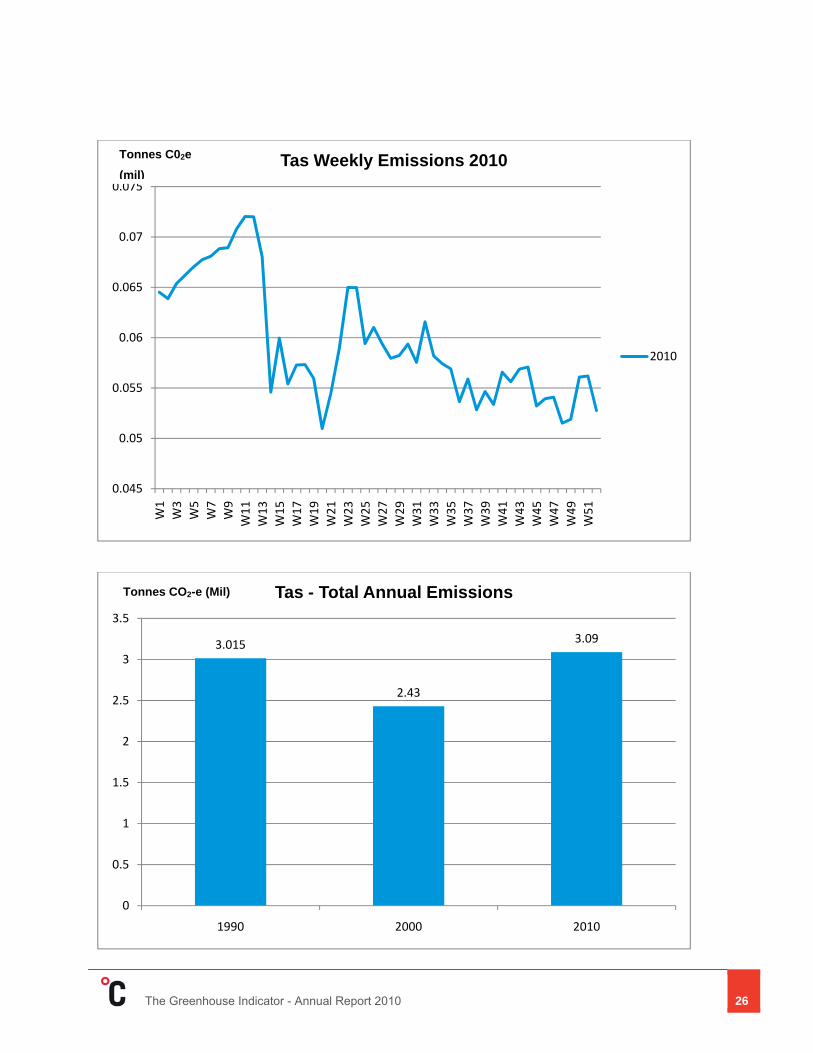
Greenhouse emissions from energy in Tasmania
covered by the Indicator totaled 3.092 million tonnes
in 2010. The majority of these emissions (72 per cent
or 2.24 million tonnes) came from petroleum related
products – mostly petrol or diesel. The remaining 28
per cent of emissions came from the use of gas, both
for electricity production as well as for domestic use
and industrial purposes. Around two-thirds of gas
emissions in 2010 (555,000) tonnes came from
electricity generation with roughly a third coming from
domestic and industrial use of gas.
28%
72%
2010 Emissions By Source
Gas
Petroleum

The Greenhouse Indicator - Annual Report 2010 25
Tasmania is notable in Australia for its lack of
emissions from large scheduled coal-fired electricity
generation.
The Weekly Greenhouse Indicator in Tasmania
ranged between 51,000 and 72,000 tonnes in 2010.
The highest weekly emissions were recorded during
the second and third weeks in March.
The lowest weekly emissions came during the second
full week in May with very low emissions from gas and
lower than average emissions from petroleum.
Emissions from petroleum averaged 43,000 tonnes
each week. Automotive petrol as well as diesel (used
in cars as well as in industry and for marine uses)
accounted for 92.5 per cent of all petroleum
emissions. Emissions from automotive petrol rose by
12 per cent compared with 2009, while diesel use
remained at the same level as 2009. LPG accounted
for around 4.7 per cent of emissions from petroleum
with aviation fuel making up the remaining 2.8 per
cent.
Emissions from gas, used for electricity generation
as well as industrial and domestic uses averaged
16,000 tonnes each week.
Electricity Production in Tasmania increased by
17.5 per cent or 1.45 million MWh in 2010 compared
with 2009. This was due to a 12.7 per cent increase in
renewable generation (949,000 MWh) all of which is
from the state’s hydro-electric generators, as well as a
60.5 per cent or 500,000 MWh increase in gas-fired
generation.
Tasmania’s two gas-fired stations at Tamar Valley
produced 13.6 per cent of Tasmania’s scheduled
electricity, with the remainder coming from hydro
electricity.
Electricity demand rose by 2.6 per cent or 258,000
MWh in 2010 compared with 2009. Despite the much
larger rise in electricity generation, Tasmania
remained a net importer of electricity in 2010,
importing a total of 403,606 MWh - or just under 4 per
cent of overall electricity demand. This was down
substantially on 2009 when Tasmania imported 1.59
million MWh of electricity, or 16 per cent of total
demand.
1990/2000 comparisons: Tasmania’s emissions
were 2.5 per cent above 1990 levels and 27.2 per
cent above 2000 levels.
Both Tasmania’s GSP and population grew from
June 2009 – 2010. As of June 2010, Tasmania’s
population was 507,600 a rise of 0.9 per cent. 2
Tasmania’s GSP also grew by 0.4 per cent over the
same period.3
2 Population figures: Source ABS 3101.0 Australian
Demographic Statistics, June 2010
3 GSP figures: Source ABS 5220.0 Australian National
Accounts: State Accounts.
The Greenhouse Indicator - Annual Report 2010 26
0.045
0.05
0.055
0.06
0.065
0.07
0.075
W1
W3
W5
W7
W9
W11
W13
W15
W17
W19
W21
W23
W25
W27
W29
W31
W33
W35
W37
W39
W41
W43
W45
W47
W49
W51
Tas Weekly Emissions 2010
2010
3.015
2.43
3.09
0
0.5
1
1.5
2
2.5
3
3.5
1990 2000 2010
Tas - Total Annual EmissionsTonnes CO2-e (Mil)
Tonnes C02e (mil)

The Greenhouse Indicator - Annual Report 2010 27
NOTE ON METHODOLOGY
Information on The Greenhouse Indicator’s methodology can be found at http://www.theclimategroup.org/the-
greenhouse-indicator/methodology/
Please note that, as part of a regular review of the Indicator, the methodology was updated during 2010. As a result
this report now covers additional emissions from gas used for domestic and industrial purposes in South Australia,
Queensland and NSW.
The Climate Group would like to acknowledge Green Energy Markets for its assistance in preparing this report. For more information visit www.theclimategroup.org/indicator The Climate Group Level 17, 1 Nicholson Street, Melbourne, VIC 3000 Tel: +61 3 9668 5798 [email protected]

The Greenhouse Indicator - Annual Report 2010 28
ANNEX
Greenhouse Indicator 2010 Annual Summary Greenhouse Emissions (mill tonnes CO2 equiv) VIC NSW QLD SA Combined
2009 Coal 62.77 62.47 43.08 4.59 172.91Gas 12.36 9.03 8.87 6.81 37.07Petroleum 24.60 34.50 28.90 7.63 95.63TOTAL 99.72 106.00 80.85 19.03 305.61
2010 % change
% change
% change
% change
% change
Coal 62.33 ‐0.69% 56.21 ‐10.02% 41.28 ‐4.19% 4.38 ‐4.54% 164.20 ‐5.04%Gas 12.12 ‐1.88% 9.51 5.33% 10.12 14.12% 6.71 ‐1.53% 38.47 3.77%Petroleum 24.59 ‐0.02% 35.00 1.46% 28.89 ‐0.04% 7.81 2.41% 96.30 0.70%TOTAL 99.05 ‐0.67% 100.73 ‐4.98% 80.29 ‐0.70% 18.90 ‐0.68% 298.96 ‐2.17%
Change from 2009 ('000s tonnes) ‐670.97
‐5276.60 ‐565.82 ‐129.45 ‐6642.84
% Change from 1990 29.24% 26.28% 115.51% 15.22% 42.32%% Change from 2000 0.22% 9.28% 40.40% 10.32% 12.68%
Breakdown by source Coal 62.93% 55.81% 51.41% 23.17% 54.92%Gas 12.24% 9.44% 12.60% 35.49% 12.87%Petroleum 24.83% 34.75% 35.98% 41.34% 32.21%TOTAL 100.00% 100.00% 100.00% 100.00% 100.00%
Average weekly 1.905 1.937 1.544 0.363 5.749

The Greenhouse Indicator - Annual Report 2010 29