greenhouse gas inventory - facilities management · (presidents’ climate committment: about us,...
TRANSCRIPT

Greenhouse GasInventory

THE UNIVERSITY OF NORTH CAROLINA AT CHARLOTTE2
In October 2009, UNC Charlotte Chancellor Philip Dubois signed the American College and University Presidents’ Climate Commitment, thereby con-firming that UNC Charlotte will strive to become greenhouse gas neutral. The commitment means a number of actions must be undertaken, including an inventory of greenhouse gasses. This report is that inventory and is the baseline from which the uni-versity will measuer the success of strategies put in place to become greenhouse gas neutral.
I would like to thank the following people, all of whom made significant contributions to this report by providing information, analyzing data, and being patient with my repetitive questions. -D. Jones
Diane BizzellMike BurrielloSusan CarterGary CatonEric DelmelleMary DicksonNate DoolittleGloria ElliottKathy FisherPeter FranzKelly Freshcorn Alphonso HaiglerAnnette Heller Chris Henderson John IvesPhil JonesKendra KooksLarry LaneMark LariviereWarren MonkDoug PierceLuke PokrajacKate PopejoyBrian RichardsonPaula Rinnix Beverly SetzKen SmithTom SparksWimberley StarrJohn Storch Tom StuttsMelanie WitherspoonEllen E. Zavala

2009 GREENHOUSE GAS INVENTORY3
Table of Contents
Chancellor’s Statement 4
Executive Summary 5
Background 7
Emissions Inventory Methodology and Boundaries 10
Scope 1 Emissions 14
Scope 2 Emissions 22
Scope 3 Emissions 25
Next Steps 31

THE UNIVERSITY OF NORTH CAROLINA AT CHARLOTTE4
A Message from the Chancellor
In October of 2009, in consultation with our Board of Trustees, I signed the American College and University Presidents’ Climate Commitment (ACUPCC). The ACUPCC describes itself as “a high-visibility effort to address global warming by garnering institutional commitments to eliminate net greenhouse gas emissions and accelerate the research and educational efforts of higher education to equip society to re-stabilize the earth’s climate.”
The first step toward reducing our greenhouse gasses is to acquire an understanding of the sources and quantities of greenhouse gas emissions attributed to UNC Charlotte. I am pleased to introduce our first UNC Charlotte Greenhouse Gas Inventory. This report identifies the sources and quantities of our greenhouse gas emissions and will be the starting point for developing mitigation strategies to reduce these emissions. The report includes input from across the university and reflects the interest of our broader community on how we will be responsible global citizens.
As North Carolina’s urban research university, UNC Charlotte maintains a particular commitment to addressing the cultural, economic, educational, environmental, health, and social needs of the greater Charlotte region. We are committed to developing an environmentally responsible and sustainable campus integrated with the retail and residential neighborhoods that surround us. This greenhouse gas inventory is an important step in honoring that commitment.
Philip Dubois, PhDChancellorUniversity of North Carolina at Charlotte

2009 GREENHOUSE GAS INVENTORY5
Executive Summary
In October 2009, Philip Dubois, Chancellor of UNC Charlotte, signed the American College and University Presidents’ Climate Commitment to become greenhouse gas (GHG) neutral. Signing ACUPCC committed UNC Charlotte to undertake a number of steps — one being to undertake a campus wide green house gas inventory. This baseline inventory will be used to measure progress toward becoming green house gas neutral.
The inventory was conducted by quantifying emissions in three categories known as scopes. Emissions from all six internationally recognized greenhouse gasses are quantified in this assessment.
➢ Scope 1: Direct emissions from sources owned by UNC Charlotte.➢ Scope 2: Indirect emissions from purchased electricity.➢ Scope 3: indirect emissions from commuting, air travel and waste disposal.
Based on current practices UNC Charlotte emits 104,870 metric tons of CO2e annually.
➢ Scope 1: 20,511 metric tons of CO2e ➢ Scope 2: 65,686 metric tons of CO2e➢ Scope 3: 34,279 metric tons of CO2e
Emissions SummaryThe following graphs provide an overall picture of greenhouse gas emissions related to the activities of UNC Charlotte.
The majority of emissions on campus are a result of purchased electricity and employee and student commuting. This emissions profile will pose great challenges ahead as the university aims to achieve net zero greenhouse gas emissions. Infrastructure requirements such as the future of light rail will potentially have a great impact the on the choice and effectiveness of emissions reduction strategies chosen by UNC Charlotte.
Projected Emissions to 2025 Based on Business as Usual
Other On-Campus
Stationary 15%
Refrigerants & Chemicals
1%
Purchased Electricity
55%
Faculty / Staff Commuting
6%
Student Commuting
15%
Directly Financed Air
Travel 1%
Scope 2 T&D Losses
5%
Emissions by Source
Total Emissions by Scope

THE UNIVERSITY OF NORTH CAROLINA AT CHARLOTTE6
Next Steps
The initial greenhouse gas inventory is the first step taken to reduce greenhouse gasses. As implied, the initial inventory provides the baseline from which our progress to greenhouse gas neutrality will be measured and monitored.
There are a number of next steps the university shall take as it aims to achieve the goal of cli-mate neutrality. Among them are the following:
➢ A comprehensive Climate Action Plan will be developed and submitted to ACUPCC by Jan. 15, 2012. The CAP will outline long and short-term goals and targets to be achieved. The CAP will delineate the associated cost and/or benefits and the estimated level of GHG reduc-tion of programs to be implemented.
➢ A campus-wide involvement Climate Action Plan group will be established comprising faculty, students and staff. The group will work to develop the GHG mitigation programs to be incorporated into the CAP.
➢ A campus-wide awareness campaign will be developed to inform the campus commu-nity of the need to be involved in the CAP process.
➢ Long range plans such as the Campus Master Plan, sustainability plan and university strategic plans will at differing levels reflect the findings of the Climate Action Plan to ensure that this issue is infused within all decision making processes. GHG neutrality cannot be seen as an afterthought — it has to be seen as integral to the University.
Executive Summary

2009 GREENHOUSE GAS INVENTORY7
Background
The University of North Carolina at Charlotte is a rapidly growing campus 10 miles northeast of Charlotte within Mecklenburg County. Since 2000, student enrollment has increased by more than 31%. To accommodate this growth, the university has added about 1.2 million square feet of classroom, office and laboratory space since 2003. With such growth comes the responsibility to understand that the university has positive and negative impacts on the economic, social and environmental systems that we depend upon regionally, nationally and globally.
Why Address Greenhouse Gasses?
At some point, all activities of UNC Charlotte give rise to greenhouse gas emissions. Anthropogenic emissions of greenhouse gasses, primarily from energy use, contribute to climate change. These anthropogenic emissions change the composition of the atmosphere and thus interfere with the natural flows of energy (Karl & Trenberth 2003). This disruption of the energy flows means less heat is radiated back to space, leading to a warmer atmosphere, in turn impacting the climate. Possible consequences of climate change are a rise in the sea level and altered weather patterns affecting temperature and precipitation norms.
This institution believes, that as a leader in the community, it has a moral responsibility to reduce greenhouse gas emissions for economic, social and environmental benefits.
This greenhouse gas inventory and subsequent Climate Action Plan will enable the University to set in place strategies to reduce greenhouse gasses associated with its operations, monitor progress and engage the academic, student and staff communities in this process.
UNC Charlotte’s Commitment to the Environment
In 1987, students established the University’s first recycling program, which has evolved into a campus- wide recycling program diverting about
40 different categories of materials from the waste stream. Students continue to influence the environmental performance of the university and have voted for a number of initiatives promoting sustainability practices. Two of the most notable votes have been to incorporate green technologies in the Student Union Building completed in July 2009, which has influenced the adoption of green building practices on campus. The second notable vote was for students to establish a student green fee. Each student enrolled in 12 or more credit hours contributes to the money allocated by the Green Initiative Committee (a student-run organization) through the Green Fee, which is currently set at $1 per student per semester. . The CGI solicits ideas promoting sustainability on campus from the student body and funds those projects.
In spring 2009, the Student Government Sustainability Officer wrote to the Chancellor asking that he consider and sign the American College and University Presidents’ Climate Commitment. The Chancellor signed the ACUPCC in October 2009. This report is a result of that action.
The University commitment to sustainability extends beyond the student body to the academic community and staff of the institution. The University has established a campus-wide sustainability committee with representation from the academic, staff and student community. This committee is responsible for recommending actions that the university may take in its efforts to integrate sustainability initiatives University-wide.
UNC Charlotte is privileged to have extensive research opportunities guided by the many centers and institutes on campus that are directly or indirectly involved in sustainability initiatives. Examples include The Urban Institute, with a mission “to seek solutions to the social, economic and environmental challenges facing our communities;” The Center for Applied Geographic Information Sciences, an applied research center that focuses on the use of GIS concepts and technologies to address spatial

THE UNIVERSITY OF NORTH CAROLINA AT CHARLOTTE8
dimensions of environmental and socio-economic problems; and, most recently, the Infrastructure Design Environmental and Sustainability Center (IDEAS), which was established to hasten the shift from unsustainable infrastructure, housing, and technology design to practices more attuned to the challenges of the 21st century. There are, of course, more centers as well. The Daylighting and Energy Performance Laboratory is an applied research unit of the School of Architecture at the University of North Carolina at Charlotte’s Center for Integrated Design. Colleges also have departments and projects that reach out into the business and other communities such as the Environmental Assistance Office, which provides pollution prevention assistance to small businesses in the greater Charlotte region and supports regional wide initiatives such as Clean Air Works!
The University is aware that it needs to “walk the walk”, and has invested resources into improving the environmental performance of its operations. Examples are improving energy performance, constructing LEED-certified buildings, improving maintenance and operations such as implementing green cleaning programs, construction and demolition recycling, green purchasing, and water efficiency programs. However, the University is committed to doing more. The signing of the ACUPCC and the future development of a Climate Action Plan presents a great opportunity to develop a cohesive and coordinated approach to addressing and delivering improved sustainability performance across the University, where the academic, student and staff communities are empowered to achieve the goal of climate neutrality.
What is the American College & University Presidents’ Climate Commitment?
“The American College & University Presidents’ Climate Commitment is a high-visibility effort to address global warming by garnering institutional commitments to neutralize greenhouse gas emissions and to accelerate the research and educational efforts of higher education to equip society to re-stabilize the earth’s climate.
(Presidents’ Climate Committment: about us, 2007-2008).
As of the writing of this report, 675 colleges and universities have signed the commitment, of which 22 are in North Carolina.
Key Elements of the Commitment
Establish an institutional structure to guide the “development and implementation” of the commitment. The committee should be staffed with faculty, staff and students.
Measure greenhouse gas emissions: Institutions shall complete an annual greenhouse gas emissions inventory that is made publicly available.
Take Tangible Actions: While the Climate Action Plan is being developed, signatories agree to undertake two or more of the following tangible actions:
a. Establish a policy that all new campus construction will be built to at least the U.S. Green Building Council’s LEED Silver standard or equivalent.b. Adopt an energy-efficient appliance purchasing policy requiring purchase of ENERGY STAR certified products in all areas for which such ratings exist.c. Establish a policy of offsetting all greenhouse gas emissions generated by air travel paid for by the institution. d. Encourage use of and provide access to public transportation for all faculty, staff, students and visitors at the institutione. Within one year of signing this document, begin purchasing or producing at least 15% of the institution’s electricity consumption from renewable sources. f. Establish a policy or a committee that supports climate and sustainability shareholder proposals at companies where our institution’s endowment is invested.
Background

2009 GREENHOUSE GAS INVENTORY9
g. Participate in the Waste Minimization component of the national RecycleMania competition and adopt three or more associated measures to reduce waste.
Climate Action Plan: Within two years of signing the commitment, develop a Climate Action Plan that includes a target date and milestones for achieving climate neutrality
Reporting Requirements: Those who sign the commitment agree to make their institutional structures, greenhouse gas inventories, Climate Action Plans and progress reports publically available.
Why did UNC Charlotte Sign the ACUPCC?
➢ It will enhance UNC Charlotte’s reputation as a role model in environmental stewardship.➢ It complements a UNC Tomorrow major finding: “UNC should assume a leadership role in addressing the state’s energy and environmental challenges.”➢ It complements our energy reduction goals, Mecklenburg County’s clean air initiative, and our stated desire to be good stewards of the environment ➢ It will help prepare students for success in the green economy.
Preparing for the Future
In signing and implementing the ACUPCC, UNC Charlotte will continue its tradition of regional leadership. The prospect of a carbon constrained economy will lead and has led to governments adopting fiscal tools such as carbon taxes and pollution prevention policies in order to influence the behavior of consumers. In a future where the cost of pollution is born to a greater extent by the polluter, organizations are going to have to adopt strategies to minimize this financial risk. Completing a greenhouse gas inventory and developing greenhouse gas mitigation strategies will help the university prepare for this carbon-
constrained future. There are many tangible benefits that may accrue to the university, such as increased efficiency, research opportunities, enhanced student recruiting, and educating the student body on this important issue.
The Challenge
As the University strives to achieve the goal of becoming net greenhouse gas neutral, the institution will have to fundamentally change the business as usual scenario. Many strategies and decisions will be made looking through the greenhouse gas lens, which will have a profound impact for UNC Charlotte. How will we successfully achieve greenhouse gas neutrality goal, while delivering our core functions of education and research? This question and resulting opportunities will be explored and delineated in the upcoming Climate Action Plan.
Background
The Greenhouse Effect: Source UNEP http://maps.grida.no/go/graphic/greenhouse-effect

THE UNIVERSITY OF NORTH CAROLINA AT CHARLOTTE10
Emissions Inventory Methodology
This is the first greenhouse gas emissions inventory for UNC Charlotte and thus constitutes the baseline inventory from which future emissions reductions or increases will be measured. This greenhouse gas inventory reports data for the fiscal year from July 1, 2008 to June 30, 2009. All six internationally recognized greenhouse gasses are reported in this assessment.• Carbon dioxide (CO2)• Methane (CH4)• Nitrous oxide (N2O)• Hydroflurocarbons (HFCs)• Perflurocarbons (PFCs)• Sulfur hexafluoride (SF6)
Reporting Guidance and Principles
In order to produce a greenhouse gas inventory that is robust and verifiable, guidance in completing this inventory has been taken from the Climate Action Registry and the Clean Air Cool Planet Campus Carbon Calculator. In addition, the inventory is based on recognized greenhouse gas accounting and reporting principles, as defined in the Climate Action Registry.
➢ Relevance: Ensuring the inventory reflects our greenhouse gas emissions.➢ Completeness: Accounting for all emissions within the defined inventory boundary.➢ Consistency: Use of consistent methodologies to allow for comparisons over time and document changes to data, inventory boundaries and data collection methods.➢ Transparency: All issues are addressed in a factual manner and an audit trail exists.➢ Accuracy: Ensure that the quantifications of emissions are true and that uncertainties and omissions are clearly stated.
Reporting Boundaries
One of the first tasks required to develop the greenhouse gas (GHG) inventory for UNC Charlotte was establishing the limits of its organization and operational control boundaries.
The methodology used for this report to establish the organizational boundaries — from where emissions will be measured — is the operational control approach. Under this approach, UNC Charlotte will account for GHG emissions from operations that are under the University’s authority to introduce, direct and implement policies that control an entity’s activities, purchases and other operations. The limits of operational control for the University were developed from the list of university assets submitted to the North Carolina Department of Insurance. This list was obtained through the University Risk Management Office and cross-referenced with a Facilities Management building database for completeness.
The University of North Carolina at Charlotte owns, leases or exercises operational control over more than 136 academic, residential and operational buildings and about 1,000 acres across the campus, and including the Ben Craig Center about two miles west of the main UNC Charlotte campus. Sections of UNC Charlotte property are controlled by the UNC Charlotte Foundation and Endowment and are not under the direct operational control of UNC Charlotte. These sections are land holdings of the Foundation. In addition, the Charlotte Community Design Studio – Cads, Harrisburg Public Warehouse and Adult Day Care Center were not included in the computations of GHGs, as these are leased properties over which the university does not have operational control. See Chart for a breakdown of building by area type on campus.

2009 GREENHOUSE GAS INVENTORY11
Emissions Inventory Methodology
Chart 4: Building Area Breakdown at UNC Charlotte
Once the organizational boundaries have been established, it is necessary to establish operational boundaries identifying which emissions are going to be measured. Guidance for this is provided by the Clean Air Cool Planet Campus Carbon Calculator and identified as emissions scopes.
➢ Scope 1: Direct emissions from sources owned by UNC Charlotte.➢ Scope 2: Indirect emissions directly linked to on campus energy use.➢ Scope 3: indirect emissions related to the institution that would not arise if the institution did not exist.
Diagram 2: Emissions ScopesSource: World Council of Business on Sustainable Development GHG Reporting Protocol
Data Collection Methodologies
Where possible, relevant units of activity data were collected, such as gallons of fuel used, kilowatt-hours, BTUs, miles driven and weight of materials used. The emissions factors used, associated with activity data, are those used in the Clean Air Cool Planet Campus Carbon Calculator.
The data collected may be categorized into tiers reflecting accuracy and completeness.
➢ Tier 1 Data is defined as that collected from sources that report to external agencies and use accounting protocols. ➢ Tire 2 Data is defined as that collected from internal maintenance and operations records, purchase requisitions and surveys.
Data Sources
Data for the greenhouse gas inventory was collected from numerous departments and individuals at the University.

THE UNIVERSITY OF NORTH CAROLINA AT CHARLOTTE12
Data Sources Budgets Operating budget was obtained from the University Budget Office.
Research budget was obtained from the Department of Research and Federal Relations. Energy Budget was obtained from the Facilities Management Business Office
Population Data on full and part-time student enrollment and faculty size is taken from the Office of Institutional Research UNC Charlotte Fact Book, found at http://ir.uncc.edu/irmainpage2/fbindex.html. Faculty and staff population obtained from Human Resources.
Physical Campus Data on size of the institution taken from Facilities Management Archibus Space management module and can be found at https://archibus.uncc.edu/archibus/schema/ab-core/views/process-navigator/navigator-details.axvw.
Campus stationary emissions sources
Were quantified by obtaining data on fuel used for on-campus station sources through direct metering or gallons used as determined through operating logs. This information is compiled for external reporting to Mecklenburg County Air Emissions Report.
Transportations sources
Fuel Master System and Athletics vehicle service records.
Refrigerants and chemicals
Maintenance and operations records.
Agriculture Pounds of fertilizer purchased and nitrogen content information provided by Grounds Department.
Purchased energy Annual electrical bills. Commuting Parking passes and banner ID.
Transport Survey for Commuting Habits. Charlotte Area Transit System (CATS) Ridership numbers.
Air Travel Travel reimbursements. Solid waste Office of Waste Reduction and Recycling Annual Report submitted to N.C.
State. Composting Office of Waste Reduction and Recycling Annual Report submitted to N.C.
State.
De minimums Emissions: For this initial inventory, there are no emissions classified as de minimums. In future inventories, fugitive, direct transport and solid waste emissions may be considered de minimums.
Emissions Inventory Methodology
Sources of Data

2009 GREENHOUSE GAS INVENTORY13
Data Limitations and Assumptions Used in the Greenhouse Gas Inventory
There were a number of data limitations related to this greenhouse gas inventory described below.
Scope 1 Mobile Emissions:
Emissions associated with leased vehicles by the athletics department were gathered by obtaining service records of these vehicles and estimating annual mileage. Annual mileage is divided by government fuel-efficient factors by vehicle type found at http://www.fueleconomy.gov/. For more accurate tracking, actual gallons of fuel per year per vehicle need to be logged for each vehicle.
Fuel usage reports taken from the campus fuel master system included jerry cans. This fuel was included in the gallons used figure in campus fleet as this fuel is used in machines such as leaf blowers, push mowers, etc.
Scope 2 Fugitive Sources:
Refrigerants Releases: The data for campus refrigerants releases cannot be considered complete, as a comprehensive refrigerant management plan did not exist for the reporting year of 2009. Refrigerant data submitted was collated from campus records kept in various departments and the campus work management system.
Fertilizer applications: Nitrogen-based fertilizers are applied at varying rates over about 70 acres of landscaping that are tended by the University’s ground department. Nitrous oxide and carbon dioxide emissions fertilizer applications were developed following the protocols in the Clean Air Cool Plan Carbon Calculator, which were estimated following the 2006 IPCC Guidelines for National Greenhouse Gas Inventories.
Scope 3 Emissions
Commuting: Emissions associated with campus commuters are based on a 60% population set. A number of assumptions have been made, including the following:
➢ Addresses outside the Charlotte region as defined by the Charlotte Chamber of Commerce were omitted, as it was assumed these were not commuter addresses but home billing or other addresses due to the distances. ➢ Students were assumed to commute for 38 weeks a year. Summer school was not included. Each student is assumed to make two one-way trips a day four days a week. The GEO coding exercise did not pick up the 24% of students living on campus. Therefore this number of students was added into the overall number to get a percentage of students living within one mile of campus. ➢ Assumptions were made on the number of journeys made to campus each day and days per year. Faculty assumptions were made on a 40-week year, five days a week, two one-way trips a day. Staff assumptions were made on a 48-week year, five days a week, two one-way trips a day. Assumptions on the percentage of commuters taking different modes of transport were taken from the campus master plan transportation survey.
Air miles data were collected by reviewing the travel reimbursement records for fiscal year 2008-09. To better improve the collection of air miles data it is recommended that this data be tracked electronically for easier reconciliation for future greenhouse gas inventories.
The completion of this initial inventory has highlighted the need for more robust tracking and reporting procedures to be set in place for certain criteria, which would ensure a more robust and accurate inventory.
Emissions Inventory Methodology

THE UNIVERSITY OF NORTH CAROLINA AT CHARLOTTE14
Scope 1 Emissions

2009 GREENHOUSE GAS INVENTORY15
Scope 1 Emissions
Scope 1 emissions are defined as direct GHG emissions occurring from sources that are owned or controlled by the institution and are categorized as stationary and mobile. Stationary combustion refers to the burning of fuels to produce electricity, steam, heat or power using equipment in a fixed location such as boilers, burners, heaters, furnaces, incinerators, kilns, ovens, dryers and engines.
Scope 1 stationary combustion sources at UNC Charlotte include a steam plant, regional utility plants, emergency generators, boilers and kilns. Calculations are based on total fuel used, gathered via meter readings.
Emergency generators on campus are powered by number1-4 residual oil and natural gas. Building heating and cooling requirements are provided by a combination of Regional Utility Plants, powered by natural gas and systems dedicated to a specific building. Regional Utility Plants are designed and
constructed to provide energy efficient distribution of chilled water and hot water to multiple buildings. Natural gas is also used in laboratories to fuel Bunsen burners and is not metered separately for this use. In FY 2009, UNC Charlotte consumed 345,921 MMBTU of natural gas and 5,788 gallons of residual oil.
Scope 1 Stationary combustion emissions data gathering
Data Methodology Used:
➢ Identified fuels combusted at UNC Charlotte – Information obtained from Facilities Management UNCC Actual Emissions Report to Mecklenburg County and Historical Utilities Workbook.➢ Determined annual fuel used by fuel type measured in gallons, MBTUs measured by meter reading at fuel input point. Information obtained from facilities management.➢ Fuel data entered to CACP Campus Emissions Calculator for conversion to CO2e tons.
Scope 1 Emissions

THE UNIVERSITY OF NORTH CAROLINA AT CHARLOTTE16
Scope Emission Source
Where use on campus Information source
Residual oil 1-4
Used in campus emergency generators
UNCC Actual Emissions Report to Mecklenburg County
Scope 1: Stationary sources
Natural Gas Used in main boiler, RUPs, boilers and kilns
Historical Utilities Usage Workbooks – Summary by utility worksheet
Actions and Next Steps
Facilities Management is constantly undertaking initiatives to increase energy efficiency. Energy recovery and high efficiency equipment and sys-tems are installed in new buildings. Significant energy reduction will be achieved through intensive retro-commissioning, tuning of buildings to actual requirements versus design assumptions, system retrofit modifications such as high efficiency motors and lighting, HVAC scheduling for occupancy and awareness training.
Facilities Management is planning for further infra-structure improvements through expanding meter-ing and tying meters to the building automation systems (BAS). Utilizing BAS systems will facili-tate campus wide educational programs through rolling out building dashboard systems gradually across campus.
Scope 1 Stationary emissions account for 15% per-centage of campus emissions. Strategies to reduce this “wedge” of campus emissions will be addressed in the Climate Action Plan.
Scope 1 Emissions
Scope 1 Emissions Sources Identification

2009 GREENHOUSE GAS INVENTORY17
Scope 1 Mobile Combustion Emissions Data Gathering
Mobile Combustion: Mobile combustion refers to the burning of fuels by institution-owned and operated transportation devices such as cars, trucks, tractors and buses. Emissions from commuting to and from campus by students and employees are reported separately in scope 3. UNC Charlotte scope I mobile emissions include: campus road and non-road vehicles such as tractors, mowers, service vehicles, and college vehicles. Data from January 1, 2008, were taken from the fuel data master system, which provides each campus vehicle with a unique key code that must be entered into to the system prior to fuel being dispensed. The result is that each campus vehicle has a log of actual fuel consumed. Data prior to January 1, 2008, were taken from purchase records and fleet manager recordings. Those data can’t be considered complete and verifiable.
The Climate Registry General Reporting Protocol Version1.1 offers guidance on reporting emissions from leased assets. The Climate Registry states
“When consolidating using the operational control approach, you are required to report emissions from assets for which you have an operating lease and that these will be counted as scope 1 or scope 2 emissions.” Thus, vehicles leased by Athletics are included in Scope 1 mobile emissions. Emissions from the campus shuttle are reported in scope 3 emissions.
Scope 1 mobile emissions shall not include fuel consumed by the Motor Fleet. Motor Fleet vehicles are not owned by the university and are subject to Motor Fleet Management regulations and control. Emissions from the Motor Fleet will be accounted under scope 3 emissions. As stated by Motor Fleet Management, “The Motor Fleet Management Division provides passenger vehicles to state agencies for employees in the performance of their duties. The division is a receipt-supported operation that purchases, maintains, assigns and manages the state’s centralized fleet of approximately 8,500 vehicles. The division enforces state policy and regulations concerning the use of the vehicles.” These vehicles are used by employees from all state agencies. UNC Charlotte employees using these vehicles will have emissions reported under scope 3 — Directly Financed Outsourced Travel category.
Scope 1 Emissions

THE UNIVERSITY OF NORTH CAROLINA AT CHARLOTTE18
Methodology/Protocols Used:
➢ All institution-owned vehicles are refueled at campus fuel farm. Fuel data come from Fuel Master Transactions listing from the Fleet Administrator in Facilities. Transaction listings identify vehicle, mileage, gallons per fueling and annual total. Vehicles excluded from the listing include:o Vehicles leased from the University Foundationo Leased vehicles o Motor Fleet and Police Vehicles
Scope Emission Source Where used Information Source Gasoline Used in campus fleet
vehicles Campus fuel master system from 1/1/08 – present. Information prior to 1/1/08 – found in petroleum displacement program data tracking.
Diesel Used in campus fleet, including tractors, work equipment, grounds equipment,
1. Ditto above -
Natural gas Not used 2. E85 Used in campus
alternate fuel vehicles 3. Ditto above -
B5, B20, Hydrogen Not used 4.
Scope 1: Direct transportation sources – university Fleet + Athletics
Electric Used in campus on site commuting
5.
➢ Fuel use on the Athletics-leased 15-passenger vans was calculated by reviewing year-beginning and year-ending mileage taken form service records kept by Athletics. Annual mileage was calculated and EPA vehicle mileage estimates used to calculate annual fuel gallons used. This total was added to direct transport emissions, university fleet, and gasoline gallons.➢ Fuel data total gallons for gasoline, diesel, E85 entered to CACP Campus Emissions Calculator for conversion to CO2e tons. Natural gas and B5/B20 were not used in baseline line FY 2008/2009.
Scope 1 Emissions
Scope 1 Mobile Combustion Data Sources

2009 GREENHOUSE GAS INVENTORY19
Actions and Next Steps
Future data need to more effectively track fuel use from the Athletics department by tracking actual gallons use per annum.
Over the past few years, Facilities Management at UNC Charlotte has developed and implemented an ambitious strategy to have a cleaner and greener fleet. UNC Charlotte’s Automotive Fleet administration has taken a proactive stance by creating a fleet of alternatively fueled vehicles. These electric vehicles have replaced many gasoline carts and similar high emissions vehicles all over
Scope Emissions Source Where used Information Source Scope 1: refrigerants and chemicals
(HFC/ PFC) Used in campus HVAC Systems
Maintenance and operations and Housing and residence life.
Refrigerators (HFC/PFC)
Used in campus refrigerants
Maintenance and operations.
Sulfur hexafluoride
Labs (The clean room in Grigg Hall uses sulfur hexafluoride as a cleaning agent on microchip circuits)
Clean room operations Manager Grigg Hall.
Fertilizer application Campus grounds Grounds department/product purchase orders/purchasing department records.
the campus. The University has added about 97 Electric Utility Carts and low-speed vehicles along with 19 flex-fuel (E-85 or gasoline) vehicles for a total of 116 alternative-fuel vehicles to UNC Charlotte’s Automotive Fleet. Since FY 2006, this displacement program has reduced petroleum use by 26%.
All future vehicles must either be Electric Powered or Flex Fuel (E-85). Our policy is to not purchase any gasoline-powered vehicles.
The Climate Action Plan will outline further actions the university may take to reduce emissions associated with on-campus vehicles.
Scope 1 Emissions
Scope 1 Refrigerants and Agriculture Data Sources

THE UNIVERSITY OF NORTH CAROLINA AT CHARLOTTE20
Scope 1: Refrigerants and Agriculture Emissions
This section tracks those greenhouse gas emissions arising from refrigerants and fertilizer applications.
Refrigerants: Obtain the total direct GHG emissions due to the intentional or unintentional release of GHGs in the use of campus HVAC equipment, campus refrigerators and campus labs and grounds fertilizer applications. Refrigerant release data was tracked and collected through the Facilities Maintenance and Operations Department. Data on refrigerant uses were collected from the records of service vendors and through the UNC Charlotte internal work management and request system.
The majority of refrigerants used on campus are for heating ventilation and air conditioning equipment and kitchen refrigeration equipment.
Agriculture sources of greenhouse gas released on campus are limited to fertilizer application on campus grounds. Nitrogen-based fertilizers are applied at varying rates over about 70 acres of landscaping tended by the University’s grounds department.
Data Methodology Used:
Refrigerants:
➢ Obtained external vendor service reports and internal work order reports detailing service completed and refrigerant type and quantity added to system, not including recovered refrigerant added back to the systems.➢ Determined total refrigerant pounds added to system by refrigerant type per year.➢ Refrigerant pounds data entered to CACP Campus Emissions Calculator for conversion to CO2e tons.
Agriculture Sources➢ Annual campus fertilizer purchases obtained from purchase requisitions. It is assumed that total pounds of fertilizer purchased are applied on campus.➢ A mean nitrogen content of purchased fertilizer was used for the Campus Carbon Calculator.➢ Total pounds and nitrogen content entered on to the campus Carbon Calculator to determine CO2e.
Refrigerant Assumptions
RB 276 is a blend of 79% R 134a, 19% HCFC 142b and 2% lubricant http://www.aa1car.com/library/tr497.htm. For the purpose of this greenhouse gas inventory RB 276 usage pounds were entered in to the CACP based on the above percentages and added to usages of R 134a and HCFC respectively, where HCFC 142b can be found.
Scope 1 Emissions
2009 GREENHOUSE GAS INVENTORY21
Actions and Next Steps
It will be to the benefit of the university to phase out those refrigerants with the highest global warm-ing potential with ones that have a reduced global warming potential as well as tracking those refriger-ants that are and have been phased out. The most effective way to accomplish this will be to develop a comprehensive refrigerant management plan to be applied across all functions and departments of the university.
As for fertilizer applications, a more accurate meth-od of tracking actual applications will help with the future accuracy of greenhouse gas inventories.
Scope 1 Emissions

THE UNIVERSITY OF NORTH CAROLINA AT CHARLOTTE22
Scope 2 Indirect Emissions

2009 GREENHOUSE GAS INVENTORY23
Scope 2 Emissions
Scope 2 emissions are indirect GHG emissions that are a consequence of activities that take place within the organizational boundaries of the institu-tion, but occur at sources owned or controlled by another entity such as purchased electricity.
Scope 2 Emissions Data Gathering
UNC Charlotte purchases electricity from Duke Energy. Based on information provided to the Public Utilities Commission, Duke Energy uses coal, nuclear and hydroelectric power for electric-ity generation where 51% is from coal, oil and gas, 48% nuclear and 1% hydro (Duke 2009). The campus has two substations feeding electricity onto the campus grid. It also has 14 buildings that are directly fed from Duke Energy, as well as the Ben Craig Center off campus. Meter readings and invoices from the two substations and the directly fed buildings, including the Ben Craig Center, are tracked and recorded monthly to determine total kWh campus consumption. This information is recorded within Facilities Management. The total kWh recorded were entered into CACP Campus Emissions Calculator for conversion to CO2e tons. Regional variations in energy generation fuel mix are accounted for by selecting the US EPA Grid region in the Campus Carbon Calculator.
UNC Charlotte does not purchase any heating, cool-ing or steam loads.
In FY 2009, UNC Charlotte consumed 125 million kWh of electricity supplying approximately 5.4 mil-lion square feet of academic and residential space on campus, giving rise to about 65,000 metric tons of carbon dioxide, representing about 55% of car-bon dioxide equivalent of total campus emissions.
Actions and Next Steps
UNC Charlotte has been proactive in reducing energy use on campus. It has adopted a number of approaches toward developing sustainable energy use practices, which may be categorized as energy management and increasing efficiency of energy use in facilities and equipment.
Energy Management
As the old management axiom goes, ‘If you can’t measure it, you can’t manage it.’ There has been a concerted effort to update and automate utility monitoring practices at UNC Charlotte. Older meters are being replaced with new models that have the capability of communicating to the existing Building Automation System through web-based monitoring. The new models also are being installed in all new buildings and major renovations.
UNC Charlotte has issued a Request For Proposals to provide energy services and energy-related capital improvements to eight facilities through a “Guaranteed Energy Savings Contract,” often referred to as a “Performance Contract.” As of the writing of this report, the energy services company has been selected, and the performance grade audit was being performed.
The University continues to add utility monitoring to existing buildings that do not have active water, electric, and/or steam or hot water meters. Older meters are being replaced with new meters that have the capability of communicating to the existing Building Automation System to allow trending and archiving of energy usage data
Web-based monitoring is provided on all new buildings and major renovations to existing buildings. These buildings include state-of-the-art DDC Control Systems with utility monitoring and trending. Retro Commissioning and building energy audits continue to be a high priority as funding is available. Load-shedding software was installed on our Building Automation System and is being implemented on selected HVAC systems.
Scope 2 Indirect Emissions

THE UNIVERSITY OF NORTH CAROLINA AT CHARLOTTE24
The Bioinformatics Building was occupied in July 2009 and was the first LEED Silver Building for UNC Charlotte. North Carolina G.S. 143 135.37 and LEED principles for sustainability — particularly relating to energy and water use — are defining design guidelines for UNC Charlotte new buildings.
Building HVAC and lighting controls are updated as renovations occur. New buildings have state-of-the-art Building Automation System controls. New and existing building control systems will be evaluated and adjusted for optimum energy usage.
The Energy Conservation Manager position to manage UNCC’s energy use throughout the campus complex and utility plants is now approved, and applications are in review. The Energy Manager will form an energy conservation action team with representation from appropriate departments to help lead the University to meet and exceed the North Carolina state-mandated conservation goals.North Carolina Session Law 2010-196 HB 1292 has provided an added incentive for universities in the University of North Carolina System to increase
energy savings programs. “Session Law 2110 – 196 HB 1292 AN ACT TO PROVIDE THAT ANY ENERGY SAVINGS REALIZED BY CONSTITUENT INSTITUTIONS OF THE UNIVERSITY OF NORTH CAROLINA SHALL REMAIN AVAILABLE TO THE INSTITUTION AND A PORTION OF THOSE ENERGY SAVINGS SHALL BE USED FOR OTHER ENERGY CONSERVATION MEASURES; AND TO EXPAND THE USE OF OPERATIONAL LEASES BY LOCAL BOARDS OF EDUCATION.”Any potential savings accrued to the University may now be invested in campus-wide sustainability and climate change efforts leading to continually improving campus sustainability programs.
In the next inventory, scope 2, indirect emissions from purchased electricity, will use customized emissions factors as reported to the Public Utilities Commission as being more representative of electricity generated in the Charlotte Mecklenburg area of North Carolina.
Scope 2 Indirect Emissions

2009 GREENHOUSE GAS INVENTORY25
Scope 3 Emissions

THE UNIVERSITY OF NORTH CAROLINA AT CHARLOTTE26
Scope 3 Emissions
Scope 3 emissions are described as “Other emis-sions attributed to your institution, deemed “op-tional” emissions by corporate inventories. This includes emissions from sources that are neither owned nor operated by your institution but are either directly financed (i.e., commercial air travel paid for by the institution) or are otherwise linked to the campus via influence or encouragement (i.e., air travel for study abroad programs and regular fac-ulty, staff and student commuting). UNC Charlotte shall report on the following scope 3 emissions➢ Commuting emissions from regular com-muting by faculty, staff and students➢ Directly financed outsourced from air travel paid for by the institution➢ Purchased paper➢ Solid waste emissions
User group Drive alone
Car pool Transit
Students 63% 4% 2% Faculty 92% 3% 1% Staff 89% 6% 1% Total 84% 5% 1%
Miles from campus % of Students
1 33%
2 4%
5 11%
10 13%
20 22%
30 17%
Average miles commute student 11.76
Miles from campus % of Employees
1 1
2 2
5 12
10 30
20 41
30 14
Average Miles Commute Staff 16.05
Commuting
Scope 3 Commuting Emissions Data Gathering
Data for commuting were taken from the 2009 Transport Survey completed for the Master Plan. Commuting habits and percentages of commut-ers using different modes of transportation were taken from the transportation survey competed for the 2009 campus Master Plan. To determine total miles students commute to campus, Eric Delmelle of the UNC Charlotte Geography and Earth Sci-ence departments used GIS technology to identify addresses of students and to calculate mileage to campus. Student addresses were obtained from those provided for campus parking permits. Those addresses outside the Charlotte Region designated by the Charlotte Chamber of Commerce were omit-ted, as they were considered too distant to be daily commuting.
To calculate the mileage data, the following as-sumptions were made:
Faculty commuting 5 days a week for 40 weeks a year. Student commuting 4 days a week for 40 weeks a year.Staff commuting 5 days a week for 48 weeks a year.
Scope 3 Emissions
Employee Distance from Campus
Student Distance from Campus
Commuting Mode by Pop. Group

2009 GREENHOUSE GAS INVENTORY27
Next Steps
Banner IDs and addresses with associated parking details will continue to be obtained. Addresses will be mapped using GIS, with average one-way com-mute from address to university obtained in miles. This method was initially used to determine GHG gasses associated with student commuting. How-ever, there was a major discrepancy between this data finding and the findings of the Campus Master Plan commuter survey. For future GHG inventories, travel surveys should be done at the time of obtain-ing parking decals. Questions to be asked include living address vs. billing address, modes of trans-port and frequency of commute.
Scope 3 Emissions
Address GIS Mapping - Mecklenburg and surrounding counties
THE UNIVERSITY OF NORTH CAROLINA AT CHARLOTTE28
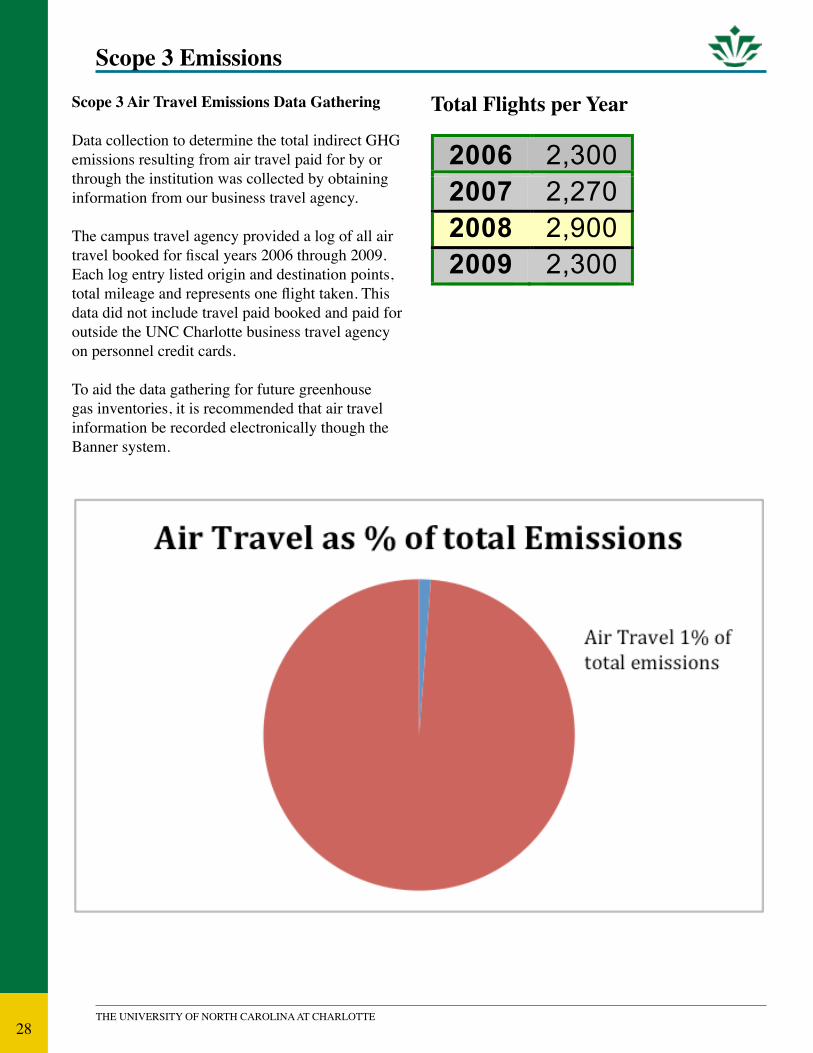
Scope 3 Air Travel Emissions Data Gathering
Data collection to determine the total indirect GHG emissions resulting from air travel paid for by or through the institution was collected by obtaining information from our business travel agency.
The campus travel agency provided a log of all air travel booked for fiscal years 2006 through 2009. Each log entry listed origin and destination points, total mileage and represents one flight taken. This data did not include travel paid booked and paid for outside the UNC Charlotte business travel agency on personnel credit cards.
To aid the data gathering for future greenhouse gas inventories, it is recommended that air travel information be recorded electronically though the Banner system.
Total Flights per Year
2006 2,300 2007 2,270 2008 2,900 2009 2,300
Scope 3 Emissions

2009 GREENHOUSE GAS INVENTORY29
Scope 3 Solid Waste and Recycling Data Gathering
UNC Charlotte has an excellent waste reduction and recycling program. As of the writing of this report, The Office of Waste Reduction and Recycling recycles some 40 different waste streams, including construction and demolition waste and food waste. In 2008-09, 3,761,160 pounds of mixed solid waste was sent to the landfill, 1,584,917 pounds of materials were recycled, while14,668 pounds of food waste were composted.
Recycling Materials Weight Report July 1st 2008 – June 30th 2009
Pounds Material
2,500 Aluminum
8,242 Ballasts 2,043 Batteries 9,000 C/D Recycled 316,322 Cardboard 109,275 Commingled 14,688 Composted Food 1,537 Composted Other 21,847 Cooking Oil 19,661 Edible Food 51,250 Electronics 11,896 Fluorescent Bulbs 3,099 Hard Back Books 7,483 Motor Oil 210,162 News Blend 322,664 Office Blend 200 Oil Filters 26,455 Pallets 43,746 Reused Materials 172,317 Scrap Metal 8,643 Solvents 4,000 Styrofoam (Polystyrene) 4,470 Tires 4,517 Toner Cartridges 208,900 Yard Waste 1,584,917 Total pounds recycled
Scope 3 Emissions

THE UNIVERSITY OF NORTH CAROLINA AT CHARLOTTE30
Peer Institutions
The graph below compares UNC Charlotte scope 1, 2 and 3 emissions with peer institutions that have com-pleted and submitted a greenhouse gas inventory.
As with most of our peer institutions, scope 2 emissions represent the largest percentage of total campus emissions. Focusing on how and where energy is consumed on campus and what fuel source is used for that energy will need to be priority areas of focus as UNC Charlotte develops the Climate Action Plan to achieve net greenhouse gas neutrality.
Scope 3 Emissions

2009 GREENHOUSE GAS INVENTORY31
This initial greenhouse gas inventory has identified and quantified the six greenhouse gas emissions defined under the Kyoto Protocol. The inventory shows that 17% of emissions are directly attributed to on-campus sources, 55% of emissions are associ-ated with electrical generation away from campus, and 28% are associated with commuting and travel.
There are a number of critical next steps that the campus will take, which are outlined below.
Short Term 2011 – 2015
A comprehensive Climate Action Plan will be developed and submitted to ACUPCC by May 15, 2012. The CAP will outline long and short-term goals and targets to be achieved. It also will delin-eate the associated cost and/or benefits and esti-mated level of GHG reduction of the programs to be implemented. The CAP will be created by task forces working in areas of:
Curriculum and Research Energy Transportation Solid Waste, Purchasing and Food Communications
A campus-wide awareness campaign will be devel-oped to inform the campus community of the results of this GHG inventory. Also, efforts will be made to open up the Climate Action Planning process to the campus community, thus providing the opportunity for all members of the community to be involved.
In terms of conducting the next inventory, steps must be taken to improve the data collection. These improvements are addressed in the appendices of this document. The University may also wish to widen the scope of the greenhouse gas inventory to include paper purchasing. In addition, as the univer-sity grows and adds assets such as the new Center City Building off campus, these will need to be included in future inventories.
2015 – and Beyond Long range plans such as the Campus Master Plan, sustainability plan, and university strategic plans will at differing levels reflect the findings of the Cli-mate Action Plan to ensure that this issue is infused within all decision-making processes. GHG neutral-ity cannot be seen as an afterthought. It has to be seen to be integral to the University.
As far as possible, UNC Charlotte does not want to purchase carbon offsets to achieve greenhouse gas neutrality. In this case, the University may wish to investigate carbon credit opportunities such as campus forest-management programs either on or off campus.
Next Steps