green ict...extra financial research 12.06.2008 dr. hendrik garz, claudia volk westlb ag...
TRANSCRIPT

Green ICT –Pink elephants or real returns?
Dr Hendrik GarzFAIRE conference, Paris, 12 June 2008

12.06.2008Extra Financial Research
Dr. Hendrik Garz, Claudia Volk
WestLB AGHerzogstraße 1540217 Düsseldorf
page 2
ICT - a clean industry!?
The carbon footprint of one Google search ……
….. is similar to that of an 11W energy savings light bulb operating one hour.
With 150-200 m searches per day Google demands about 3,000 photovoltaic power plants.
=̂
12.06.2008Extra Financial Research
Dr. Hendrik Garz, Claudia Volk
WestLB AGHerzogstraße 1540217 Düsseldorf
page 3
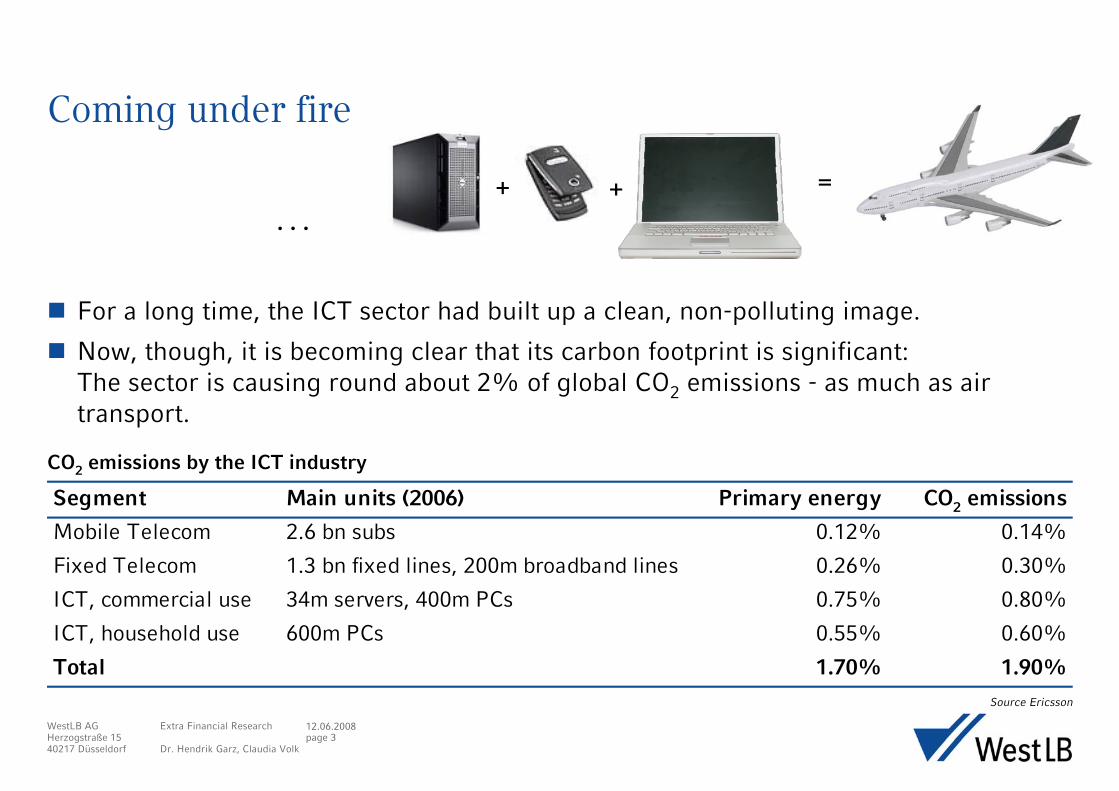
Coming under fire
Segment Main units (2006) Primary energy CO2 emissions
Mobile Telecom 2.6 bn subs 0.12% 0.14%
Fixed Telecom 1.3 bn fixed lines, 200m broadband lines 0.26% 0.30%
ICT, commercial use 34m servers, 400m PCs 0.75% 0.80%
ICT, household use 600m PCs 0.55% 0.60%
Total 1.70% 1.90%Source Ericsson
CO2 emissions by the ICT industry
For a long time, the ICT sector had built up a clean, non-polluting image.
Now, though, it is becoming clear that its carbon footprint is significant: The sector is causing round about 2% of global CO2 emissions - as much as air transport.
=+ +
. . .
12.06.2008Extra Financial Research
Dr. Hendrik Garz, Claudia Volk
WestLB AGHerzogstraße 1540217 Düsseldorf
page 4
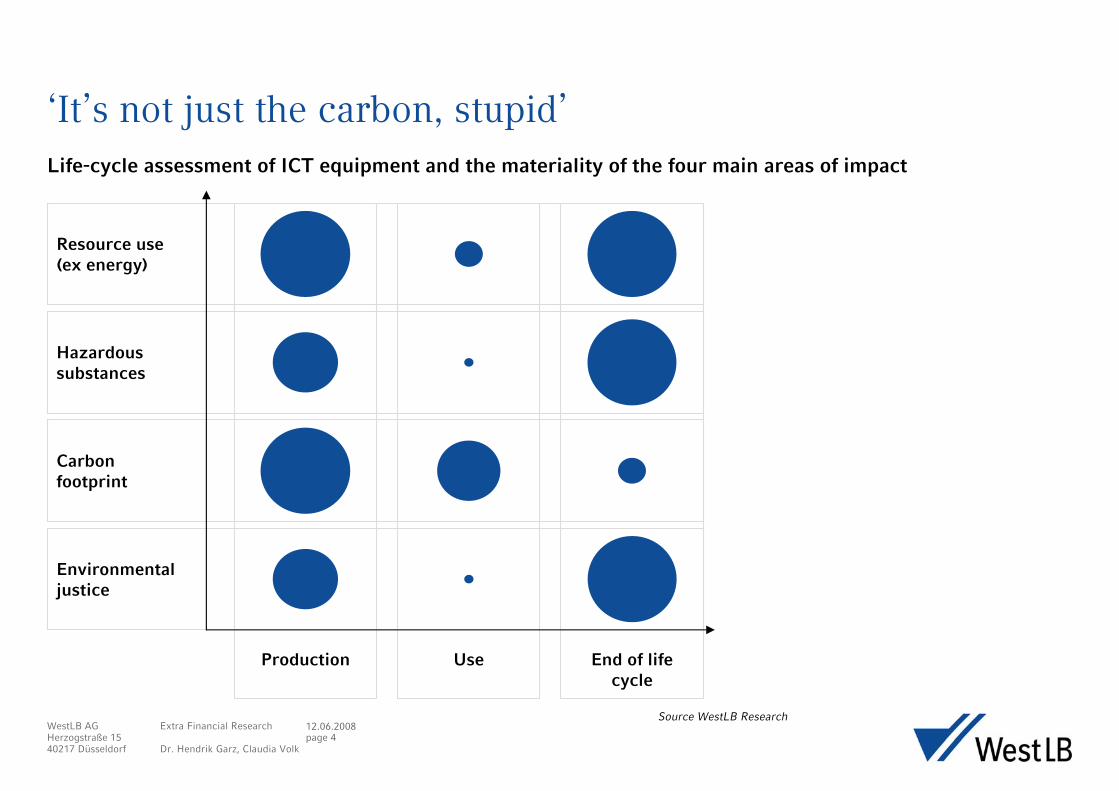
‘It’s not just the carbon, stupid’
Source WestLB Research
Life-cycle assessment of ICT equipment and the materiality of the four main areas of impact
Environmentaljustice
Production Use End of life cycle
Resource use(ex energy)
Hazardoussubstances
Carbon footprint

12.06.2008Extra Financial Research
Dr. Hendrik Garz, Claudia Volk
WestLB AGHerzogstraße 1540217 Düsseldorf
page 5
ICT & the environment: part of the problem, but also part of the solution
TelelearningVideo ondemand
Demand-drivenutilities
Intelligentcontrols
Virtualteachingmethods
educationhousingVirtualservices
Reducingshopping
miles
nutritionmobilityEngineefficiency
Food CO2
intensityinformation
Intelligentkitchen
applications
Trafficflow
Improvinglogistics
Transportsubstitution
ICT to addressclimate change
Source GeSI 2007
12.06.2008Extra Financial Research
Dr. Hendrik Garz, Claudia Volk
WestLB AGHerzogstraße 1540217 Düsseldorf
page 6
72.7
90.9
61.5
18.2
63.6
27.3
9.1
38.5
81.8
36.4
0
10
20
30
40
50
60
70
80
90
100
1 2 3 4 5
report no report size quintile
%
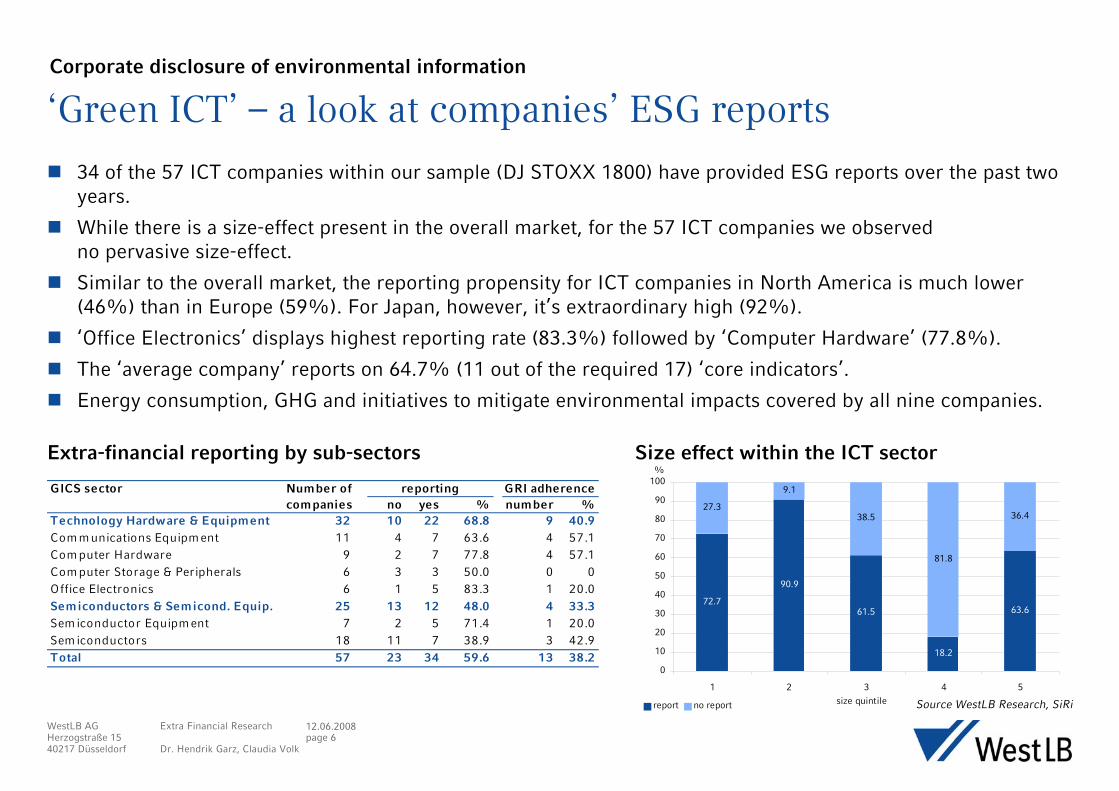
‘Green ICT’ – a look at companies’ ESG reports
Source WestLB Research, SiRi
34 of the 57 ICT companies within our sample (DJ STOXX 1800) have provided ESG reports over the past two years.
While there is a size-effect present in the overall market, for the 57 ICT companies we observedno pervasive size-effect.
Similar to the overall market, the reporting propensity for ICT companies in North America is much lower (46%) than in Europe (59%). For Japan, however, it’s extraordinary high (92%).
‘Office Electronics’ displays highest reporting rate (83.3%) followed by ‘Computer Hardware’ (77.8%).
The ‘average company’ reports on 64.7% (11 out of the required 17) ‘core indicators’.
Energy consumption, GHG and initiatives to mitigate environmental impacts covered by all nine companies.
Corporate disclosure of environmental information
GICS sector Number of reporting GRI adherencecompanies no yes % number %
Technology Hardware & Equipment 32 10 22 68.8 9 40.9Com m unications Equipm ent 11 4 7 63.6 4 57.1Com puter Hardware 9 2 7 77.8 4 57.1Com puter Storage & Peripherals 6 3 3 50.0 0 0Office Electronics 6 1 5 83.3 1 20.0Semiconductors & Semicond. Equip. 25 13 12 48.0 4 33.3Sem iconductor Equipm ent 7 2 5 71.4 1 20.0Sem iconductors 18 11 7 38.9 3 42.9Total 57 23 34 59.6 13 38.2
Extra-financial reporting by sub-sectors Size effect within the ICT sector

12.06.2008Extra Financial Research
Dr. Hendrik Garz, Claudia Volk
WestLB AGHerzogstraße 1540217 Düsseldorf
page 7
Introducing the WestLB ‘Green ICT indicator’
Source WestLB Research, SiRi
‘Green ICT’ ratings for 57 companies from all over the world, representing six industry groups, based on our extra-financial rating system.
Additional sub-indicators ‘reporting & policy’, ‘production’ and ‘products’, and four theme indicators ‘suppliers’, ‘energy’, ‘products’ and ‘waste’.
Reporting & Policy
Production
Products& Services
Green ICT
Supplychain
Energyconsumption
Waste
Reporting & Policy
Production
Products& Services
Green ICT
Supplychain
Energyconsumption
Waste
The integration of financial decision making variables

12.06.2008Extra Financial Research
Dr. Hendrik Garz, Claudia Volk
WestLB AGHerzogstraße 1540217 Düsseldorf
page 8
Green ICT rating (total) – best and worst in classThe integration of financial decision making variables
GICS sector level 4 Company Market Cap Countrysector overall USD m*
Communications Ericsson 1 9 40,042.7 SwedenEquipment Juniper Networks 10 54 14,693.5 USA
Research in Motion Ltd. 10 54 67,244.0 Canada
Computer Hardware NEC Corporation 1 1 10,655.1 JapanWincor Nixdorf AG 9 34 2,516.3 Germany
Computer Storage & Seiko Epson Corp. 1 3 3,995.9 JapanPeripherals SanDisk Corp. 6 43 7,423.0 USA
Office Electronics Canon 1 7 63,925.5 JapanNeopost SA 6 38 3,631.8 France
Semiconductor ASML Holding 1 4 13,304.8 NetherlandsEquipment KLA Tencor Corp 7 56 8,330.9 USA
Semiconductors STMicroelectronics 1 12 8,519.4 SwitzerlandMarvell Technology Group 18 57 6,902.0 USA
Rank
Source WestLB Research, SiRi* as of 15/05/08

12.06.2008Extra Financial Research
Dr. Hendrik Garz, Claudia Volk
WestLB AGHerzogstraße 1540217 Düsseldorf
page 9
Carbon footprint
Source WestLB Research, SiRi
‘Green ICT’ sub-indicator ‘Energy consumption’ – best and worst scores in class
Life cycle assessment – Material ‘green’ challenges for the ICT sector
Data centre energy usage could be reduced by around 20%, even with existing IT equipment.
Use of fuel cells and other distributed generation technologies as well as the virtualization of servers are just two of several data centre optimization technologies that could help reduce energy costs by 50%.
With regard to PCs and office equipment, desktop virtualization and ‘thin clients’, ‘Power over ethernet’ and behavioural changes are key.
Strong momentum in carbon accounting and product labelling expected.
number of energy score company with …GICS sector level 4 companies avg max min highest scores lowest scoresCommunications Equipment 11 -0.10 1.56 -1.13 Ericsson Research in Motion Ltd. Computer Hardware 9 1.01 2.77 -0.42 TOSHIBA CORP Wincor Nixdorf AGComputer Storage & Peripherals 6 -0.21 1.74 -1.13 Seiko Epson Corp. SanDiskOffice Electronics 6 0.33 1.20 -0.78 Ricoh Co Ltd Neopost SA Semiconductor Equipment 7 0.17 1.92 -1.13 Tokyo Electron KLA Tencor Corp, Lam ResearchSemiconductors 18 -0.35 1.47 -1.13 STMicroelectronics Broadcom and others
12.06.2008Extra Financial Research
Dr. Hendrik Garz, Claudia Volk
WestLB AGHerzogstraße 1540217 Düsseldorf
page 10
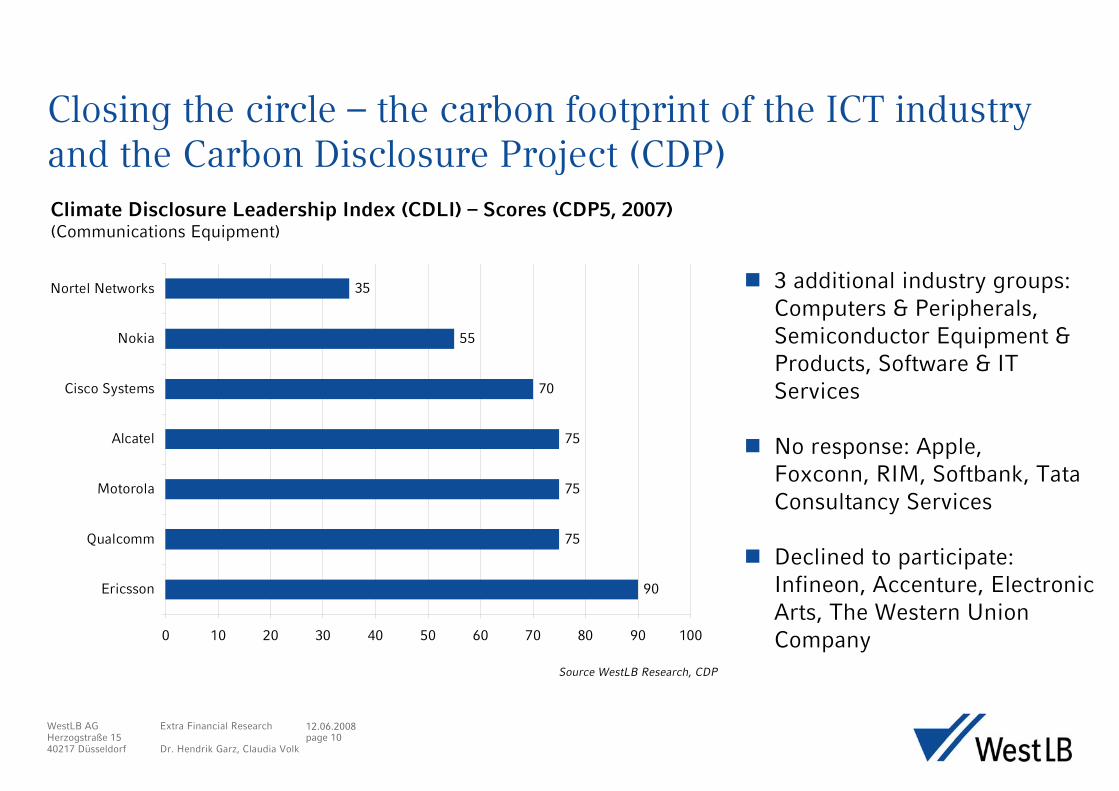
Closing the circle – the carbon footprint of the ICT industry and the Carbon Disclosure Project (CDP)
90
75
75
75
70
55
35
0 10 20 30 40 50 60 70 80 90 100
Ericsson
Qualcomm
Motorola
Alcatel
Cisco Systems
Nokia
Nortel Networks
Climate Disclosure Leadership Index (CDLI) – Scores (CDP5, 2007)(Communications Equipment)
Source WestLB Research, CDP
3 additional industry groups: Computers & Peripherals, Semiconductor Equipment & Products, Software & IT Services
No response: Apple, Foxconn, RIM, Softbank, TataConsultancy Services
Declined to participate: Infineon, Accenture, Electronic Arts, The Western Union Company
12.06.2008Extra Financial Research
Dr. Hendrik Garz, Claudia Volk
WestLB AGHerzogstraße 1540217 Düsseldorf
page 11
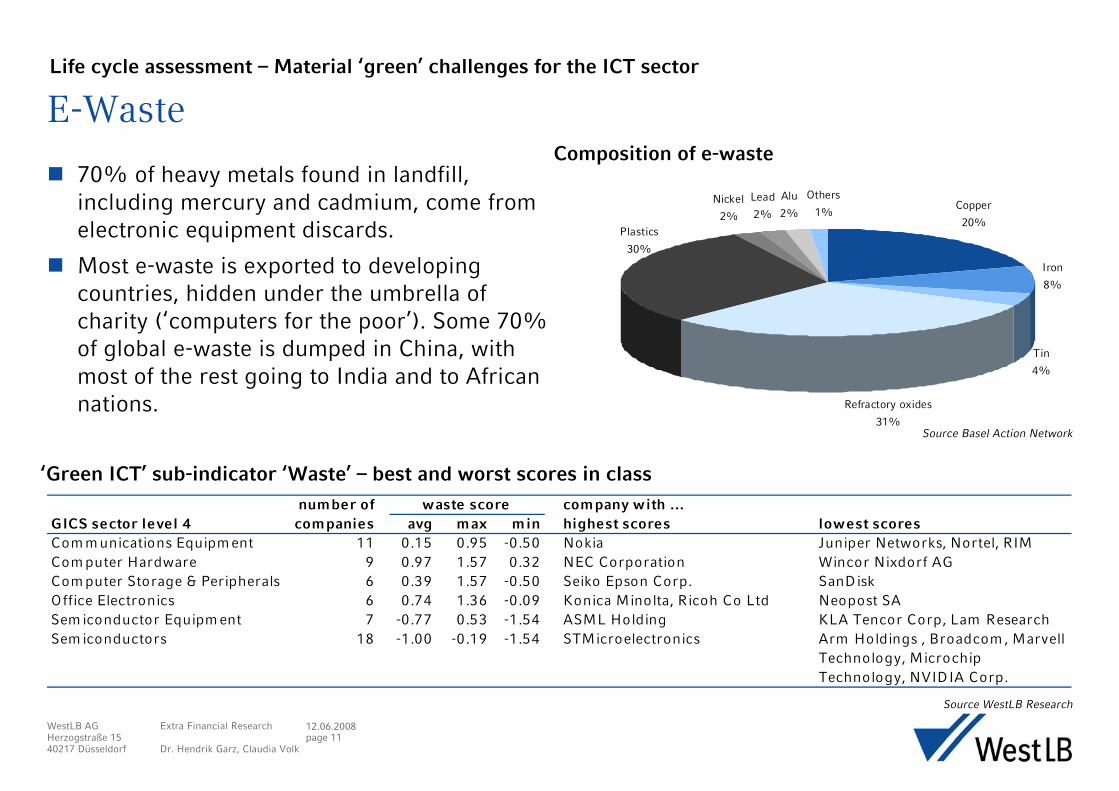
E-WasteLife cycle assessment – Material ‘green’ challenges for the ICT sector
70% of heavy metals found in landfill, including mercury and cadmium, come from electronic equipment discards.
Most e-waste is exported to developing countries, hidden under the umbrella of charity (‘computers for the poor’). Some 70% of global e-waste is dumped in China, with most of the rest going to India and to African nations.
‘Green ICT’ sub-indicator ‘Waste’ – best and worst scores in class
Source WestLB Research
number of waste score company with …GICS sector level 4 companies avg max min highest scores lowest scoresCom m unications Equipm ent 11 0.15 0.95 -0.50 Nokia Juniper Networks, Nortel, RIMCom puter Hardware 9 0.97 1.57 0.32 NEC Corporation Wincor Nixdorf AGCom puter Storage & Peripherals 6 0.39 1.57 -0.50 Seiko Epson Corp. SanDiskOffice Electronics 6 0.74 1.36 -0.09 Konica Minolta, Ricoh Co Ltd Neopost SA Sem iconductor Equipm ent 7 -0.77 0.53 -1.54 ASML Holding KLA Tencor Corp, Lam ResearchSem iconductors 18 -1.00 -0.19 -1.54 STMicroelectronics Arm Holdings , Broadcom , Marvell
Technology, Microchip Technology, NVIDIA Corp.
Copper
20%
Iron
8%
Tin
4%
Refractory oxides
31%
Nickel
2%
Alu
2%
Others
1%Lead
2%
Plastics
30%
Composition of e-waste
Source Basel Action Network
12.06.2008Extra Financial Research
Dr. Hendrik Garz, Claudia Volk
WestLB AGHerzogstraße 1540217 Düsseldorf
page 12
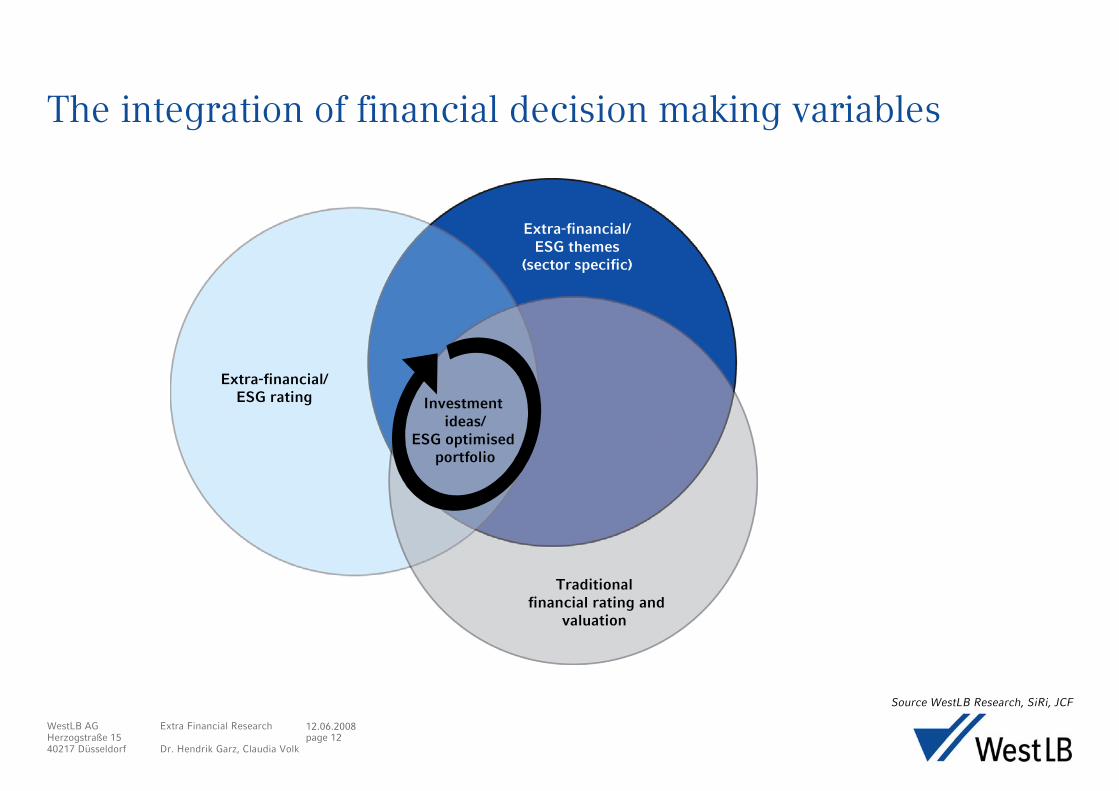
The integration of financial decision making variables
Source WestLB Research, SiRi, JCF
Extra-financial/ESG rating
Extra-financial/ESG themes
(sector specific)
Traditional financial rating and
valuation
Investment ideas/
ESG optimised portfolio

12.06.2008Extra Financial Research
Dr. Hendrik Garz, Claudia Volk
WestLB AGHerzogstraße 1540217 Düsseldorf
page 13
-2.0
-1.5
-1.0
-0.5
0.0
0.5
1.0
1.5
2.0
2.5
0.0 1.0 2.0 3.0 4.0 5.0
Gre
en I
CT
sco
re
Value score
z-score
Ericsson
Dell
STM
ASML
SunHP
Green ICT stock ideas for growth/value investors
Source WestLB Research, SiRi, JCF
The integration of financial decision making variables
-0.8
-0.6
-0.4
-0.2
0.0
0.2
0.4
0.6
0.8
1.0
5 4 3 2 1
Growth quintile
z-score
ASML**
Tokyo Electron**
Integration of the ‘Green ICT’ ratings of companies with traditional financial selection criteria based on growth and value measures.
The aim is to provide investment ideas from the perspectives of three types of investor (investment styles): ‘Growth‘, ‘Value‘ and ‘G.A.R.P.’ (Growth At a Reasonable Price).
Significant correlation between financial characteristics and ‘Green ICT’ scores:
higher ‘Value’ scores imply higher ‘Green ICT’ scores
higher ‘Growth’ scores imply lower ‘Green ICT’ scores

12.06.2008Extra Financial Research
Dr. Hendrik Garz, Claudia Volk
WestLB AGHerzogstraße 1540217 Düsseldorf
page 14
Green ICT stock ideas for growth/value investorsThe integration of financial decision making variables
Source WestLB Research, SiRi* as of 15/05/08
Company Growth Value Green ICT Market Cap Pricescore score z score in US$* 15/05/08
Long ideas - GrowthASML Holding 4.00 3.54 1.47 13,304.8 29.93Tokyo Electron 3.88 2.31 0.88 10,742.9 65.08Short ideas - GrowthMicron Technology Inc 4.15 4.30 -1.01 6,668.7 8.84ARM Holdings 3.44 2.15 -1.13 2,795.8 2.08Nvidia Corporation 3.43 3.50 -1.23 13,211.5 23.78Broadcom 3.50 1.92 -1.36 12,910.2 27.58Research in Motion Ltd. 4.71 1.75 -1.43 67,244.0 140.88Juniper Networks 4.07 2.50 -1.43 14,693.5 28.17Marvell Technology Group 3.69 2.58 -1.68 6,902.0 14.83Long ideas - ValueASML Holding 4.00 3.54 1.47 13,304.8 29.93Dell Inc 2.69 4.25 1.34 40,644.8 20.63Ericsson 1.87 4.54 1.29 40,042.7 2.70Sun Microsystems Inc 2.91 4.08 1.19 10,694.4 13.49STMicroelectronics 2.44 4.46 1.05 8,519.4 12.92Hewlett Packard Co 2.41 4.08 1.00 120,472.6 46.73Short ideas - ValueMicron Technology Inc 4.15 4.30 -1.01 6,668.7 8.84Nvidia Corporation 3.43 3.50 -1.23 13,211.5 23.78Long ideas - G.A.R.P.ASML Holding 4.00 3.54 1.47 13,304.8 29.93Short ideas - G.A.R.P.KLA Tencor Corp 2.41 2.85 -1.45 8,330.9 46.27

12.06.2008Extra Financial Research
Dr. Hendrik Garz, Claudia Volk
WestLB AGHerzogstraße 1540217 Düsseldorf
page 15
Obstacles – why the industry is not yet ‘green’ enough
The industry is highly competitive, and this has led to strategies on cost leadership, resulting in complex global production networks and supply chains with high shares of outsourced contract manufacturing.
In such a system, it is not only difficult to monitor and verify environmental compliance, the system’s intrinsic cost pressures are themselves in conflict with environmental goals.
Buy side ICT professionals cite time pressure, costs and lack of corporate commitment as biggest obstacles to implementing new ‘Green ICT’ technologies.
Other significant barriers are the scarcity of information and a lack of knowledge within the organisation.
ICT professionals, thus, call for recognised industry standards, an improvement in the impartiality and robustness of environmental information provided by ICT vendors, and tax incentives for organisations that adopt ‘Green ICT’ practices as most helpful support to implement environmental improvements.

12.06.2008Extra Financial Research
Dr. Hendrik Garz, Claudia Volk
WestLB AGHerzogstraße 1540217 Düsseldorf
page 16
Catalysts for change
Structural drivers that will make the industry change course
Increasing energy- and carbon costs.
The impact of climate change and other environmental issues on brand values and customer behaviour.
Governments and regulatory pressure & voluntary initiatives:
EU directives RoHS, WEEE, REACH, EuP
Ecolabelling initiatives: EPEAT, ENERGY STAR
Other initiatives: CSCI, GeSI, Green Grid, …
12.06.2008Extra Financial Research
Dr. Hendrik Garz, Claudia Volk
WestLB AGHerzogstraße 1540217 Düsseldorf
page 17
Wrapping up
Is ‘Green ICT’ just a pink elephant, an illusion that will vanish as quickly as it appeared on the industry’s radar screen, or is it indeed about tapping new profit potential and reducing financial risks? We believe that the latter is true, but we also feel that quick wins are not in sight – nor are there any low-hanging fruit.
Most ICT organisations are still at the very early stages of ‘going green’.
‘Green procurement’ and changes in the regulatory environment will certainly put a lot of pressure on vendors of ICT equipment and infrastructure to prove their green credentials.
For industry leaders it will certainly not suffice just to have a green marketing message in place. Companies who still believe that will lose competitiveness and market share.
12.06.2008Extra Financial Research
Dr. Hendrik Garz, Claudia Volk
WestLB AGHerzogstraße 1540217 Düsseldorf
page 18
WestLB Extra-Financial Research
Dr. Hendrik GarzPhone: +49 211 826 7563Fax: +49 211 826 6154E-Mail: [email protected]
Claudia VolkPhone: +49 211 826 8476Fax: +49 211 826 6154E-Mail: [email protected]
Katrin FrankPhone: +49 211 826 Fax: +49 211 826 6154E-Mail: [email protected]
12.06.2008Extra Financial Research
Dr. Hendrik Garz, Claudia Volk
WestLB AGHerzogstraße 1540217 Düsseldorf
page 19
Important Notice
The views expressed in this research report accurately reflect the research analyst’s personal views about any and all of the subject securities, financial instruments and issuers. No part of the research analyst’s compensation was, is or will be directly or indirectly related to the specific recommendations or views expressed by the research analyst (or analysts) responsible for the content in the report.
The remuneration of WestLB Research Analysts is not related to specific investment banking transactions. It is in part linked to the overall profit made by the firm, which includes the profit of the Investment Banking Department.
WestLB’s investment recommendations are kept under continuous review. It follows that no date can be given for the next update of the conclusions of this report.
Conflicts of interest
WestLB’s Policy on Management of Conflicts of Interest in Research (the Research Policy) is available at http://www.westlb.de/research_policy_en. This report complies with the Research policy.
Valuation and Risk assessment; Recommendations
Unless otherwise stated in the text of this report, target prices in this report are based on either a discounted cash flow valuation or comparison of valuation ratios with companies seen by the analyst as comparable or a combination of the two methods. The result of this fundamental valuation is adjusted to reflect the analyst’s views on the likely course of investor sentiment.
Whichever valuation method is used there is a significant risk that the target price will not be achieved within the expected timeframe. Risk factors include unforeseen changes in competitive pressures or in the level of demand for the company’s products. Such demand variations may result from changes in technology, in the overall level of economic activity or, in some cases, in fashion. Valuations may also be affected by changes in taxation, in exchange rates and, in certain industries, in regulations. Investment in overseas markets and instruments such as ADRs can result in increased risk from factors such as exchange rates, exchange controls, taxation, political and social conditions. This discussion of valuation methods and risk factors is not comprehensive – further information is available if required.
Stock ratings are based on the analyst’s expectation of the stock’s total return relative to the total return from the relevant market during the twelve months following assignment of the rating. This view is based on the target price, set as described above, and on the analyst’s opinions on general market and economic developments.
Within that overall framework, a Buy rating means that the total return from the stock is expected to exceed the total return from the market by at least 20%; Outperform means between 10% and 20% better than the market; Neutral means movement between 0% and a positive 10% above the market mean; Underperform means between 0% and 10% underperformance relative to the market; Sell means the stock is expected to return at least 10% less than the market.
Distribution and Use of Report
This research report has been prepared by a research department of WestLB AG. If this report is being distributed in the United States, such distribution is made by WestLB Securities Inc. ("WSI"), a licensed broker/dealer regulated by the Securities Exchange Commission and NASD Regulation Inc. WSI accepts responsibility for its contents subject as stated below. Any U.S. person who desires to effect transactions in any security discussed in this report should write or call to WSI, 1211 Avenue of the Americas, New York, NY 10036, phone (212) 403-3900, fax (212) 403-3939. Communication in the United Kingdom is by WestLB AG London Branch. In the United Kingdom this report is available only to investment professionals, not private customers, as defined by the rules of the Financial Services Authority. Individuals who do not have professional experience in matters relating to investments should not rely on it.
This report is for information purposes only. The information contained herein has been obtained from sources believed by WestLB AG and WSI to be reliable, however no guarantees, representations or warranties are made as to its accuracy, completeness or suitability for any purpose. Any opinion or estimate expressed in this report reflects the judgement of the author or authors on the date of this report and is subject to change without notice. The past performance of securities or financial instruments is not indicative of future results. No assurance can be given that any portfolio or investment described herein would yield favourable investment results. This material is not intended as an offer or solicitation for the purchase or sale of any security, financial instrument or any other action and will not form the basis or a part of any contract.
Further information may be obtained from your usual contact within West LB AG. No part of this publication may be copied or redistributed to persons or firms other than the authorised recipient without the prior written consent of WestLB AG or WSI. The manner of distributing this document may be restricted by law or regulation in certain countries, including the United States. Persons into whose possession this document may come are required to inform themselves of, and to observe such restrictions.
WestLB AG London Branch is a member of the London Stock Exchange and of the International Capital Market Association.
Copyright: 2007 WestLB AG. All rights reserved.
Disclaimer
Regulator: WestLB AG is authorised and regulated by the Bundesanstalt für Finanzdienstleistungsaufsicht and by the Financial Services Authority. It is regulated by the Financial Services Authority for the conduct of UK business.
Disclosures of potential conflicts of interest relating to WestLB AG, its affiliates and subsidiaries (together “WestLB”) as required by regulatory authorities can be accessed at http://www.westlb.de/disclosures_eq_en or obtained by writing to the Compliance Department at one of the addresses above.
WestLB Equity Research: Distribution of ratings as of 09 January 2007
Coverage universe Count Percent Inv. Banking Relationships* Count Percent
Buy/Add 145 54 Buy/Add 42 63
Hold 94 35 Hold 21 31
Sell/Reduce 29 11 Sell/Reduce 4 6