greece: state of economy, outlook and major challenges
TRANSCRIPT

Greece: state of economy, outlook
and major challengesDimitris Malliaropulos
Bank of Greece
&
University of Piraeus
Presentation in CRETE 2017 Conference
Milos, July 12 2017
Bank of Greece, Economic Analysis and Research Department

2Bank of Greece, Economic Analysis and Research Department
1. Economic adjustment during the crisis
2. Current state of economy
3. Strengths and weaknesses of economic recovery
4. Economic outlook and risks
5. What can policy do? Preconditions for a sustainable recovery
Outline

3Bank of Greece, Economic Analysis and Research Department
Fiscal and external deficits have been eliminated and cost
competitiveness has been restored
General Government primary balance
(% of GDP, programme definition)
Source: Eurostat, Bank of Greece.
Deficit
Surplus
Current account balance (% of GDP) and
Competitiveness (Index)
Source: Bank of Greece, ECB.

4Bank of Greece, Economic Analysis and Research Department
Exports increased and tradeable sector gained a higher share in the
economy
Tradeables: agriculture, industry, business and financial services,
telecommunications and services related to tourism (transport and
accommodation and restaurants).
Non-tradeables: all else except public administration and non-market services.
Relative size of tradeable to non-
tradeable sector (index: 2010=1)
Source: Eurostat and Bank of Greece.
Exports of goods at constant prices
(index: 2009=100)

5Bank of Greece, Economic Analysis and Research Department
Source: ELSTAT.
Where do we stand now?
Recession is over but economy is trapped in stagnation since 2014
Economic recovery has faced two major
headwinds in 2016 and early 2017
1. Increased uncertainty due to delays in
closing 1st and 2nd review.
2. Fiscal over-performance: 4.2% of GDP
primary surplus in 2016 against target of
0.5% of GDP.
Real GDP increased in Q2-Q3 2016 but
turned negative in Q4. Turned +ve in Q1.
Conclusion of 2nd review in June improves short-
term outlook
Resolution of uncertainty will allow
positive momentum to continue.
Nevertheless, recovery remains fragile.
Real GDP growth decomposition
(annual % change, pp contributions)

6Bank of Greece, Economic Analysis and Research Department
Strengths
• Industry-Manufacturing
• Exports
• Labour market
Weaknesses
• Consumer
• Investment
• Banks
Major strengths and weaknesses of current recovery

7Bank of Greece, Economic Analysis and Research Department
Industry and manufacturing
Sector is expanding at healthy rates since mid-2015.
Rebound largely driven by increasing exports due to lower wage
costs and higher competitiveness.

Industrial confidence improved significantly since mid-2015.
Industrial production on an upward trend.
8Bank of Greece, Economic Analysis and Research Department
The recovery is broad-based: 17 out of 24 manufacturing sectors posted positive growth
in 2016Industrial production and industrial confidence(annual % change and balance)
Sources: ELSTAT, European Commission.

9Bank of Greece, Economic Analysis and Research Department
Exports Exports of goods increased on average by 6% annually in real
terms over the past seven years.
Exports of services (ex shipping) increased by 4% annually in
real terms over the same period.
Underperformance of Greek exports relative to peers is due to
developments in the shipping sector.
Shipping sector suffered from global supply overhang. Capital
controls also affected the sector.

Exports of services(index: 2000=100, constant prices )
Source: Eurostat Ameco. Ireland excluded from Graphs due to distortion of export data following the 2015 GDP revision.
Exports of goods(index: 2000=100, constant prices )
10Bank of Greece, Economic Analysis and Research Department
Exports of goods have benefited from increased competitiveness. Exports
of services underperformed after 2008

Shipping sector explains most of underperformance of exports,
particularly after imposition of capital controls in June 2015
11Bank of Greece, Economic Analysis and Research Department
Source: Eurostat and Bank of Greece.
Real exports of goods and services
(index: 2009=100) Euro area (147)
Greece with Shipping (114)
Underperformance of shipping
sector has cut export growth
by a whole 27 ppts!
Greece without Shipping (141)

12Bank of Greece, Economic Analysis and Research Department
Labour market
Employment is growing at healthy rates since mid-2014.
Rebound largely driven by higher job-market flexibility due to
past structural reforms.
Nevertheless, unemployment remains very high (21.7% in April).

Labour market recovery continues for the third year despite GDP
stagnating.
13Bank of Greece, Economic Analysis and Research Department
Source: ELSTAT, Labour Force Survey.
Employment
(y-o-y growth)
Employment growth turned positive since mid-2014
Net job creation is to a large extent due to increased labour market
flexibility
Source: OAED and ERGANI.
Net dependent employment flows
(cumulative net flows; number of jobs)

14Bank of Greece, Economic Analysis and Research Department
Consumers
Consumers remain pessimistic.
Disposable income still declining despite rebound in employment
due to higher taxation and lower net social transfers.
Deleveraging and dissaving continue.

Consumer confidence remains weak, holding down retail sales and
personal consumption growth
15Bank of Greece, Economic Analysis and Research Department
Sources: ELSTAT and European Commission.
Retail sales and consumer confidence(annual % change and balance)
Post-election euphoria
Disappointment

Disposable income is gradually stabilizing but remains in negative territory.
Taxation and decline in social transfers among negative drivers.
16Bank of Greece, Economic Analysis and Research Department
Source: ELSTAT and Bank of Greece calculations.
Disposable income of households and components
(annual % change; pp contributions) Private sector is creating jobs and
income
But increased taxation and cuts in net
social transfers reduce disposable
income.
Hence, job creation fails to translate into
consumption growth.

17Bank of Greece, Economic Analysis and Research Department
Sources: ECB and Bank of Greece.
Households continue deleveraging and dissaving
deleveraging
dissaving

18Bank of Greece, Economic Analysis and Research Department
Banking sector
Two key issues: liquidity, asset quality.
Bank funding conditions gradually improve, but deleveraging
continues and NPLs remain the biggest challenge.
“Credit-less recovery” not unlikely but weak and not desirable.
Urgent need to restore normal credit conditions. Tackle NPLs.

Source: Bank of Greece.
Greek banks borrowing from Eurosystem
(EUR bn; end of month)
Bank of Greece, Economic Analysis and Research Department 19
Bank funding: gradual recovery of deposits and lower dependence
on Eurosystem financing
Deposits of NFCs and households
(EUR bn; monthly flow and outstanding
amount)
Source: Bank of Greece.

Bank credit: Deleveraging of private sector continues.
NPL ratios stabilise at high levels
20Bank of Greece, Economic Analysis and Research Department
Source: Bank of Greece.
Bank credit to NFCs and households(EUR bn; outstanding amounts)
Greek commercial banks – NPL ratio(%)
Source: Bank of Greece.
21Bank of Greece, Economic Analysis and Research Department
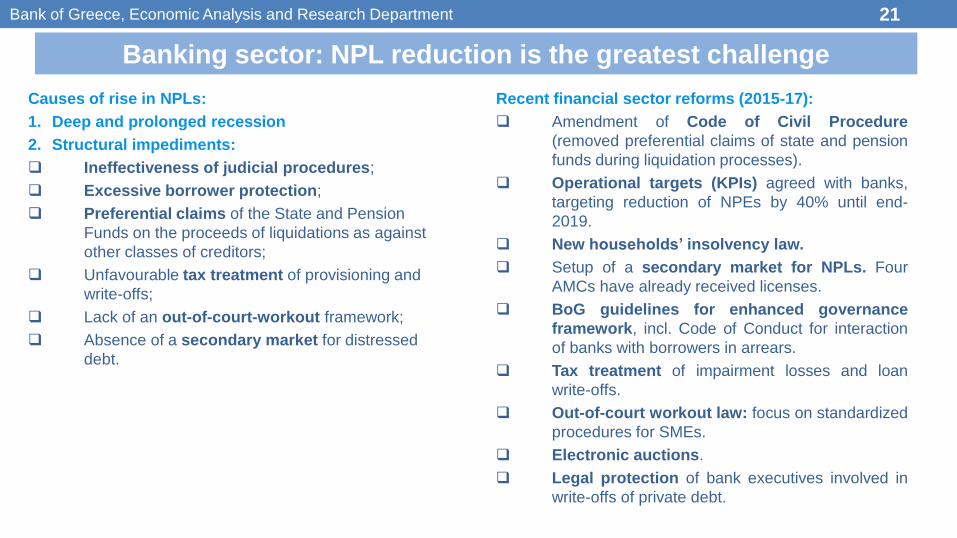
Banking sector: NPL reduction is the greatest challenge
Recent financial sector reforms (2015-17):
Amendment of Code of Civil Procedure
(removed preferential claims of state and pension
funds during liquidation processes).
Operational targets (KPIs) agreed with banks,
targeting reduction of NPEs by 40% until end-
2019.
New households’ insolvency law.
Setup of a secondary market for NPLs. Four
AMCs have already received licenses.
BoG guidelines for enhanced governance
framework, incl. Code of Conduct for interaction
of banks with borrowers in arrears.
Tax treatment of impairment losses and loan
write-offs.
Out-of-court workout law: focus on standardized
procedures for SMEs.
Electronic auctions.
Legal protection of bank executives involved in
write-offs of private debt.
Causes of rise in NPLs:
1. Deep and prolonged recession
2. Structural impediments:
Ineffectiveness of judicial procedures;
Excessive borrower protection;
Preferential claims of the State and Pension
Funds on the proceeds of liquidations as against
other classes of creditors;
Unfavourable tax treatment of provisioning and
write-offs;
Lack of an out-of-court-workout framework;
Absence of a secondary market for distressed
debt.

22Bank of Greece, Economic Analysis and Research Department
Investment and Financing
Investment declined dramatically since 2008.
80% of decline was in residential investment.
Net investment has become negative since 2011. Decline in
capital stock!
Financing conditions of NFCs gradually improving.
However, domestic saving is not sufficient to finance
investment.
Need to restore normal bank credit conditions (NPL resolution).
Need to restore access of companies to capital markets.
Need to attract FDI.

23Bank of Greece, Economic Analysis and Research Department
Private investment has declined dramatically
Sources: ECB and Bank of Greece.
Private investment (NFCs and HHs)
(% of GDP)
Investment gap
Investment of NFCs
(flows; 4-quarter moving sum; EUR mn)
Investment gap
Gross Investment declined below deprecation since 2011. Negative net investment.
Investment gap of private sector is currently EUR 15 bn p.a. (9% of GDP).
For Non-Financial Companies, investment gap is EUR 6.5 bn p.a. (3.7% of GDP).
Given rate of depreciation, even if NFCs’ gross investment increases by 8% p.a., it will take 6 years until net
investment becomes positive and 9 years until capital stock of NFCs increases to 2008 levels.
Greece needs an investment shock to avert output hysteresis.

24Bank of Greece, Economic Analysis and Research Department
Source: ECB and Bank of Greece.
External financing of NFCs is gradually improving
External financing of Non-Financial Companies
(flows; 4-quarter moving sum; EUR bn)
*includes trade credit and advances and other accounts receivable/payable.
Has deleveraging of NFCs
come to and end?
25Bank of Greece, Economic Analysis and Research Department
Economic Outlook

26Bank of Greece, Economic Analysis and Research Department
Short-term economic outlook
Growth outlook
With the conclusion of the 2nd review, positive momentum expected to continue over the short and medium term
(Real GDP growth 2017: 1.6%, 2018: 2.4%).
Public consumption and investment expected to support economic activity in 2017.
o Part of fiscal over-performance in 2016 can be used to increase expenditure or reduce taxation.
Private consumption expected to rebound modestly, driven by continuing gains in employment.
Exports expected to increase further, driven by past gains in competitiveness and stronger global growth.
o Tourism: bookings indicate strong growth in 2017. June data suggest strong rebound of both arrivals and earnings.
Upside risks
Specification of debt relief measures
QE participation
Fiscal impulse in 2017
Downside risks
Programme implementation
Fiscal mix not growth-friendly
Major stock imbalances will be a drag on growth: public debt, NPLs, unemployment
External risks (global, regional, markets)

27Bank of Greece, Economic Analysis and Research Department
Long-term economic outlook is positive
Structural reforms improve growth potential.
o OECD estimates that implemented and planned reforms are expected to boost real GDP by 13% over a 10-
year horizon. BoG has similar estimates.
o Potential growth estimated at 1.5% p.a.
Rebalancing the economy towards a “new growth model” is the great challenge
o From the demand side: Investment and exports must fill the gap of effective demand from lower public and
private consumption. Feasible.
o From the supply side: Rebalancing towards tradeable goods and services.
Note: Net profit margins are calculated as Net Operating Surplus/GVA. Source: Eurostat and Bank of Greece calculations.

28Bank of Greece, Economic Analysis and Research Department
Potential growth mainly driven by TFP.
TFP is driven by net investment
Periods of high (low) potential growth coincide with periods of high (low) TFP growth.
High correlation between TFP growth and capital accumulation (0.62).
TFP growth is related to growth of
capital stock
Sources: Eurostat Ameco and Bank of Greece.
Decomposition of potential growth
(%; bars pp contributions)

29Bank of Greece, Economic Analysis and Research Department
Sources: ELSTAT and Bank of Greece.
Potential growth to gradually converge to 1.5%+.
Drivers differ across time
Large pool of unemployed provides initial space for economy to grow.
Capital stock to continue to decline due to negative net investment until 2020.
TFP growth to gradually increase as capital stock increases and structural reforms start to pay dividends.
Potential growth projections
(%; bars pp contributions)

30Bank of Greece, Economic Analysis and Research Department
Preconditions for a sustained recovery
1. Get ownership of reforms: Delays in implementation will result in new spikes of uncertainty and a
fallback to economic stagnation.
2. Focus on growth: Having completed the fiscal consolidation required by the program, economic
policy should now focus on growth. Putting the economy on a sustainable growth path will gradually
reduce unemployment, allow households and companies to repay their debts and generate the funds
to service and gradually reduce the public debt burden.
3. Fiscal policy must stop being a drag on economic activity; the fiscal buffer created in 2016 can help
reduce taxation already in the current year; increased public investment can also provide a positive
impulse to the economy.
4. Tackle NPLs: Recent financial sector reforms must be implemented swiftly in order to tackle the
problem of high NPLs in banks’ portfolios. This will allow banks to start lending again and companies
to finance their investment projects.
5. Debt relief: European partners must specify the medium term debt relief measures to ensure
sustainability of public debt. This would help Greece return to international financial markets, abolish
capital controls and return to financial normality. Postponing the decision on debt relief further down
the road does not serve the purpose of a sustainable comeback to financial markets and a
sustainable recovery of the Greek economy.

31Bank of Greece, Economic Analysis and Research Department
Thank you for your attention