greater tzaneen municipality idp 2009... · 2015-03-27 · 6.6.6 economic challenges of greater...
TRANSCRIPT

GREATER TZANEEN MUNICIPALITY
INTERGRATED DEVELOPMENT PLAN 2009 – 2010 (3
RD
REVIEW)
5 YEARS PERIOD: 2007 – 2011

1
1. Table of Content
ITEM TOPIC PAGE
Table of Content 2 - 5
List of Tables 6
Acronyms 7 – 8
1 FOREWORD BY THE MAYOR 9
2 EXECUTIVE SUMMARY 10
3 IDP CONTEXT AND RATIONALE 11
3.1 Introduction and backround 11
3.2 Credible Integrated Development Plan 11
3.3 Legislative and Policy Context 12
3.3.1 Constitution of the Republic of South Africa 12
3.3.2 The White Paper on Local Government 12
3.3.3 The Municipal Syatems act (Act 3 of 2000) 13
3.3.4 The Municipal Planning and Performance Management Regulation of 2001 13
3.3.5 Municipal Finance Management Act (Act 56 of 2003) 14
4 PHASES OF THE IDP 15
5 PHASE O – PLANNING PROCESS 16
5.1 Institutional arrangements 16
5.2 IDP/Budget and PMS Process Plan 16 - 19
6 PHASE 1: SITUATION ANALYSIS 20
6.1 CURRENT REALITY – BASIC FACTS AND FIGURES 20
6.1.1 Locality 20
6.1.2 Description Of Municipal Area 20
6.1.3 Land 20
6.1.4 Social Status – Demographics 21
a. Population Distribution 21
b. Gender and Age 21 - 23
c. Education and Income 23 - 24
d. HIV/AIDS 24- 25
e. Internal Focus – HIV/AIDS 25
f. External Focus – HIV/AIDS 25
g. Disability Focus 25 - 26
6.2 SUMMARY OF COMMUNITY AND STAKEHOLDER PRIORITY ISSUES 27 - 47
6.2.1 Community Perspective
6.2.2 Community Based Planning 47 - 49
6.3 PRIORITY ISSUES FROM A MUNICIPAL PERSPECTIVE 49 - 77
6.3.1 Water And Sanitation
6.3.2 Roads And Stormwater
6.3.3 Building And Maintainance
6.3.4 Electricity
6.3.5 Solid Waste

2
6.3.6 Traffic And Licencing
6.4 SPATIAL ANALYSIS 78 - 86
6.4.1 Legislative Framework
6.4.2 Spatial Pattern and Trends
6.4.3 Dams and Rivers
6.4.4 Routes and Transport
6.4.5 Population Concentration and Districution
6.4.6 Business and Industrial Development
6.4.7 Housing
6.4.8 Educational Facilities
6.4.9 Health Facilities
6.4.10 Recreational Facilities
6.4.11 Institutional Facilities
6.4.12 Spatial Constraints
6.4.13 Implications of Spatial Patterns and Trends
6.4.14 Conclusion
6.5 SOCIAL ANALYSIS 86 - 95
6.5.1 Library
6.5.2 Health Services
6.5.3 Parks, Recreational Facilities, Cemeteries, Sport, arts and Culture
6.5.4 Housing
6.5.5 Education
6.5.6 Safety and Security
6.6 ECONOMIC ANALYSIS 95 - 101
6.6.1 Economic Growth Rate, GGP and Sector
6.6.2 Regional Economic Profile
6.6.3 Economic Profile
6.6.4 Contribution to Employment
6.6.5 Economic Analysis of the Greater Tzaneen Municipality LED
a. Agriculture
b. Fruit and Nut Cluster Value Chain
c. Tourism Develooment and Promotion
d. Business Diversification and Trade Development
6.6.6 Economic Challenges of Greater Tzaneen Municipality
a. Institutional Capacity
b. Investment Opportunity
6.6.7 Social Challenges of the Greater Tzaneen Municipality
a. Poverty, HIV/AIDS, Cultural Diversity, Xenophobia and Political Climate
6.6.8 Environmental Challenges
a. Climate change, Pollution, Illegal Occupation of Land, Veld Fire & Exploitation of natural resources
6.7 ENVIRONMENTAL ANALYSIS
6.7.1 Illegal Sand Mining

3
6.7.2 Land Pollutions
6.7.3 Air Polutions
6.7.4 Water Pollution
6.7.5 Loss of Biodiversity
6.7.6 Energy Consumption
6.8 INSTITUTIONAL ANALYSIS 102 - 114
6.8.1 Institutional Analysis
6.8.2 Organogram
6.8.3 Clusters And Study Groups
6.8.4 Finance, Economic, Social, Infrastructure, Sport, Arts & Culture, Governance & Administration And Special Committee Clusters
6.8.5 Institutional Financial Analysis
6.8..5.1 Current State – Area of the Municipality
6.8.5.2 Context of Financial Management – Financial Viability
6.8.5.3 Legislative Compliance
6.8.5.4 Challenges
6.8.5.5 Interventions
6.9 DISASTER MANAGEMENT 115 – 116
6.10 SAFETY AND SECURITY 116 - 117
3 PHASE 2: DEVELOPMENTAL STRATEGIES 118 - 130
3.1 The Municipal Vision and Vision
3.2 Strategic Objectives
3.3 Finacial Strategy
3.4 Summary list of Identified Projects
4 PHASE 3: PROJECTS 130 - 186
Prioritized Projects
Internal Departmental Projects
Sector Departmental Projects
Mopani District Municipality Projects
187 - 256
5 PHASE 4: INTEGRATION
5.1
5.2 Finacial Recovery Plan
5.3 Electricity Plan
5.4 Transport Plan
5.5 Intergrated Waste Management Plan
5.6 Spatial Development Framework
5.7 Integrated Disaster Management Plan
5.8 Environmental Management Plan
5.9 HIV/AIDS Plan

4
5.10 Local Economic Development Strategy
5.11 Organisational Performance Management System
5.12 Housing Chapter Plan
5 PHASE 5: APPROVAL 257

5
LIST OF TABLES
TABLE NO DESCRIPTION
Table 1 Four Key Strategic Areas: Theme teams
Table 2 IDP/Budget and PMS Process Plan 2008/9
Table 3 Projected Population per node. 2003 – 2013
Table 4 Percentage distribution of Greater Tzaneen Municipality on age and gender
Table 5 Age group, population group and gender
Table 6 Population per age category, 2001
Table 7 Highest level of Education of the population, 2001
Table 8 Annual Household Income per income level, 2001
Table 9 HIV Prevalence by Districts, 2004 – 2006
Table 10 HIV Prevalence by Municipality, 2006
Table 11 Disability Prevalence, 2007
Table 12 Summary of community needs
Table 13 Proposed projects from CBP
Table 14 Population Concentration and Distribution, 2003
Table 15 List of needs for dermacation of sites in rural areas
Table 16 Incidence and Extent of Business and Industry within GTM, 2003
Table 17 Incidence of Educational Facilities within GTM, 2003
Table 18 Incidence of Health Facilities within GTM, 2003
Table 19 Institutional facilities within GTM
Table 20 Percentage share of GDP per sector, 2008
Table 21 Contribution to National GDP per sector, 2008
Table 22 GDP contribution per local municipality, 2008
Table 23 GDP local municipality per Economic sector, 2008
Table 24 GDP contribution of local municipality to Mopani, 2008
Table 25 Employment per Economic sector per local municipality, 2008
Table 26 Organizational structure (Organogram)
Table 27 Clusters and study groups of Council
Table 28 Institutional Strenght and Weaknesses
Table 29 Three Year Operational Budget
Table 30 Road Infrastructure
Table 31 Upgrading of Roads in GTM
Table 32 Eskom‟s distribution area since the inception of the INEP
Table 33 Extension Priority list
Table 34 Priority List (Five Year Program)
Table 35 Street lighting budget
Table 36 Electricity Summary

6
ACRONYMS ARVs Antiretrovirals BBBEE Broad Based Black Economic Empowerment CAPEX Capital Expenditure CBO Community Based Organization CBD Central Business District CBP Community Based Planning CFO Chief Financial Officer CBPWP Community Based Public Works Programme CMIP Consolidated Municipal Infrastructure Programme DEAT Department of Environmental Affairs & Tourism DFA Development Facilitation Act DHSD Department of Health and Social Development DME Department of Minerals and Energy DoA Department of Agriculture DPLG Department of Provincial and Local Government DSAC Department of Sport, Arts and Culture DWAF Department of Water and Forestry EEP Employment Equity Plan EAP Employee Assistance Programme EMP Environmental Management Plan EMS Environmental Management System EPWP Extended Public Works Programme FBE Free Basic Electricity FBW Free Basic Water GEAR Growth, Employment and Redistribution GDP Gross Domestic Product GGP Gross Geographic Product GIS Geographical Information System GTM Greater Tzaneen Municipality HOD Head of Division HPCSA Health Proffessional Council of South Africa IDP Integrated Development Plan ISDF Integrated Spatial Development Framework ITP Integrated Transport Plan IWMP Integrated Waste Management Plan KPA Key Performance Area KPI Key Performance Indicator LED Local Economic Develeopment LDO Land Development Objectives LM Local Municipality MFMA Municipal Finance Management Act MDM Mopani District Municipality MGP Municipal Growth Point MIG Municipal Infrastructure Grant MIS Municipal Information System MM Municipal Manager MPCC Multi Purpose Community Centres

7
MSA Municipal Systems Act MTEF Medium Term Expenditure Framework NEMA National Environmental Management Act NGO Non Governmental Organization NT National Treasury OPEX Operational Expenditure PAC Performance Audit Committee PGP Provincial Growth Point PMS Performance Management System PT Provincial Treasury RAL Road Agency Limpopo RDP Reconstruction and Develepment Plan RED Regional Electricity Dsitributors SADC Southern African Development Cooperation SALGA South African Local Government Association SDBIP Service Delivery and Budget Inplementation Plan SDF Spatial Development Framework SMME Small Medium & Micro Enterprises SLA Service Level Agreement WSA Water Service Authority WSP Water Service Provider

8
As a dynamic municipality and as part of our conformity to the law of the country, we have reviewed our Integrated Development Plan so as to have a plan that keeps pace with the ever changing circumstances. This is a third (3rd) reviewed plan since we adopted our Integrated Development Plan in 2006. With the passage of time we have honed our skills in planning processes, hence, our plan has improved greatly. The Integrated Development Plan, integrated with the Performance Management System, as it is self-explanatory, requires of various role players to cooperate in the planning and development of our community. Institutions and other organs of state from both provincial and national spheres of government‟s perspective also provided inputs to the initial planning and review processes. There are challenges, however, in the coordination of and timeouos provision of important information by some institutions and organs of state. There is, however, still room for improvement. Participation by all stakeholders in the planning process is of great importance. This plan is therefore an outcome of engagements and interaction with community needs as submitted. Having been charged with the stewardship of this municipality together with all councilors, I wish to express my sincere gratitude to all who participated in the endeavor to develop this reviewed plan. The plan will inform the municipal budget and also influence budgeting by other spheres and organs of government. This plan will, as beacon of hope, take development in our municipality towards the desired level. Development is about people, so let us all commit all the available resources in helping to change the lifes of our people for the better. I further want to acknowledge that 2009-2010 financial year was not business usual but business unsual. I pledge my commitment and all councillors to turn the tide around the municipal finances to improve and meet our mandate in service delivery. It is once more an honour to me to present the Integrated Development Plan to the local community and the country as a whole.
OJ MUSHWANA MAYOR
1. MAYOR’S FOREWORD

9
It is really a priviledge to work together with all stakeholders in reviewing the 2009/2010 IDP for our municipality. We must acknowledge that it has not been an easy process. However we must indicate that the 2008/2009 review process further demonstrated and confirmed our continued commitment to ensure that our IDP reflects the will and aspirations of the people we serve. As one of the municipalities selected by the provincial Local Government and Housing department for piloting in terms of the best model of a credible IDP, we have and continue to improve systems and process in terms of our overall IDP process. The MEC‟s assessment report for our 2008/2009 IDP review also assisted us in identifying gaps and improving on our performance. We have as Management put forward interventions to address the weaknesses as hereunder:
We need to submit a copy of the IDP to the MEC within 10 after Council Approval
We need to avail all our plans and strategies as highlighted by the MEC‟s assessment report.
Confirm that Financial Statements are submitted each year by the 31 August to the office of the Auditor General.
Annual performance report for section 57 to be submitted to the MEC during this year for 2009/2010 financial
year
Business plan to be developed this year to source funds outside for development of Institutional Plans
outstanding
As a Municipality we are confident and focused in trying to achieve the millennium goals and challenges facing us during this crucial moment. We further want to commit all our resources and human resources in delivering a better life for all within the entire Municipal area and contribute towards economic growth of both the District and Province. With all this responsibility vested upon us, let us join hands together, walk along side by side and claim the victor in accomplishing our set measurable objectives.
MF Mangena Municipal Manager
2. EXECUTIVE SUMMARY

10
3. IDP CONTEXT AND RATIONALE 3.1. INTRODUCTION AND BACKGROUND An integrated development plan
(a) is the principal strategic planning instrument which guides and informs all planning and development, and all
decisions with regard to planning, management and development, in the municipality;
(b) binds the municipality in the exercise of its executive authority, except to the extent of any inconsistency
between a municipality‟s integrated development plan and national or provincial legislation, in which case
such legislation prevails; and
(c) binds all other persons to the extent that those parts of the integrated development plan that impose duties
or affect the rights of those persons have been passed as a by-law.
(d) Is a product of inter-sphere planning at the District and Local Intergovernmental Fora
The processes (phases) of the IDP is as important as the final output in the form of the document. Rigorous analysis with sincere community and stakeholder consultations must be enhanced and strengthened.The development of the Long Term Growth and Development Strategy, based on the vision, must encourage and allow for the meaningful contributions of the community, all spheres of government, traditional authorities and non-state actors. This allows for the development of realistic and achievable objectives and priorities for the five year term of office, in the form of the Five Year Programme of Government. Objectives are converted into plans, projects and activities, which can be tracked and monitored. All draft IDPs are required to be approved by the council by 30th March every year. However, the final IDP and budget must be approved by council by 30th June every year. Clearly, it is the annual plan that must be reviewed and not the entire IDP; provided that all the processes and components preceding the annual plan are sound. 3.2 CREDIBLE INTEGRATED DEVELOPMENT PLAN The Integrated Development Plan must comply with relevant legislation and convey the following:
Consciousness by a municipality of its constitutional and policy mandate for developmental local government,
including its powers and functions.
Awareness by municipality of its role and place in the regional, provincial and national context and economy.
Awareness by municipality of its own intrinsic characteristics and criteria for success
Comprehensive description of the area – the environment and its spatial characteristics.
A clear strategy, based on local developmental needs.
Insights into the trade-offs and commitments that are being made re: economic choices, establishment of SHS,
integrated service delivery etc.
The key deliverables for the next 5 years.
Clear measurable budget and implementation plans aligned to the SDBIP.
A monitoring system (OPMS and PMS), that‟s based on the IDP indicators, targets, time frames, etc..
Determines the capacity and capability of the municipality.
Communication, participatory and decision-making mechanisms.
The degree of intergovernmental action and alignment to government wide policies, plans, priorities and targets,

11
3.3. LEGISLATIVE AND POLICY CONTEXT 3.3.1 Constitution of the Republic Of South Africa Section 151 of the constitution of the Republic of South Africa provides a legal status of municipalities as thus;
1) The local sphere of government consists of municipalities, which must be established for the whole of the
territory of the Republic.
2) The executive and legislative authority of a municipality is vested in its Municipal Council.
3) A municipality has the right to govern, on its own initiative, the local government affairs of its community, subject
to national and provincial legislation, as provided for in the Constitution.
4) The national or a provincial government may not compromise or impede a municipality‟s ability or right to
exercise its powers or perform its functions
Section 152 also provides the objects of local government as thus;
1) The objects of local government are –
a) to provide democratic and accountable government for local communities;
b) to ensure the provision of services to communities in a sustainable manner;
c) to provide social and economic development
d) to promote a safe and healthyenvoironment, and
e) to encourage the involvement of communities and community organizations in the matters of local
government.
2) A municipality must strive, within its financial and administrative capacity, to achieve the objects set out in
subsection (1).
Section 153 provides for developmental duties of municipalities as thus;
a) Structure and manage its administrative and budgeting and planning processes to give priority to the basic
needs of the community, and to promote the social and economic development of the community; and
b) Participate in national and provincial development programmes.
3.3.2 The White Paper on Local Government
The White Paper on Local Government expects municipalities to be “working with citizens and groups within the community to find sustainable ways to meet their social, economic and material needs and improve the quality of their lives". Integrated Development Planning reinforces this de-centralized system of government. IDP is thus not just another planning exercise, but will essentially link public expenditure to new development vision and strategies. IDP is a “philosophy” that contributes in making local government the central force of development in the country. 3.3.3 The Municipal Systems Act (Act 32 of 2000)
Chapter 5 of The Municipal Systems Act, (MSA), requires that Municipalities develop Integrated Development Plans (IDP) and annually review the IDP. The review is a process prescribed by Section 34, and relates to assessing the Municipality‟s performance against the organization‟s objectives in terms of implementation for delivery, consideration of new information and changed circumstances. The MSA further defines the IDP as one of the core functions of a municipality and makes it a legal requirement for every council to adopt a single, inclusive and strategic plan for the development of its municipality. This plan should link, integrate and coordinate plans and take into account proposals for development of the municipality. It should also align

12
the municipality‟s resources and capacity with the implementation of the plan, it should form the policy framework and general basis on which annual budgets must be based; and be compatible with national and provincial development plans and planning requirements. The MSA also requires municipalities to ensure community participation in all the phases of the IDP.
3.3.4 Municipal Planning and Performance Management Regulations Of 2001
The Municipal Planning and Performance Regulations sets out the following requirements for an Integrated Development Plan: 1. Regulation 2 (1) states that the municipality‟s IDP must at least identify:
The institutional framework, which must include an Organogram required for implementation of an IDP and
addressing the internal transformation;
Any investment initiatives in the municipality;
Any developmental initiatives in the municipality, including infrastructure, physical, social and institutional
development;
All known projects, plans and programmes to be implemented within the municipality by any organ of the state;
and
The key performance indicators set by the municipality;
Be aligned to the spatial development frameworks reflected in the Integrated Development Plans of the
neighbouring municipalities;
Must indicate where public and private land development and infrastructure investment should take place;
May delineate the urban edge; and
Must identify areas where strategic intervention is required, and must indicate areas where priority spending is
required
2. Regulation 2 (2) states that an IDP may;
Have attached to it maps, statistics and other appropriate documents; or
Refer to maps, statistics and other appropriate documents that are not attached, provided they are open for
public inspection at the offices of the municipality.
3. Regulation 2 (3) sets out matters/issues that must be reflected in the financial plan that must form part of the Integrated Development Plan. 4. Regulation 2 (4) states that a spatial development framework reflected in the municipality‟s Integrated Development Plan must:
Give effect to the principles contained in Chapter 1 of the Development Facilitation Act 67 of 1995;
Set out objectives that reflect the desired spatial form of the municipality;
Contain strategic and policies regarding the manner in which to achieve the above, which strategies and and
policies must;
o Indicate desired pattern of land use within the municipality;
o Address the spatial reconstruction of the municipality; and
o Provide strategic guidance in respect of the location and nature of development within the municipality
13
Set out basic guidelines fo a land use management system;
Set out a capital investment framework for the development programme within a municipality;
Contain a strategic assessment of the environmental impact of the spatial development framework;
Identify programmes and projects for the development of land within the municipality
3.3.5 Municipal Finance Management Act (Act 56 of 2003)
Section 21 (2) of the Municipal Finance Management Act states that, when preparing the annual budget, the Mayor of a municipality must;
Take into account the municipality‟s Integrated Development Plan;
Take all necessary steps to ensure that the municipality revises the Integrated Development Plan in terms of
section 34 of the MSA, taking into account realistic revenue and expenditure projections for future years;
Take into account the national budget, the relevant provincial budget, the national government‟s fiscal and macro
economic policy, the annual Division of Revenue Act and any agreement reached in the Budget Forum
The Greater Tzaneen Municipality‟s core functions is to support and develop programmes to enhance the life‟s of our communities in fulfilling the constitutional and legal mandate assigned to local government in the:
Provision of water as a Water Services Provider
Supply and distribution of electricity within its area of license
Provision of waste collection services
Enhance Local Economic Development
Road Traffic management and Law enforcement services

14
4. PHASES OF THE IDP THE IDP PROCESS CONSISTS OF 5 PHASES WHICH ARE:
Phase 0: Planning During Phase 0 of the IDP the municipality have to develop an IDP Process Plan that is in line with the District IDP Framework. All organizational arrangements for the development of the IDP should be put in place during this phase.
Phase 1: Analysis The Analysis phase is aimed at establishing the current developmental status of the municipal area. This will be done by comparing community needs with statistical information that is available to be able to identify priority areas, jointly with the community.
Phase 2: Strategies During the Strategies phase the developmental priorities of identified during the analysis are used as the basis for developing a vision and a mission for the municipality. Thereafter strategic objectives and strategies are developed to ensure that the vision is achieved.
Phase 3: Projects During the Projects phase projects are identified in line with the strategies developed during phase 2. These projects have to be prioritized.
Phase 4: Integration During the integration phase all sector plans and programmes are developed e.g. Spatial Development Framework. Only summaries of these sector plans are included in the IDP document.
Phase 5: Approval. During the Approval phase of the IDP the IDP document has to be advertised for 21 days to enable all stakeholders and members of the public to give inputs. Thereafter the IDP has to be adopted by council before the start of the new fiscal year

15
5. PHASE 0- PLANNING PROCESS 5.1 INSTITUTIONAL ARRANGEMENTS
IDP Steering Committee
Cluster/ Portfolio dealing within IDP
IDP Task Teams (Themes)
IDP unit
IDP Representative Forum
District Coordination of IDP Process
IDP Process Plan
5.1.1 IDP Steering Committee The Greater Tzaneen Municipality‟s IDP Steering Committee is fully functional 5.1.1.1 Composition of IDP Steering committee is as following:-
Municipal Manager
All Section 57 Managers
All Divisional Managers
Cluster/ Portfolio Committee on IDP
5.1.2 The IDP Portfolio Committee The Greater Tzaneen Municipality„s IDP Portfollio Committee is functional, dedicated councilors have been nominated to give political direction of our IDP issues. 5.1.2.1 Composition of the portfolio committee as follows:-
Councillor Godfrey Mangena
Councillor Sannie Tiba
Municipal Manager
All Section 57 Managers
IDP Manager
IDP Task Team Members
5.1.3 The IDP Task Teams (Themes) The IDP Steering Committee has been established and tasked to deal with sectoral issues of the IDP process and is as follows
Table 1: Key Strategic Four Areas Theme teams
Basic Service Delivery and Infrastructure Planning
Local Economic Development
Good Governance Public Participation
Financial Viability
Municipal Transformation and Organizational Development
Convener Molatelo Rapetsoa & Pierre Van den Heever
Faith Mashianoke Mabakane Mangena & Obby Mkhombo
1 Andrew Laubscher Freddy Rammalo Town Planner Secundi:Mokgadi
Boet Botha Andre Le Grange
Tienus Visser Secundi: Brian Mashala

16
Mmola
2 Henk Mienie Sam Lelope Nic Fourie IT Gerald Twala Secundi:Modibe Sekgotodi
3 Revenue Maggie Machumele Rogers Shingange Frieda Human Secundi: Antoinette Cloete
Neels Engelbrecht
4 Communication & Marketing Secundi – Nikiwe Mathebula
Kwena Maphoto Fourie Malale Ludic Mahayi: Secundi-Z Maake
Johan Biewenga
5 Handswell Phakula Secundi:
Johannes Malatji E Vilankulu (CEM)
Gerald Twala Secundi: Lulu Mkhosana
Christine Nel Tiyani Hlayisi
6 Anton Kilian Thabo Ramogano A Sebeela Secundi: M Nkonwana
Andre Liversage
Xoliswa Mdani
7 Nkopodi Phatudi Winnie Baloyi
8 Electrical Wessel Pretorius
5.2.4 IDP Unit The IDP unit is currently under- staffed and is located at Planning and Economic Development Department under Town
Planning Division instead of the Municipal Managers Office in terms of the DPLG guidelines.
The IDP has no interface with GIS and M&E, due to the fact that these functions are within PMS which report differently
and not aligned to the IDP unit.
The IDP functionaries are not providing strategic advice to senior management due to non-attendance of management
meetings.
The IDP is currently developed and reviewed internally not outsourced to service providers, but due to staff shortage IPM
has been appointed by MDM to assist as per Council‟s request.
5.2.5 IDP Representative Forum The IDP Representative forum is established and reviewed annually for membership registration
Composition of the IDP Representative forum includes key stakeholders e.g. Disabled, Business Sector, Agricultural
sectors, SME‟s Taxi Associations, Traditional Leaders and Healers, Professional sector, youth and women.
5.2.6 District Coordination of IDP Process The District Planning Forum is not as yet established with the Mopani District area.
The District does have an approved District Framework that does not align Planning activities of our municipality.
The IGR structures are not currently contributing in the IDP process.
5.2.7 IDP/Budget and PMS Process plan 2008/2009
Table 2: IDP/Budget and PMS Process Plan 2008/2009
TARGET DATES ACTIVITY / TARGET RESPONSIBILITY STAKEHOLDERS
13-31 October 2008 Consolidation and analysis of issues (Phase 1) PED IDP Steering Com.
17 October 2008 Start preparing draft budget and plans for next 3 years
All Managers HOD‟s
27 October 2008 Prepare inputs for Annual Report 2007-2008 PED MM, Managers & HOD‟s
1-30 November 2008 Project Planning by All Departments PED MM, Managers, HOD‟s

17
TARGET DATES ACTIVITY / TARGET RESPONSIBILITY STAKEHOLDERS
30 November 2008 Submission of Project Planning information PED All Managers
20 November 2008 Representative Forum meting PED MM, Managers, HOD‟s, Community Stakeholders
4-5 November 2008 1st Strategic Session (Review of Strategies) PED IPM,MM, All Managers
12-13 November 2008
2nd Strategic Session (Review of Strategies and Proposed Projects)
PED IPM,MM, All Managers, EXCO, HOD‟s
4 December 2008 Prioritization of Projects
15 December 2008 Submit 1st Draft IDP to Council for approval MM, PED MM, Managers,& Representative Forum
9 January 2009 Submit 6 monthly actual figures to Managers CFO MM & Managers
21 January 2009 Budget request submitted to Chief Financial Officer
All Managers CFO
27 January 2009 Submit Annual Report 2007-2008 to Council for Approval
MM, PED Mayor, MM, & Managers
28 January 2009 - 13 February 2009
2nd Quarterly Performance Assessment Mayor and MM MM, Managers, HOD‟s
11 February 2009 Finalize detailed budgets, IDP projects, PMS and sector plans for next three years
Budget: CFO IDP: MM Plans: All Managers
MM, Managers, HOD‟s, Mopani district Municipality and Sector Departments
12 February 2009 Representative Forum meeting PED MM, Managers, HOD‟s Community Stakeholders
17 February 2009 Submit IDP and Budget to Finance Study Group PED, CFO Finance Study Group
24 February 2009 Submit reviewed Budget related Policies to Council for approval
CFO, MM Exco and Council
24 February 2009 EXCO Adopts the Draft Budget, and IDP EXCO Budget Report: CFO IDP Report: PED
Councillors
24 February 2009 Mayor tables in Council the Draft Budget, IDP 2nd Draft
Mayor Councillors
3 March 2009 Organize public hearings: Dates, Venues, Equipment
Corporate services Community and Stakeholders
3 March 2009 Advertising, Allocation of Councillors to Public hearings and informing Councillors of the public hearings they have to attend (Budget and IDP)
Corporate services Councillors Community
5 March 2009
Presentation on budget and IDP to Councillors CFO, PED Councillors
6 March 2009 Publish preliminary Budget and draft IDP in newspapers and make it available on Council‟s Website
Corporate services Community
TARGET DATES ACTIVITY / TARGET RESPONSIBILITY STAKEHOLDERS
6 March 2009 Submit Draft Budget and IDP to NT, Provincial Treasury and Mopani District Municipality
CFO NT, Provincial Treasury and Mopani District Municipality
15 March 2009 Integration of institutional plans (Phase 4) MM,PED MM, Managers & HOD‟s
7 – 23 March 2009 Community consultation and council debate on budget and IDP (Public Hearings)
Councillors Community
10 March 2009 Submit finalized institutional and sector plans PED Internal Departments and Sector Departments

18
9 April 2009
Representative Forum meeting PED IDP/PMS Representative Forum
13 – 24 April 2009 3rd Quarterly Performance Assessment Mayor & MM MM, Managers, HOD‟s
30 April 2009 Submit budget and changes to IDP to the Finance Study Group for consideration
Budget: CFO IDP: PED
Finance Study Group
12 May 2009 Submit budget and changes to IDP to EXCO for consideration
Budget: CFO IDP: PED
EXCO
26 June 2009 Signing of Performance plans 2009/2010 Managers
Mayor & MM Mayor, MM & Councillors
26 May 2009 Mayor tables Draft Budget and changes to IDP for approval by Council (Approval Phase 5)
Mayor Council
5 June 2009 Publish budget and IDP in newspapers, make IDP available for inspection
Corporate Services Community
5 June 2009
Submit Budget & IDP to NT, MEC, MDM CFO, PED NT, MEC, MDM
18 June 2009 Submit draft SDBIP to Mayor MM Mayor
25 June 2009 Mayor approves SDBIP Mayor Mayor
17 July 2009 Signing of Performance plans 2009/2010 HOD‟s Managers & MM Managers, MM
10 – 25 August 2009 Final Performance Assessment Mayor & MM MM, Managers & HOD‟s
25 August 2009 Mayor tables SDBIP and Performance plans to Council
MM Mayor, MM & Councillors
3 September 2009 Make SDBIP and Performance plans public MM Mayor, MM, Councillors

19
6. PHASE 1 – ANALYSIS
6.1 CURRENT REALITY: BASIC FACTS AND FIGURES
6.1.1. LOCALITY
The Greater Tzaneen Municipality is situated in the eastern quadrant of the Limpopo Province within the Mopani District Municipality Area of Jurisdiction, together with Greater Giyani, BA-Phalaborwa and Greater Letaba., Polokwane to the west, Greater Letaba to the north, Ba-Phalaborwa and Maruleng to the east, and Lepelle-Nkumpi to the south, border the Greater Tzaneen Municipality and Giyani border. A map depicting the locality of the Greater Tzaneen Municipal area is attached at the end of this document as Map 1.
6.1.2. DESCRIPTION OF MUNICIPAL AREA
The Greater Tzaneen Municipality comprises a land area of approximately 3240 km², and extends from Haenertsburg in the west, to Rubbervale in the east (85km), and just south of Modjadjiskloof in the north, to Trichardtsdal in the south (47km). The municipal boundaries form an irregular, inverted T-Shape, which results in certain developmental implications for the Municipality, and more specifically the distance to markets, difficulties in respect of service provision, and constraints to implementing development vision / strategy. The Greater Tzaneen Municipality area encompasses the proclaimed towns of Tzaneen, Nkowankowa, Lenyenye, Letsitele and Haenertsburg. In addition, there are 125 rural villages, concentrated mainly in the south-east, and north-west, of the study area. Almost 80% of households reside in these rural villages. The municipal area is further characterized by extensive and intensive farming activities (commercial timber, cash
crops, tropical and citrus fruit production); Mountainous, inaccessible terrain in the west and south, and un-even topography (gentle slopes) to the north and east; Areas with exceptional natural beauty, with considerable untapped tourism potential. The Phalaborwa SDI transverses the Greater Tzaneen Municipal Area, while one of the major road links between Gauteng and the Kruger National Park also passes through the area. In addition, a large area of land is in private ownership, ranging from smallholdings to extensive farms, used mainly for commercial farming activities, equally large areas of land is in the ownership of the State, under the custodianship of six Traditional Authorities.
6.1.3 LAND
Land ownership in the municipal area is characterized by: Approximately 66% of the total land area in private ownership, ranging from smallholdings to extensive farms, used
mainly for commercial farming activities; Approximately 33% of the total land area in ownership of the State, under custodianship of six Traditional Authorities;
and Land of negligible extent being municipal commonage.

20
2.1.4 SOCIAL STATUS - DEMOGRAPHICS
(a) Population distribution Greater Tzaneen Municipality statistical sources on population demography were extracted from census population of 2001, information valid until the next census count. The Municipality conducted its own survey in 2003 on the realization that census 2001 results are being delayed. The results reflected a total population of 489 974 for 2003 (GTM Status Quo Survey Report, 2003). The Department of Water Affairs & Forestry also conducted a population survey for the municipality in 2001 and estimated that 395 121 people are staying in GTM. Below is an estimated population growth projection as per the 2003 Status Quo Survey report of the Greater Tzaneen Municipality. The projections were informed by the growing mortality rate as a result of the HIV/AIDS epidemic calculating an average impact on the growth. Table 2 below shows a declining annual population average growth rate up until 2013. Table 3: Projected Population per node, 2003 – 2013
Category Nodal Cluster Population
2003
Annual Growth
Rate
Population - Moderate HIV Impact Increase 2003-2008
Increase 2003-2013 2004 2005 2006 2007 2008 2013
Primary Nodes
Nkowankowa 26360 1.05 27678 29062 30515 32041 33643 42928 7283 16568
Letsitele 227 1.05 238 250 263 276 290 370 63 143
Dan 23304 1.05 24469 25693 26977 28326 29742 37951 6438 14647
Khujwana 14273 1.05 14987 15736 16523 17349 18216 23244 3943 8971
Mariveni 9222 1.05 9683 10167 10676 11209 11770 15018 2548 5796
Petanenge 5655 1.05 5938 6235 6546 6874 7217 9209 1562 3554
Mokgolobotho 9291 1.05 9756 10243 10755 11293 11858 15131 2567 5840
Tzaneen 10223 1.05 10734 11271 11834 12426 13047 16649 2824 6426 Secondary Nodes
Lenyenye 12270 1.035 12699 13144 13604 14080 14573 17307 2303 5037
Mohlaba Cross 15052 1.035 15579 16124 16688 17273 17877 21231 2825 6179
Moime 12800 1.035 13248 13712 14192 14688 15202 18054 2402 5254
Marumofase 2681 1.035 2775 2872 2972 3077 3184 3782 503 1101
Maake 2189 1.035 2266 2345 2427 2512 2600 3088 411 899
Tertiary Nodes
Nkambako 3440 1.02 3509 3579 3651 3724 3798 4193 358 753
Mamitwa 3852 1.02 3929 4008 4088 4170 4253 4696 401 844
Mandlakazi 11082 1.02 11304 11530 11760 11996 12235 13509 1153 2427
Haenertsburg 679 1.02 693 706 721 735 750 828 71 149
Burgersdorp 6858 1.02 6995 7135 7278 7423 7572 8360 714 1502
Gabaza 4505 1.02 4595 4687 4781 4876 4974 5492 469 987
Rural All remaining villages
316011 1.005 317591 319179 320775 322379 323991 357200 7980 41189
TOTAL 489974 498665 507677 517026 526726 536793 618239 46819 128265
Source: GTM Spatial Development Framework, 2003
(b) Gender and Age According to the census statistics of 2001, Greater Tzaneen Municipality had a total population of 375 588 comprising 171 119 males and 204 469 females in 2001. Females outnumber males considerably, and comprise 54.4% of the

21
population. This is attributed to the migrant labour system and the fact that females normally outlive their male counterparts. The unavailability of men leaves women to face the community hardships alone.
Table:4 Age group, population group and gender
African/Black Coloured Indian/Asian White Total
Male Female Male Female Male Female Male Female
NP333: Greater Tzaneen 0 - 4 18769 19204 34 45 12 20 271 219 38574
Local Municipality 5-9 22794 23287 53 43 16 14 272 280 46759
10-14 24805 25104 37 35 8 16 421 364 50790
15 - 19 22615 23127 36 42 11 16 509 468 46824
20 - 24 16390 18569 34 45 22 14 190 236 35500
25 - 29 12318 16611 40 31 24 12 297 296 29629
30 - 34 10198 13865 32 18 17 14 252 299 24695
35 - 39 8585 13479 23 28 12 12 269 294 22702
40 - 44 7191 10463 17 11 13 10 313 350 18368
45 - 49 5934 8652 9 15 5 9 284 270 15178
50 - 54 4990 6170 4 9 8 3 222 281 11687
55 - 59 3661 4205 10 6 5 0 243 180 8310
60 - 64 2888 4769 3 3 7 3 170 196 8039
65 - 69 1719 3847 0 5 0 0 101 111 5783
70 - 74 1564 3838 5 8 0 4 79 87 5585
75 - 79 954 1843 3 3 3 0 36 65 2907
80 - 84 754 1812 0 3 0 0 22 31 2622
85+ 526 1045 0 4 0 7 10 44 1636
Total 166655 199890 340 354 163 154 3961 4071 375588
Source: Statistics SA; 2001
5 . 2 5 . 6
6 . 3 6 . 3
4 . 7 3 . 4
2 . 8 2 . 6
2 . 0 1 . 6 1 . 3
1 . 1 1 . 0
0 . 9 0 . 4 0 . 2 0 . 2
0 . 4
4 . 5 5 . 9
6 . 7 6 . 7
4 . 8 4 . 2
3 . 7 3 . 3
2 . 9 2 . 7
1 . 6 1 . 5
1 . 2 1 . 3
1 . 1 0 . 9 0 . 5
0 . 5
8 . 0 6 . 0 4 . 0 2 . 0 0 . 0 2 . 0 4 . 0 6 . 0 8 . 0
0 - 4 5 - 9
10 - 14 15 - 19 20 - 24 25 - 29 30 - 34 35 - 39 40 - 44 45 - 49 50 - 54 55 - 59 60 - 64 65 - 69 70 - 74 75 - 79 80 - 84
85 +
Percentage distribution of population of Greater Tzaneen Municipality on age and gender
Male Female

22
4% of the population comprises school-goers and children between 0 to 17 years of age, whereas matured young population that are either completing their studies or working constitute 30% of the total population. In total, the area is made up of about 74% of young people aged 0 to 35. The rest of the 26% comprise of the aged population who are in their late thirties and some on pension. The economic potential therefore lies within the available younger generation of the area that is still strong and could be retained for local job opportunities. According to Census figures, 49% of the population is working. That is an indicative factor for a need for increased job creation in the area since about 51% of the population is unemployed. Table 4 depicts different age categories: Table 5: Population per age category, 2001
0-17 % (0-17) Youth-School going
18-35 % (18-35) Youth -
Working group
36-55 % (36-55) Middle aged -
Working group
56+ % (56+) Retired/
Pensioners
Total
Black African 162965 44 108996 30 62967 17 31665 9 366593
Coloured 306 41 232 31 144 19 57 8 739
Indian or Asian 116 35 114 35 78 24 21 6 329
White 2534 32 1927 24 2205 28 1257 16 7923
Total 165921 44 111269 30 65394 17 33000 9 375584
Source: Census 2001
(c) Education and Income The level of education of the population has an impact on their income generating ability. Table 5 presents the highest level of education for the population of Greater Tzaneen in 2001. Table 6: Highest level of education of the population, 2001
Level Figure Percentage %
No schooling 82610 21.99
Some primary 132500 35.28
Some secondary 108388 28.86
Certificate or diploma 10115 2.69
Bachelor‟s degree 2616 0.70
Honours degree 509 0.14
Higher (postgraduate) degree 274 0.07
Not applicable 38574 10.72
Total 375585 100
Source: Census, 2001
The results show a dramatic decline of education after the secondary level. The results also show only 2.69% of people with certificates or diplomas and thereafter less than 1% in all subsequent higher levels. Twenty-one percent of people have no schooling and that has negative impact on economic development as this factor poses difficulty in skills transfer. This situation needs to be improved as a matter of urgency if the reliable, skilled workforce is to be attained. The impact of the low levels of education is evident from the income levels presented in Table 6

23
Table 7: Annual Household Income per income level, 2001
Income Level Total
None 27706
R1 – R4 800 15549
R4 801 – R9 600 24722
R9 601 – R19 200 14269
R19 201 – R38 400 7294
R38 401 – R76 800 3856
R76 801 – R153 600 2430
R153 601 – R307 200 979
R307 201 – R614 400 276
R614 401 – R1 228 800 102
R1 228 801 – R2 457 600 134
R2 457 601 and more 57
Total Households 97374
Source: Statistics SA; Census 2001
The above figures show that 27 706 households, which is 29% of the total do not have any source of income. While the rest of the households do have sources of income, 70% of the household‟s incomes are below the minimum living levels, that is R9 600 per annum or lower or as R1 600 per month (as defined in 2000) Also, a household is considered poor and living in dire poverty if its income falls below the minimum living level, which was R1 600 for the year 2000. More than 70% of households are falling within the same income bracket and are therefore regarded as living under poverty. Poverty is further exacerbated by lack of coordination and integration of poverty alleviation initiatives among institutions that result in a waste of resources that were meant to alleviate it. This clearly shows that the municipality has a huge challenge of initiating sustainable poverty alleviation programmes. (d) HIV/AIDS The Limpopo Department of Health and Social Development undertook an HIV Antenatal Sero-prevalance survey in 2006 of women attending ante-natal clinics in public health facilities throughout the province. The 2005 prevalence statistics show that 30.2% of pregnant women who were surveyed were infected with HIV. This survey revealed that the epidemic is at an advanced stage, this resulted in the review of the survey protocol. In the 2006 survey, Limpopo doubled its sample size from 2000 samples to 4000 with more sites from 50 to 218. Survey results are depicted in a table below: TABLE 8: HIV PREVALENCE BY DISTRICTS 2004 -2006
DISTRICTS 2004 2005 2006 Capricorn 21.59% 22.2% 24.2%
Mopani 22.53% 29.8% 24.8
Sekhukhune 13.48 17.7 16.1
Vhembe 14.34 13.9 14.2
Waterberg 26.6 28.5 27.5
Provincial 19.32 21.5 20.7
The above statistics show that in Mopani District there is a 5% decline in HIV prevalence in pregnant women. The National prevalence statistics for 2006 show that 29.1% of pregnant women were infected with HIV. TABLE 9. HIV PREVALENCE BY MUNICIPALITY 2006
MUNICIPALITY TOTAL SAMPLES % of HIV PREVALANCE
Ba-Phalaborwa 143 27.3 Greater Giyani 120 17.5
Greater Letaba 155 21.3

24
Greater Tzaneen 247 28.5
Maruleng 56 26.8
The above statistics show that our municipality has the highest HIV prevalence rate. In analyzing these statistics one has to make into account that though HIV is spread predominantly through unprotected sexual intercourse, there are contextual factors which increase the risk of exposure to the disease. These contextual factors are: Poverty; Gender and gender based violence; Cultural attitudes and practices; Stigma, denial, exclusion and discrimination; Mobility and labour migration as well as informal settlements.
The challenge of HIV/AIDS requires an intensified comprehensive, multi-sectoral national response to address the socio-economic circumstances that make certain segments of society vulnerable and to provide tools for prevention of infections. (e) Internal Focus
HIV/AIDS impacts on our productivity as a municipality due to long absences from work due to illness which eventuates in death. We however in our quest to fight this scourge have the following in place: Employee Assistance Programme (EAP) Policy approved and implemented by Council; EAP Advisory Committee in place and operational; Life Threatening Diseases (including HIV/Aids) Policy approved and implemented; HIV/Aids five-year plan available; HIV/Aids Peer Educators within a workplace trained and operational; HIV/Aids Council in place for area of jurisdiction.
Challenges: Policy on Life threatening diseases is not focused on dealing with HIV/Aids within the workplace only; No audits/studies on HIV/Aids in the workplace No budget directly linked to HIV/Aids issues Lack of HIV/Aids Committee within the workplace
(f) External Focus A five-year strategic plan on HIV/Aids has been approved by Council, which is structured according to the following four areas: Prevention Treatment, care and support Monitoring and surveillance Human and legal rights
(g) Disability and Population Group Table 10: Disability prevalence, 2007 (LIM 333: Greater Tzaneen Municipality Black Coloured Indian or Asian White Total
Sight 3062 0 0 66 3128
Hearing 1349 0 0 0 1349
Communication 781 0 0 0 781
Physical 5130 0 105 69 5304

25
Intellectual 1447 0 0 0 1447
Emotional 2193 0 0 61 2254
Multiple Disabilities 616 0 0 0 616
No Disabilities 327280 211 1067 2930 331488
N/A: Institutions 2256 23 8 431 2718
Total 344114 234 1180 3557 349085
Stats SA: Community Survey 2007

26
6.2. SUMMARY OF COMMUNITY AND STAKEHOLDER PRIORITY ISSUES 2009/10
Ward Priority
needs
Suggested
Project
Village/location Implementation
Agent
1 Water Morapalala All Villages
Electricity Morapalala, senopelwa
Housing RDP Morapalala
Electricity Street Lights Mokwakwaila Complex
2 Water Supply every house hold Mokgwathi, Lekgwareng Mawa Block 8,9& 12
Electricity Electrification of new extensions
Mokgwathi, Lekgwareng Mawa Block 8,9& 12
Road Tar Bolobedu Cross to Mokgwathi and Mokwakwaila to Mawa
3 Water Bulk Supply Ga – Wally, Radoo, Ramochinyadi
1
cleaning of reservoirs and maintenance
Ga – Wally, Radoo, Ramochinyadi
Water Boreholes Ga – Wally, 2
Water Water reticulation Ga – Wally, Radoo, Ramochinyadi
Electricity Nyakeleni 2
Job Opportunities
Community projects Ramochinyadi 2
Roads Radoo 3
Job Opportunities
Community projects Ramochinyadi 3
Recreational facilities
Sport ground Ramochinyadi 3
Facilities Sport grounds Radoo 4
Roads Road to graveyard Radoo 4
Sanitation Cemetery Toilets Radoo, Ga - Wally 5
Committee Establishment of Steering Committee for Ritavi Regional Scheme
Ramochinyadi 5
Job Opportunities
Community projects Radoo 6
Electricity Ramochinyadi 6
Facilities Sport grounds Radoo 7
Water R26Mil to be used in Water Reticulation only
Ramochinyadi 7
Equipments Graders All wards 8

27
Ward Priority
needs
Suggested
Project
Village/location Implementation
Agent
4 Water
Electricity
Land and housing
Roads
Health
Safety and Security
LED
Education, Arts and Culture
5 Electricity Electrification of villages Musiphana, Malubana, Maweni & Mackery
1 ESKOM
Water Provision of water to all setllements
Musiphana, Malubana, Maweni & Mackery, Mugwazeni
2 DWAF
Increasing Boreholes Musiphana, Malubana, Maweni & Mackery, Mugwazeni
2
Roads Regular grading of streets Musiphana, Malubana, Maweni & Mackery, Mugwazeni
3 MDM
Culverts Malubana, Maweni & Mugwazeni
3
Facility Shelter for pensioners Maweno 4
Recreational Facilities
Erection a closed gorund for all sporting codes
Malubana 5
Youth Advisory Centre
Building of an advisory center for the youth
All villages 61
6 Electricity
Electrification of households
All villages: Pyapyamela, Mavele, Joppie & Rummymede
ESKOM
Apollo light or street lights Pyapyamela, Mavele, Joppie & Rummymede
Water Access water All villages: Pyapyamela, Mavele, Joppie & Rummymede
Refurbishment to boreholes
Runnymede, Joppie
Water camps Pyapyamela & Runnymede
Installation of street taps Pyapyamela, Joppi, Mavele & Runnymede
Reservoir
Pyapyamela

28
Ward Priority
needs
Suggested
Project
Village/location Implementation
Agent Roads
Access Road All villages: Pyapyamela, Mavele, Joppie & Rummymede
Opening of road from Babanana to Mavele
Mavele
Re-gravelling of road from Pyapyamela to Madumang
Pyapyamela
Regravelling of road corner Runnymede holly missionary church to Pyapyamela
Runnymede
Opening of Road from Mavele ZCC to Joppie graveyard
Mavele
Opening of road between new Canada to Joppie
Joppie
Opening of new road from Runnymede to Joppie
Runnymede
Taring of streets Runnymede, joppie, Mavele & Pyapyamela
Grading of streets Runnymede, joppie, Mavele & Pyapyamela
Drought relief project Runnymede
Grading of soccer field Runnymede, joppie, Mavele & Pyapyamela
Sanitation
Toilets All Villages: Runnymede, Mavele, Joppie & Pyapyamela
Maintenance Cleaning of MPCC
Facility Cattle Camps Runnymede
Roads Grading All Villages
Roads Speed humps Mavele & Rannymede
Opening of roads to New Canada
Mavele
Cemetery Erection of graveyard at New Canada
Mavele
Cleaning or Deburshing Mavele, Rynnymede, Pyapyamela & Joppie
Housing RDP houses Mabele, Runnymede, Joppie., Joppie.
7 Water Water pump machine for borehole & Maintenance
Madumane
Unfinished project (Water Reticulation)
Moroasethla
Unfinished project (Water Reticulation)
Mothomeng
Maintenance of boreholes Kheopeng
Road Access road (Internal Streets)
Seopeng to Matarapane
Sanitation VIP Toilets Morutjie

29
Ward Priority
needs
Suggested
Project
Village/location Implementation
Agent
Water Unfinished projects (Water reticulation)
Mohlakong
Unfinished projects (Water Reticulation)
Botludi
Recreation facilities
Sports field, Tennis and Netball court
Mothomeng
Sports field Moroasethla
Electricity Street light, extension Madumane
Road Access road
Internal streets Kheopeng
Water Water reticulation Matarapane
Road Access road (internal Streets0
Moritjie, Mohlakong
Re-gravelling Morutjie and Thapane
Electricity Electrifying New extensions
Botludi
Roads Tarred Access road (internal streets0
Morutji to Madumane
Electricity Electrifying new extensions
Moroasethla, Kheopeng, Matarapane
Roads Internal streets
Housing RDP houses Morutjie, Botludi
Sanitation VIP Toilets Mohlakong
Recreation facilities
Sports field Madumane
Road Access road (internal Street)
Morwaselina to Mahowa
Electricity Street light - New extension
Mothopong
Cemetery New cemetery Kheopeng
Sanitation VIP Matarapane
Electricity Street light Mohlakong
Road Access road (internal street)
Botludi
Recreation facilities
Sports field Kheopeng
Infrastructure RDP houses Mohlakong
Sanitation VIP toilets Botludi
Recreation facilities
Sports field Botludi
8 Cemetery New cemetery and Fencing
Semarela, Mphatasediba, Setheeng, Ramphelo, Sethone, Relela, Jokong, Mmasebutsa & Khekhwinya
Sanitation Toilets Semarela, Mphatasediba, Setheeng, Ramphelo, Sethone, Relela, Jokong, Mmasebutsa & Khekhwinya

30
Ward Priority
needs
Suggested
Project
Village/location Implementation
Agent
Health Clinic Sethone & Relela
Roads Low level Bridge Semarela
Roads Internal Streets
Water Water supply
Electricity (New stands) to be attended as surveyed
Roads Internal streets Semarela, Mphatasediba, Setheeng, Ramphelo, Sethone, Relela, Jokong, Mmasebutsa & Khekhwinya
Electricity Post connection Semarela, Mphatasediba, Setheeng, Ramphelo, Sethone, Relela, Jokong, Mmasebutsa & Khekhwinya
Road Speed humps Relela TaxiRank and MPCC
Electricity Street lights Relela TaxiRank and MPCC
Roads Access road Semarela, Mphatasediba, Setheeng, Ramphelo, Sethone, Relela, Jokong, Mmasebutsa & Khekhwinya
Road Pedestrian crossing Next to Sethone Primary and Relela Taxi Rank
Road Storm water pipes
Water Boreholes Semarela, Mphatasediba, Setheeng, Ramphelo, Sethone, Relela, Jokong, Mmasebutsa & Khekhwinya
9 Water Mopje
Electricity Mopjeoo
Roads Access Road Kgwekgwe, Mopje
Pax Bridge Via Strawberry
Job Creation Kopanang Projects Mopje
Road Re - gravelling Eskom to Mopje
Graveyard Fencing Mopje
Facilities Sport Field Mopje
Housing Unfinished RDP Kgwekgwe
Roads Access Roads Kgwekgwe Streets
Electricity Kgwekgwe
Education Pre – School Kgwekgwe
Health Facilities Clinic Thako
Roads Bridge Thako to Jokong and Moleketla
Graveyard Fencing Thako
Water Reservoir Thako

31
Ward Priority
needs
Suggested
Project
Village/location Implementation
Agent
Water Borehole Thako Clinic
Roads Bridge Moleketla
Housing Unfinished RDP Moleketla
Roads Access road Moshakga, Thepene
Graveyard Fencing Moleketla
Roads Tar Moleketla to Sefolwe
Electricity Moleketla
Road Re - gravel Mboke to Nkgwekgwe
Road Matipane to Mabipilong
Water Access water Matswi
Health Facilities Clinic Mabipilone
Education Facilities
Pre - School Mabipilong
Graveyard Fencing Mabipilong
Electricity New coonections Mabipilong
10 Water Reservoir Kubjana, Motupa &
Marirone
Street Pipes Motupa and Marorone
House connection
Electrification of boreholes Kubjana, Motupa &
Marirone
Electricity House connection (Extensions)
Motupa Marirone & Kubjana
Apollo light
Kubjana bus stop,
Marerone, Bridge crossing
Road Speed hump
Kubjana village, Motupa
main road
Recreation Grading of Sport ground
Marirone
Cemetery Fencing Graveyard
Motupa, Marirone &
Kubjwana
Cemetery Extension of graveyard Motupa
Road Access roads
Bridge
Motupa Graveyard Motupa
Recreation Community hall Motupa
Housing RDP houses
Motupa, Marirone and
Kubjwana

32
Ward Priority
needs
Suggested
Project
Village/location Implementation
Agent
Drainage Marironi
Water Storm water
Motupa, Marirone and
Kubjwana
Sanitation Toilets Motupa, Marirone,
Kubjwana
Facility Taxi Rank Kubjwana
Roads Grading of internal streets Motupa, Marirone and
Kubjwana
Recreation Sports centre Marirone Village
11 Recreation Stadium
Road Between Thapane and Morutji and also link road to Modjadji Head Kraal
Water Two (2) Boreholes per village
Bokhuta, Babanana, Leokwe, Leretjeni, Tobeni, Mapitlula and Thapane
Electricity 60% of Households
Electricity Apollo lights Bokhuta, Babanana, Leokwe, Leretjeni, Tobeni, Mapitlula and Thapane
Road Tar or Grading Mososong to Nchenya (Zakes avenue ext.)
Teanet Shop to Relela Taxi Rank
Thapane Dam to Motupa via Mapitlula
Babanana road
Roads Culverts Between Leokwe and Babanana
Pay point Shelters and Chairs Pay point
Facilities Shelters at Taxi Ranks and Bus Stop
Job creation Projects
Health Clinic
Improvement of Dipping Tanks
Cemetery Fence, Toilets and Water Bokhuta, Babanana, Leokwe, Leretjeni, Tobeni, Mapitlula andThapane
Housing 50% of villages needs RDP Houses
Recreation Soccer fields All Schools and Bokhuta, Babanana, Leokwe, Leretjeni, Tobeni, Mapitlula and Thapane

33
Ward Priority
needs
Suggested
Project
Village/location Implementation
Agent
12 Water Pipeline To Start From
Nkambako To Rwanda.
Rwanda, Shongani,
Water tankers to deliver
water at least twice a week
Water taps to be installed
in peoples yards for
effective usage and
payment
All villages in ward 12
Electricity Electrification Of Villages Lwandlamuni,
Rwanda,Mbhekwana And
Other Ext.Villages
Graves New Graves And The
Assistance In Digging
Lwandlamuni &Babanana
Roads Streets To Be Improved
And Construct Bridges On
Road To Mandhlakazi
,Samson To
Lwandhlamuni And To
School
Mbhekwana,
Lwandlamuni,Rwanda
Nwajaheni
Speed Humps To
Considered In Main
Streets
All Villages
New schools Construction of new
schools
Rwanda and lwandlamuni
Community hall
and youths
project centre
Construction of community
hall and youths centre
Ward 12
13 Water Reservoir (Dam) Mandlakazi, Tarantaal & Mieliekloof
House Connections
Revamping of boreholes
Road Reshaping Mandlakazi, Tarantaal & Mieliekloof
Small bridges
Housing RDP Mandlakazi
Infrastructure Community Hall Mandlakazi
Sanitation Toilets Mandlakazi
Health Clinic Mandlakazi, Tarantaal &

34
Ward Priority
needs
Suggested
Project
Village/location Implementation
Agent Mieliekloof
Electricity Installation or connection to the new extension and new settlements
Mandlakazi
Cemetery New graveyardor extension of the old cemetery before people occupy the space
Mandlakazi
Land New settlement are need of stands
Mandlakazi
Transport Road needs to be tarred Via Mamitwa, Mbhekwana, Mandhlakazi until joining Deerpark road.
Reshaping and grading every fortnight
Recreation centre
Stadium Tennies court & Parks
Mandlakazi, Tarantaal & Mieliekloof
14 Water Maribethema, politsi
sanitation Toilet Politsi, Maribathema
Health Health centre Politsi, Maribathema
Housing RDP Politsi, Maribathema
Road
Electricity Street lights Politsi, Maribathema
15 Electricity New electrical substation, switchgear and cabling in order top cope with demand for electricity.
Tzaneen
Road Tar with storm water drainage and pavements of the street in front of Unity Primary School, Pompagalana.
Tzaneen
Recreation Fencing of park in Flora Park
Tzaneen
Maintenance of parks Tzaneen
Construction By pass from High Groove to MacDonalds
Tzaneen
16 Water Refurbishing of existing Dams & Boreholes
Leseka, Maponya, Modiba & Vuma
Roads Mokgotse Bridge Craighead
Electricity New Connections Modiba & Leseka
Housing RDP Housed Leseka, Maponya, Modiba & Vhuma
Health Clinic Leseka
Road Tarred Road Craighead acces road
Facility Drooping Centre Mahlongwe
Education High School Leseka

35
Ward Priority
needs
Suggested
Project
Village/location Implementation
Agent
Facility Paypoint Vumeng
17 Housing RDP houses Mokgolobotho
Electricity Electrification Mokgolobotho
Water Water supply Mokgolobotho
Infrastructure Clinic Mokgolobotho
Roads Re-gravelling of internal streets
Dan & Mokgolobotho
Speed Hump Bankuna road Nkowankowa
18 Water Stand pipes Mohlava Cross, Khujwana
Borehole integration Mohlava Cross
Two (2) boreholes Khujwana
Electricity Street lights at Tar Road Mohlava Cross
Electrification of backlogs Khujwana, Mohlaba Cross
Roads Grading/Regravelling of internal streets
Khujwana, Mohlaba Cross
Grading of Sport fields Khujwana, Mohlaba Cross
Joining of tar road at Bridge way
Mohlava Cross
Tar road Khujwana – Lephephane
Drainage at Chauke Fix drainage at tar road
Mohlava Cross
Fix Donda next to tar road next to Jonathan Chicken Farm
Mohlava Cross
Fix soil covering at AFM Church
Mohlava Cross
Fix or create drainage at Balobedung Storm water at Khujwana R36 Road bridge
Mohlava Cross Letaba River
Speed humps at Tar road Mohlava Cross JB
Storm water at JB JB
Stone pitching all access roads
Mohlava Cross, Khujwana
Waste Rural Waste Project Waste bins
Mohlava Cross Khujwana
Cemetery Regraveling road to cemetery Cleaning of gaves Gate at Graveyard Numbering of garves
Mohlava Cross Khujwana
Sanitation VIP Toilets Mohlava Cross Khujwana

36
Ward Priority
needs
Suggested
Project
Village/location Implementation
Agent
Infrastructure Pay point/Hall RDP Houses Health Centre
Mohlava Cross Khujwana
Bridge Small bridge to cross to Lenyenye
Mohlava Cross
Publicity Information Board All villages
Land Dermarcation/formalization of sites
Mohlava Cross Khujwana
Fire Extinguishers
Provision of fire extinguishers
Ever househlod
19 Road Tar to grave yard & maintenance of bridge
Sanitation Maintenance sewage pipe Nkowankowa B
Road signs Installation of speed humps at Khomanani, Chivirikani,Nkateko, Tlangelane, Hoxani, Hitekani, Hitsakile & Sasavona street
Nkowankowa B
Road grill Letaba Hospital road
Robots at DCO and Letaba Cross
Nkowankowa B
Quality Road marking Nkowankowa B
Barrial line
Electricity Street light Nkowankowa Testing ground
Facilities Bus-stop Teba (Nkowankowa A)
Fire brigade/ Mobile truck at Police station
Nkowankowa
Air-condition at Nkowankowa community Hall
Nkowankowa A
Youth development
Creation of sport and recreation centre for youth
Nkowankowa B
Rehabilitation centre
Budget for sports council to facilitate sports – Especially soccer
Desk early childhood development
OVC creation so that municipality have programme for poor families
Clarification/ workshop on solid waste removal at Nkowankowa
By-Laws sound pollution Crèche that are up to standard
Nkowankowa
Road Pavement at Dudu, Bankuna, Ritavi and
Nkowankowa B
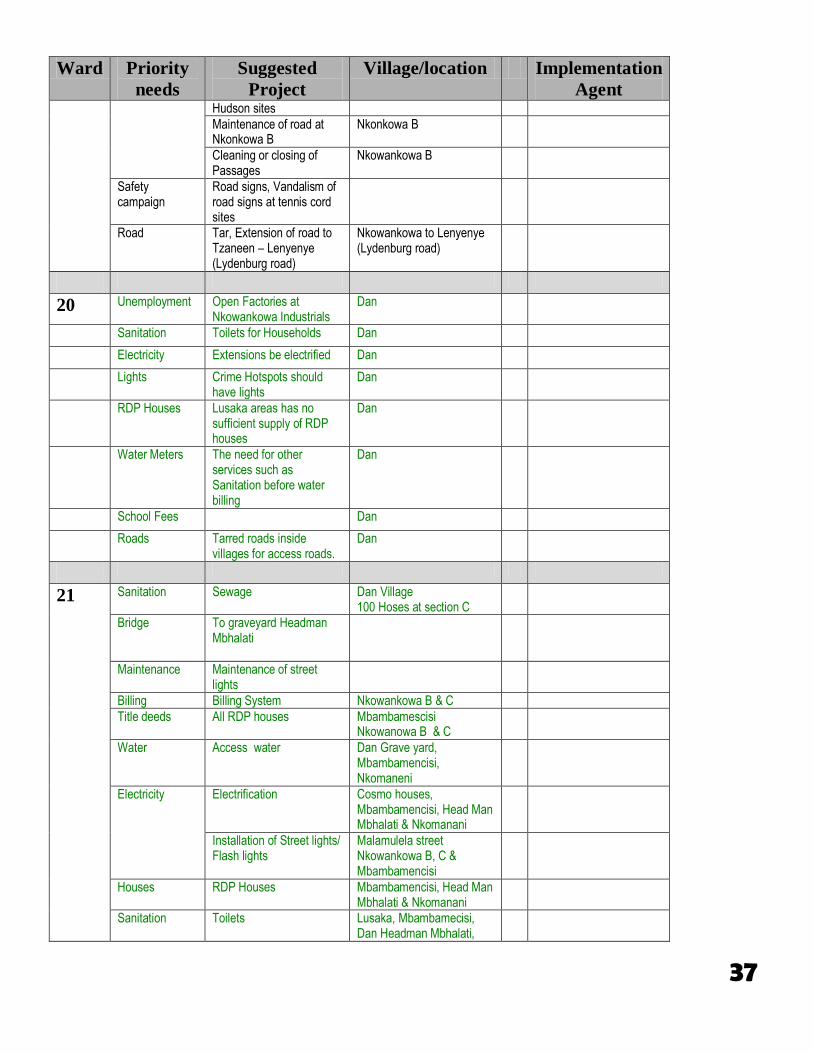
37
Ward Priority
needs
Suggested
Project
Village/location Implementation
Agent Hudson sites
Maintenance of road at Nkonkowa B
Nkonkowa B
Cleaning or closing of Passages
Nkowankowa B
Safety campaign
Road signs, Vandalism of road signs at tennis cord sites
Road Tar, Extension of road to Tzaneen – Lenyenye (Lydenburg road)
Nkowankowa to Lenyenye (Lydenburg road)
20 Unemployment Open Factories at Nkowankowa Industrials
Dan
Sanitation Toilets for Households Dan
Electricity Extensions be electrified Dan
Lights Crime Hotspots should have lights
Dan
RDP Houses Lusaka areas has no sufficient supply of RDP houses
Dan
Water Meters The need for other services such as Sanitation before water billing
Dan
School Fees Dan
Roads Tarred roads inside villages for access roads.
Dan
21 Sanitation Sewage Dan Village 100 Hoses at section C
Bridge To graveyard Headman Mbhalati
Maintenance Maintenance of street lights
Billing Billing System Nkowankowa B & C
Title deeds All RDP houses
Mbambamescisi Nkowanowa B & C
Water Access water Dan Grave yard, Mbambamencisi, Nkomaneni
Electricity Electrification Cosmo houses, Mbambamencisi, Head Man Mbhalati & Nkomanani
Installation of Street lights/ Flash lights
Malamulela street Nkowankowa B, C & Mbambamencisi
Houses RDP Houses Mbambamencisi, Head Man Mbhalati & Nkomanani
Sanitation Toilets Lusaka, Mbambamecisi, Dan Headman Mbhalati,

38
Ward Priority
needs
Suggested
Project
Village/location Implementation
Agent Nkomanani & Section C 100 units)
Roads Tar Nkowankowa B, C Mbambamecisi, Nkomanani, Dan Head Man Mbhalati, Bombeleni to One Toner & Lusaka
Re-graveling
Health center Clinic Nkowankowa C
Pay point Pay point Nkowankowa C
Community Hall Nkowankowa C, Lusaka, Head Man Mbalati
Bridge Nkomanani road next to Bright morning star
Taxi rank Nkowankowa C, Lusaka & Head Man Mbhalati
Fencing Dan Head Man Mbhalati Grave yard & Nkowankowa C Park
Street naming Nkowankowa C Maintenance Sport fields and parks
Street lights All the villages B section
School Lower Primary Mkomaneni Lusaka
Unemployment
22 Water Pipes to the reservoir should be repaired
Provide households with taps
Catchments Dam for livestock
Facilities Community Hall
Library
RDP Houses RDP
Roads Internal streets should be graded at least twice a year
Street leading to school should be tarred
Sport & Recreation
Sports Field
Sites New Residential Sites
Sanitation Toilets per household
Graveyard Fencing
23
Roads Construction of 6 speed humps
Nkowankowa-Mariveni- Berlyn road
Road signs Nkowankowa-Mariveni- Berlyn road

39
Ward Priority
needs
Suggested
Project
Village/location Implementation
Agent Upgrading of Access
roads Mariveni clinic Mariveni Primary
School Tito Mboweni
Primary School Tshamahansi
settlement All internal streets
Construction of culvert Mariveni section B next to Manocha area
Pay point Bridge Sanitation Cemetery
Pensioners pay point Mariveni
Construction of Bridge between Mariveni & xipungu
Mariveni and xipungu
Construction of VIP toilets Mariveni
Upgrading of cemetery Mariveni
Access Road Mariveni
Fencing Mariveni
Water pipe Mariveni
Toilets Mariveni
Formalization Allocation of stands Bonana section, Tshamahansi village (Letsitele)
Electricity
PHP Houses Mariveni Tshamahansi
Electrification Mariveni section D, Banana section, Tshamahansi
Water
Apollo lights Marivene Clinic Street light Letsitele – Mariveni T -
junction
Water pipes Tshamahansi village, Mariveni section D, Banana section
Facilities Community hall Mariveni
Upgrading of sport field Mariveni
Job creation Community garden Mariveni
Brick project Mariveni
Chicken farm Mariveni
Housing
24 Water All villages
Roads Upgrading and Tar
Bridge – Ben Farm Road
Road Tar road Khopo - Letsitele
Tar Tinghitsi Primary to Lydenburg Road
Road Bridge to graveyard Sasekani
Housing RDP Sasekani
Sanitation VIP Toilets

40
Ward Priority
needs
Suggested
Project
Village/location Implementation
Agent
Job Creation Information Center
Sports and recreation
25 Water Electrification of Boreholes Sedan. Bonn, Molate, Ntsako & Bordeaux
Water reticulation, extention of pipelines
Sedan. Bonn, Molate, Ntsako & Bordeaux
Electricity Electrification Sedan, Molate, Boordeaux & ext. Ntsako and Bonn
Road Tarred road Main road from Mafarana to Sedan Tar
Upgrading and Re-gravelling
From tarred Mafarana to Molate
Bridge Molate road
Cleaning of internal streets with a bull dozer (Removing stones and trees that are closing the internal streets
Especially Molati. Also Sedan. Bonn, Ntsako & Bordeaux
Cleaning of road to Graveyard
Recreation Grading of Sports Field
Cemetery Water, Sanitation, Fencing & Cleaning
Sedan. Bonn, Molate, Ntsako & Bordeaux
26 Electricity Electrification Hweetsi, Masoma
Water Maintainance of water taps
Rhulani
Jojo tanks Rhulani, Hoveni, Nsolani
Maintainance of boreholes Hoveni
New borehole Nsolane
Water Maintainance of boreholes Hoveni
Water pipes Rhulani
Road Regular grading of strets Rhulani, Hoveni, Nsolani
Water Boreholes Masoma
Jojo tanks Masoma
Infrastructure Primary School Hweetsi
Recreation Grandstand at Sport field Rhulani
Vending Station Hoveni
Cemetery Graveyard Nsolani B (Matawa)
Roads Upgrading of streets Masoma
Roads Regular Hweetsi,
Job creation Recycling project (Rural waste minimization)
Rhulani
Recreation Community Hall Masoma

41
Ward Priority
needs
Suggested
Project
Village/location Implementation
Agent
Job creation Poultry project Hweetsi
Security Palaceit fencing Rhulani
Fencing at water fall Masoma
Recreation Maintainance of sports field
Rhulane
27 Roads Street upgrading All Villages Greater Tzaneen
Municipality
Access roads and bridges
Serutlutlung via Shoromong to Sonkoane
All roads to cemeteries
Matshelapata to
Magobareng
Malekeke via
Makhubedung to Bokgaga
High School
Tarred Road
Road via Maile pay point
to sweet corner
Speed hump
Mokgobi business centre, Mogapeng fourway stop and Dr CN Phatudi main road
Electricity Electricity connections
Matshelapata, Shiluvane,
Ezekheya, Shoromone &
Maponya Primary
Water Supply
Utilization of existing
underground pipes
Mogapene, Pharare,
Shituvane &Makhubedung
Fix boreholes Mogapeng
Fix leaking water
reservoirs Pharare
Water taps at Graveyards
Makhubedung, Shiluvane ,
Shoromong and Mogapeng
Stand pipes Makhubedung
Community Hall Mogapeng
Sanitation
+ 400 households in all
villages
Shoromong, Serutlutlung,
Mogapeng
Finalize outstanding
sanitation projects All villages
Recreation Upgrading Sports fields
Makhubedung, Hezekhaye,
Pharare, Moloto FC.

42
Ward Priority
needs
Suggested
Project
Village/location Implementation
Agent
Electricity Street lights at flash points
Entrance CN Phatudi Hospital, entrance to Shiluvane Health Centre, Mogapeng four way stop, stop & Mogapeng Clinic
Electricity Apollo lights Shiluvane Health Centre
Library
Area of location to be discussed once there is budget
Housing RDP Houses Makhubedung and Pharare
Cattle dam Cattle dipping point Ntona Mantjoro Maake area
Job creation municipal projects All villages
Creche 150 Kids Pharare
28 Water Reticulation
Phephene, Mine view, Madawa
Stand pipes Phephene, Mine view, Burgersdorp, Gavaza
Water supply Burgersdorp, Gavaza, Madawa
Sanitation Toilets Phephene, Burgersdorp, Gavaza
Electricity Infrastructure and house connections
Hospital view
Roads Internal streets Phephene
Electricity Infrastructure and House connections
Mine view, Gavaza, Madawa
Street light Burgersdorp, gavaza
Water Reticulation
Stand pipes
Sanitation VIP toilets Hospital view
Roads Fourway stop or Robot Cukumetani, Gavaza and Burgersdorp intersection
Speed hump Burgersdorp
Road signs Burgersdorp
Infrastructure RDP Houses Phephene, Mine view, Hospital view
Road Re-gravelling Burgersdorp, Gavaza
Tar Gavaza
Cemetery Site demarcation Madawa
Recreation facility
Adults cultural group centre
Phephene
Roads Tar (Internal street) Mine view
Re-gravelling (Internal Street)
Mine view, Hospital view
Infrastructure RDP houses Burgersdorp, Gavaza, Madawa

43
Ward Priority
needs
Suggested
Project
Village/location Implementation
Agent
Electricity Street light Phephene
Sanitation VIP Toilets Mine view
Waste minimization
Dumping site Burgersdorp, Gavaza, Phephene, Mine view, Hospital view
Roads Re-gravelling Madawa
Infrastructure Recreation centre Burgersdorp, Gavaza
Waste minimization
Dumping site Madawa
29 Road Bridge and Tar road via Tickyline to Myakayaka
Myakayaka
Transport Bus Myakayaka
Water Fixing Illegal connection Myakayaka
Water Meter Mohlatlareng
Road Speed Humps X2 Extending Mabushe bridge and Moruleng Bridge to Lehlabine
Mohlatlareng
Electricity Streetlight to be changed to Apolo lights
Tickyline
Road Access road at the Cemetery
Mohlatlareng
30 Water Extension of water pipeline to New Rita dam/ Reservior
New rita
Water Reticulation Tickyline
Electricity Street light & Strategic lights
Tickyline, Marumofase & Nabane
Infrastructure RDP houses Marumofase, Nabane, Tickyline & New Rita
Road Culverts Box Tickyline tar road
Bridge Between Nabone and Tickyline village
Roads Upgrading of internal streets
Marumofase, Nabane, Tickyline & New Rita
Tar road to cemetery Nabane, Tickyline & New Rita
Tarring of Linkage road Marumafase, Nabane to Mogoboya tarred road
Recreation Sports complex Nabane
Upgrading of Sports Fields Tickyline & New Rita
Budget Safety and security awareness
Marumofase, nabane, Tickyline, new Rita
Health Sanitation (Toilets Nabane, Marumofase, Tickyline & New Rita

44
Ward Priority
needs
Suggested
Project
Village/location Implementation
Agent
Job Creation Resuscination of projects Nabane Garderm, Ramalema Environmental Projects
31 Cemetery New Cemetery Lenyenye
Electricity Electrification house
connections
Kuwait 2
Street light Lenyenye
Sanitation Sewer connection (RDP
section Lenyenye)
And at Cemetery
Lenyenye
Formalization Formalization of Kuwait settlement
Lenyenye
Housing Completion of RDP and Toilets
Lenyenye
Pipe Completion of Pipeline Lenyenye
Recreation facility
Completion of the stadium Lenyenye
Facility Library Lenyenye
Road Speed humps Lenyenye
Training Training of Contractors Lenyenye
Roads Robots Bendzulani & Maake Plaza intersections
Roads Re-graveling
Facility Play grounds
32 Water Access to water Moime, Mokomotsi, Khujwana& Topanana
Electricity House connections Moime, Mokomotsi, Khujwana& Topanana
Roads Upgrading of Street Moime, Mokomotsi, Khujwana& Topanana
Housing RDP Houses Moime, Mokomotsi, Khujwana& Topanana
Recreation Upgrading of sports field Moime, Mokomotsi, Khujwana& Topanana
Roads Tarred road Mokomotsi to Serare
Tarred road Lenyenye to Khujwana
Tarred road Lephepane to Khujwana
Sanitation Toilets Moime, Mokomotsi, Khujwana& Topanana
Electricity Street light Moime & Khujwana
Facilities Community Hall Moime

45
Ward Priority
needs
Suggested
Project
Village/location Implementation
Agent
Facilities Taxi Rank Moime
Graveyard Fencing new graveyard Moime
Extension of old grave yard
Moime & Topanama
Upgrading of road to graveyard
Moime, Mokomotsi, Khujwana& Topanana
33 Electricity Electrification for households
Maphala, Serare majakaneng ( All villages)
Apollo lights Mamogola 4, Dipatseng 4, serare majakaneng 2, mogabje 5 & Between Maake clinic & Marorwane care.
Water/ Sanitation
Drainage Serare
Reservoir Serare majakaneng and Dipatseng
Road Tar Leolo to Maake road, Ga-Mawasha to Majakaneng
Building internal street Leolo (All villages)
Access road Mmaphala Bar Lounge, to Mothopong, Ga-Mawasha to Majakanaeng, Dipatseng to Mmadipudi
Grading internal street Ga-matlala, Mamogola, Dipatseng, Serare mmaphala, Ga-Rakoma & Mothopong, Tsidinko. (All villages)
Re-gravelling Serare majakaneng,Mogabje & Bessie Maake
Road maintenance Ga-Mawasha to Mothopong & Semana to Ga-Rasebethele
Speed hump Between Mmaphala & Mogoboya offices, Mothopong, Ga-Koki Mauritius Bar, Ike‟s Bar & Ga-Mawasha.
Housing RDP houses Mmaphala, Rakoma, Mothopong, Ga-Ramoraga, Leolo, Ga-Matlala, ma-mogola, Dipatseng, Serare Majakaneng & Mogabje.(All Villages)
Bridge Bridge Sape Thabina road & Ngwabu bridge next to Maake offices
Calvert bridge Mamogola 4, Dipatseng 4, Between Maake clinic Marorwane care, Serare 2,

46
Ward Priority
needs
Suggested
Project
Village/location Implementation
Agent Majakaneng, Mogabje, Rakoma, Maphala
Safety & Security
Satellite police station Bokgaga
Education Crèche Mmaphala, Lebaleng Mphame, Mogabe, Tsidinko
Recreation Community Hall Ga-Rakoma, Marorwane
Sports Ground Mamogola, Silver Stone ground & Bessie Maake
34 Road Main Road Lephepane to Lydenburg Road and Rasebelane to Lydenburg
Khopo Civic Raselane
Water Households Lephepane
Electricity Households Electricity Khopo Civic
Sanitation Toilets Lephepane
Water Street Pipes Khopo Civic
Sanitation Toilets Khopo Civic
Housing RDP Khopo Civic
6.2.2. COMMUNITY BASED PLANNING (CBP) During the development of the ward plans during the Community Based Planning process at the end of 2003 and beginning of 2004, proposals were made for projects to be submitted to the IDP. These proposals will have to be considered during the 2005/2006 and 2006/2007 financial year. 6.2.2.1 Introduction Information baseline gathering processes was conducted with all four clusters focusing on the common outcome that has developed during 2004 CBP roll out and the outcome reads as follows: Increases income Improved education and skills development Reduction of HIV/ AIDS and other diseases Basic services and infrastructure for the quality of life (water, electricity, shelter, bridges and roads) Improved health and nutrition Crime free area
6.2.2.2 Objectives of baseline information gathering process The baseline information gathering process was aimed at: Conduct situational analysis with regard to new ward demarcation. Profile all the wards within the Municipality 6.2.2.3 Approach

47
All stakeholders were engaged during the process for information gathering whereby questioners were developed with reference to the ward committee portfolios and it reads as follows: Water, Sanitation and Health Electricity Roads and transport Land and housing Safety and security Local economic and tourism Sports, education art and culture 6.2.2.4 Outcome of the roll out of CBP/IDP Baseline information gathering All clustered has tried to rollout the plan, however some of the wards are still outstanding and the status quo of the clusters who has managed as per cluster reads as follows: Table 12: Proposed projects from CBP
Clusters Ward managed to implement CBP /IDP baseline information
Outstanding ward
Outstanding villages
Comments
Runnymede Ward 02,03,04,05,06,12 & 13 None Lekgwareng under ward 02
The councillor alluded that stakeholders were invited ,however they didn‟t honour the invitation ,
Bulamahlo All wards has managed implement CBP /IDP baseline information
None None The cluster was cooperative enough
Lesedi Ward 16,17,18,19,20,21,23,24 Ward 31 None The cluster was cooperative enough
Relela Ward 11,09 and 01 Ward 14,15,07, 08and 10
None The cluster was not cooperative and even the cluster meeting didn‟t materialized
6.2.2.5 Constraints The interim team that has been delegated to coordinate the CBP program would like to outline constrains in making sure that this program is running Delays of rolling out of CBP /IDP baseline information gathering process more specially from the ward
councillors Shortage of staff members ( since there is no specific people appointed for the program) Lack of committed budget for running of the program Shortage of resources (e.g. computer and access to net work since Nkowankowa offices has challenge with
phones whereby at around 11:00 the phones are not working and the computers are always shutting down while
typing information
6.2.2.6 Lessons learned
Lesson learned during the roll-out plan of the CBP/IDP baseline information gathering are: Most of rural villages have potential for paying service rendered to their community. Community members are expecting municipality to render services as per their priorities. Community has more information that can assist Municipality in coming up with proper planning with regards to
backlog of service delivery.
48
6.2.2.7 Recommendations We would like to recommend that the management has to consider the CBP program as the tool that are leading into proper planning in making sure that they render service in an effective and efficient way and the sense of ownership . Furthermore we should strive to make sure that we follow the legislative requirement since the legislative that are governing the Municipality requires engaging community in taking decision for their own development. The aforementioned Analysis, Community Perspectives and CBP submissions were considered, but due to the lack of capital funding, not many could be addressed during the development of the Strategies and Projects in Phases 2 and 3 which follows below.
6.3 PRIORITY ISSUES FROM FROM A MUNICIPAL PERSPECTIVE
6.3.1 WATER & SANITATION
Mopani District Municipality has been assigned as the Water Services Authority. A service level agreement has been entered into with the District Municipality whereby the service is being rendered by Greater Tzaneen Municipality on behalf of Mopani District Municipality.
The two Water Schemes currently being in operation are the Tours Scheme which serves 22 villages with a population of 55 244 people of which 17 558 (31,78%) people receives RDP standard water services, the capacity of the bulk purification plant is 2,3Ml – 4,6 Ml. The Thapane Scheme which serves 22 villages with a population of 56 392 people of which 16 917 (30%) receive RDP standard water services, the capacity of the bulk purification plant is 2,9M/L and will be increased to 4,1 M/L by the end of the 2006/2007 financial year. All the Post Offices in the area receive water services with the exception of that of Mosorone. All the Government clinics receive sanitation service with the exception of those at Mogoboya, Bakgaga, Dr C N Phatudi, Masoma (Zanghoma), Mariveni, Morutji, Ooghoek, Gamokgwathi Block 11, Mmadumane, Morapalala and Senopela. All the clinics with the exception of those at Moime, Masoma (Zanghoma), Mamitwa Clinic, Nyavana, Makhube and Mmadumane receive water services. 6.3.1.1 CURRENT STATUS AND TARGETS FOR 2007/2008 The current water loss in the GTM area is 25%, but the target is that, provided that funds are made available, that it be reduced to 15 %. The total percentage of households with access to basic water services is 85% and sanitation only 13 %. There are approximately 8 700 unmetered water connections and the target is to reduce that to 4 200. There are about 11 300 metered water connections and the target is to increase that to 15 800 by means of bulk water supply and reticulation at Ritavi 1, Thabina, Ritavi 2, construction of the Pitsi dam as well as to provide water to the Mariveni area from Letsitele. There are 60 600 standpipes which gives access to water within 200 m to households and the target is to increase that to 63 600. There are 13 400 people with no access to basic water and the target is to reduce it to 10 400. There are 11 300 households with water borne sewerage and the target is to increase that to 11550 whereby 250 additional household in the Ritavi 1, Thabina, Ritavi 2 areas will be provided with water borne sewerage through a Sanitation project by Mopani District Municipality. The following upgrading is planned for water services: Upgrade and replace 3850 m water lines. Upgrade water plant to its original status of 9, 8 Ml; replace 6 pumps and 4 valves, refurbished clarifier. Acquire 3 water trailers, power equipment, cutting equipment and threading equipment. Ensure water is purified according to national standards. To repair 20 boreholes that is not functioning.

49
The following refurbishment projects are currently being completed for 2007/2008.
THABINA WATER TREAMENT WORKS
Refurbish operators, housing, improving lights and renovation of the water treatment works. MOGOBOYA, MAKHUBIDUNG AND MAAKE RUMP STATIONS
Refurbish pump stations: repairs the lights, palisade fencing and painting. LENYENYE PONDS
Security fencing for the ponds to protect local residents. TOURS WATER TREATMENT WORKS
Refurbish operators, housing, improving lights and renovation of the water treatment works. BOREHOLES
Rehabilitation of boreholes including vandalized boreholes and provision of concrete pump house to curb theft and vandalism.
ADDITIONAL DEVELOPMENTS USING MOPANI DISTRICT MUNICIPALITY‟S OPERATION AND MAINTENANCE FUNDS 2007/2008 (DWAF satellite office Ritavi)
THAPANE SCHEME
Construction of 4 x four roomed Operator‟s houses.
Installation of standby generator.
Pallisade fencing.
Upgrading of Thapane water reticulation and standpipes.
Addressing Thapane water reticulation wash aways.
Construction of JoJo Tanks at Mopye and Seopeng.
Water works paving. NKAMBAKO SCHEME
Upgrading of water sand filters.
Construction of recovery water supply back to the raw water storage dam.
Upgrading of water works butter fly valves and control gate valve at the plant.
Pallisade facing.
Erection of stronghold raw water anti vandalism structures.
Building of 4 x four roomed Operator‟s houses.
Upgrading of telemetric system.
Upgrading of boreholes at Shihoko, Mookgo, Runnymede, Block 7, Nkambako, Block 6. NKOWANKOWA SCHEME
Renovation and upgrading of Operator‟s houses.
Upgrading of inlet pipeline, reservoir outlet and overflow at Dan reservoir.
Pallisade at Co-op booster pump.
Upgrading of Co-op booster pump.
Upgrading of rising main from Dan reservoir on the manholes, air valves and control gate valves.

50
Pallisade fencing at Mhlaba Cross booster pump, Sasekani booster pump and Khujwana booster pump.
Installation of electrical stand by generators. THABINA SCHEME
Installation of electrical standby generators.
Upgrading of pressure break tanks at Moime and pressure demand valve station with a by-pass to Lenyenye water shortage.
Upgrading of manholes for air valves and control gate valve. TOURS SCHEME
Upgrading of water sand filters and nozzles.
Upgrading of water works butter fly valves.
Upgrading of manholes, air valves and control gate valves at the rising main pipeline.
Refurbishment of vandalized boreholes. LENYENYE
Wire fencing.
Biocatalyst dosing system. NKOWANKOWA SEWAGE WORKS
Upgrading of bio-filters and purification system.
Scooping of ponds.
Construction of bio-catalyst dosing system.
Scooping of Shiluvane ponds.
Scooping of Maake Fet College ponds.
Pallisade fencing at Shiluvane ponds and Maake FET ponds. TZANEEN SATELITE OFFICE
Renovation of offices
Upgrading and renovation of conference hall.
Paving the satellite office yard.
Upgrading of parking facilities (car-port) 6.3.1.2 FREE BASIC WATER Before Greater Tzaneen Municipality could implement the free basic water policy, it must be in line with the water service authority‟s policy which will be approved shortly. The basic principle around the WSA’s policy is free basic water to the poorest of the poor (Income level beneath R1 100 per month). The biggest challenge around free basic water is that there must be a management system in place.
Four sanitation systems are in operation within the Greater Tzaneen Municipal area, these being:
Water-borne sewer (Tzaneen, Nkowankowa and Lenyenye)
Septic Tanks and French Drains (Haenertsburg)
Septic Tanks (Letsitele) and
Pit Latrines and VIP‟s (all rural villages)

51
The Tzaneen and Nkowankowa plants are under-capacitated, in that current capacities are 2,87Ml and 4,5 Ml per day, while dry-weather effluent is 4 Ml and 7Ml per day, and ideal capacities are 8Ml and 12Ml per day respectively (to accommodate projected increase in flow till 2011) The Lenyenye plant also requires upgrading and capacity problems are foreseen once the water shortage problems are attended to. To implement the above, upgrading would cost the following:
Tzaneen - R4,1 m
Nkowankowa - R14 m
Lenyenye - R4 m
Pit Latrines are most commonly in use in the rural areas. RDP standards dictate that VIP‟s are a minimum requirement. The Department of Engineering Services estimates that 23 100 new VIP‟s are needed (at a cost of R49m) while 46 500 existing pit latrines have to be upgraded to VIP (at a cost of R69, 75 m) to comply with minimum RDP standards. (Source: Municipal Data Base). It is imperative that a sanitation program be formulated and be implemented whereby the situation of numerous households having no sanitation facility is addressed. To this end it is important that more detailed information in respect of geotechnical and geohydrological conditions is gathered especially in areas of dense population concentration. Mopani District Municipality contracted “In Touch” Consulting Company to build 43 VIP units in the following villages:
Mokgolobotho
Tickyline
Mmaphala
Mogapeng
Mahwibidung
Matipane
Mothomeng
Lephepane
Petanenge
Mandlakazi
Radoo
Vallambrosa A cost of R464 000 in total for 516 units. At this rate we are covering 0, 74% per annum. Through the Department of Local Government and Housing we are covering 1 200 units at 1, 72% per annum, an overall 2, 46% per annum. With the implementation of projects the Engineering Services Department strive to reach 50% youth and 50% adults of whom 30% of the total should be women.
6.3.2 ROADS AND STORM WATER
Provincial and District link roads within the municipal area are in a general good condition. Some access gravel roads, ± 20%, to villages and internal streets within villages are problematic. Storm water management is closely linked to the condition and state of roads and streets and is influenced by settlements that developed in topographically steep areas. Table 29: Road infrastructure
TYPE OF ROAD LENGTH MAINTENACE COST AND TYPE
Tarred 161 km Fog spray, reseal @R890 000/ km

52
Gravel (except link roads) 2 064 km R105 000.00/ KM
Gravel R293 towns 60 km R105 000.00/ KM
Grading of gravel roads R19500.00/ KM
Regravelling of roads every 5 yrs R92,547 m every 5 yrs Preventative maintenance – R4.855m annually
The estimated time to rectify the current backlog on gravel roads in the GTM area, if no external funding can be obtained, will be 10.7 years for regravelling of roads and 65 years to regravel all the roads. The backlogs to introduce labour intensive methods of storm water management, similar to the GUNDO LASHU project introduced by RAL, are R 10 848 000.00. With the current funds available for rural storm water the time to rectify the current backlog will be 9 years. 6.3.2.1 Education of Communities Communities must be educated through their ward councilors and ward committees about the maintenance on streets and storm water. They must be informed that the cost to construct 1 km of tar road 6m wide is estimated at R 1 080 000.00. For this reason it is important to do maintenance on tar roads and storm water systems in order to protect this asset. Breaking of bottles in streets is not only dangerous to pedestrians and motorists, but increase the maintenance costs as minor defects become major defects if water penetrate the seal and damage the base of the road. Disposal of garden or other refuge in storm water systems causes blockages and lead to flooding of streets and houses during heavy down pours. The maintenance of blocked storm water systems is very costly and sometimes impossible to such an extent that pipes must be completely replaced. The actions mentioned above can cause serious injury and health problems as broken bottles can do bodily harm and blocked storm water systems together with refuge can lead to water contamination. 6.3.2.2 Hierarchy of Roads in Greater Tzaneen Municipality: The former NPRA, now called ROAD AGENCY LIMPOPO (RAL), proposed the redefining of roads in the Limpopo Province as follows: NATIONAL ROADS - 63km (Responsibility of SANRA) P 43/3 – Modjadjiskloof, Tzaneen to Gravelotte. PROVINCIAL ROADS – 254km (Responsibility of RAL) P 17/3 – Tzaneen, Rita, Leydsdorp to Gravelotte P 181/1 – Ofcolaco to Hoedspruit Lydenburg T junction D 673 – Craighead Estates, Letsitele Valley to Tarentaal. D 1293 – Tarentaalrand to Constantia Giyani T Junction. D 1267 – Constantia road to Giyani. P 43/3 – Letsitele to Eiland. D 3198 – Senakwe to Miragoma. D3247 – Nwamitwa, Babanana, Jopi to Mookgo 7. D 3187 Ga-Wale, Lekgwareng to Dzumeri. DISTRICT ROADS – 868km (Responsibility of Mopani District Municipality) All other link roads between and through villages

53
MUNICIPAL ROADS AND STREETS – 2064km (Responsibility of GTM) All roads and streets in towns and villages that give access to households, businesses and industries. The redefining of the above mentioned roads are expected to be finalized in the current Municipal financial year. 6.3.2.3Role Players and Stake Holders The different role players concerning roads and streets in the Greater Tzaneen Municipal area are as follows: RAL Mopani District Municipality Greater Tzaneen Municipality Road and Transport Committee Ward Councilor‟s Ward Committee‟s Residents of GTM SANRA 6.3.2.4 Why the Backlog Maintenance on Gravel Roads? In formal towns, when the township is established, stands are sold; the owner pays in advance for all the services including the tar road still to be built. The revenue for maintenance for these services is generated through the cost recovery system which includes land tax. In informal settlements and villages the process above is not followed and Council does not have sufficient revenue to do maintenance. 6.3.2.5 Provincial and Districts roads During a workshop with the Road Agency Limpopo it was indicated that they are planning the following upgrading from gravel to surface in the Greater Tzaneen Municipal area: Table 30: Upgrading of roads in GTM
PROV./ DISTRICT ROAD
TERM ROAD PARTICULARS LENGTH km
COST ESTIMATE
REASON FOR PRIORITISTION
Provincial 0 – 5 yrs
Modjadji-Mokwakwaila-Bambeni-Nkoma. ADT (Annual Daily Traffic) of 2000 varies from 698 to 295. Serves a large number of communities for work and shopping. Very busy road.
56 R111,000,000 This road supports the Spatial Development Rational and Tourism at Modjadji (Modjadji Nature Reserve and other places of interest). It links to the Phalaborwa SDI. There will be huge economic savings in vehicle operating costs and traveling time since the road carries high traffic volume. It serves a large number of villages, more that 36 villages. This will contribute to good health of these communities. The road has become impossible to maintain since it demands very short intervals of maintenance.
Provincial 0 – 5 yrs
Letsitele-Eiland-Letaba Ranch. Serves farming communities and a number of villages. It also serves tourism areas of Eiland, Letaba Ranch and Kruger National Park
27 R73,000,000 This road supports tourism and farming. It serves some villages along it (more that 6 villages)
Provincial 0 – 5 yrs
Burgersdorp-Gravelotte. Connects farming communities, villages and towns. It connects small scale mining.
27 R53,000,000 This road supports the SDR, SDI in the province.

54
6.3.3 BUILDING AND MAINTENANCE
The Division is responsible for the building control, building maintenance, housing PHP and fleet Management. 6.3.3.1 CHALLENGES a. Building Control
Illegal construction activities
Non compliance to building regulations
b. Building Maintenance
In adequate budget to meet targets
Lack of skills on tradesman
c. Housing and PHP
Inspection of RDP houses
Insufficient budget to cover the inspections for the whole GTM
No signing authority on claims by developers on RDP houses
District 0 – 5 Yrs
Lenyenye-Thabina-Mogoboya-Khujwana-Mohlaba (P17/3). Serves more than 10 villages. ADT not up to date, but the road is busy. This is a ring road used by busses and taxis for commuting to work, etc.
18 R36,000,000 The road is problematic and a danger to the communities. It is the only road which if it rains the communities are cut-off. It is the route used for commuting to work and to towns. It is therefore economically important since it forms part of the sustenance of the communities in that area. The ADT is 639 which are more that the 500 ADT required for a road to be considered for tarring. Once traffic volume is in the region of 500, vehicle operating costs become uneconomical for gravel road. The road serves a large number of communities (more than 12 villages directly on this road), towns of Lenyenye, Nkowankowa and Tzaneen. It serves nature reserve of Thabina (Wolkberg). It also serves hospital of CN Phatudi, Shiluvane and Lenyenye.
District 0 – 5 yrs
Deerpark-Moruj (Kubjana-Madumane). ADT = 1008. Serves many villages. Slippery when wet, difficult to maintain due to high traffic volume and is rocky. Went on tender twice but could not be awarded due to budget cuts.
19 R38,000,000 This road supports the SDR and Tourism at Modjadji (Modjadji Nature Reserve and other places of interest). It links to the Phalaborwa SDI. There will be huge economic savings in vehicle operating costs and traveling time since the road carries high traffic volume (1008 vehicles per day). It serves a large number of villages, so densely populated that it is a road through a built-up area. This will contribute to good health of these communities. The road has become impossible to maintain since it demands very short intervals of maintenance work. Tarring will improve on the safety of motorists and pedestrians. Gravel depletion and unavailability is also a problem.
Provincial 6 – 15 yrs
Motshinyadi to Dzumeri to GaMokgwathi to Ga-Wale to Xihoko to Runnymede to Mavele
79 R158,000,000 It provides accessibility and improves mobility.
Provincial 6 - 15 yrs
Mavele to N‟wajaheni 9 R18,000,000 It provides accessibility and improves mobility.

55
d. Mechanical Workshop
The age of the vehicles
No capital provision to replace old vehicles.
Honey sucker truck as old as 1982
6.3.3.2 INTERVENTIONS
Additional building inspector has been appointed to assist with inspection.
Fixed trading kilometers for inspections to be renewed.
Interaction with DLG&H to give GTM signing powers on claims by developers.
Capital provision should be made to replace old trucks for 1009/2010.
Additional three water tankers to be bought to meet challenges of water provision.
Interactions with DLG&H to allocate more PHP units for 2009/2010.
6.3.4. ELECTRICITY
18.1 Distribution Area The Greater Tzaneen Municipality currently distributes, under License, to an area approximately 3500 km² in extent. The distribution area does not correspond with Councils Municipal jurisdiction area. The two main areas of difference is the general areas of Nkowankowa, Lenyenye and Southern most areas, which are serviced by Eskom, but fall within the Tzaneen Municipal area. The Municipality has bulk supply points to these areas at Nkowankowa and Lenyenye T-Off. The second general area of difference is that of Letsitele (farming area), Eiland and Gravelotte, which forms part of the Ba-Phalaborwa Municipality, but has electricity supplied to it by the Greater Tzaneen Municipality. GTM has also bulk supply points to Eskom‟s licensed distribution area at Spitzkop (Segwashe – Polokwane Municipality) and Three (3) at Selwane (Ba-Phalaborwa Municipality). Greater Tzaneen Municipality: Status Quo Survey Report; 2003
18.2 Network Components
Bulk intake (132-kV/66-kV)
Main substations (66-kV/33-kV/11-kV)
Distribution substations (33-kV/11-kV)
Main distribution lines (66-kV, 33-kV and 11-kV, total length 1890 km)
Cable network in towns (11-kV, total length 133 km)
18.3 Future Developments The implementation of the REDS (Regional Electricity Distributors) is fast approaching finality. The holding company has been established and it is predicted that 2007 will see full implementation of the REDS. Nationally REDS is still on target with RED 6 day 1 earmarked for March 2009. Funding to update the ringfencing has been received. A detailed asset register has been completed and a section 78 process will be followed once the ring fencing process has been completed. The impact that the REDS to the community will be that it is aimed at addressing the following current problems: Current industry structure is highly inefficient owing to fragmentation Inadequate maintenance of networks Inability to supply electricity to the indigent Unequal treatment of consumers across the country
56
Significant disparities in tariffs Absence of economies of scale in respect of investing in assets, sharing facilities, services, regulation, human
development Limited opportunity to introduce competition regarding tariff Service quality
18.4 Capacity Constraints A combination of phenomenal growth and insufficient capital reinvestment has culminated in the entire Tzaneen distribution area not having sufficient electrical capacity to allow any further growth. This is a major concern for Council and consequently applications for funding to the tune of R100 million (for Tzaneen capacity), R150 million (for Tzaneen and other 4 towns capacity)) and R420 million (infrastructure and capacity, total area) has been applied to from various government departments during the first part of 2007. Unfortunately, no positive reaction has been received to date. 18.5 DISTRIBUTION SYSTEM STATUS 18.5.1 Overhead Powerlines In order to address the neglected state of the system and the future maintenance of the system, distinction has been made between the two main aspects of remedying the situation. Addressing backlogs – This entails either the refurbishing or total rebuilding of overhead lines, which are regarded as severely neglected. The following is applicable:
Lines rebuilt = 170-km Lines Refurbished = 146-km
Remaining Backlog = 380-km Remaining Backlog = 154-km
18.5.2 SYSTEM CAPACITY 18.5.2.1 Main distribution substations Also historically neglected, the system capacity also needs urgent addressing as certain substations are already overloaded. During the next three years the following substations are going to be attended to:
Pusela Substation (New 2 MVA substation)
Agatha (New 2 MVA substation),
Riverside (Autorclosers and Capacitor Banks)
Letsitele Town (New 2-MVA substation)
18.5.3 Temporary Relief Refurbishment (2 x 5 MVA transformer) R 983 830.00 Temporary Supply – Adams Farm R1 417 500.00 Temporary Supply – Aqua Park R1 667 400.00 Reommission – Van Velden R 38 500.00 TOTAL R4 107 580.00 18.5.4 Lighting Requirements The need for new lighting is identified from time to time and addressed within financial constraints. There is currently a
backlog of around 924 streetlights in Nkowankowa ( 39% backlog), Strategic places were identified for the placing of lights to combat crime and for safety. Stadium lights are identified for Lenyenye stadium.

57
18.6 Electrification
18.6.1 VILLAGES, SCHOOLS, CLINICS
The backlog in electrical connections on stands is estimated at 42 213 which is 30% of the total stands in the municipality. 18 Secondary schools, 39 primary schools, 51 crèches and 5 clinics within the municipality are not electrified. 16 vending stations within Eskom‟s distribution areas service the pre-payment consumers in the municipality. A list of villages and connection backlogs of stands, schools, and crèches and health facilities is attached. The stakeholders participating in the prioritization and implementation of electrification projects include Local Councilors, Electrical Department (GTM), Eskom, The Department of Minerals and Energy and the Department of Local Government and Housing. 18.6.2 FARM LABOUR HOUSING Farm Labour housing projects were initiated in 2004/2005 financial year, funded by the Department of Minerals and Energy. The Municipality is responsible for the management of the programme as well as the design and the implementation of electrification projects. All financial systems must comply with the conditions as contemplated in section 38 of the PFMA. Up to 2007/2008 financial year 2671 house connections and 17 schools were electrified. The allocated contract value was R10.6 million. The current backlog is estimated at ± 900 house connections. Organized agriculture has been approached to provide statistics on the extent of the electrification need in farm labour housing. 18.7 System Performance 18.7.1 METERING A total number of 34 substations (33-kV / 11-kV substations) need 34-kV metering. We currently have 30 metering units and a backlog of 4 metering units.
18.7.2 SYSTEM PROTECTION We currently have around 100 auto reclosers in the system. The need for autoreclosers is done on an ongoing basis with changes in the system configuration.
18.7.3 MAIN RINGS The building of main rings is necessary to enable the department to minimize the number of consumers without power during outages or maintenance and also to allow the shifting of loads when networks become overloaded due to seasonal or other reasons. This is done on an ongoing basis. 18.7.4 MANAGEMENT INFORMATION SYSTEM Council is currently addressing the implementation of a MIS and it is hoped that implementation will be short term rather than long term. Adherence to National Electricity Regulator‟s annual statistical reports also supports the urgent need for information management regarding the quality of supply and quality of service to consumers.

58
18.8 New Developments 18.8.1 RESIDENTIAL ERVEN New erven are reticulated as the need is identified. 18.8.2 BUSINESSES / FARMING / DOMESTIC Council currently subsidizes all new connections by 50% in an attempt to stimulate economic development and growth. 18.9 CRISIS REPORT – ELECTRICAL DEPARTMENT REPORT ON THE OVERALL STATUS OF THE ELECTRICAL DISTRIBUTION SYSTEM AND SUBSEQUENT FINANCIAL IMPLICATIONS 18.9.1 EXECUTIVE SUMMARY Tzaneen as a Town is currently experiencing a massive 333% growth in residential units. This trend is mirrored in the surrounding GTM Towns and farming areas, an occurrence which clearly defines the investor and developer confidence as extremely positive, whilst Tzaneen Municipality is often praised and highlighted as a leader and example of a South African success story. The phenomenal growth and expansion coupled with the unfortunate occurrence of our predecessors to insufficiently financially invest in the maintenance and expansion of our distribution system has placed us in a crisis situation. This report details the more pertinent and urgent issues to be addressed in order for Tzaneen to not only maintain its current good standing and status as preferred development area, but to also ensure that the Greater Tzaneen Municipality is able to cope with the even higher projected growth. It should be noted that details and costs mentioned in the report may vary slightly once planning and implementation phases are initiated. As food for thought and for the sake of adding some perspective, it needs to be noted that the Tzaneen electrical distribution system is not only one of the most expansive (3500 square kilometers) in the country, but our electrical loading compares to that of Polokwane! The maximum demand metered for Tzaneen during the month of November 2006 was 93.5 MVA, whilst Polokwane registered just over 100 MVA during the corresponding period. Comparing the electrical budgets of the two electrical departments will indicate the severe and unrealistic financial challenges faced by the Greater Tzaneen Municipality and will clarify just how the Electrical Department found itself in this crisis. Serious financial intervention into the electrical infrastructure is required to ensure that the Tzaneen area retains its position as preferred and prime development area. Short term funding of R172 839 066.00 and Long term funding of R251 340 000.00 will not only resolve the crisis facing Tzaneen‟s Electrical Department, it will also place us in an ideal position to meet the future demands of the Developers whom are flocking to Tzaneen because of the beauty of the area, the friendliness of our people, the strength of our Municipality and the drive and pride of its officials to excel. The current replacement value of the Electrical Department and related equipment is around R700 million, and even at the minimum NERSA or EDI reinvestment benchmarks it is obvious that the upliftment of the Electrical infrastructure is well beyond the financial capability of the Council with external intervention being the only way forward. It needs to be noted that as far as personnel capacity, drive, commitment and passion is concerned, the GTM has overflowing resources

59
18.9.2 RURAL 18.9.2.1 INTRODUCTION The report covers the 66 kV, 33 kV and 11 kV rural distribution lines, including all equipment and accessories in the system. All power installations of voltages lower than 11 kV are not included in the report. The report details the current mechanical condition of the network, projected lifespan and recommendations on measures to restore the system to an acceptable level. The report was compiled using the following sources of information.
Previous reports of state of network
Sampling of selected lines to gain an overall idea of the state of the lines in the area
Discussions with Supervisors and Electricians working in the areas.
Perusal of fault reports to identify problem areas
Master plan studies
Reports and complaints from consumers via the various forums.
18.9.2.2 GENERAL INFORMATION
The Greater Tzaneen Municipality is one of the largest non-Eskom distributors (in terms of distribution area size) of electricity in the country. Electricity is currently being distributed to areas including Letaba Ranch, Eiland, Waterbok, Gravelotte, Letsitele, Letaba, Deerpark, Tzaneen, Haenertsburg, Politsi, Magoebaskloof and bulk supplies to Nkowankowa, Lenyenye, whilst all the in between farming areas are also part of the distribution area. Income from the electricity supply to the above areas amounts to almost 68% of the total Council‟s operating income. The Council‟s bulk electricity supply from Eskom with a firm capacity of 120 MVA, is supplied through 3 x 60 MVA, 132/66 kV transformers at Tarentaalrand substation. Five other main substations (66/33 kV and 66/11 kV) comprising of the Tarentaalrand T-off, Letsitele, Tzaneen, Rubbervale and Letsitele Valley serve as main distribution substations. The main distribution network (66 kV primary) consists of the following:
3 x 60 MVA, 132/66 kV transformers with outdoor switchgear at Tarentaalrand substation which is the main bulk intake point from Eskom.
2 x 10 MVA and 2 x 5 MVA, 66/33 kV transformers with outdoor switchgear at Letsitele substation.
2 x 15 MVA and 1 x 10 MVA, 66/11 kV transformers with indoor switchgear at Tzaneen substation. (Town feed)
3 x 10 MVA, 66/33 kV transformers with indoor switchgear at Tzaneen substation (Rural feed)
1 x 5 MVA, 66/11 kV transformer with outdoor switchgear at Letsitele Valley.
1 x 10 MVA, 66/33 kV transformer with outdoor switchgear at Rubbervale Substation.
2 x 1.6 MVA, 66/11 kV transformers with outdoor switchgear at Tarentaalrand T-off Switchyard.
The 33/11 kV network consists of 39 transformers with a total capacity of 58.5 MVA. The rest of the network is 33/11 kV and 11/0.400 kV which forms a bulk of end-use consumer points. 18.9.2.2 THE CRISIS
Below are some facts and figures that will demonstrate just how close the distribution system is to total collapse: Along with a sudden and pronounced increase in demand due to surging development, the Electrical Department has recently experienced increased power outages and customer complaints due to various reasons regarding continuous power supply and the quality of that supply. Measures were implemented to log customer complaints and power outages to determine the extent of the problem. Instructions were also given to “Maintenance” personnel to report on the state of the system. It transpired from the findings that the system has deteriorated to unacceptable levels which will ultimately cause the total and imminent collapse of some parts of the network, unless drastic and immediate intervention

60
is not undertaken. There are also increased incidences of lines falling to the ground during storms because of old and rotten poles. The implications of these problems are the;
i. Potential negative impact on development.
ii. Loss of revenue due to unnecessary power outages.
iii. Possible sanctions by the NER for non-compliance.
iv. Dissatisfied customers.
v. Increased power losses in the system.
vi. Increased maintenance costs and overheads
vii. De-motivated and overworked employees due to recurring breakdowns and overtimes.
viii. Increased wages caused by unplanned overtime due to recurring breakdowns.
ix. Unsafe conditions for both public and private property (fires, electrocution, etc.)
The following salient factors also need to be highlighted:
a. Some parts of the network (+- 50%) exceed the end of their projected lifespan. Indicators are the rotten poles and
breaking of overhead conductors due to aging. It should also be noted that rotten poles are the main cause of the need to
rebuild lines.
b. Sometime ago a decision was made in the Electrical Department that all „old technology‟ steel earth wires used
as conductors should be replaced by 0.05” ACSR (aluminium conductor steel reinforced) conductor. The reason for is
that the steel wire is old and breaks easily as it has become brittle with aging and overload. The steel lines also breaks
easily if a tree falls on the line during storms, a common event especially during the rainy season. The length of steel line
in the system is estimated at +- 30% of the total length in the 11 kV network.
c. The rural section employees spend most of their time attending to consumer complaints and faults on the network. As a
consequence preventative maintenance is seldom or not satisfactorily performed.
d. Due to the number of breakdowns on the system, overtime hours for the section are on the increase.
e. A high percentage of existing auto reclosers (+- 40%) are not in good working condition. Not only is this due to
them being old generation technology, but in most instances counters are not even working and it is therefore not possible
anymore to determine their number of operations, or monitor their efficiency. Not only must the old auto reclosers be
replaced, but the number of units in the system needs to be increased. An initial 20 of the most critical auto reclosers have
to be replaced, with an additional 6 per annum thereafter.
It is also obvious that it is not possible to conduct follow-up investigations of power outages due to the frequency with
which breakdowns occur. Recurring problems can thus not be adequately addressed and eliminated.
f. More than 70% of the rural personnel‟s man hours are used for breakdowns. Concerted efforts should be made
to reverse the situation so that more than 70% is used for planned maintenance and less than 30% for breakdowns.
g. Some of the distribution transformers have exceeded their life span and loading capacity and must be replaced by
new transformers.
18.9.3 .4 CAPITAL PROGRAM – RURAL 1) Rebuilding of lines – minimum 55 km/annum @ R88/m over a 10 year period R48 400 000.00
(SEE ANNEXURE” A “) 2) Refurbishing of lines – minimum 30 km/annum @ R60/m over a 10 year period R18 000 000.00
(SEE ANNEXURE” A“)

61
3) Once off replacement of 20 critical, yet old and Outdated 33kv and 11kv auto reclosers R 2 800 000.00
4) Replacement of remaining auto reclosers – 6/annum @ R140 000.00 Over a 10 year period R 8 400 000.00
5) Replacing of 2x 5 Mva transformers at main Substation Letsitele with 2 x 10 Mva. R14 000 000.00
6) Build 66kv line from Letsitele to Laborie and Construct a substation with 2 x 10 Mva 66/33kv
Transformers. R20 000 000.00
7) Urgent Building of 25 km of 132kv line from Tarentaal to Eastern side of Tzaneen R14 000 000.00 S/T
8) Building of 10km 66kv overheadline into Georges Valley and construction of 66/33Kv
substation with 2x10 Mva transformers R17 000 000.00
9) Building of 15km 66kV overheadline into Magoebaskloof and construction of 66/33kv
substation with 2x10 MVA transformers R19 500 000.00
10) Building of 8km 33kV spur out of Haenertsburg sub to alleviate load on long 11kv lines, with
2x2MVA 33/11kv transformers R 2 500 000.00
11) Installation of power factor correction equipment on the system 3 x 33 kV units @ R200 000.00 R600 000.00 S/T
12) Installation of 3 x 2 MVA 33/11 kV new Substations to cater for network expansions at the following areas:
a) Pusela R 660 000.00
b) Letsitele Town R 750 000.00
c) Agatha R 1 500 000.00
SUB-TOTAL R 2 910000.00 S/T
18.9.3.5 Upgrading of capacity and protection a) 1 x 2 MVA transformer at Haenertsburg R 500 000.00
b) 1 x 2MVA transformer at Laborie R 500 000.00
c) 1 x 2MVA new substation at Laparisa R 750 000.00
SUB-TOTAL R 2 550 000.00 S/T d) Installation and equipping of 1 x 5 MVA 66/11 kV Substation near Fonteinplaats within 2 years R 8 000 000.00 e) Installing and equipping 1 x 5 MVA 33/11 kV Substation near Doornhoek within 2 years R 5 000 000.00 S/T
TOTAL R165 660 000.00
18.9.3.6 SUMMARY a) Short term requirements (3 year period) R 33 060 000.00
b) Medium to long term requirements (Maximum of 10 years) R 123 600 000.00
TOTAL R 165 660 000.00
18.9.3 SECTION 2 – URBAN
18.9.4.1 INTRODUCTION The infrastructure in Greater Tzaneen Municipality is generally older than 25 years which exceeds the life expectancy of a cable, especially in light of the fact that most cables are being utilized at more than 100% capacity. The Tzaneen Town has grown with a very consistent percentage each year and the infrastructure could handle the expected growth,

62
In the last two years there was a phenomenal growth of 333% in the Greater Tzaneen Municipality Town area. The infrastructure could not cope with this excessive growth, with the shortage of capital added to the problem of upgrading cables and other related infrastructure. 18.9.4.2 MASTER PLAN STUDY On informally hearing of developers intending to build many varied and large developments, this department took the proactive step and in July 2006 procured the services of Africon Engineering International Energy and Industrial Consulting Services to conduct a study with the purpose of compiling a long term (15 years) Electrical Master Plan for the electrical distribution network, to account for the expected growth, expansion and necessary reinforcements or refurbishment thereof. The Master Plan is split into two phases: Phase one was to develop an urgent short term (0 – 2 Year) normalization plan for the Tzaneen town networks. The deliverable for this phase had to enable the Greater Tzaneen Municipality to roll out a series of projects to adequately strengthen the Tzaneen Town Electrical reticulation system. The firm 11 kV installed capacity at Tzaneen main substation is 25 MVA as the main substation consists of 1 x 10 MVA and 2 x 15 MVA transformers. This firm supply is already exceeded at this moment as the network demand is recorded at 26, 31 MVA.
The proposal by Africon is to alleviate the short term problem currently experienced with overloading of two of the main feeders feeding the satellite substations of Skirving / Loop street known as (SS1) and Claude Wheatley sub known as (SS2). Satellite substation (SS1) is currently being fed from Tzaneen Main sub via a 150mm² x 3 Core PILC cable and is being overloaded by 22%. If proposed switching and changing of configurations is done the load on the cable will drop to 87, 5%. When the new developments are incorporated they will feed from this existing SS1 substation and it will be overloaded with 7%. It is then suggested by Africon that a new 150mm² x 3 Core Cu PILC cable be installed parallel to the existing feeder feeding from Tzaneen main sub to SS1. Satellite substation (SS2) was being fed from Tzaneen main sub via a 120mm² x 3 Core Cu PILC cable and is overloaded by 54%. Following the recent dramatic outages, the current situations is that the cable feeding SS2 substation is in such an irreparable state that it is not cost effective to fix due to in excess of more than 5 faults in the cable. The Electrical Engineering Department in conjunction with contractors constructed an emergency substation to feed the SS2 satellite substation. The irreparable cable must be replaced by two 240mm² x 3 Core Cu PILC in parallel, with separate breakers which will bring the loading down to 92%. It must also be noted that the emergency configuration is also straining the Agatha rural network, a very unhealthy situation indeed. It needs to be emphasized that this configuration as mentioned above will form part of the master plan of the GTM electrical area. Considering the 11 kV Tzaneen cable network, it is proposed that two new 11 kV indoor satellite substations should be incorporated into the existing 11 kV network. A new 11 kV indoor satellite substation should be constructed in 2007/2008 in the Extension 53 area and the already existing non-equipped building situated in Essenhout street should be utilized as the second new 11 kV substation which should be incorporated into the 11 kV network in 2008/2009, as indicated in Annexure “B”. The proposal for the 11 kV Tzaneen network is that 2 new 240mm² 2 Core Cu PILC (Paper Insulated Lead Covered) cable ring network should be formed throughout the town and shall consist of the existing and newly proposed 11 kV indoor satellite substations with the provision of a second 66/11 kV in feed point as configured in Annexure “B”.The immediate short term cost for all the changes and installation of new 150mm² 3 Core Cu PILC cable to satellite substations SS1 and 2 x 240mm² 3 Core Cu PILC to satellite substation SS2 is estimated at R8,650,000.00 The rest of the proposed changes and new infrastructure can be phased in over a period of 2 consecutive years.

63
18.9.4.3 YEAR 1 - SHORT TERM REQUIREMENT (2007/2008) The current firm capacity at Tzaneen main substation is 25 MVA. Already the firm capacity is being exceeded with recorded demand at 26, 2 MVA it is proposed by Africon that the existing 10 MVA transformer be replaced with an new 15 MVA transformer matching the exact specifications of the existing two 15 MVA transformers, but it is further recommended to place an extra 15 MVA transformer with the exact specifications in parallel with existing configuration. The estimated cost for this will be R5, 000,000.00. It is also proposed to construct the new satellite substations namely Extension 53, The above mentioned proposal for year 1 will enable the shedding of load on the existing SS1 network, freeing up load from SS1 substation and SS3 substation which will enable the incorporating of new developments in Aqua Park at a estimated cost of R7, 200, 000. 00.
18.9.4.4 YEAR 2 - (2008/2009) It is proposed that the existing building owned by Greater Tzaneen Municipality in Essenhout Street area be utilized as a new satellite substation. Loads will then be disconnected from the existing Adam Circle substation and this will in turn minimize the loading on SS2 substation at an estimated cost of R7, 900,000.00. 18.9.4.5 EXTENSION 78 (ADAMS FARM) The letters of appointment has been given to Contractors for the development of the residential areas. There is no point of supply for that area. A bulk supply from Tzaneen substation to Extension 78 must be constructed to service 1233 residential stands at a total cost of R11 001 043.00. 18.9.4.6 FURTHER CONCERNS At the time of compiling this report, rumors of two hotels, conference facilities and more shopping centers were being bandied about and have not been included in this report due to no available information, but the implications for our reticulation system can be more dire than anticipated when they go ahead. 18.9.4.7 SHORT TERM CAPITAL PROGRAM (URBAN)
18.9.4.8 System Protection Protection system upgrade and pilot wire protection (Solkor or equivalent) R3 500 000.00 18.9.4.9 SKIRVING / LOOP SUBSTATION The current cable is overloaded by 22%, network developments are necessary to eradicate the problem1 x 150mm² cable to be installed. R2 875 628.00 18.9.4.10 CLAUDE WHEATLEY SUBSTATION Due to the age of the cables the network is not being used. An emergency substation was constructed to keep part of the town operating temporarily. 2 x 240mm² cables have to be installed and provision for separate breakers on either end. R6 200 000.00

64
18.9.4.11 ADAM CIRCLE SUBSTATION No upgrading required within the next two years. It is required that the T1 switches be replaced with 11 kV indoor switches. R2 446 221.00 18.9.4.12 NEW SATELLITE SUBSTATION EXT. 53 To accommodate the new developments, a satellite substation must be constructed and this will ease the loading on Skirving / Loop substation. R7 134 134.00 18.9.4.13 NEW ESSENHOUT SUBSTATION To ease load on Adam circle substation, a new indoor satellite substation must be constructed. The building owned by Greater Tzaneen Substation will be used to house all switches. R7 887 040.00 18.9.4.14 TZANEEN MAIN SUBSTATION The upgrading of Tzaneen Substation is necessary. The installed capacity is 40 MVA 66/11kv and the firm capacity is 25 MVA. The used capacity is already exceeding the firm capacity at 26 MVA. R1 800 000.00 18.9.4.15 EXTENSION 78 AND 70 DEVELOPMENT Provision of bulk services to Extension 78 and 70 is necessary for the development. R11 001 043.00. 20.9.4.16 Urgent The immediate proposal is to build a new 132/66/33 kV substation with 2 x 30 MVA auto Transformers and 2 x 10 MVA 66/11 kV transformers on the eastern side of the Town to accommodate the new developments there R31 000 000.00
TOTAL R73 844 066.00
18.9.4.17 SUMMARY Short term requirements (3 year period) R73 844 066.00
TOTAL R73 844 066.00
18.9.4 SECTION 3 - ELECTRIFICATION PROJECTS
18.9.5.1 INTRODUCTION In accordance with the White Paper on Energy Policy for the Republic of South Africa, published in December 1998, Government through the Department of Minerals and Energy took responsibly for the electrification programme. The Integrated National Electrification Programme (INEP) commenced during the year 2002. The programme, which falls within the Department of Minerals and Energy (DME), is aimed at eliminating electrification backlogs of household dwellings and schools and clinics in South Africa. Funds are made available as part of the Medium Term Expenditure Framework of National Government budgeting process on the line budget of the DME. The funds are subject to the provisions of the Public Finance Management Act (PFMA) and the Division of Revenue Act (DORA). The implementing agencies for the programme are the licensed distribution entities, i.e. Eskom and Municipalities. The Municipalities‟ involvement with Eskom‟s programme is through the Integrated Development Plans (IDP) which guides the implementation priorities. Progress and annual connections achieved depend on the allocated funds and cost per connection as determined by Eskom.

65
18.9.5.2 FINDINGS AND DISCUSSIONS Electrification Backlogs in GTM The Greater Tzaneen Municipality (GTM) benefits from the INEP through the annual energy forums allocations of connections received from the DME. The Municipality has a total number of 125 villages, with an estimated 100 935 households. The total electrification backlogs are estimated at 37 119 (30%) of the total sites within these villages. The total sites are conservatively estimated at 121 990. During the inception of the INEP, a criterion was determined within the energy forums for the annual allocations of connections received from the DME. The criterion took into consideration factors including backlogs, developmental nodal zones, previous benefits from the electrification fund and the IDP. 18.9.5.3 ELECTRIFICATION IN ESKOM LICENSED AREA All villages within the Municipality are in Eskom‟s licensed distribution area. The allocations of electrification connections for Eskom‟s distribution area since the inception of the INEP are:
YEAR NO. OF CONNECTIONS PROGRAMME VILLAGE
2002/03 0 N/A N/A
2003/04 700 INEP Mamitwa
2003/04 638 Special DME Project Khopo
2003/04 1313 Special DME Project Xihoko
2004/05 1100 INEP Lephepane
2005/06 403 INEP Hoveni
2005/06 716 Mopani District Julesburg
2005/06 467 Mopani District Solani/Nyanyukani
2005/06 60 + 34 PEIG + GTM Bordeaux
2005/06 1066 PEIG Petanenge
2006/07 1162 INEP Mohlaba/Sasekani
Table: 31 Eskom‟s distribution area since the inception of the INEP
From the above table, a total number of 3365 connections were received from the INEP over a 5 year period. This
averages 673 connections per year.
1951 Connections were allocated to the Municipality by the Minister of Minerals and Energy during the 2003/04 cycle as
special projects.
A further 2315 connections were received as once-off allocations from Mopani District Municipality and the Provincial Local
Government and Housing (Premiers Emergency Infrastructure Grant) during the 2005/06 cycle.
The figure of 3365 in the above table includes 1162 connections allocated for the 2006/2007 cycle. The 2006/07 project
for the electrification of Mohlaba Headkraal/Sasekani is in the design stage.
18.9.5.4 ELECTRIFICATION IN GTM‟S LICENSED AREA
An amount of R446 400.00 was allocated to the Municipality during the 2004/05 cycle for the electrification of 124 farm
worker houses. During the cycle a total number of 338 units were connected at an average cost of R1 300.00 per
connection.

66
During the 2005/06 cycle, an amount of R4 820 000.00 was allocated to Greater Tzaneen Municipality for the electrification
of farm worker houses and farm schools. A total number of 854 housing units and 17 farm schools were electrified with an
amount of R4 768 680.04.
R3 000 000.00 was allocated to Greater Tzaneen Municipality for 2006/07 cycle for the electrification of farm worker
houses. The project is on the tender phase with an estimated 822 housing units.
18.9.5.5 ELECTRIFICATION OF SCHOOLS IN ESKOM AREA
The electrification of schools and clinics is not discussed in the energy forums due to non-attendance of relevant Eskom‟s
officials or information regarding the allocations and priority list. The priority list for schools and clinics is also not handled
by the Municipality.
18.9.5.6 CHALLENGES ENCOUNTERED WITH THE PROGRAM
a. Inconsistency with annual allocations of funds for electrification of households in Eskom licensed distribution area.
b. All villages within the Municipality are within Eskom‟s licensed distribution area and therefore the Municipal electrification
funding cannot be used.
c. Eskom‟s tardiness with the implementation process.
d. Annual allocations do not take into consideration the backlogs that have to be eliminated.
e. The rise in cost per connection as determined by Eskom. The initial cost per connection was R3 600.00 in 2002. The
current cost is estimated at R5 000.00 per connection.
f. Although schools are not within the Municipality‟s competence there are no proper communication channels regarding the
prioritization and electrification programme between Eskom and the Municipality.
g. Implementation of projects is sometimes delayed by a full cycle before implementation.
18.9.6 THE 2012/13 UNIVERSAL ACCESS
During the state of the nation address in 2004, the president indicated that all households will have universal access to energy by the year 2012/13. This means that electrification plans and programmes should be aimed at achieving this goal. In terms of the 2012/13 universal access, the current backlog of +- 37000 units should be eliminated within a period of 6 years (excluding the 2006/2007 cycle). This translates to 6167 connections per year at a cost of R30, 835m per year at the current cost per connection. ELECTRIFICATION CAPITAL PROGRAMME
No. Name of Village No. of Units Amount
1 Lenyenye Extension 3 & 4 223 R 1,115,000.00
Kuwait 173 R 865,000.00
2
Nkowankowa "A" Section 53 R 265,000.00
Industrial Area 4 R 20,000.00
Nkowankowa "B" Section 19 R 95,000.00
Nkowankowa "C" Section 500 R 2,500,000.00
3 Burgersdorp 1286 R 6,430,000.00
4 Serare 234 R 1,170,000.00
5 Makaba 450 R 2,250,000.00
6 Mookgo Block 6 & 7 349 R 1,745,000.00
7 Joppie 338 R 1,690,000.00
8 Mogapeng 498 R 2,490,000.00
9 Rita 332 R 1,660,000.00

67
10 Mathipa/Senopelwa 198 R 990,000.00
11 Mavele 927 R 4,635,000.00
12 Miragoma 405 R 2,025,000.00
13 Mokomotje 228 R 1,140,000.00
14 Mbabamencisi 1047 R 5,235,000.00
15 Mandlakazi 1211 R 6,055,000.00
16 Makhubedung 154 R 770,000.00
17 Mohlaba Cross 3B 600 R 3,000,000.00
18 Lekgwareng Block G 263 R 1,315,000.00
19 Malubana 485 R 2,425,000.00
20 Maribe Thema 200 R 1,000,000.00
21 Lwandlamuni 264 R 1,320,000.00
22 Relela 180 R 900,000.00
23 Lemoenfontein 0 R 0.00
24 Zanghoma 200 R 1,000,000.00
25 Moime 795 R 3,975,000.00
26 Mariveni 350 R 1,750,000.00
27 Fobeni 167 R 835,000.00
28 Portion of Dan 216 R 1,080,000.00
29 Khujwana 2158 R 10,790,000.00
30 Mokgwathi Block 10 713 R 3,565,000.00
31 Thako 399 R 1,995,000.00
32 Nabane 148 R 740,000.00
33 Ramalema 186 R 930,000.00
34 N'wamugololo 180 R 900,000.00
35 Kgwekgwe 160 R 800,000.00
36 Mohlakong 129 R 645,000.00
37 Bonn 100 R 500,000.00
38 Pharare 160 R 800,000.00
39 Marumofase 29 R 145,000.00
40 Mokgwathi Block 11 176 R 880,000.00
41 Leretjeng 268 R 1,340,000.00
42 Bokhuta 153 R 765,000.00
43 Mopje 247 R 1,235,000.00
44 Gabaza 395 R 1,975,000.00
45 Babanana 193 R 965,000.00
46 Botludi 115 R 575,000.00
47 N'wajaheni 100 R 500,000.00
48 Marirone 195 R 975,000.00
49 Khopo 250 R 1,250,000.00
50 Moleketla 143 R 715,000.00
51 Maweni 304 R 1,520,000.00
52 Musiphani 103 R 515,000.00
53 Motupa 90 R 450,000.00
54 Wale 168 R 840,000.00
55 Thapane 63 R 315,000.00
56 Dan Village (Lusaka) 2152 R 10,760,000.00
57 Tarentaalrand 0 R 0.00
58 Semarela 137 R 685,000.00
59 Morutji 120 R 600,000.00

68
60 Mawa Block 12 96 R 480,000.00
61 Morapalala 70 R 350,000.00
62 Khopo 73 R 365,000.00
63 Sunnyside 75 R 375,000.00
64 Mogabe 81 R 405,000.00
65 Mine View 83 R 415,000.00
66 Segabeni 87 R 435,000.00
67 Mapitlula 71 R 355,000.00
68 Sethong 99 R 495,000.00
69 Leokwe 77 R 385,000.00
70 Runnymede 70 R 350,000.00
71 Ramphelo 60 R 300,000.00
72 Madumane 64 R 320,000.00
73 Mawa Block 8 85 R 425,000.00
74 Mabjepilong 56 R 280,000.00
75 Mothomeng 50 R 250,000.00
76 Thabina Valley 46 R 230,000.00
77 Leolo 35 R 175,000.00
78 Shilubane 46 R 230,000.00
79 Setone 20 R 100,000.00
80 Sebabane 48 R 240,000.00
81 Kobjana 15 R 75,000.00
82 Moroatshehla 40 R 200,000.00
83 Mawa Block 9 68 R 340,000.00
84 Setheeni 50 R 250,000.00
85 Malekeke 58 R 290,000.00
86 Radoo 10 R 50,000.00
87 Xihoko 15 R 75,000.00
88 Dipatjeng 6 R 30,000.00
89 Mamogola 4 R 20,000.00
90 Hospital View 5 R 25,000.00
91 Private Farm 2 R 10,000.00
Total 23748 R 118,740,000.00
Table 32: EXTENSIONS PRIORITY LIST
18.9.7 ELECTRIFICATION CAPITAL PROGRAMME
18.9.7.1 SUMMARY Short term requirements (two year program) R 50 675 000.00 Medium to long term requirements (to be finished in 2013) R118 740 000.00 TOTAL R169 415 000.0 18.9.8 SECTION 4 - STRATEGIC LIGHTING AND STREETLIGHTING 18.9.8.1 STRATEGIC LIGHTING The Community Service Department of the GTM and SAPS has identified crime hot spots. The following areas were identified:
1. Letaba Crossing 2. Mohlaba Crossing

69
3. Lenyenye Crossing 4. Burgersdorp Crossing 5. Risaba Crossing 6. Mavele Crossing 7. Jopie Crossing 8. Mamitwa Crossing 9. Tarentaal Crossing
The total cost of installing lighting was estimated at R200 000.00.
Strategic lights were installed at the following crossings in 2005/06:
1. Burgersdorp Crossing R19 480.00
2. Lenyenye Crossing R 8 640.00
3. Mohlaba Crossing R13 770.00
TOTAL R44 890.00
R1 000 000.00 was requested for strategic lighting from MIG to install in other areas still to be identified for 2007/08. 18.9.8.2 STREETLIGHTING
AREA NUMBER OF LIGHTS ESTIMATED COST
Lenyenye (RDP) +- 50 R 200 000.00
Nkowankowa C +- 350 R1 400 000.00
Table 34: Street lighting budget
Nkowankowa B +- 200 R 800 000.00
Tzaneen +- 40 R 160 000.00
TOTAL ESTIMATED COST R2 560 000.00
NOTE: Estimates made at R4 000.00 per light. 18.9.8.3 SUMMARY Short term requirement (3 year period) R2 760 000.00 18.9.9 SECTION 5 - MISCELANEOUS REQUIREMENTS
18.9.9.1 MANAGEMENT INFORMATION SYSTEM To a large degree this department finds itself is a crisis situation due to the lack of a comprehensive MIS system. Unbelievably, use is still made of a paper system and with very few monitoring systems had made it very difficult to keep tabs on the systems performance. In order to bring us into line with the minimum Eskom standard this department needs to install, implement and populate a comprehensive MIS system at an estimated short term cost of around R 2 500 000.00 18.9.9.2 TOOLS AND EQUIPMENT Suitable test equipment such as fault locating equipment, quality of supply monitoring equipment, SCADA systems, modern line building equipment and vehicles is a necessity if we are to maintain the system at a high standard over the next few decades. These requirements are also short term and are estimated to cost around R 10 000 000.

70
18.9.9.3 SUMMARY Short term requirements R12 500 000.00
18.9.10 SECTION 6 - FINANCIAL SUMMARY Table 35: Financial Summary SHORT TERM
URGENT MEDIUM TO LONG TERM
RURAL R33 060 000.00 R132 600 000.00
URBAN R73 844 066.00
ELECTRIFICATION R50 675 000.00 R118 740 000.00
STRATEGIC LIGHTING AND STREETLIGHTS R 2 760 000.00
MISCELANEOUS REQUIREMENTS R12 500 000.00
TOTAL R172 839 066.00 R251 340 000.00
GRAND TOTAL R424 179 066.00
6.3.5. SOLID WASTES
1. Summary Overview of Waste Management
1.1. LEVEL OF SERVICE. 1.1.1. A full kerbside collection service is rendered to all communities in the following suburbs of Greater
Tzaneen Municipality, which represents only 11% of all households viz:- 1.1.1.1. Nkowankowa 1.1.1.2. Lenyenye 1.1.1.3. Letsitele 1.1.1.4. Haenertsburg 1.1.1.5. Tzaneen
1.2. 160 000 m3 non-compacted solid waste of all residential, business, industrial and health care waste are removed @ annum.
1.3. BACKLOGS 1.3.1. 84% of households in the total rural areas, representing ±75.537 households 1.3.2. The cost to address the service in full with immediate effect, will be approximately R75, 000,000-00 per
annum for all 129 x villages. 1.4. GEOGRAFIC DISTRIBUTION.
1.4.1. The jurisdiction area is divided by the main roads from Politsi via Tzaneen, Tarentaalrand, Letsitele and Trichardtsdal, in a Northern and Southern service region
1.5. WASTE MINIMIZATION. 1.5.1. Recycling programme envisage 1 x project/annum
1.5.1.1. 2007/08 = Tzaneen C.B.D 1.5.1.2. 2008/09 = Nkowankowa C.B.D. 1.5.1.3. 2009/10 = Lenyenye C.B.D. 1.5.1.4. 2010/11 = Letsitele/H/burg C.B.D. 1.5.1.5. 1 X Residential project / annum from 2010 / 2011
1.5.2. Presently all organic waste (garden) is treated at the composting site adjacent to the landfill @ present ± 15,436 m3 2007/2008
1.5.3. Rural Waste Programme based on on-going-in-school projects subjected to tender awarding. 1.5.4. Futuristic gas end use viability study / closure permit application.

71
1.5.5. Recycling at the Tzaneen Landfill [5,343 m3 / annum.] 1.5.6. Recycling presently takes place at the source of origin and are removed by private enterprise from
industrial and business premises [56,590 m3 / annum] 1.6. LITTER PICKING. (MAIN ROADS & STREETS)
1.6.1. All streets & main roads are cleaned on a regular and period schedule from all debris and solid waste [5312 m3 / annum ]
1.6.2. All public taxi - & bus ranks are continuously serviced and cleaned on a pre-determined schedule. 1.6.3. THE SERVICES MUST BE EXTENDED TO INCLUDE:-
1.6.3.1. ± 129 Villages or another 80,034 residential stands, which are situated within the jurisdiction area of G.T.M.
1.6.3.2. The mandate of GTM is to provide all households with a basic removal service. 1.7. PUBLIC OFF LOADING FACILITIES.{OFF- LOADING for general public & NOT A TRANSFERSTATION}
1.7.1. Public- off- loading facilities each at viz:- 1.7.1.1. Nkowankowa 1.7.1.2. Lenyenye 1.7.1.3. Letsitele 1.7.1.4. Haenertsburg
1.7.2. 6m³ skips utilized for this purpose and are cleaned on a daily basis at the Tzaneen Regional Landfill. 1.7.3. All P.O.F.`s (public offloading facilities) are managed by a MSP (Waste Group Ingwe ) 1.7.4. No municipal employee utilized at these facilities.
1.8. PUBLIC TOILETS. 1.8.1. 10 x public toilet blocks managed by Tzaneen Solid Waste
1.8.1.1. 6 x block at Tzaneen 1.8.1.2. 1x block at Nkowankowa 1.8.1.3. 1x block at Letsitele 1.8.1.4. 1x block at Haenertsburg 1.8.1.5. 1x block at Lenyenye (Non operational)
1.8.2. Blocks open for 12 hours daily 1.8.3. Cleaning and disinfecting of blocks every 2.5 hours 1.8.4. Provision of toilet paper to public free
1.9. LANDFILL SITE. 1.9.1. 1x Regional landfill, 4 km. from Tzaneen. [11 x ha in size.] 1.9.2. Fully permitted from 1/12/2004 as a G.M.B- site. 1.9.3. Landfill being managed by a M. S. P. (Waste Group Ingwe) in compliance with spec‟s from the
I.W.M.P.[Integrated Waste Management Plan ] 1.9.4. Managed in accordance with construction plan – cell building method.
2. Strategies & programmes
2.1. WASTE MINIMIZATION 2.1.1. Recycling. 2.1.2. Composting. 2.1.3. Re-use. 2.1.4. Rural Waste Minimization { On-going-school-project}
2.2. COLLECTION AND TRANSPORTATION. 2.2.1. Kerbside collection. 2.2.2. Bulk removals. 2.2.3. Health Care Waste removals.

72
2.2.4. Toxic waste removals. 2.2.5. Litter picking. 2.2.6. Vehicle fleet management.
2.3. DISPOSAL AND TREATMENT. 2.3.1. Permitted treatment facilities. 2.3.2. Permitted disposal sites. 2.3.3. Public off-loading facilities.
2.4. POLLUTION CONTROL. 2.4.1. Operationalization of Toilet-blocks 2.4.2. Effective Law-Enforcement. 2.4.3. Communication Operations
2.5. MANAGEMENT & I.C.T.SYSTEMS. 2.5.1. Appropriate I.T. hard- & software for all sub-offices. 2.5.2. Effective admin- system.{ personnel & procedures} 2.5.3. Information distribution to clients.
3. Strategies versus problems & challenges
3.1. WASTE MINIMIZATION (DESCRIPTION/PROBLEMS) 3.1.1. Formal recycling system to be implemented. = 1X C.D.B. project / region / annum. 3.1.2. 100 % operational composting plant exists adjacent to the Landfill. 3.1.3. Gas extraction system on the landfill site to be investigated. 3.1.4. Rural Waste Minimization [on-going-school] to be implemented at 8 x schools {2 x clusters} / annum.
3.2. COLLECTION & TRANSPORT. (DESCRIPTION/PROBLEMS) 3.2.1. H.C.W. storeroom was erected at the Landfill 3.2.2. Need a H.C.W. removal vehicle. 3.2.3. Stand-by vehicles were provided 3.2.4. Tender for extended service delivery be prepared
3.3. POLLUTION CONTROL. (DESCRIPTION/PROBLEMS) 3.3.1. POLICING OF ILLEGAL DUMPING – No regular policing. 3.3.2. COURT PROCEDURES – lack of municipal court/sentences. 3.3.3. Facilities management & sufficient personnel & infrastructure to be transferred to Solid Waste.
3.4. TREATMENT & DISPOSAL. (DESCRIPTION/PROBLEMS) 3.4.1. PERMITS – investigate closure of landfill [ permit issued 1/12/2004] 3.4.2. CONSTRUCTION PLAN – PLAN & 3D model to be developed
3.5. MANAGEMENT & I.C.T. – SYSTEMS (DESCRIPTION/PROBLEMS) 3.5.1. ADMIN SUPPORT
3.5.1.1. Electronic capturing of collection info. 3.5.1.2. Budget control {decentralized or centralized?} 3.5.1.3. Budget support [ grants and funds ] 3.5.1.4. Lack of appropriate software. 3.5.1.5. MIS-No waste info system from Provincial & National 3.5.1.6. G.I.S. – Lack of operational software e.g.‟‟ GOOGLE „‟
3.5.2. INTEGRATED MANAGEMENT – lack of dedication. Solid Waste Management is a small portion of the total approach to ensure compliance with environmental requirements as per “PROVINCIAL INDICATORS TO ENSURE I.D.P.COMPLIANCE WITH ENVIRONMENTAL REQIUREMENTS”
3.5.3. To address the bigger issues G.T.M. establish a CLEAN TOWN TASK COMMITTEE to deal with the bigger picture in monthly meetings & 5 x sub thrust committees were established viz:-
3.5.3.1. Bio-Diversity & Air Quality.

73
3.5.3.2. Pollution control & Waste Management 3.5.3.3. Water Management. 3.5.3.4. Land Management. 3.5.3.5. Support Services {Budget; H.R.; I.D.P.; Legal; Public Participation & Community Mobilization.
3.5.4. These committees must also develop environmental projects to address environmental gaps, and must be registered with the I.D.P.
3.5.5. BUDGET CONSTRAINTS: - 3.5.5.1. Unfunded projects exist due to budget constraints. 3.5.5.2. These unfunded mandates must be funded via Governmental grants & donations through the
intervention of the Divisions L.E.D. & F.M.-Income 3.5.6. I.W.P. was developed in house but the need validation 3.5.7. S.C.M. is not functioning effectively resulting in outstanding tenders which should have been completed
in Feb.`06
4. Number & cost to employer of all personnel associated with Solid Waste Management
Number
Cost
4.1. Divisional Head. (Degree / Diploma) 4.2. Snr. Superintendents. ( Degree / Diploma) 4.3. Superintendents ( Degree / Diploma) 4.4. Administration Clerk 4.5. Snr.Team leaders.(Grade 10) 4.6. Snr. Laborers. 1.1. Contracts x 3 1.2. Total cost
1 2 - 1 1 11 121 3 -
R0.50milj. R0, 77 milj. - R0, 55 milj. R0, 17 milj. R1, 07 milj. R9, 35 milj. R5, 17 milj. R16.13milj.
5. Financials Analyses Number Cost
5.1. Residential removals / stands. 5.2. Business removals / stands. 5.3. Own removals-villages households. 5.4. Litter picking @ Main roads & streets. 5.5. Public Toilets. 5.6. Removal & Disposal services 5.7. Total expenditure
9,892 694 80,034 5,312 m3 10 x blocks - -
- - - R5.86 milj. R2.60 milj. R15.85 milj. R24, 31 milj.
6. Total and projected tonnage of all refuse disposed. Volumes
Growth
6.1. Residential/Business/Industrial. 6.2. Garden/Clean Greens
160,000 m³ 15,436 m³
+10% +10%
7. Total number, capacity and life expectancy of refuse disposal sites. Capacity Lifespan
7.1. 1 x Landfill 7.2. Composting / garden refuse
2,000,000 m³ 180,000 m3
20 years 20 years
8. Anticipated expansion of refuse removal service. Volumes Cost
8.1. Residential / Rural 6000 m3 R6.0milj.

74
8.2. Garden 0 0
9. Free basic service provision.(Indigent Grant) Number
Amount
9.1. Quantity (Number of households affected) 9.2. Quantum (value to each household)
3825 1
R2.8milj. R65,04 p.m.
10. K.P.A. {Performances versus performance targets} Current Target
10.1. Waste Minimization 10.1.1. Recycling at landfill. 10.1.2. Recycling at premises. 10.1.3. Re-use.(Bulk wood chipping) 10.1.4. Compost terrain. 10.1.5. Rural Waste Minimization.
- 5434 m3 1 x projects 0 x projects 100% 0 x school projects
- 6060 m3 2 x projects 1 x project 100% 8 x school projects
10.2. Treatment and Disposal. 10.2.1. Disposal at permitted of landfill / facilities. 10.2.2. Operational P.O.F.`s at all towns
- 100% - 100% -
- 100% - 100% -
10.3. Collection & Transportation. 10.3.1. Kerbside collections. 10.3.2. Bulk removals. 10.3.3. H.C.W. removals 10.3.4. Toxic waste removals. 10.3.5. Litterpicking / as per routes-schedules. 10.3.6. Provision of replacement of fleet / stand-by vehicles.
- 100% 100% 100% 10% 100% - 100% -
- 100% 100% 100% 100% 100% - 100% -
10.4. Pollution control 10.4.1. Operationalization of all public toilet-blocks 10.4.2. Effective law-enforcement on all contraventions
- 98% - 0% -
- 100% - 100% -
10.5. Management & I.C.T. - Systems 10.5.1. Electronic capturing of info. 10.5.2. External funding of un-funded projects.(L.E.D.) 10.5.3. M.I.S. info-systems. 10.5.4. I.T. Networking to all sub-offices. 10.5.5. Solid waste software development. 10.5.6. Solid waste information distribution to clients. 10.5.7. Sufficient monetary provision
- 0 x system 0% x funding - 0 x system 80 % - 0 % - 100 % - R 24.31 milj
- 1 x system 100% - 1 x system 100 % - 100 % - 100 % - R 29.8 milj

75
6.3.6. TRAFFIC AND LICENSING
The Traffic and Licencing Division was splited into two (2) divisions Law Enforcement and Security and Licensing and Testing. 6.3.6.1 Licensing and Testing Division a. Level of service
Registering Authority Civic Centre
Vehicles Registration
Vehicle Licensing
Temporary advertisement applications
Traffic Fine payments
b. Driving License Testing Centre (Tzaneen and Nkowankowa DLTC)
Learners License applications
Driving License applications
Professional Driving License applications
Renewing of Card type Driving License
6.3.6.2 Law Enforcement and Security Level of service on Traffic Services at all villages and surrounding suburbs namely Nkowankowa Lenyenye is rendered by Department of Transport: Traffic Officers. Municipal Traffic Officers respond to accidents and complaints at those villages. The devolution of function process by Department Transport is almost completed and all traffic functions will be devolved to municipalities before the end of 2004/05 financial year. Licensing office at Nkowankowa is also ready for use since end of March 2005. Communities now receive services nearer to their residential areas as required by Bathos Pele principles. The DOT identified Greater Tzaneen Municipality for a new driving license testing centre to help alleviate the overcrowding of test grounds. The possible venue will be in Lenyenye and the funds will come from DOT budget. a. Backlogs and Interventions No backlogs and request the Dept of Transport and Council to regulate the overcrowding of driving license testing centre and the problem with driving schools Service rendering at all villages and nearby suburbs is delayed due to improper planning by Department Transport which is to devolve functions together with resources to municipalities. (I.e. Labour consultation and capturing of assets were not properly done). In rectifying the situation, meetings are being arranged with Labour Union (Pop cru), Department Transport Management (Mopani District), Public Services Manager, HR & Corp and Head of Section: Traffic & Licensing to consult with the workers in an effort to explain the implications they are faced with. b. Resources Personnel, motor vehicles and other equipment for effective service rendering are limited, thus not able to cover the whole Greater Tzaneen Municipal area on a 24-hour basis.

76
With devolution of functions, personnel, buildings and other equipment e.g. office furniture and limited number of vehicles will be seconded to the municipality thus creating 10% opportunity of service delivery to villages. More budgeting will have to be done at the end of 2004/2005 financial year to cover the replacement of old vehicles and buying of additional ones (Together with other equipments). c. Social Impacts
GENDER- The request for learners and driving application is so big that it enhance corruption
The majority of applicant is not residing in our jurisdiction but comes from the hole country and even from so far as
Namibia
10% of all gender receives services (i.e. only those residing within Tzaneen town and part of Haenertsburg and Letsitele)
d. Intervention
That residents of our Municipality should get priority.
With devolution of functions by Department Transport together with the filling of anticipated staff will assist in rendering
services to most of the communities within the whole Greater Tzaneen Municipality. Budgetary provision in filling those
anticipated positions will be of utmost importance.
e. Youth
There is age restrictions on obtaining a license
Road safety campaigns are only conducted within town (Minitzani), but schools at villages and farms, suburbs like
Lenyenye Nkowankowa and Haenertsburg are not receiving such services due to lack of infrastructure/teaching aids.
Mobile teaching kit (I.e. a trailer fully equipped with all teaching aids) is in a process of construction and certain equipment
is being purchased. This trailer will be towed to various villages, suburbs and schools during week days and weekends by
Traffic Officers together with road safety officers from Provincial Department of Transport for service rendering. Further
participation of officials in conducting effective teaching are in place like road safety strategy 2001-2005, various
conferences are arranged and officers will be attending to such soon.
f. Infrastructure
Current infrastructure workload full
Road signs were erected at various roads at suburbs like Nkowankowa but after a while, those signs were vandalized,
removed and markings faded.
g. Intervention
Dept of Transport have indicated that they‟ve identified Tzaneen for a 3rd driving license centre
Community participation in policing these signs through Transport Forums, Safety and Security Forums and others will
assist. Immediate call of the public to attend such meetings/forums will be of utmost assistance in ensuring safety to the
community at large.

77
6.4 SPATIAL ANALYSIS
The purpose of spatial analysis is to ensure that the spatial strategies and land use management decisions of the Municipality are based on an awareness of: Spatial constraints, problems, opportunities, trends and patterns; The necessity for spatial restructuring; The need for land reform; and The spatial dimension of development issues.
The Spatial Analysis component has strong backward and forward linkages to the rest of the process and is totally dependent on the accuracy and comprehensiveness of critical data such as population, population distribution, existing service networks, natural and artificial constraints (topography, land ownership, etc.), and existing development patterns. 6.4.1 Legislation Legislation and policy which currently impacts on spatial planning and development includes the following: Chapter 1 of the Development Facilitation Act, 1995 (Act of 1995); White Paper on South African Land Policy, April 1997; Housing Act, 1997 (Act 107 of 1997); Housing White Paper and National Housing Code, March 2000; White Paper on Spatial Planning and Land Use Management; National Environmental Management Act, 1998 (NEMA). Municipal Finance Management Act, 2003 (Act 56 of 2003 (MFMA) Communal Land Rights Act, 2004 (Act 11 of 2004)
It is important that the future spatial planning within Greater Tzaneen Municipality is done in compliance with, and in support of, mentioned legislation. 6.4.2 Spatial Pattern and Trends The Greater Tzaneen Municipal Area exhibits the following spatial characteristics: An extensive land area extending over approximately 3 240 km² A fragmented formal urban component comprising Tzaneen, Nkowankowa and Lenyenye, which have developed along a major
arterial route; Two service nodes, being Haenertsburg and Letsitele, at opposite ends of the municipal area; Two significant clusters of rural villages, one in the northern, and the other in the southern quadrant, of the municipal area; A well-developed network of primary and secondary arterial routes; Two service nodes, being Haenertsburg and Letsitele, at opposite ends of the municipal area; A considerable percentage of the land area comprises mountainous terrain, (to the west and south) which precludes urban
development; Large tracts of high-potential agricultural land, which are being utilized for intensive / extensive farming activity; Significant areas of land owned by the State under custodianship of Tribal/ Traditional authorities; Limited accessibility to most villages due to inadequate access roads and internal street networks; A cone-shaped land area extending over approximately 80km along its east/west axis, 40 km along the western vertical
perimeter and 75 km along the eastern vertical perimeter; Steep slopes along its western and southern boundaries, which gradually dissipate into undulating hills in the central areas to
virtually flat ground in the eastern parts of the area of jurisdiction.
Environmentally sensitive areas largely coincide with steep slopes, which assure that these areas are protected from over-exploitation. Exceptions include the area surrounding the Ebenezer Dam and the banks of the Great Letaba River.

78
Spatial trends could be classified as a perpetuation of the existing situation, deviations being the following: Accelerated migration of people to those areas in Tzaneen which are perceived to offer employment and basic services; and Unplanned, indiscriminate settlement of people especially along arterial routes.
The prevalent spatial pattern can be attributed to the following: historic policies and development initiatives; economic potential of land; land ownership and management; culture; and Topography.
6.4.3 Dams and Rivers The Great Letaba River transverses the GTM area from west to east and is joined by many tributaries, the more prominent being the Letsitele, Thabina, Phusela and Nwanedzi. On the southern side of the watershed the Rigudzwe and Ngwabitsi join up with the Selati River which flows through the south-eastern part of the municipal area. There are six significant dams within the municipal area from which primary water is sourced by way of various water schemes, but which in some cases also provides water for irrigation to farmers. The Ebenezer Dam is situated in the Great Letaba and provides primary water outside the watershed boundaries.
The Tzaneen Dam, which is the largest within the Municipality in terms of capacity and surface area, and is a source of both primary and irrigation water. Tours Dam is fed by the Ngwabitsi River and provides water to the villages in the southern quadrant of the municipal area, as does the Thabina Dam which is on the Thabina River.
The Magoebaskloof Dam in the Magoebaskloof River mainly provides water for irrigation but also feeds the Tzaneen Dam.
The Thapane Dam on the Nwanedzi River is a source of water for the villages in the northern quadrant of the municipal area.
6.4.4 Routes and Transport Greater Tzaneen is well-served by major arterial routes which link Tzaneen to Polokwane, Modjadjiskloof, BA-Phalaborwa and Lydenburg. A reasonably well developed network of secondary routes further serves the area. Inadequate link roads inhibit accessibility to, and within, the rural areas and internal street networks within villages. 6.4.5 Population Concentration and Distribution The population of the Greater Tzaneen municipal area is concentrated in two clusters of towns and villages, the first being the Nkowankowa/Lenyenye cluster, where 253 000 people (51%) live in 63 towns and villages on 47 778 residential stands, and the second being the Mamitwa cluster where 98000 people (20%) live in 34 villages on 17 907 residential stands. It has also been ascertained that 10767 households (11, 47%) live in proclaimed towns, while 83058 households reside in rural villages and/or informal settlements (See Table 1) Table 13: Population Concentration and Distribution (2003)
Urban Concentration
No of Households
Population No of Residential Stands
Total No of Stands
Proclaimed 10767 52859 9828 10794

79
Towns
Percentage Of Total
11,47% 10,6% 10,5% 10,4%
Villages 83058 441452 83706 92667
Percentage Of Total
88,53% 89,4% 89,5% 89,6%
TOTAL 93825 494311 93534 103461
Source: SDF Survey March 2003
The Municipality is currently engaged in the formalization of three R188 villages, namely Dan, Khujwana and Mohlaba Cross by way of Regulation R293/1962. These villages comprise roughly 11 000 stands, which calculates to approximately 12% of the total number of stands within the municipal area. The Municipality is also engaged in the formalization of the informal settlements of Mokgolobotho, Mbambamencisi and Nkomanini. Mbambamencisi (Nkowankowa-D) is in process of allocation of sites. The approval of the Surveyor-General is awaited in respect of Nkomanini. In 2006 - 7, a total of 3050 residential stands were demarcated on Traditional Land, as means to address the backlog in provision of stands. The following villages benefitted: Mbambamencisi/Lusaka, Mandlakazi, Ooghoek, Mapjepelong, Ga-Ramotshinyhadi, Berlyn/Mulati, Petanenge, and Muhlava Headkraal. A backlog exists for the demarcation of stands at the following villages: Table 14: List of Needs for demarcation of sites in rural areas
Targeted settlement (Village or Town
Farm name and Number
Land Ownership (Private or State
No of Residential sites requires
Municipal IDP/SDF Prioritization category
Type of development envisaged e.g. Greenfiled, Informal settlement upgrading, extension to existing township/settlement
Mafarana/Shibodze Keulen 669LT Nkuna 200 Outside nodal areas, village
Extension to existing settlement
Mokgoloboto Mohlaba Location 567 LT
Nkuna 1800 Primary Nodal Point
Informal settlement upgrading, Extremely high priority
Mbambamencisi/ Lusaka Phase 3
Mohlaba‟s Location 567 LT
Nkuna 300 Primary Nodal Area Informal settlement upgrading. Adjacent to Nkowankowa. Extremely high priority.
Mariveni Mohlaba‟s Location 567 LT
Nkuna 50 Primary Nodal Area To solve encroachment of Mariveni onto Nkowankowa-C
Petanenge Mohlaba‟s Location 567 LT
Nkuna 300 Primary Nodal Area Extension to existing settlement
Burgersdorp Burgersdorp 19 KT
Nkuna Graveyard only
Tertiary Node Extension to existing settlement and need for graveyard.
Gabaza Coblentz 666 LT
Nkuna 150 Tertiary Node Extension to existing settlement
Malubana/Nkambako Mamitwa Kop 462 LT
Valoyi 250 Local Service Point Extension to existing settlement
Mugwazeni Mamitwas Kop 462 LT
Valoyi 200 Outside nodal areas, village
Extension to existing settlement
Mawa.8.9.12.A‟B Gamela 679 LT Mawa 680 LT
Modjadji 600 Outside nodal areas, village
Extension to existing settlement
Ga-Patamedi/ Mabjepilong
Makube 425 LT
Modjadji 200 Outside nodal areas, village
Extension to existing settlement

80
Morwatshehla Oochock 683 LT
Modjadji 200 Outside nodal areas, village
Extension to existing settlement
Ga-Pelana/Mantshwa Makube 425 LT
Modjadji 225 Outside nodal areas, village
Extension to existing settlement
Pjapjamela Senobela 362 LT
Modjadji 100 Outside nodal areas, village
Extension to existing settlement
Mokoleng
Mogoboya 2000 (LG&H approved 300)
Outside nodal areas, village
Extension to existing settlement
Bonn
Bonn 671 LT Nkuna
200
Outside nodal areas, village
Extension to existing settlement
Ntsako Keulen 669 LT
Nkuna 250 Outside nodal areas, village
Extension to existing settlement
Mafarana/Rigubye Keulen 669 LT
Nkuna 200 Outside nodal areas, village
Extension to existing settlement
6.4.6 Business and Industrial Development Business and industrial development is concentrated in TZANEEN town, where there are 402 retail businesses and industries on 298 stands concentrated in the CBD and industrial areas of the town. In addition, the town boasts a full complement of financial and banking institutions and facilities and an extended office zone. A total of 37% of all businesses and industries within the municipality are concentrated in one town on 48, 7% of land designated for this purpose (158 ha out of a total of 324 ha). A further characteristic of especially the business development in Tzaneen is its sophistication in relation to the rest of the municipal area (extreme variety of goods and services, variety of choice, and competition). Since 2006, the need for retail shopping centres was evident with applications from three developers to extend existing malls and construct two additional shopping centres. The demand was supported by the more than 200% increase in residential development experienced in Tzaneen town. Industrial development also experienced a boom in 2006 with Council having a waiting list of more than 10 investors intending to establish in the industrial area of Extensions 18 and 40. The moratorium with effect from 2006 on selling of industrial land prevented the selling of the available land to investors, which had a negative impact on industrial development and job creation. There are now 26 business sites clustered in the business area of NKOWANKOWA accommodating 32 individual business concerns, one of which is a filling station. There are two vacant erven, one vacant industrial building and one semi-complete structure at which it would appear that construction has been halted. This business node has the most development momentum in Nkowankowa, which could be ascribed to: the presence of government / municipal functions; the natural commuter break point; the scale of development; and The arterial route which links Mariveni, Nkowankowa B and C, to the provincial route to Tzaneen.
The Unit A business node has also attracted a considerable informal sector component, and several business and office functions have established on the periphery of the designated business area. A characteristic of business development in Nkowankowa (especially in Unit B) is that residential sites in proximity, or adjacent, to vacant business erven are being developed as business premises. This suggests that a need exists for business land, which is not accessible, as people who are unable, or do not wish to, develop own the business erven. The limited growth of business in Nkowankowa in spite of the considerable population concentration within the catchment area suggests that business in Nkowankowa succeeds in intercepting only a modest share of the expendable income present within the local economy.

81
The Municipality, together with Limdev, is busy with the planning for the re-development of Bindzulani shopping centre and development of a mixed use development on the surrounding land. A market analysis indicated the immediate need for a 22 000 m² gross leasable retail facility at this premises, which will create an enormous economic boost to the region. The industrial area of Nkowankowa, owned by Limdev has vast areas of vacant land and vacant structures, evident of past industrial de-centralization strategy. In August 2006, the following information was available:
Number of developed erven with buildings on : ±90 Number of vacant buildings : ±21 Occupancy rate as at 31 July 2006 : 68% Number of vacant erven : ±50
The lease of vacant industrial structures to social and institutional institutions such as training centres, schools and churches, is increasing evident in this industrial area. The survey conducted in 1999 at LENYENYE indicates that there were eleven formal business concerns, one shop having burnt down. A further characteristic of the CBD is that informal trade (provision of meals and retail) have established in the reserve of Main Street, directly opposite the entrance to the central CBD parking area. A business node has developed as the entrance to Lenyenye at the intersection of Stadium and Main Streets, both within the proclaimed area, and directly adjacent to the external boundary of the general plan, on the adjacent farm. Seven business erven areas occur along Industrial Street, five of which are vacant, the remaining two having been designated business rights in response to existing development. Numerous spaza shops have established over the past ten years, only two having been noted in 1990, and the current register reflecting 55 spazas in Lenyenye. The stagnation of the CBD has been caused by competition from nearby centres, and the decentralization of business activity, partly due to the lack of an available business sites in the Lenyenye CBD. HAENERTSBURG is well served by business development if this is brought into relation with the number of people resident in the town. The type of business (mainly restaurants, curiosity shops), indicate that business is aimed at the tourist trade as well as serving as service node to the resident population. Lack of vacant business erven and ownership of vacant land by the State further limits business development. The Municipality has engaged with the South African Police Service and the Department of Public Works for the transferring of parts of Haenertsburg Town and Townlands 1103-LS to the Municipality to be made available for business and residential purposes. The LETSITELE CBD is also well-developed considering the resident population, the catchment area extending way beyond the boundaries of the town, and serving as retail service node to approximately 38 000 people who are mainly resident in the surrounding rural villages. There are an estimated 43 retail concerns in the town, the spectrum including general dealers/supermarkets to liquor outlets, pharmacy, cafes and restaurants, butcheries, etc. A number of service industries also occur in the centre of the town. A problem throughout the municipality, but especially at transportation hubs, is informal trading which is usually unregulated and a potential traffic and pollution hazard. Incidences of this phenomenon are prevalent at intersections of district routes and provincial routes, especially where this occurs at a village (Dan, Mohlaba Cross, Maake, Lenyenye, Rita, to name a few examples. Table 15: Incidence and Extent of Business and Industry within GTM (2003-07-17)
Urban Concentration
No of Households
No of Businesses and Industries
No of Sites Land Area
Proclaimed Towns
10767 563 434 281 ha
Percentage Of Total
11,47% 63% 70% 86%

82
Villages 83058 317 186 43 ha
Percentage Of Total
88,53% 37% 30% 14%
TOTAL 93825 880 620 324ha
Source: CBD policy Tzaneen, Nkowankowa, Lenyenye, and SDF survey, 2003
6.4.7 Housing In respect of housing the data base indicates a distinct differentiation between housing types prevalent in various areas, namely that 100% of houses in Tzaneen, Letsitele and Haenertsburg (3,1% of the total housing stock) could be classified as modern houses, while the corresponding figure for Lenyenye and Nkowankowa is 78% (8,5% of total housing stock). The percentage of modern houses in the villages ranges from 42% to 0%. The area‟s most in need of houses based on visual observation only, can be deduced from the backlogs table attached as Annexure C in the Spatial Development Framework. The Municipality has investigated the need for social housing and is in process with the establishment of policies and plans for the implementation of this new concept of integration of settlements. The intention is to start with such implementation in Tzaneen Town at Tzaneen Extension 78. 6.4.8 Educational Facilities By applying the norm of one (1) primary school per 450 households and one (1) secondary school per 1000 households, it would appear that there is a backlog of seven (7) primary schools and no secondary schools within proclaimed towns. By the same token there is a backlog of 63 primary schools and 22 secondary schools in the villages. By comparing the number of households per village with the incidence of schools, the location of backlogs can be determined. Initial indications are that the major backlogs with regard to educational facilities occur within the village concentration around Nkowankowa and Lenyenye, and in the area around Mamitwa. Table 16: Incidence of Educational Facilities within GTM (2003)
Urban Concentration No Of Households No Of Primary Schools
No Of Secondary Schools
Backlog Primary Schools
Backlog Secondary Schools
Proclaimed Towns 10767 14 12 7 0
Percentage of Total 11,47% 10,3% 16,2% 10% 0
Villages 83058 121 62 63 22
Percentage of Total 88,53% 89,7% 83,8% 90% 100%
TOTAL 93825 135 74 70 22
Source: SDF Survey, March 2003
6.4.9 Health Facilities Health facilities generally appear to occur in the areas of population concentration, with proclaimed towns being much better served than the rural areas. If the norms for the provision of health facilities is applied (especially the distance parameters), most villages are within range of health facilities. It would appear that quality, and not so much quantity, is a backlog in respect of health facilities. Table 17: Incidence of Health Facilities within GTM, 2003
Urban Concentration
No Of Households
No Of Hospitals
No Of Health Centres
No Of Clinics
Proclaimed Towns 10767 3 1 3
Percentage Of Total
11,47% 60% 20% 10%

83
Villages 83058 2 4 26
Percentage Of Total
88,53% 40% 80% 90%
TOTAL 93825 5 5 29
Source: SDF Survey, 2003
6.4.10 Recreational Facilities In respect of recreational facilities, it is once again evident that the quantity and quality of passive and active recreational facilities is far higher at, or in proximity to, the proclaimed towns than at the villages. The ratio of developed parks, public and private resorts and picnic areas, developed sports fields, developed show grounds to population is far lower than in the outlying areas. For the most part almost all villages have nothing other than informal soccer fields as the sum total of recreational facilities. The recent survey conducted for the Spatial Development Framework, 2003 revealed that there are 11 developed recreational facilities in and around the proclaimed towns, whereas approximately 110 informal soccer fields were noted in and around the villages. 6.4.11 Institutional Facilities Table 16 contains information pertaining the incidence, type and general location of institutional facilities within the GTM area. The majority of these facilities are clustered in Tzaneen, followed by Nkowankowa and then Lenyenye. There are also satellites in Letsitele and Haenertsburg. Institutional facilities in the remainder of the municipal area comprise mainly traditional authority offices and satellite police stations. Table 18: Institutional Facilities within GTM
Urban Concentration Civic Centre
Municipal Service Centres Post Offices Police Stations Magistrate's Offices
Other Government Departments
Proclaimed Towns 1 4 3 4 3 11
Percentage of Total 100% 100% 43% 100% 100% 48%
Villages 0 0 4 0 0 12
Percentage of Total 0% 0% 57% 0% 0% 52%
TOTAL 1 4 7 4 3 23
Source: SDF Survey, 2003
6.4.12 Spatial Constraints The following constraints influence the evolution of a beneficial spatial pattern, thereby disrupting the balance between economy and environment, and placing a burden on a scarce resource: Topography
A large percentage of land area within the municipal area cannot be considered for urban development due to the
mountainous nature of the terrain, although this situation has other advantages in respect of water catchment areas, tourism value, climate, etc. Approximately 22% of the municipal area is taken up by inhibiting slopes which occur mostly along the southern and western perimeters of the municipal area.
Urban Sprawl

84
The fragmented and dispersed nature of the urban component of the municipality has caused inefficient duplication of networks and hinders the creation of a core urban complex which is essential for a healthy spatial pattern. Unplanned informal settlements without access to services complicate the design of an optimal spatial pattern.
A further contributing factor is the continued demarcation of residential stands at villages outside nodal areas and population concentration points, where provision of services is a further contributing backlog problem.
Land Ownership
Inaccessibility of land caused by ownership in name of the State and other related factors are a serious constraint
to the harmonious development of the municipal area. This situation inhibits township extension and development of business areas. This is exacerbated by the lack of finance on the part of the Municipality to acquire land for development.
High Potential Agricultural Land
Large areas of the municipal area are taken up by land with high agricultural potential. It is imperative that this
resource be protected for the economic well being of the area. This situation influences the spatial pattern of the municipal area.
Environmentally Sensitive Areas, Nature Areas, Greenbelt Areas
These essential components to a balanced spatial pattern could also be considered as constraints. Mining Areas
Currently there is competition between the holders of mining rights and surface rights in certain areas within the
municipal area, which places constraints on the pattern, and which would have to be resolved to the detriment / benefit of the parties involved.
6.4.13 Implications of Spatial Patterns and Trends The configuration of the municipal area and the existing spatial pattern (topography, population distribution, and sprawl) together with causal factors (land ownership, established land uses) are impediments to the successful implementation of a Development Strategy to achieve the four developmental outcomes proposed in the White Paper on Local Government. Natural constraints to the spatial pattern, such as steep topography, are fixed, and will continue to exert influence on spatial development initiatives for as long as the resident population cannot afford to pay for expensive infrastructural services. The dependence of the local economy on Agriculture, and the current location of high potential agricultural land in relation to existing development and service networks, ensures that this factor will also influence future development initiatives. The current tendency to "waste" land (i.e. under-utilization of land by establishing limited business on large farm portions, providing extensive residential plots, overprovision of parks) has resulted in considerable sprawl, which impacts on the availability of land, being a scarce resource, for future development initiatives. Restricted access to land by the Municipality due to inhibitive land cost (privately owned land) and statutory deterrents (state - owned land under tribal custodianship) would exacerbate attempts by the Council to orchestrate and encourage the development of a beneficial spatial pattern within the municipal area.

85
The rapid increase of informal settlement / squatting bears the threat of neutralizing development alternatives currently available to Council by the reduction of land availability and the problems associated with relocation of communities once they have established. A positive of informal settlement is that this phenomenon is a clear indication of areas with development potential, and can be used as one of the indicators during the design of the desired spatial framework. Environmentally sensitive areas, as essential as they are to creating livable environments for communities, also influence the design of a future spatial pattern, in that their position is fixed. Very often, especially in communities with low income, one cannot afford to conserve these areas, and neither can one afford not to do so. The incidence of mining areas within the municipal area, especially in a densely-populated environment, accentuates the conflict between sub-terranean and surface rights, especially where communities do not have a statutory right to the land on which they reside. The development of a mine could lead to job opportunities and an improved economy, but simultaneously influence / disrupt the spatial development pattern, and negate certain development alternatives. In addition to the above, the severe backlogs in terms of especially infrastructural services, coupled to the dysfunctional spatial pattern, places severe constraints on the achievement of a balanced and livable improvement. The dynamics of eradicating backlogs (especially water provision through the water scheme system) does not contribute to the solution. 6.4.14 Conclusion The spatial analysis component of Phase 1 provides a visual picture of the existing spatial pattern which has emerged in the municipal area. The depiction of critical issues together with development constraints on a map, allows for decision-making in respect of the spatial placement of future development projects in support of an efficient and sustainable development pattern. In summary, the following issues threaten the achievement of the spatial development objectives of the municipality: Lack of support to areas with inherent development potential;
Lack of institutional support (human resources, cadastral data, GIS, legal) for implementation of land use
management schemes and contraventions thereof, and policing of development on state land;
Application of different legislation to manage/regulate land use development in municipal area.
Slow land reform by way of formalization of villages;
Indiscriminate settlement or squatting;
Undeveloped land in private ownership within urban concentrations (Nkowankowa and Lenyenye CBD, for example);
Inadequate access to land for macro and micro development, and
Severe backlogs in terms of infrastructural, social and institutional facilities and services.
Bulk infrastructural service provision for extensions in the formal towns.
6.5 SOCIAL ANALYSIS
6.5.1 LIBRARY
6.5.1.1 Infrastructure Communities from all over the Greater Tzaneen Municipality area and beyond use the Greater Tzaneen Municipal libraries. For communities outside Tzaneen, Letsitele and Haenertsburg transport costs are a factor, impacting negatively on the disadvantaged. The Greater Tzaneen Municipality libraries all offer a full library service, including information services, user education, access to balanced book collections and study space. The high level of service should be maintained and extended, as

86
the demand for quality library services is high. As the Tzaneen Library is one of only two municipal libraries in the Limpopo Province that is open on Saturdays, students and learners from all over the province rely on the library for information. The ever increasing demand for learning material, the slow delivery of books and other library material via the Provincial Library Services and the high cost of establishing new municipal libraries are the main challenges facing GTM Library Services. 6.5.1.2 Funding by National Treasury National Government realizes that there is a countrywide crisis in municipal libraries. A billion rand, renewable every three years, has been set aside for the purpose of improving existing South African libraries in phase one of the project, and to establish new community libraries during phase two. A large portion of the grant funding has been allocated to the Limpopo Provincial Library Services, Dept. of Sport, Arts and Culture, to capacitate existing libraries over a period of three years. A service level agreement for the 2008/9 financial year is to be signed, in which the Limpopo Dept. of Sport, Arts and Culture undertake to provide the GTM libraries with books, IT equipment, and library furniture, two additional staff members for the Tzaneen Library and a security system for the Letsitele library. The Greater Tzaneen Library Services has submitted detailed requests for assistance to the Limpopo Provincial Library Services, including requests for a new, fully equipped library at Bulamahlo. 6.5.1.3 School Libraries
The severe lack of school libraries in the Limpopo Province is limiting the academic performance and personal development of learners. The Department of Education is aware of the problem and has promised reform.
The Tzaneen Library continued to assist schools in securing donations of books from Biblionef.
Biblionef is an international NGO based in Cape Town, which endeavors to supply good children‟s books in the mother tongues of learners to schools lacking libraries but with dedicated teachers who are committed to establishing the love of reading at their schools. Once a school has received a donation of books, the teacher responsible is expected to write reports on the use of the books. After every satisfactory report, the school receives a further donation of books. It is possible for a school to build a good library collection based on the donations by Biblionef.
The GTM Library Services has compiled a questionnaire which makes it easy for schools to apply for books from Biblionef. School principals are encouraged to contact the Tzaneen Library for assistance in applying for these excellent donations.
Donations of good children‟s books (apart from those donated by Biblionef) were also donated to several GTM schools via the Tzaneen Library Committee.
6.5.1.4 Paired Reading Project
The Paired Reading project was initiated by Stanford Lake College and extended by the GTM Library Services. Experienced high school learners read with inexperienced primary school learners, leading to enhanced reading skills. The project between Inzana Primary and Merensky High is so successful that it was the subject of local, national and even international newspaper and magazine articles. The project was also part of the HoD Library Service‟s presentation at the International Federation of Library Association‟s congress in Durban on the 22nd of August, 2007. The HoD also presented the paper at LIASA‟s Limpopo branch on the 28th of September 2007 and has written an article with practical tips on Paired Reading for the Free State Library’s April 2008 edition. Paired Reading will continue to be monitored and encouraged.

87
6.5.1.5 Backlogs
Library services are needed within reach of all towns, villages and communities.
During the 2006 Community Needs Analysis residents of Bulamahlo, Ward 25, indicated that they needed a
community library and in 2007 residents of Ward 19, Nkowankowa indicated the same.
Establishing libraries at the four GTM Thusong Centres would be a practical way of ensuring accessible library
services to all.
The Neighborhood Development Project Grant investigation will indicate where the first new GTM library is to be
built, funds allowing.
The estimated cost of building and furnishing a large library with sufficient books and study space is R4,
000,000. In order to function optimally, and to open for extended library hours, including Saturdays, each library
would need a staff complement of 6, including 2 librarians and 4 library assistants.
6.5.1.6 Stakeholders The following stakeholders can play a part in the development of library services: a. The Limpopo Provincial Library Services (Dept. of Sport, Arts and Culture) The Provincial Library Services are tasked with the responsibility of delivering Library Services in the Limpopo Province. The Provincial Library Services are currently.
Providing the Greater Tzaneen Municipality libraries with magazines, newspapers and a very limited supply of books.
Administrating the National Treasury Library Grant to improve Library Services. b. The Department of Education The Department of Education is responsible for establishing and maintaining school libraries. The spatial p lan indicates that school libraries are available in only 9 schools. Only one of these libraries (established with the help of Stanford Lake College and the Greater Tzaneen Library Services) is accessible to the public. The Department of Education is aware of the severe lack of school libraries and has promised reform.
c. NGO‟s
Biblionef: Biblionef is committed to providing disadvantaged children with good fiction, preferably in the mother tongue.
Rotary: The Letaba branch of Rotary is assisting the Greater Tzaneen Library Services by sponsoring a Computyper for the Letsitele Library, as well as for the Sebone Primary School.
d. Library Committees The Tzaneen, Letsitele and Haenertsburg Library Committees support the libraries with book donations, fundra ising and special functions and programmes. At present the number of books donated equals the number of books purchased.

88
6.5.1.7 Social Impact a. Education The new school curriculum demands of children to do research, but with school libraries being virtually non-existent, and public libraries out of the reach of most learners, it is difficult to perform well academically. These impacts mostly on the poor, who do not have the means to travel to the existing Greater Tzaneen Municipality libraries. b. Quality of life Books open up a world of knowledge and entertainment, and are of equal benefit to all – male/female; young/old; able/disabled; rich/poor. Accessibility to a wide range of reading material impacts on life-long learning and quality of life.
c. Financial Resources
The GTM libraries are funded by the GTM, in terms of capital and financial resources. The Library Committees assist
with book donations and fundraising. The National Government‟s initiative to provide additional funding to municipal
libraries is administered by the Limpopo Provincial Library Services.
d. Recommendations
That the Tzaneen, Letsitele and Haenertsburg Libraries be maintained and improved.
That the establishment of school libraries be encouraged.
That the establishment of new libraries at Nkowankowa and at the Thusong Centres be supported.
6.5.2 HEALTH SERVICES
The 2007 asset management report indicates that there is a total of 42 health facilities within the area of jurisdiction of Greater Tzaneen Municipality rendering a comprehensive primary health care service. These facilities are supplemented by 318 visiting points, which are serviced by six mobile clinic teams. In addition to public health facilities, there is a private hospital in Tzaneen with resident doctors and specialized services. The effective rendering of this service is affected by the lack of potable water supply. The following clinics are affected: Rural South : Khujwana Mogoboya Zanghoma Julesburg health care Jamela and Mogapeng Rural North : Morutji Madumane Morapalala Motupa This situation affects a total of 24 560 household. The provision of this service has a direct impact on poverty alleviation, as it is one of the free services in terms of the national government policy. The nature of this service though available to everyone it is children and women biased. The municipality was responsible for one clinic which has since together with the Primary health Care function has been transferred back to the Limpopo Provincial Department of health with effect from 1 July 2007.

89
6.5.3 PARKS, RECREATIONAL FACILITIES, CEMETERIES, SPORT, ARTS AND CULTURE
6.5.3.1 PARKS a. Baseline Parks in Tzaneen and Haenertsburg are well developed and maintained. A park at Flora Park was developed. A park at Lenyenye is developed with play apparatus and mini soccer poles. Mini soccer poles and mini netball poles are installed at Park 720 in Nkowankowa. The Parks Division also performs the following functions:
Garden maintenance and management o Area 1 maintained by Parks personnel o Area 2 and 3 maintained by Parks personnel and contractors respectively
Grass cutting. o Sidewalks – 1161629m2 o Parks: Recreational and developed -163683 m2 o Open spaces – 79266716 m2 o Sport facilities – 3629104 m2 o Grass cutting is done at the MPCC‟s
Maintenance of side walks o Weed control was done at Nkowankowa- Bankuna Road o Termite nest control – 32 nest were eradicated on side walks o Dangerous trees removed/pruned -54 on side walks
Maintenance of open spaces o Areas slashed - 1683739 m2 o Termites nest control - 76 nests o Dangerous trees removed/ pruned – 01 o Play apparatus repaired - 15
Art in the garden show was organized and done by Parks Section together with Companies in the Green Industry.
Wet land management: Mogolobotho wetland was slashed in 2007.
Horticulture Students are trained by Parks Section to qualify for their diplomas.
Plant decoration is done on request at GTM functions. Decorations were set up at Runnymede, Mandlakaki, Shihoko, Block 5, Tivumbeni, Lenyenye Community Hall 2x, Nkowankowa Community Hall, Motupa, Dundee sports ground, Julesburg stadium, Park 379 Nkowankowa, Civic Center, Tzaneen Library.
Garden refuse removal: Garden refuse is removed on continuous basis from parks and garden areas. Streets trees are pruned and dead leaves are removed continually.
b. Backlogs
A total lack of developed parks is experienced in the rural areas.
c. Challenges
Insufficient staff.
Old vehicles need to be replaced
Theft and vandalism

90
Financial constraints
Shortage of grass cutting machinery
Some communities vandalize trees planted on sidewalks
Chopping of indigenous trees in municipal open spaces d. Interventions
The Parks Division plan to upgrade the parks in Nkowankowa, Lenyenye and Letsitele provided funds are
available.
6.5.3.2 Recreational Facilities a. Baseline
Sufficient recreational facilities such as stadiums for athletics, soccer and other ball games as well as tennis
courts exist in the towns of Tzaneen, Nkowankowa and Lenyenye.
Nkowankowa stadium has a synthetic track and a steel pavilion.
Julesburg village has a stadium.
b. Backlogs and challenges
In the rural areas recreational facilities are underdeveloped and created in an informal way by the communities according to their needs.
The pitch at the Julesburg Stadium needs kerbing. A booster pump is needed for better irrigation.
All community sport grounds needs grading.
The Olympic swimming pool in Tzaneen has been closed for more than a year due to maintenance and repair problems that need additional funding to address.
c. Interventions
A basic, well equipped and well maintained sports ground is planned for each of the four clusters to
accommodate all wards and to avoid grading grounds in every village.
6.5.3.3 CEMETERIES a. Baseline
The total number of cemeteries in the Greater Tzaneen Municipality is 66 of which 35 are fenced.
Cemeteries in Lenyenye, Nkowankowa, Tzaneen, Old Letaba and Haenertsburg are maintained. Sufficient
space for burials in the majority of cemeteries is currently available with the exception of the cemeteries in
Lenyenye, Mavele and Maunatlala that have reached full capacity.
In 2006 Moime Cemetery was developed, Senopelwa, Nwamgololo, and Mohlaba Head kraal cemeteries were
fenced and gates were installed.
b. Backlogs and challenges
The soil condition of the cemetery at Lenyenye is not suitable for burials and alternative cemeteries should be used such as the cemetery at Mohlaba Cross.
Mhangweni, Mafarana, Mandlakazi cemeteries need extension. Cemeteries which were fenced but where gates were not installed will be attended to.
Nkowankowa Cemetery will need a new site or extension by 2009.

91
The proclaimed Tzaneen Cemetery area across the storm water vlei needs to be developed, and a low bridge is also needed.
Toilet facilities in the rural villages were provided in 28 cemeteries. Of these rural cemeteries, 98% do not have access to water.
c. Interventions
The development of future cemeteries must be determined by the Spatial Plan and an environmental impact
assessment to identify suitable soil conditions for this purpose.
MIG funds will be used for the fencing of cemeteries and building of ablution facilities at cemeteries.
6.5.3.4 SPORT, ARTS AND CULTURE
The Sport, Arts and Culture section of the division gave administrative support to sporting codes at the Greater
Tzaneen Municipality and to the Department of Sport, Arts and Culture.
The Tzaneen Museum houses an excellent variety of cultural artifacts. The collection needs to be housed in a
larger, secure exhibition space. The possibility of relocating the Museum to the Tourism Centre is under
investigation.
6.5.4 HOUSING
6.5.4.1 Legislation
According to the Constitution of South Africa, Act 108 of 1996 everyone has the right to have access to adequate housing and; The State must take reasonable legislative and other measures, within its available resource to achieve the progressive realization of this right. 6.5.4.2 Backlog The backlog of housing units in the Greater Tzaneen Municipality ‟s jurisdiction area is estimated at ±60 000. Presently there is a waiting list of 14101 enlisted for low cost houses per ward per category. It should be noted that the backlog recorded is not reflected in terms of income levels and special needs. The backlog figure would be reduced if the Municipality could venture into other programmes involving higher income levels. Units allocated annually to the Municipality for housing construction is dependent upon the allocation by the Provincial Department of Local Government and Housing.

92
6.5.4.3 The Number of Units Allocated to Greater Tzaneen Municipality (2008/9 as per financial year of DLGH)
6.5.4.4 Areas that needs Services
1. Mbambamencisi – currently there is a project for 500 units 2. Dan Extension 1 – Services in order to build Middle Income Houses and Rental units, the area is proclaimed 3. Tzaneen Extension 78 – Adams Farm 4. Tzaneen Extension 60 – Arbor Park 5. Tzaneen Extension 53 – Avis Park
6.5.4.5 Community Rental Units
1. Talana Hostel – it is in the Provincial Plan 2. Fencing of Existing units 3. Renovation of the administration bloc 4. Building of 300 units with services
6.5.4.6 Purchasing of Farms
1. Portion of Ledzee, Yarmona and Shivurali purchase amount R 36 million

93
6.5.4.7 Farm Hosuing
1. Ward 14 Maribethema – waiting list 100 2. Ward 13 Tarental – The farm belongs to Mopani District Municipality and request forwarded to Ivy
Makamu in 2008 6.5.4.8 Housing Needs
Currently the status and number of Housing units needed is not available but we can confirm that we still have a serious backlog in all wards within the GTM. 6.5.4.9 Stakeholders for Public Participation
NHBRC (National Home Builders Registration Council)
Department of Labour
Department of Health + Welfare
Department of Home Affairs
Civil Society organizations (CSOs) and people in general
6.5.4.10 Social Impact of Housing on Gender, Youth, Disabled, Poor.
In order to qualify for a full subsidy for a low cost house, an applicant should earn between R0.00 to R3500.00 per month before deduction for middle income applicants should earn between R3500.00 to R7500.00.
The Greater Tzaneen Municipality‟s households are predominantly unemployed in particular women, elderly and youth. Based on the above mentioned it can be concluded that the housing projects have an impact on the poor and women.
The Provincial Department has decided that they will support the contractors without the municipal approval which is leading to a substandard product and unsatisfied communities.
6.5.5 EDUCATION
When applying acceptable norms to educational facilities in respect of pupil to classroom ratio, it is evident that there is a severe backlog with respect to the number of existing classrooms. although this is not a municipal function, less than optimal education impacts on employability, the economy, ability to pay for services, etc. – (i.e. the under development of a potential resource) (Source: Department of Education Annual Report, 1997) There are a total of 108 facilities for early childhood learning, 135 primary schools, 74 secondary schools, 2 special schools and 3 tertiary institutions. Applying the above-mentioned norm it indicates that there is a backlog of 70 primary schools and 22 secondary schools. Schools in the rural areas do not have potable water supply and sanitary facilities.
6.5.5 SAFETY AND SECURITY
The following institutions are situated in the Greater Tzaneen Municipal jurisdiction area:
a. Six (6) Police Stations ( Each with holding cells)
b. Three (3) Satellite Police Stations
c. Prison (1)

94
d. Three (3) Magistrate Courts
Nkowankowa
Lenyenye
Tzaneen
Traditional Authorities courts with limited jurisdiction:
KGOŠI/KGOŠIGADI or Hosi of that specific tribe. Though it is not municipal functions, these institutions assist Council in ensuring sound governance, by curbing crime and effecting justice to the communities. Greater Tzaneen Municipality is responsible for securing Council properties. To this effect private security firm are utilized to collect money and safeguard property
6.2. ECONOMIC ANALYSIS
6.2.1 Economic Growth Rate, GGP and Sector The Greater Tzaneen area has experienced an average economic growth rate of about 20,3% per annum in Mopani, compared to 6,6 for the Limpopo Province to National GDP. 6.2.2 Regional Economic Profile In order to make comparisons and linkages with the broader economic community, it is important to understand the economy of the study area within the broader region. This section discusses and analyses each economic sector in terms of sectoral analyses and identifies those sectors with growth potential. The following table indicates the contribution to the GDP for each sector. Table 19: Percentage share of GDP per sector, 2008
Industry South Africa Limpopo Mopani District
Agriculture, forestry and fishing 2.8% 3.1% 3.6%
Mining 7.7% 26.7% 31.0%
Manufacturing 18.4% 3.7% 1.9%
Electricity & water 2.4% 2.9% 3.0%
Construction 2.6% 1.7% 1.5%
Wholesale & retail trade; catering & accommodation 14.2% 12.0% 15.4%
Transport & communication 9.4% 8.4% 7.5%
Finance and business services 21.7% 18.3% 14.4%
Community, social and other personal services 20.7% 23.1% 21.7%
Total 100.0% 100. 0% 100.0%
Source: Global Insights: 2008
In Mopani District the largest contributor to GDP is mining (31%), followed by community/personal services (21.7%), wholesale and retail (15.4%), and finance and business services (14.4%).
The following Table indicates the percentage of GDP in each sector in Limpopo and Mopani as contributed to South African economy in 2006. Table 20: Contribution to National GDP per sector, 2008

95
Industry Limpopo Mopani District
Agriculture, forestry and fishing 7.4 2.0
Mining 22.8 6.4
Manufacturing 1.3 0.2
Electricity & water 8.0 2.0
Construction 4.3 0.9
Wholesale & retail trade; catering & accommodation 5.6 1.7
Transport & communication 5.9 1.3
Finance and business services 5.6 1.1
Community, social and other personal services 7.4 1.7
Total 6.6 1.6
Source: Global Insights: 2008
The total contribution that Mopani District makes to the National GDP is 1.6%. The contribution of Limpopo to the National GDP is 6.6%. The largest contributor of Limpopo and Mopani to the National GDP is that of mining (22.8% and 6.4% respectively) and the smallest is manufacturing (1.3% and 0.2%). 6.2.3 Economic Profile Figure 21: Gross Domestic Product Contribution per Local Municipality, 2008
Gross Value added contribution per Municipality
47%
7%9%
17%
20%
Ba-Phalaborwa
Greater Tzaneen (GTM)
Greater Giyani
Greater Letaba
Maruleng
Source: Global Insights: 2008
Table 22: Gross Domestic Product Local Municipality per Economic Sector, 2008
Economic Sector
Greater Giyani
Greater Letaba
Greater Tzaneen
Ba-Phalaborwa
Maruleng Mopani District
Agriculture, forestry & fishing 1.3% 9.3% 7.6% 1.1% 7.0% 3.6%
Mining 0.2% 7.7% 7.3% 59.6% 1.4% 30.5%
Manufacturing 3.4% 2.3% 3.7% 0.5% 2.7% 1.9%
Electricity & water 4.7% 7.2% 5.0% 1.0% 2.3% 3.0%
Construction 2.9% 1.6% 1.7% 0.7% 3.3% 1.6%
Wholesale & retail trade; catering & accommodation 11.6% 10.9% 10.2% 21.0% 9.1% 15.5%
Transport & communication 8.7% 8.1% 9.0% 4.4% 20.6% 7.5%
Finance & business services 29.1% 21.0% 23.8% 3.9% 17.2% 14.6%
Community, social and other personal 38.2% 32.1% 31.7% 7.8% 36.4% 21.8%
GTM

96
Economic Sector
Greater Giyani
Greater Letaba
Greater Tzaneen
Ba-Phalaborwa
Maruleng Mopani District
services
Total 100.0% 100.0% 100.0% 100.0% 100.0% 100.0%
Source: Global Insights: 2008
The key sectors per each of the local municipalities in terms of GDP contribution is as follows:
Greater Giyani: Community services (38.2%), finance (29%), and trade (11.6%);
Greater Letaba: Community services (32.1%), finance (21%), and trade (10.9%);
Greater Tzaneen: Community services (31.7%), finance (23.8%), and trade (10.2%);
Ba-Phalaborwa: Mining (59.6%), trade (21%), and community services (7.8%); and
Maruleng: Community services (36.4%), transport (20.6%), and trade (9.1%).
The table below provides an analysis of the percentage breakdown of each local municipality within the main economic sectors. Table 23: Gross Domestic Product Contribution of Local Municipality to Mopani, 2008
Economic Sector
Greater Giyani
Greater Letaba
Greater Tzaneen
Ba-Phalaborwa Maruleng Mopani District
Agriculture, forestry & fishing 5.9% 23.1% 43.0% 14.8% 13.1% 100.0%
Mining 0.1% 2.2% 4.8% 92.5% 0.3% 100.0%
Manufacturing 29.1% 10.5% 38.3% 12.7% 9.4% 100.0%
Electricity & water 25.9% 20.9% 33.1% 15.1% 5.0% 100.0%
Construction 31.1% 8.9% 22.8% 22.7% 14.5% 100.0%
Wholesale & retail trade; catering & accommodation 12.5% 6.2% 13.3% 64.0% 4.0% 100.0%
Transport & communication 19.5% 9.6% 24.4% 27.9% 18.6% 100.0%
Finance & business services 33.4% 12.8% 33.2% 12.7% 8.0% 100.0%
Community, social and other personal services 29.3% 13.1% 29.5% 16.9% 11.3% 100.0%
Total 16.7% 8.9% 20.3% 47.4% 6.7% 100.0%
Source: Global Insights: 2008
The key local municipality contributors per sector are as follows:
Agriculture: Greater Tzaneen (43%) and Greater Letaba (23%);
Mining: Ba-Phalaborwa (93%);
Manufacturing: Greater Tzaneen (38.3%) and Greater Giyani (29.1%);
Electricity and water: Greater Tzaneen (33.1%) and Greater Giyani (25.9%);
Construction: Greater Giyani (31.1%), and both Greater Tzaneen (22.8%) and Ba-Phalaborwa (22.7%);
Trade: Ba-Phalaborwa (64%);
Transport: Ba-Phalaborwa (27.9%) and Greater Tzaneen (24.2%);
Finance and business: Both Greater Giyani (33.4%) and Greater Tzaneen (33.2%); and
Community services: Both Greater Tzaneen (29.5%) and Greater Giyani (29.3%).

97
6.2.4 Contribution to employment
The purpose of this section is to provide an understanding of the economically active population in Mopani District Municipality in terms of employment. Limpopo in 2006 had an economically active population of 1,555,218 people of which Mopani District comprised of 108,682 people. The local municipality economically active population comprised of:
Greater Giyani (20,712 people);
Greater Letaba (16,084 people);
Greater Tzaneen (29,693 people);
Ba-Phalaborwa (30,612 people); and
Maruleng (11,581 people).
Ba-Phalaborwa and Greater Tzaneen are the largest employers in the district. The Table below indicates the total
employment per local municipality. Table 24 Employment per Economic Sector per Local Municipality, 2006
Economic Sector
Greater Giyani
Greater Letaba
Greater Tzaneen
Ba-Phalaborwa Maruleng Mopani District
Agriculture, forestry & fishing 1 875 7 692 11 899 4 771 3 828 30 065
Mining 155 279 758 14 017 159 15 368
Manufacturing 791 603 1 560 576 462 3 992
Electricity & water 306 261 450 311 156 1 484
Construction 1 573 393 790 1 082 672 4 510
Wholesale & retail trade; catering & accommodation
1 852 919 2 053 1 811 843 7 478
Transport & communication 576 267 700 530 382 2 455
Finance & business services 1 492 716 1 539 1 181 808 5 736
Community, social and other personal services
12 092 4 954 9 944 6 333 4 271 37 594
Total 20 712 16 084 29 693 30 612 11 581 108 682
Source: Global Insights: 2008
The Mopani District employed approximately 108,000 people during 2006. Greater Tzaneen LM is the largest employee in the agricultural sector and comprises of approximately half of the agricultural employment. Ba-Phalaborwa is the largest employer in the mining sector as expected based on the dominance of the mining sector in the local municipality. Giyani is the largest employer of those in the community services sector and this can be attributed to the number of government departments in the area. 6.2.5 ECONOMIC ANALYSIS OF THE GREATER TZANEEN LED The reviewed LED Strategy of 2007/8 of the Municipality has identified four (4) Strategic Thrusts viz.
Fruit & Nut Cluster Value Chain Development
Agricultural Value Chain Development
Tourism Development and Promotion
Business Diversification and Trade Development The above are the most important sectors in terms of development potential and economic contribution of the Municipality.

98
a. Agriculture The total agricultural area of Tzaneen is predominantly for:
Cattle farming 77,7%
Orchard crops 7,8%
Dry Land Farming 1%
Irrigation 0,9%
Forestry 3,1%
Conservation project 9,5% (as in 2007 Greater Tzaneen Municipality SDF)
The agricultural activities of the Greater Tzaneen Municipality contribute nearly half 48% to the Agricultural Sector of the District. The Sector is taking 29% of the overall employment in the Greater Tzaneen Municipality. b. Fruit and Nut Cluster Value Chain The Sub-tropical Fruit and Nut Cluster were identified in the 2004 LED Strategy. The project was funded by the EU. A feasibility study was conducted and it was discovered that:
White people predominantly run the sub sector.
Raw material produced is transported externally for processing.
Money is spent on transporting raw material.
There is very little ownership of the previous disadvantaged individual in local value adding businesses.
The study also identified the following projects for further profiling:
Establishment of Small & Medium Sub-Tropical Fruits and Nut farms in the region
Establishment of a Sub- Tropical Fruit and Nuts Cooperatives for emerging farmers
Establishment of a BEE- Focused marketing agency
c. Tourism Development and Promotion The Provincial Economic Strategy Analysis has identified as a sector having competitive advantage. This sector reflects strength, unique characteristics and a potential for growth and development. The Tourism Development Framework developed in 2002 has been services and further feasibility studies are necessary around hotspots identified for development of the area for tourism attraction. The Greater Tzaneen Municipality has a high potential of contributing significantly to Vision 2020 of Limpopo and to the worlds. Community Tourism (Mefakeng Tourism Development) is also one way of achieving that were previously disadvantaged communities will also benefit from this initiative. That is mainly because of its abundant natural resources (rivers and streams, forestry, indigenous citrus plantation, tourism attractions or hotspots, etc) and a climate that is favourable for agriculture. d. Business Diversification and Trade Development
To stimulate economic activities within the Municipality, the LED strategy has identified the following programmes:
Business retention and attraction
Skills development
Retail trade development and informal sector development
Land claims and infrastructure development support

99
To ensure sustainability and growth within the emerging and small businesses (SMME‟s), entrepreneurs and Cooperatives including existing larger businesses support is needed in various forms of financial support, mentorship, access to information, networking and marketing. 6.6.6 ECONOMIC CHALLENGES a. Institutional Capacity
Implementation of existing plans for the LED
Focus on Community development instead of economic development (must have competitive edge)
Skills o Economist (specialized) o Project Management
Leadership of Greater Tzaneen Municipality with regard to integration of plans
Lack of aggressive marketing of Greater Tzaneen Municipality
Poorly developed marketing strategy for our municipality
Finance
b. Investment opportunities
Barrier to access finance and markets o Ownership of land o Capacity to develop business plans
Comparative advantage viz proximity to airports, harbour, transport, market etc
Inadequate infrastructure for development
Lack of maintenance of existing civil and electrical infrastructure
Finalization of land claims
Appeals on township applications delay development
Lack of specialized skills e.g. turners, fitters, engineers etc
Lack of incentives for private sector driven development 6.6.7 SOCIAL CHALLENGES 6.6.8 ENVIRONMENTAL CHALLENGES
Poverty - Climate Change
HIV/AIDS - Pollution e.g. Letaba River
Cultural diversity - Illegal occupation of land e.g.Letaba River
Xenophobia - Veld fire
Political climate - Exploitation of natural resources
6.7 ENVIRONMENTAL CHALLENGES Planning for sustainability has become a very important aspect of Environmental Management in this era where Global warming has started to take effect, the depletion of natural resources and environmental pollution is taking place at an increased scale. We are seeing the re-emergence of communicable diseases that are associated with living conditions.The first step in planning for sustainability is to identify Environmental Issues,their impacts then develop an Environmental management Plan to mitigate same. The following are Environmental Issues identified:

100
6.7.1 Illegal Sand Mining The increase in infrastructural development including the development of low cost housing as well as other construction related development has resulted in an increase in sand mining. These developments contributed to the illegal sand mining in local rivers.These two activities result in the altering of the bed, banks, course and characteristic of the river. It also results in an irregular landscape.
6.7.2 Land Pollution There is indiscriminate dumping of household, commercial refuse and building rubble in Tzaneen, Nkowankowa, Lenyenye and Haenertsburg. Illegal dumping sites exist in the following villages: Gabaza, Tshamahansi, Kubjana, Mopye, Motupa and Thako. A total of 7673 households are affected.
6.7.3 Air Pollution From January to December 2006 there were 40 000 licence renewals and 10 000 new registrations coupled to the recent traffic count results on the R71 the exhaust fumes and particulate matter from the vehicles contribute to air pollution.The conversion to unleaded fuel also helps somewhat to reduced the ambient Carbon monoxide and particulate matter.Ther are +134 source and non source emtters in the area which will be dealt with in terms of the NEMA: Air Quality Managemnet Act.. Construction and mining activites also contribute to air pollution
The house hold energy source also contributes to air pollution importantly so indoor air quality, such as the use of candles and paraffin lamps for light, wood fires for cooking as well as gas and paraffin stoves 6.7.4 Water Pollution Recent developments in Tzaneen town have a direct impact on water quality as the proper functioning of wetlands and streams are interfered with during the construction phase of township establishment and the development of cormmercial sites. The establishment of an informal settlement on the Letaba River bank has an immediate and direct impact on the water quality as well as riverine stauts.Improper location and construction of pit latrines and septic tanks in environmentally sensitive areas – Clear Water Cove near Ebenezer Dam; the emptying of septic tanks and disposal of effluent in Letsitele; and the location of a grave yard in an area with a high water table in Lenyenye have an impact on the water quality. Storm water management s were without screening devices, which permitted debris access to the rivers. The state of rivers report from Department of Water Affairs and Forestry rated pollution in the local rivers as fair. To determine the water pollution level index,112 Bacteriological samples of water for domestic use, and 6 chemical samples of water from the land fill site were collected and analyzed during the period February 2007 to July 2008. Water quality management plays a significant role in pollution prevention; the operation and maintenance of sewer purification plants are significant in this instance since they have to ensure that the final effluent discharged into rivers does not contribute to water pollution. 6.7.5 Loss of Bio-diversity We have one of the highest levels of biodiversity in the country,but the general state of biodiversity and eco system functioning is not good. The human pressure has resulted in activities like deforestation, veld fires, over grazing, invasion of alien plans, agricultural practices (excessive use of pesticides and fertilizers), uncontrolled use of wetlands and illega l occupation/squatting have contributed to land degradation in the Greater Tzaneen Municipality area. During the period

101
6.7.6 Energy consumptiom The primary environmental impact of electricity consumption is the production of greenhouse gases that contribute to global warming. Total emissions of greenhouse gases are electricity generation, and 35% of this was from residential use.Electricity supply and consumption has reached a point where it impacts directly on the consumer, persistant power cuts or load shedding in some areas result in the increased reliance on wood for energy.
6.8. INSTITUTIONAL ANALYSIS
6.8.1 Organizational Analysis The Greater Tzaneen Municipality is a Category B Municipality, which operates on the Executive Committee System. The Municipality has been divided into 34 wards (the 34th ward has been added by the Demarcation Board in 2005 in preparation for Local Government elections) each ward being represented by a Ward Councillor. There are also 33 proportionately representative councilors. There are seven full-time Councillors, who occupy the positions of Mayor, Speaker and Executive Committee Member and leading the various clusters. The positions of Municipal Manager and the other seven Section 57 managers are all filled by fixed term contracts coupled to performance agreements. As on 1 October 2008 there were no vacancies for Section 57 managers. The positions of Municipal Manager and Chief Financial Officer are filled by way of fixed term contracts coupled to performance agreements. Three out of the 26 heads of division positions was vacant as on 1 March 2008. The Performance Management System was cascaded to heads of division. With the exception of the position of Manager: Engineering Services other manager positions are also filled on the same basis. Heads of division are also appointed on the same basis. The Performance Management System is cascaded to heads of division. Six out of the 27 heads of division positions was vacant as on 1 October 2008 and an outflow of experienced staff is being experienced on this job level. The Organogram was reviewed and the amendments were implemented with effect from 1 March 2009. The new Organogram consists of the following departments:
Office of Municipal Manager
Planning and Economic Development
Office of Chief Financial Officer
Corporate Services
Engineering Services
Community Services
Electrical Engineering Services
The transfer of staff form the Department of Water Affairs and Forestry to Greater Tzaneen Municipality will be done during the 2009/2010 financial year. The transfer of the Environmental Health function to the Mopani District Municipality and Trade Licensing functions from the Department of Economic Affairs and Tourism to Greater Tzaneen Municipality is still engaging attention. Three seconded Traffic Officers from the Department of Transport were transferred to Greater Tzaneen Municipality with effect from 1 July 2008.

102
6.8.2 Organogram (see next page)

Table 25: Organizational Structure (Organogram
EXECUTIVE COMMITTEE
‘ Q Q
Q’ Q] QS
NMSWNKJLKP
L P
1S,AKSKKS
MUNICIPAL MANAGER
ENGINEERING
SERVICES
ELECTRICAL
ENGINEERING
PLANNING AND
ECONOMIC
DEVELOPMENT
COMMUNITY SERVICES CHIEF FINANCIAL
OFFICER
CORPORATE
SERVICES
FINANCIAL
SERVICES AND
REPORTING
REVENUE
EXEPENDITURE
INFORMATION
AND TECHNOLOGY
LAW ENFORCEMENT
SOLID WASTE AND
CLEANSING
PARKS, RECREATION &
CEMETERIES
LICENCING AND
TESTING
LIBRARY SERVICES
ENVIRONMENTAL
SERVICES
LAND PROPERTY
AND HOUSING
TOWN PLANNING
LOCAL ECONOMIC
DEVELOPMENT
IDP/GIS/PMS
INFORMATION AND
ADMINISTRATION
ELECTRICAL
PROJECTS
OPERATION AND
MAINTANANCE
(RURAL)
OPERATION AND
MAINTANACE
(URBAN)
ROADS AND
STORMWATER
WATER AND
SEWER
BUILDING AND
MAINTANANCE
PROJECT
MANAGEMENT
UNIT
HUMAN
RESOURCE
LEGAL
SERVICES
COMMUNICATI
ON AND
MARKERTING
PUBLIC
PARTICIPATION
AND PROJECT
SUPPORT
OFFICE OF THE
MUNICIPAL MANAGER
DISASTER
MANAGEMENT
INTERNAL AUDIT
YOUTH, GENDER
& DISABILITY

In order to create synergy, cohesion and continuous engagements between administration and the political arm in decision making processes of the institution, Council approved the establishment of Clusters and study groups as follows: 12.2.1 FINANCE CLUSTER Alderman OJ Mushwana Table: 26 Study Groups
Study Group Councillors Department(s) to support 1. Budget Makhuthudise M. Monicah
Mailula M. Simon
CFO: CORP: Comm & Marketing Community Services: OZ Mkhombo
2. Revenue Machimana Cassius Maunatlala Rylinah. S. John Ngobeni
CFO: CORP: Comm & Marketing Community Services: OZ Mkhombo
3. Expenditure Mbhalati Jameson. N. Masetla Pessyna S.
CFO: CORP: Comm & Marketing – Community Services: OZ Mkhombo Community Services : HL Mienie
4. PMS Mokgoloboto M. Josephine Maganu Sindile Thabita John Ngobeni
All Managers CORP: PED: Community Services HL Mienie Corporate Services:
5. IDP Mangena M. Godfrey Tiva M. Sannie
All Managers CORP: PED: Gerald Twala Community Services HL Mienie
6. Remuneration OJ Mushwana Ramolefe M. Daniel Selomo R R
Councillors only
12.2.2 ECONOMIC CLUSTER Monicah Makhuthudise Study Group Councillors Department(s) to support
1. LED Maloko M. Leveus Nkwinika Theron Makhurupetsi Festina
CORP: PED: F Rammalo PED: Gerald Twala
2. Poverty Mahasha P. Ezekiel Nkuna P. Elsie
CORP – NR Mathebula PED: F Rammalo
3. Tourism Nukeri T.K. Mbhalati Joe
CORP: Comm. & Marketing – NR Mathebula PED:

GTM DRAFT IDP 2009 - 2010
105
12.2.3 SOCIAL CLUSTER Ramatsoma Theo Study Group Councillors Department(s) to support
1. Safety & Security Mushwana Peter Ramphelo M. Botha
CORP: Public Participating & Special Projects - F. Malale Safety Security & Liason: Traffic- MJ Malatji Safety Security & Liaison: Licensing – A Liversage CORP:Health & Safety - G Matsaung
2. Health & Development
Baloyi Belgrade Mhlongo T. Lydia
CORP: Public Participating & Special Projects – F Malale Community Services: TM Machumele
3. Environmental Issues Rihlampfu H. Ernest Ramolefo M. Emelina
CORP: Public Participating & Special Projects – F Malale Community Services: HL Mienie
4. Disaster Management
Shitlhangu N.W.Sammy Raganya M. Sophy
CORP: Public Participating & Special Projects – F Malale Municipal Manager- N Engelbrecht
5. Social Security Sibiya Maria Mothiba M. Joas Mmetle Dikeledi
CORP: Public Participating & Special Projects – F Malale Community Services - MB Sebothoma
6. Parks and Cemeteries
Mashele Brown Ngobeni Stone
CORP: Public Participating & Special Projects – F Malale Community Services- X Mdani
7. Education Mmola M. Maria Ramathoka Harrison Masetla Phangasasa
CORP: : MPS Visser CORP: Public Participating & Special Projects – F Malale Community Services: CJ Nel
12.2.4 INFRASTRUCTURE CLUSTER Napoleon Mboweni Study Group Councillors Department(s) to support
1. Roads & Storm water Ngobeni John Lebea D. Enica Nukeri T.K.
Engineering Services: T. Hlayisi CORP: Public Participation & Special Project : F Malale
2. Electricity Mbhalati M. Joseph Mahori Samuel
Electrical Eng. – S Lelope CORP: Public Participation & Special Project : F Malale
3. Water & Sewer Malekutu M. Beatrice Baloyi Colbert Samson Maunatlala
Engineering Services – L Mahayi CORP: Public Participation & Special Project : F Malale
4. Land Property & Housing
Mnisi Botany Mogoboya M. Asnath Nkwinika Joyce Ramatsoma Theo
PED – Phakula HN CORP: Public Participation & Special Project: F Malale :NR Mathebula Engineering Services: L Mahayi

GTM DRAFT IDP 2009 - 2010
106
5. Town Planning Mushwana Thazan. S. Nkgapele M. Dinah Malatjie Boswell
PED – Mgama Mathye CORP: Public Participation & Special Project : F Malale :NR Mathebula
12.2.5 SPORT, ARTS & CULTURE CLUSTER : John Ngobeni. Study Group Councillors Department(s) to support
1. Geographic Names Mkhari N. Benneth CORP: Comm. & Marketing: Corporate Service – ES Maake
2. Sport Maunatlala Samson M. Mboweni Napoleon
CORP : Comm. & Marketing N Mathebula Community Services: AP Seweya Community Services: C Maake, S Swartz & C Maholovela Corporate Services : B Mashala
3. Arts Van Vuuren Jansen Ralepelle M. Eric
CORP : Comm. & Marketing N Mathebula Community Services: AP Seweya Community Services: C Maake, S Swartz & C Maholovela Community Services: CJ Nel
4. Culture Ncha Lucy Seroto Sello Stephen
CORP : Comm. & Marketing N Mathebula Community Services: AP Seweya Community Services: C Maake, S Swartz & C Maholovela Community Services: CJ Nel
5. Disabilities Malatjie R. Mohoboya Selomo R.R.
CORP : Comm. & Marketing N Mathebula Community Services: AP Seweya PED: G Twala Community Services: D Molewa Corporate Services : NH Ramoshaba
6. Gender Baloyi Belgrade Shikwambana Patrick Nkwinika Joyce
Community Services: TM Machumele PED: G Twala CORP : Comm. & Marketing N Mathebula Corporate Services: NH Ramoshaba
7. Youth Samson Maunatlala Nkuna S. Jane Ndove D. Lawrence
PED: G Twala CORP : Comm. & Marketing N Mathebula
8. Heritage
Ramodike M. Nelson Makhurupetsi N. Festina
Community Services: C Maake, S Swartz & C Maholovela CORP : Comm. & Marketing N Mathebula PED : F Rammalo

GTM DRAFT IDP 2009 - 2010
107
12.2.6 GOVERNANCE AND ADMINISTRATION CLUSTER Selomo R.R. Study Group Councillors Support Department(s)
1. Human Resources Nkwinika H. Joyce Mushwana O.J. Masetla Phangasasa
CORP: Comm. & Marketing: Corporate Services- - MPS Visser
2. Audit Ncha Lucy Mogoboya M. Mahlane
CORP: Comm. & Marketing: Municipal Manager – R Shingange
3. Policy, IGR & International Relations
Malatji M. Boswell Nkwinika Joyce Baloyi George
CORP: Comm. & Marketing: Corporate Services – - HG Botha
4. Communications, Marketing & Branding
Mashava N. Samuel Machimana Cassius McComb Graham Lincoln
CORP: Comm. & Marketing: Corporate Services – - HG Botha
12.2.7 SPECIAL COMMITTEE Ncha M.L. Study Group Councillors Department(s) to support
1. Public Participation (Ward Committee)
Mboweni: Napoleon
CORP: Public Participating & Special Projects : F Malale NR Mathebula Corporate Services- - HG Botha
2. Ethics Committee
Mboweni: Napoleon
Municipal Manager – MF Mangena CORP: Fourie Malale Corporate Services- - N Phatudi
3. Petition Committee
Mboweni: Napoleon
Municipal manager – MF Mangena CORP: Corporate Services -
HG Botha
N Phatudi
That Councillors be deployed to other Council Structures as follows:
Local Labour Forum Councillor R R Selomo
Councillor H J Nkwinika
Councillor P J Masetla
Employment Equity Consultative Forum Councillor B M Malatjie
Alderman O J Mushwana

GTM DRAFT IDP 2009 - 2010
108
Councillor R R Selomo
Training Committee Councillor R R Selomo
Councillor H J Nkwinika
Employment Assistance Programme Council Councillor B M Malatjie
Councillor R R Selomo
13 INSTITUTIONAL ANALYSIS - FINANCIAL ANALYSIS (2009/2010)
13.1 Current state
13.1.1 Area of the municipality
The municipality is an amalgamation of five different administrations from the old dispensation. Three of these were traditional municipalities under the old dispensation where cost recovery was more cost related – in relation to the services that were being offered there. The other two administration areas were however not municipalities as per that dispensation and were run by the previous homeland governments. Most of their expenses were therefore covered by the homeland government. The challenge came when these had to be merged into the new municipality where cost recovery had to be taken into account. In these two areas assessment rates were not charged on the value of the properties. With the translation of these into a municipality came the charging of assessment rates on the value of properties. Invariably the amount to be paid by residents increased dramatically which led to most of them not being able to pay their municipal debts leading to dramatic increases in the amount of municipal debtors. Due to the fact that section 118 of the Municipal System‟s Act requires that the whole amount outstanding on an account must be settled before that property can be sold most of the residents, in a bid to avoid settling their huge accounts that accumulated over time, privately sold their properties without notifying the municipality nor registering such sale at the deeds office. This compounded the problem of outstanding debtors as the municipality continued to charge the previous owner who in most cases could not be traced and the new owner refusing to settle the outstanding amount as the account was not in his name. These issues led to the municipality not being able to institute proper credit control nor handing over of long outstanding debts since the residents insisted that the data on which the municipality was acting could not be relied upon and that a data cleansing exercise had to be carried out. Such an exercise was carried out and the billing data for the two towns cleansed. During this period the municipality engaged in a process of registering indigents to ensure that no legal action was taken against residents who were indigent. However, these process was frustrated by the fact that some residents were not willing to come forward for registration as indigent as they were afraid that this process was aimed at ensuring that they start paying for their services. With the advent of the new municipal borders in 2000 the area of the municipality was increased beyond the five traditional towns to include the farming area and the villages were no cost recovery was performed in the past. The increase in the municipal area necessitated an increase in the capacity of the administration and council to deal with the increased responsibility. This came in the form of increased number of officials and councilors. Additional to this there was an increase in the remuneration of both officials and councilors. However the increased capacity of Council was not met by a corresponding increase in its revenue. In order to help the municipality deal with its increased challenges two major grants were allocated to it. The first is the Municipal Infrastructure Grant.

GTM DRAFT IDP 2009 - 2010
109
This grant is meant to assist the municipality in dealing with the problems of infrastructural backlogs mostly in rural areas. The major disadvantage of this grant is that it does not make provision for maintenance of that infrastructure. In fact it means that the procurement of new infrastructure funded by MIG will effectively reduce the amount of money the municipality has at its disposal for other services. The second grant is the Equitable Share. This grant is meant to help the municipality in funding the cost of providing basic services to indigents. The cost of providing basis services is composed of both a direct and indirect component. The equitable share is equivalent to the amount of money Council raises by charging consumers for the cost of the services they have consumed. This is in respect of trading services. For all other non-trading services i.e. non-metered services where direct consumption cannot be determined the municipality charges residents property rates based on the value of their properties to fund these. Examples of non-trading services are roads, library services, parks, cemeteries, community facilities, municipal administration, etc. For this purpose a valuation roll is prepared which will determine the amount of money that residents must be charged. The valuation roll has however been drafted only for the areas where there is cost recovery. Therefore no property rates are being charged in the rural areas. This invariably means that the municipality is not raising sufficient funding to cover the cost of all its non-trading services. This is due to the fact that those services now have to be rendered in the areas where there has been cost recovery and in the new areas added to the municipality. This will result in services of substandard (or no services at all) being rendered in those areas or reduced level of services in the whole municipal area (as the amount that was raised to fund non-trading services in cost-recovery areas now has to be used for services in the whole municipal area.) There is therefore a need to institute some form of cost recovery and tax in these areas to ensure that the level of service delivery can be expedited. The major challenge with this is that the areas fall under the traditional leaders who area already having some sort of levy charged on their people. Introducing another tax might therefore be met with some form of resistance, either from the people or the traditional leaders. Extensive consultations need to be done with the traditional leaders and the community for them to understand the benefit of this approach and maybe a mechanism worked out through which only one tax can be levied to cater for the needs of the municipality and the traditional leaders. However this should be done taking cognizance of the fact that only the municipality has the authority to levy tax and surcharges, other than those already covered by some other legislation, in its area of jurisdiction.
13.2 Context of financial management
13.2.1 Financial viability
The objective is to ensure financial viability of the municipality that will lead to better service delivery. Financial viabi lity is by and large measured by the following indicators:
National KPI‟s * Debt coverage – This ratio is meant to indicate how well the municipality can service its loan repayment obligations from its own revenue (i.e. excludes grants) * Outstanding debtors to revenue – This ratio is meant to give an indication of the percentage of total outstanding debtors to actual service revenue. * Cost coverage – This ratio measures how well a municipality‟s cash and cash equivalents cover its fixed operating costs
Ability to meet its obligations when they fall due – The municipality has never defaulted on any of its financial
obligations and has never had a financial dispute with any organ of state or any institution. However as part of

GTM DRAFT IDP 2009 - 2010
110
normal business practice the municipality arranged for an overdraft of R 20 million to use during periods of low
cash inflows or high cash outflows. The MFMA however provides that all overdrafts must be paid off at the end
of the financial year. At the end of the 2007/2008 financial year the municipality however still had an overdraft of
R5 million. A plan has however been drafted to ensure that this is fully paid off. However the problem that led to
the negotiation for an overdraft is still there. This was the high level of fixed costs that the municipality had. This
is currently standing at around 80%. The only way of dealing with high fixed costs is to contain them and to
increase revenue.
These ratios for the 2007/2008 financial year were as follows: As can be seen from the outstanding debtors to revenue ratio the municipality has very high amount of outstanding debtors. Most of this debt is for the townships of Lenyenye and Nkowankowa and has accumulated over a number of years. As indicated earlier, most of it was due to disputes over the amounts charged which resulted in non-servicing of such accounts. As at 31 July 2008 the total amount of debtors outstanding was R132 million with 54% of this being outstanding for more than 120 days and therefore raising doubts about its recoverability. Of the total amount outstanding 65% was for the towns of Lenyenye and Nkowankowa and with 65.4% of that being outstanding for more than 120 days. This should however be seen in the light of the fact that the average monthly collection rate as at 30 June 2008 for the other towns, which make up about 80% of the total income of the municipality, was 99% while for Nkowankowa and Lenyenye it was 33% and 43% respectively.
13.2.2 Legislative compliance
GRAP/GAMAP conversion: The municipality was a pilot municipality for the conversion to GAMAP/GRAP and
fully converted from IMFO standards in 2003/2004. The municipality has since been preparing its financial
statements on the GAMAP/GRAP standards. The conversion has however led to the municipality experiencing a
backlog in terms of audit reports. The result of this is that any errors picked in one audit cannot be corrected
before the next audit commences. For the three financial years ending 30 June 2006 the audit opinion on the
municipality‟s financial statements was a disclaimer. Most of the issues with regards to the disclaimer pertained
to disclosures as required by the new accounting standards.
Establishment of budget and treasury office: a budget and treasury office has been established under the direct
supervision of the CFO.
Establishment of Supply Chain Management Unit: The unit has been established and is reporting directly to the
CFO
Adoption of financial policies: The following policies have been adopted by Council and are reviewed annually as
part of the budgetary process: *Credit control and debt collection policy *Indigent policy *Tariff policy *Property
rates policy *Budgeting policy *Investment policy *Supply Chain Management Policy
13.2.3 Challenges
Limited tax base: While the municipal area has increased the tax base of the municipality has not increased
proportionally. This is due to the fact that most of the area of the municipality is rural with vast numbers of
residents being indigent. The increase in the municipal areas also necessitated a review and increase in the
governance structure of the municipality. This is one of the factors that have led to increased fixed costs.

GTM DRAFT IDP 2009 - 2010
111
Low maintenance on capital assets: Very little has been reinvested in the infrastructure of the municipality over
the years. This was due to the limited resources of the municipality and a need to spend the available resources
on new capital assets. While in the short term this spending pattern will satisfy the needs of the community for
new capital assets it is a serious threat to the long-term financial viability of the municipality. This is due to the
need to replace assets that are deteriorating at a fast rate due to non-maintenance.
Large rural area with infrastructural backlogs: Vast area of the municipality is largely rural with very limited
infrastructure.
Funding for filling of positions in critical areas: While the municipality already has high fixed costs it is accepted
that there are still critical personnel shortages in the service departments and the newly established Supply
Chain Management unit.
Unidentified indigent residents: there is an indication that most of the residents in the areas where there is cost
recovery are indigent. This is evidenced by the high number of accounts that are not being serviced despite
termination of services. The challenge faced is however with the identification and registration of these indigents.
Previous attempts to register them did not bear much fruit as there was a perception that the information
gathered was going to be used to identify defaulting residents and to take action against them. This led to most
of the deserving residents not coming forward for registration.
13.2.4 Interventions
Critical need to increase the tax base of the municipality.
Need to come up with an infrastructure investment plan that will adequately address the issue of reinvesting in the capital assets of the municipality.
Identification of alternative methods of financing and forming partnerships with relevant stakeholders in both the public and private sector to assist with the financing of infrastructural assets.
Identification, registration and assistance to all indigent households Strict credit control and debt collection in the two towns together with publicity drive to motivate residents to pay for
services.
14. ENVIRONMENTAL ANALYSIS
Planning for sustainability has become a very important aspect of Environmental Management in this era where Global warming has started to take effect, the depletion of natural resources and environmental pollution is taking place at an increased scale. We are seeing the re-emergence of communicable diseases that are associated with living conditions. The first step in planning for sustainability is to identify Environmental issues; their impacts then develop an Environmental management Plan to mitigate same. The following are Environmental Issues identified: 14.1 Illegal Sand Mining The increase in infrastructural development including the development of low cost housing as well as other construction related
development has resulted in an increase in sand mining. These developments contributed to the illegal sand mining in local rivers.
These two activities result in the altering of the bed, banks, course and characteristic of the river. It also results in an irregular
landscape.

GTM DRAFT IDP 2009 - 2010
112
14.2 Land Pollution There is indiscriminate dumping of household, commercial refuse and building rubble in Tzaneen, Nkowankowa, Lenyenye and Haenertsburg. Illegal dumping sites exist in the following villages: Gabaza, Tshamahansi, Kubjana, Mopye, Motupa and Thako. A total of 7673 households are affected.
14.3 Air Pollution From January to December 2006 there were 40 000 license renewals and 10 000 new registrations coupled to the recent traffic count results on the R71 the exhaust fumes and particulate matter from the vehicles contribute to air pollution. The conversion to unleaded fuel also helps somewhat to reduced the ambient Carbon monoxide and particulate matter. There are +134 source and non source emitters in the area which will be dealt with in terms of the NEMA: Air Quality Management Act. Construction and mining activities also contribute to air pollution The house hold energy source also contributes to air pollution importantly so indoor air quality, such as the use of candles and paraffin lamps for light, wood fires for cooking as well as gas and paraffin stoves 14.4 Water Pollution Recent developments in Tzaneen town have a direct impact on water quality as the proper functioning of wetlands and streams are interfered with during the construction phase of township establishment and the development of commercial sites. The establishment of an informal settlement on the Letaba River bank has an immediate and direct impact on the water quality as well as river line status. Improper location and construction of pit latrines and septic tanks in environmentally sensitive areas – Clear Water Cove near Ebenezer Dam; the emptying of septic tanks and disposal of effluent in Letsitele; and the location of a grave yard in an area with a high water table in Lenyenye have an impact on the water quality. Storm water management s was without screening devices, which permitted debris access to the rivers. The state of rivers report from Department of Water Affairs and Forestry rated pollution in the local rivers as fair. To determine the water pollution level index, 112 Bacteriological samples of water for domestic use, and 6 chemical samples of water from the land fill site were collected and analyzed during the period February 2007 to July 2008. Water quality management plays a significant role in pollution prevention; the operation and maintenance of sewer purification plants are significant in this instance since they have to ensure that the final effluent discharged into rivers does not contribute to water pollution. 14.5 Loss of Bio-diversity We have one of the highest levels of biodiversity in the country, but the general state of biodiversity and eco system functioning is not good. The human pressure has resulted in activities like deforestation, veld fires, over grazing, invasion of alien plans, agricultural practices (excessive use of pesticides and fertilizers), uncontrolled use of wetlands and illegal occupation/squatting have contributed to land degradation in the Greater Tzaneen Municipality area. During the period 14.6 Energy consumption The primary environmental impact of electricity consumption is the production of greenhouse gases that contribute to global warming. Total emissions of greenhouse gases are electricity generation, and 35% of this was from residential use. Electricity supply and consumption has reached a point where it impacts directly on the consumer, persistent power cuts or load shedding in some areas result in the increased reliance on wood for energy.

GTM DRAFT IDP 2009 - 2010
113
15. DISASTER MANAGEMENT
For Disaster Management to be effective, it is important that all concerned parties be made aware of its provisions and that every official, role player, and department and personnel be prepared to carry out their assigned functions and responsibilities before, during and after emergency. The following paragraphs provide an overview of the background and some of the highlights of this plan. Disaster Management serves to confirm the arrangements in the Greater Tzaneen Municipality Disaster Management approach to effectively prevent disasters from occurring and to lessen the impact of those hazards that cannot be avoided. Disaster Management is a continuous and integrated multi-sectoral and multi-disciplinary process of planning and implementation of measures aimed at disaster prevention, mitigation, preparedness, response, recovery, and rehabilitation (Disaster Management Act 2002) The preventative elements of this plan must be implemented and maintained on a continuous basis. The emergency or reactive elements of Disaster Management will be implemented in the Greater Tzaneen Municipality whenever a major incident or disaster occurs or is threatening in its area of jurisdiction. The responsibility for the coordination of the overall implementation of Disaster Management is that of the Head of the Disaster Management Centre.The Disaster Management Act requires the Greater Tzaneen Municipality to take the following actions:
Prepare a disaster management plan for its area according to the circumstances prevailing in the area.
Co-ordinate and align the implementation of its plan with those of other organs of state and institutional role players, and
Regularly review and update its plan.(section 48)
The Greater Tzaneen Municipality must submit a copy of its disaster management plan, and of any amendment to the plan, to the National Disaster Management Centre and the Disaster Management Centre of the Limpopo Province. Emergencies are defined as situations, or the threat of impending situations abnormally affecting the lives and property of our society. By their nature, or magnitude these require a coordinated response by a number of role players, both governmental and private, under the direction of the appropriate elected officials. They are as distinct from routine operations carried out by role players as normal day-to-day procedures, e.g. fire fighting, police activities, normal hospital and ambulance routines. Most peacetime natural man-made disasters/emergencies could occur in the geographical area of responsibility of the Greater Tzaneen Municipality. Those most likely to occur are:
Windstorms
Floods
Epidemics
Transportation accidents
Air or rail crashes
Toxic or flammable gas leaks
Electric power blackouts
Building or structural collapse
Uncontrollable fires
Explosions

GTM DRAFT IDP 2009 - 2010
114
Breakdown of essential services / supplies, or any combination thereof.
The aim of the Greater Tzaneen Municipality Emergency Plan is to outline a plan of action for the efficient deployment, and co-ordination of the Municipal services, role players and personnel to provide the earliest possible response in order to:-
Protect and preserve life and property
Minimize the effects of the emergency or disaster on the Greater Tzaneen Municipality; and
Restore essential services
15.1 Analysis The current situation with reference to Disaster Management is that 95% of the population in the Greater Tzaneen Municipality area is totally ignorant towards Disaster Management. Only some residents of the previously developed towns (e.g. Tzaneen, Haenertsburg, and Letsitele) know a little about Disaster Management. The other factor that must be taken into consideration is that Disaster Management is completely different to the previous Civil Defense Act. The main purpose of Disaster Management is the prevention or mitigation of a disaster, and previously Civil Defense was the actions taken after a disaster has occurred. 15.2 Back Log The total community of the Greater Tzaneen Municipality area, with the exception of a few businesses and special event organizers are currently in the dark about Disaster Management. To try and address the backlog, Disaster management training on preparedness, river flood lines, response and identification of risks and hazards was given to:
1. Ward committees 2. Ward councilors 3. Hospitals 4. Community development workers 5. Businesses entities
Electricity Load shedding have also put emphasis on necessity of emergency plans, preparedness and continuous planning to deal with secondary risks and effects.
21.10 SAFETY AND SECURITY The following institutions are situated in the Greater Tzaneen Municipal jurisdiction area:
a) Six (6) Police Stations ( Each with holding cells)
b) Three (3) Satellite Police Stations
c) Prison (1)
d) Three (3) Magistrate Courts
Nkowankowa
Lenyenye
Tzaneen

GTM DRAFT IDP 2009 - 2010
115
e) Traditional Authorities courts with limited jurisdiction:
KGOŠI/KGOŠIGADI or Hosi of that specific tribe. Though it is not municipal functions, these institutions assist Council in ensuring sound governance, by curbing crime and effecting justice to the communities. Greater Tzaneen Municipality is responsible for securing Council properties. To this effect private security firm are utilized to collect money and safeguard property

6. PHASE 2- DEVELOPMENTAL STRATEGIES
PHASE 2: DEVELOPMENTAL STRATEGIES
Background
The purpose of strategic planning is to ask important questions about the future. What will the future look like? What will the Municipality need to do to succed? How will it know if it has been successful? What are the challenges it will be facing: Will it be ready for those challenges: The Municipality‟s strategic plan is the answer to these questions. The plan establishes one unified goal that places emphasis on priority, focused, fair and equitable services and benefits to the community. The strategic objectives of a Municipality contain the indicators it needs to achieve its goals with timelines and identified methods to determine its success. There is no way to predict the future, but it is possible to identify and forecast the forces of change shaping the entity and the challenges facing the District in helping Greater Tzaneen Municipality achieve its mission, objectives and management initiatives The strategic plan is our municipality‟s response to the identification of those challenges. The plan takes an enterprise approach while focusing on results, indicators with measurable performance metrics. It is a fluid and flexible document capable of adapting to changing programmatic priorities. During the next financial year (2009/2010) Greater Tzaneen Municipality will concentrate on meeting the objectives identified in this strategic plan. It will strengthen its partnership with both private and public institutions and community-based organizations. It will work closely with the District in ensuring that the local area meets its strategic objectives. It will conduct workshops and provide technical assistance to performance management co-ordinators, municipal officials, Councillors and Ward Committee members so that they fully understand their roles in implementing the strategic goals of the Municipality It will work to achieve more efficient administrative machinery that will articulate the vision and implement key projects and programmes which will move the Municipality forward. The Municipality will work proactively to strengthen its partnerships with community, public, and private organisations, as well as create new partnerships with these entities. The importance of an environment that allows all employees to be successful in meeting the Municipality‟s objectives cannot be understated. To that end, the Greater Tzaneen Municipality will better inform the workforce of the benefits of alternative methods of resolving workplace and programmatic challenges. The Municipality‟s employees are pivotal to assuring its success in accomplishing all that it has set out to do during the next few years. It is imperative that its employees possess the necessary skills to be successful. Executives and managers play critical roles in achieving results and ensuring that staff members are fully aware of their responsibilities for implementing the strategic plan. It will also achieve its strategic objectives by striving to address the real, critical aspects and constraints that are keeping the municipality from moving forward. It is the strategic plan and the metrics established that will enable it to gauge its success and allow the Municipality the opportunity to adjust and modify its strategies so that it can continue to deliver the best possible performance for the employees as well as Greater Tzaneen community.

117
3. Strategy The Constitution of the Republic of South Africa (1996) states that the delivery of services to communities in South Africa must take place in a sustainable manner. This strategic plan beams in on major internal and external factors and developments that will enable it to achieve the goal of sustainable service delivery. It in essence describes how the Municipality‟s planning process affects the set of strategic issues that compete for decision-makers‟ attention. In the final analysis strategy involves choosing which interventions will benefit the municipality and its communities the most. Such decisions will commit the municipality to specific interventions and development programmes. A well developed strategy will assist the Municipality in developing a focused and disciplined organisation that directs its energy towards the implementation of the right things at the right time. 4. Focus Areas The following areas need urgent interventions and are included in the Scorecard at the end of this strategic document. Financial Constraints Financial constraints within the institution impact heavily on its ability to implement and deliver on its outputs. The limited financial resources that are available must therefore be optimally utilised. Methods of increasing the financial base of the entity must furthermore be investigated and deployed as a matter of urgency. Strategic financial solutions must be formulated in order to transform the Municipality‟s financial and accounting function into a strategic business entity by the roll-out and implementation of the tactics as contained within the Internal Financial Recovery Plan. Critical aspects that must be addressed and resolved are:
The use of overdraft facilities
Conditional grants that are not cash-backed
The inability of the Municipality to meet its financial obligations.
Financial management should be fully integrated into the strategic decision-making process
Focus should be on evaluating strategic opportunities, costing thereof and detailed planning for implementation
The need to develop a real-time reporting system that produces financial information which allows decisions to be made between reporting periods
Develop comprehensive strategic business plans for each functional programme within the organisation
Implementation of performance based budgeting to rationally allocate resources
(people and capital) to achieve strategic objectives and strategic outcomes Fixed Costs The major problem related to costs is that 79% of the municipality‟s costs are fixed. The municipality has over the years committed to costs which have now become problematic and a stumbling block for the municipality. The strategic focus now is for the municipality to strategically plan and substantially reduce some unnecessary fixed costs by not renewing existing contracts with service providers. The ultimate goal here is to reduce total costs over the short, medium and long

118
term. Key performance indicators should then be attached to review progress in terms of percentage reduction in fixed costs at any one given time. Budget The budget should speak to the implementation of projects aimed at addressing community needs and expectations in order for the organisation to achieve its vision. Expenditure should concentrate on service delivery through the implementation of capital projects and on the maintenance of municipal infrastructure. There is furthermore a need to identify, cost and quantify or estimate soft issues/day to day activities that affect the budget. If budgets are not compiled systematically the likelihood of budget constraints surfacing is imminent. Baseline information is a critical component of the budgeting process. The municipality‟s budget should in essence address community needs as contained in its vision. The identification of “zero based budgeting” as a strategic project will propel the municipality towards better implementation of its strategy. The budget implementation process must be aligned and communicated once it has been approved by council. Greater Tzaneen Municipality can achieve efficiency, effectivity and economy by downsizing so that more can be done with less. Funds are not being spent on strategic issues, which is a challenge that is adversely affecting management systems. Coming out strongly from the deliberations was a proposal that „needs‟ be quantified with the available funds, and for baseline information to be established in this regard. It should furthermore be made a strategic project. It was also noted that unplanned activities were authorized and there seemed to be no-one taking responsibility for such authorisations. The following insights will offer management strategic direction in crafting an effective budgeting system (Performance Based Budgeting) for the local municipality:
Planning is the hard part
When it‟s done well, budgeting and measurement are easy
Effective planning identifies what is important and what’s not
The utilisation and implementation of a prioritisation model to determine and identify priorities
Budget is the quantitative representation of what‟s important
All resource allocation decisions should support what is important Financial Plan There is no credible Five Year Financial Plan which must complement the infrastructure plan. Strategic options which will assist in overcoming this problem should be assessed and implemented; for example, identifying areas of potential within the LED Strategy to invest where growth is going to take place. Strengths that can be used must be indicated in the LED Strategy. The Financial Plan establishes the direction for Greater Tzaneen Municipality‟s programs and services. It represents the synthesis of Council guidance and staff recommendations on how to best accomplish strategic objectives and respond to community needs in accordance with available resources, established policies, and sound administrative practices. The following key strategic considerations should be taken into account when drafting the Five Year Financial Plan: Budgeting for and reducing recurring expenditures.
Ongoing revenue monitoring during the year.
Reserves

119
Long term financial forecasting.
Adapt budget to financial policies.
Provide for new funding.
Limit the impact of budget reduction.
As the economic outlook is uncertain, the plan needs to be monitored in order for action to be taken in response to potential unforeseen issues. In addition, staff will continue to
explore other strategies to address the long term issue of expenditures increasing faster than revenues.
Organisational Climate The current organisational environment seems not to be conducive for the implementation and execution of resolutions taken. The Greater Tzaneen Municipality has well established systems, policies and procedures to guide implementation, but the lack of following these are having a serious, demoralising effect on the workforce. There is an urgent need to boost morale within the municipality‟s workforce through the establishment of a culture of discipline. Senior management should instill organisational values of:
Commitment
Integrity
Accountability Leadership and Strategic Focus Management commitment is imperative if the Municipality is to recover its strategic purpose to deliver on its mandate as enshrined in various legislative prescriptions. The lack of a strategic approach and strategic focus (areas) will need to be addressed as a matter of urgency. Political leadership is also needed. Passionate and visionary leadership will thus be a core ingredient needed to oil the management team in its continuous drive to establish and maintain a culture of excellence. Methods of addressing shortcomings and limitations There is a need for synergy and direction within the management team so that everyone buys into the same objectives in order to take the institution forward. Management needs to take the lead in creating a culture of discipline. This would include convening regularly to strategically analyse stumbling blocks and address leadership problems that are currently impacting on the municipality‟s ability to perform and deliver services. It was suggested that champions be appointed to drive and tackle the leadership crisis. There should be a Strategic Thrust Team to see to it that what was undertaken has been achieved and to identify bottlenecks and constraints. A recommendation was made that problems of the past be noted and to make a conscious decision to address these and move forward into the future. There was a generally strong and positive consensus that the local municipality is now geared for a major breakthrough.

SWOT ANALYSIS
The SWOT analysis is a strategic planning tool used to discuss and evaluate the Strengths, Weaknesses, Opportunities, and Threats in the Municipality. It identifies the internal and external factors that influence the strategic intent. SWOT analysis is a tool for analysing the internal and external environment of the Municipality and generally is one ofthe first stages of strategic planning and helps the local municipality to focus on key issues.
STRENGHTS WEAKNESSES OPPORTUNITIES THREATS
Skilled operational workforce Poor planning and alignment (IDP/Budget/PMS/SDBIP)
Tourism HIV/AIDS
Admin. IT and communication infrastructure
Budget implementation Agriculture Climate change and Natural disaster
Acceptance creditor rating Clear delegation of powers Minerals Land management, land claims processes, informal settlements, illegal immigrants, tribal land
Policies and sysyems in place Communication Industrial development Unemployment
Political Support Working in silos, project teams Transport Crime
Work relations Time management, motivation and discipline Economic development Global Economy
Supply chain management Fresh produce market Inadequate bulk supply of water and electricity
Revenue collection, fixed costs, implementation of financial recovery plan (Financial viability)
Potential Revenue Base Loss of qualified staff
Management and Monitoring of implementation of Coincil resolutions and policies
Partnerships Non-delivery by sector departments
Leadership, decision-making, commitment, change management
Devolving of functions (trade licences
Office space Commercialization of air field
Vacancies in strategic positions Development of Council land by Municipality
Integration of management information GTEDA
Lack of strategic focus areas and allocation of funds
Mamitwa Dam, Raising of Tzaneen Dam wall
Infrastructure capacity and maintanance

In analysing the SWOT some areas can be grouped together into definite “pains and enablers” that we call Key Priority Focused areas. The Key Prioritised Focused Areas can be grouped as follows:
PAINS ENABLERS
No synergy and direction from management team-planning, co-ordination, implementation (champions, monitoring
Intergovernmental relations
Culture of discipline – decision taking Public/Private partnership
Financial viability Filling of critical positions with capacitated people
Infrastructure provision and maintenance Training and internal skills transfer
Management Information system Master/sector plans
Help desk and customer care Functional supporting services (supply chain)
Communication, branding Project and contarct management
Risk management )Protection of IT, information, internal information, security, personnel information, audit, declaration of interest
Integrated Development Planning process (IDP, PMS, Budget, Public Participation
The above pains and enablers are a combined reflection of the SWOT that enables the Municipality to build strategies in terms of the IDP requirements. They are in turn used to create the Strategy Map 1. Vision and Mission
A vision is a compelling picture of the future. It involves the heart and minds of the employees of a municipality or area to motivate them towards co-operation to create the idealised picture. The delegates for the Greater Tzaneen Municipality reviewed and confirmed their vision, as follows:
"To be the fastest growing economy in Limpopo where all households have access to sustainable basic services" A mission describes the purpose of a municipality. It describes the focus for the local municipality and can be seen as the core purpose for its existence The mission addresses the objects of local government as stipulated in Section 152 of the Constitution that is based on: democratic and accountable governance; sustainable services; social and economic development; safe and healthy environment; and which encourages community involvement. It also supports the key provisions of the Systems Act that are to: “provide for the core principles, mechanisms and processes that are necessary to enable municipalities to move progressively towards the social and economic upliftment of local communities and ensure universal access to essential services that is affordable to all.” Tzaneen‟s mission is as follows:
“To stimulate economic growth through sustainable, integrated service delivery and partnerships”

122
Values
Values underlie behaviour. They therefore guide the behaviour of all people within the Municipality towards the achievement of the mission and ultimately the vision of the Municipality. A discussion yielded a set of values deriving from the organisation‟s vision and mission:
Commitment
Integrity
Accountability 2. Methodology
The Balanced Scorecard methodology is used to develop a sound strategy for organisations to ensure that they achieve their objectives, indicators and projects. Balanced Scorecard is a unique approach to strategic management that was developed in the early 1990's by Drs. Robert Kaplan and David Norton. Fortune 500, through a recent study, has indicated that over 65% of private and public organisations worldwide use the Balanced Scorecard methodology to improve performance. The Balanced Scorecard is a format for describing activities of the Municipality through a number of measures for each of four perspectives (Community Satisfaction, Financial Results, Internal Processes and Learning and Growth). It is a management system (not only a measurement system) that enables organizations to clarify their vision and strategy and translate them into action. It provides feedback around both the internal business processes and external outcomes in order to continuously improve strategic performance and results. When fully deployed, the Balanced Scorecard transforms strategic planning from an academic exercise into the nerve centre of an enterprise. The strategy map, development of strategic objectives, Key Performance Areas (KPA‟s), results, indicators, programmes and projects were all developed in line with the Balanced Scorecard methodology. 3. Strategy Map
A strategy map is a picture of the strategy of the municipality. It depicts the objectives in support of the strategy in terms of different perspectives, namely the Learning perspective, Institutional perspective; the Financial and the Customer perspectives. This step in strategy formulation acts as the integration of strategy and operational planning. The following are the most important benefits of developing a strategy map:
It focuses on the most important institutional processes that need to be addressed;
It combines a growth strategy as well as a productivity/excellence strategy enablingthe organisation to attain its vision in a sustainable manner;
It creates a foundation to be innovative;
It focuses on both the tangible as well as intangible aspects; and
It forces change - to do things differently. The strategy map‟s methodology is aimed to steer away from a sectoral approach to ensure integrated development of the needs of the municipality. The strategy map leads to the development of Scorecards at different levels that will be used as the measurement tool. This approach aims to ascertain whether the Municipality has made any progress towards attainment of its strategies and the objectives as identified. A good strategy map focuses on the strategic logic between cause and effect relationships and between current activities and long-term success.

123
Table 29: Diagram 1 – STRATEGIC MAP (Next page)


125
The strategy map as shown above identifies the objectives that the Greater Tzaneen Municipality will aim to achieve. The strategy map clearly indicates the two different strategies - growth and excellence – through the colours used for the different strategic objectives. 4. Strategic Objectives Using the perspectives of the Balanced Scorecard methodology, the strategy Map was developed by focusing on the Learning and Growth Perspective as point of departure:
Develop a high performance culture for a changed, diverse, efficient and effective local government – In order to achieve this objective a comprehensive programme for reforming management and accountability will have to be established. The main focus is improving internal management to enable the municipality to perform its core functions efficiently. However, organisational efficiency in itself will not deal with themore challenging problems of effective governance confronting the Municipality. In the future, management reforms will need to address management deficit or shortcomings by building capacities to improve the effectiveness of policy networks and steer structural change.
Develop and build skilled and knowledgeable workforce – This is a basic need that requires the municipality to focus effort and resources on programmes and projects that will uplift the intellectual capabilities of all of its officials. It will also enable the municipality to more effectively focus on the „bigger picture‟ and to achieve its strategic intent.
Attract and retain best human capital to become employer of choice – The local municipality will have to change not only its method of service delivery, but also its approach to recruiting in order to hire and retain good employees. Retaining employees is one of the key components of staying efficient, effective and economic and avoid all the negative impacts of running the municipality without the human capital that is required. One of the answers is for the local municipality to strive to become an Employer of Choice. A relatively new term, it describes employers who attribute high value to its human resources. They strive to make their organisation the best place to work. Because of a commitment to taking a strategic approach to attracting and retaining staff, they enjoy the benefits of higher productivity, morale, and retention levels; and a brand that is recognised as being the best in the district. Once employees have been trained, skilled and capacitated, focussing on outcomes of improvement of both service delivery and individual performance, the institutional process will be addressed by focussing on the following objectives:
Integrated developmental planning – Local municipalities in South Africa have to use "integrated
development planning" as a method to plan future development in their areas. Apartheid planning left us with cities and towns that have racially divided business and residential areas that are badly planned to cater for the poor, with long travelling distances to work and poor access to business and other services, sprawling informal settlements and spread out residential areas that make cheap service delivery difficult. Rural areas were left underdeveloped and largely unserviced. The new approach to local government has to be developmental and aims to overcome the poor planning of the past. Integrated development planning is an approach to planning that involves the entire municipality and its citizens in finding the best solutions to achieve good long-term development. An Integrated Development Plan (IDP) is a “super plan” for an area that gives an overall framework for development. It aims to co-ordinate the work of local and other spheres of government in a coherent plan to improve the quality of life for all the people living in an area.
Improve access to sustainable and affordable services – The overarching vision of South Africa is „To improve the well-being of its citizens.” In this light it is important for the Municipality to strategically focus on:

126
Securing a supply of housing for local people at affordable levels
Creating the conditions for growth and maintenance of quality economic activity
Maintaining its distinctive environment whilst enabling access and sensitive
development
Maintaining a clean environment
Working with others to improve access to basic services
In providing these functions, the municipality works with councillors and politicians to capitalise upon the local distinctiveness of the area and to promote sustainable growth and development.
Maintain and upgrade municipal assets – For strategic, operational and financial reasons, asset management is becoming an increasingly important area of decisionmaking for the municipality. New demands for better service provision, potential synergies and changing roles in the public and private sectors are creating the need for better management and accountability of municipal resources. Open and effective management and reporting of public property and resources is an important aspect of public trust. There is a new and heightened interest in the strategic role that asset management can have for municipalities and their residents. Maintenance andupgradin local communities in the attainment of local service delivery goals. Municipal asset management is the process of inventory, valuation, use, strategic portfolio reviews, reporting and auditing of municipal assets.
Effective and Efficient Administration – To improve effectiveness and efficiency, standardised policies and
procedures need to be established. This will lead to open and transparent decision-making and sound governance practices. Effective and efficient administration will advance the utilisation and allocation of financial resources within the Municipality. Once the Institutional Processes have been improved and efficiency and effectiveness of the municipality has increased, the following objectives will attend to the Financial Perspective within its strategy:
Create a stable and enabling economic environment by attracting suitable investors – It is important for the municipality to have qualified personnel who will be able to run a sound financial system. This will ultimately culminate in the generation of financial statements which reflect on bankable projects into which suitable investors will be able to buy. The main focus areas for local economic development will be structured around agriculture, tourism, enterprise development and support with the main aim being to contribute to the socio-economic development and growth of the municipalarea.
Optimise infrastructure investment and services – In order to become an effective and efficient area, urgent attention needs to be paid to the provision of services (as per Constitutional requirements) to improve the accessibility of services to all members within the local area. Now is the time for Greater Tzaneen Municipality to develop a long term plan on how to focus utilisation of resources to best suit the strategic intent of g of municipal assets can be managed directly or indirectly for the benefit of the organisation and to develop a plan to ensure all households do have access to sustainable basic services.
Increase financial viability – Greater Tzaneen Municipality will need to improve its financial viability to ensure optimal utilisation of financial resources. The enhancement of revenue combined with the reduction of outstanding debtors should provide a platform for the Municipality to move forward.
The economical and effective utilisation and allocation of financial resources will ultimate lead to the attainment of the following objectives on the Community Satisfaction perspective:

127
Create community beneficiation and empowerment opportunities – The Municipality should continuously search for ways to generate economic activities and initiatives which will benefit and empower the local community
Promote environmentally sound practices and social development – This objective will ensure that programmes and projects implemented by the municipality will be focused on sound environmental practices. This objective ensures that the Municipality does not neglect or forget the role it is playing in the upliftment of the social environment of communities within the municipal area.
Develop effective and sustainable stakeholder relations - Developing an environment where both internal and external stakeholders play a pivotal role will certainly fuel growth and long term benefits to all role players. The involvement of all stakeholders will be essential for the attainment of the vision of the Greater Tzaneen Municipality and the establishment of public/private partnerships will be one of the channels that will move the Municipality forward.
Focusing on the above objectives will enable the Municipality to strategically focus on what areas and aspects must be addressed to become better equipped and capacitated and thereby enabling the municipality to focus on efficiency, effectiveness and economy. 5. Results, Indicators, Projects
The objectives that were identified were transferred to worksheets in order to develop the results, programmes and projects as well as the indicators that will be used as measurement for each. (Appendix B). Results are the ultimate impact that we would like to see with regards to the
objective Strategic projects are the specific initiatives undertaken by the municipality to support the objective. Strategic Key Performance Indicators (KPI‟s) are measurable results of the objectives, projects and
programmes. Key Performance Areas The Department of Provincial and Local Government (DPLG) has identified Key Performance Areas (KPA‟s) whereby the National Strategic Agenda can be implemented and monitored on a provincial level as well as on a local governmental level. Of critical importance for the municipality will be to link its strategic plan to the Strategic Agenda of National Government. The table below provides the detail whereby the strategic objectives of the Greater Tzaneen Municipality can be linked to the five KPA‟s as stipulated by the DPLG.
DPLG KPA STRATEGIC OBJECTIVES
Municipal Transformation and Organizational Develeopment
Integrated Development Planning Develop a high performance culture for a change,
diverse, efficient and effective government Develop and build a skilled and knowlegeable workforce Attract and retain best human capital to become
employer of choice
Basic Service Delivery Promote environmental sound practices and social development
Optimize infrastructure investment and services Improve access to sustainable and affordable services Maintain and upgrade municipal assets

128
LED Create community benefication and empowerment opportunities
Create a stable and enabling environment by attracting suitable investors
Municipal Financial Viability and Management Increase financial viability
Ggood Governance and Public Participation Develeop effective and sustainable stakeholder relations Efficient and effective organization
Programmes will be translated to the correct Key Performance Areas. The KPA‟s will also be taken through for reporting and monitoring purposes according to the DPLG requirements. 13. Strategic Scorecard Linked to the Strategy Map of the municipality, a Strategic Scorecard has been drafted. The purpose of the Strategic Scorecard is for Council and the municipal Manager to focus on the real strategic measurements and projects that must be attained and implemented during the course of the next financial year. Strategic Key Performance Indicators are the measurements identified that will enable Council to ascertain whether the Municipality is moving towards the attainment of the strategic objectives as contained in the strategy map. Strategic projects are identified as those critical projects that the Municipality must implement to address the constraints as indicated in the table reflecting Pains and Enablers. Strategic projects are also projects that were identified as a “quick win” option to pave the way for implementation of other initiatives or projects. The Strategic Scorecard for the Greater Tzaneen Municipality is depicted on the next page. 14. Conclusion Direction givers and strategic thinkers are important in order to adapt to the changing environment and to take the lead in managing the change process within the municipality. The clear mapping of the municipality‟s strengths and weaknesses, opportunities and threats, linked to critical review, continuous dialogue and feedback will ensure a climate conducive for development of superior performance and set Greater Tzaneen Municipality on the road to recovery and prosperity. There is a need to drive towards implementing effective policies and development of strategies to establish a more favourable climate for development and investments. This will give priority to human resource development and promoting the further development of structures, systems and processes which will advance the developmental efforts of the municipality. Critical for the successful roll-out and implementation of strategies is the linking of these strategies to the operational implementation plans and putting in place a system that will enable Council and senior management the opportunity to monitor, measure and review progress against set targets. Such a monitoring and measurement system will enable the community of the Greater Tzaneen area to be kept aware of the performance and impact of service delivery of the municipality.

129
6. PHASE 3: PROJECTS 2009/10
PRIORITIZED PROJECTS
PRIORITIZED PROJECTS 2009/10 IDP Rural Projects 2009/10 IDP
Project No Project Name Project Output Dept Start date End date
Capex
Location Ward Sources of Funding 2009/2010
ESD Water Meters
Increase Revenue ESD 01/07/2009 30/06/2010 R 1,000,000.00 Dan and Mariveni 20, 23 Loan
ESD Rural projects
Improved roads ESD 01/07/2009 30/06/2010 R 11,000,000.00 All ward All wards Own source
ESD Mafarana to Sedan road
Improved roads ESD 01/07/2009 30/06/2010 R 10,000,000.00 Mafarana , Sedan 20, 25 Loan
ESD Lephephane, Khopo, Khujwana road
Improved roads ESD 01/07/2009 30/06/2010 R 10,000,000.00 Lephephane, Khopo and Khujwana
18, 34 Loan
ESD Morapalala road
Improved roads ESD 01/07/2009 30/06/2010 R 7,000.000.00 Morapalala 1 Loan
ESD Moruji, Thapane Road Improved roads ESD 01/07/2009 30/06/2010 R 7,000,000.00 Moruji, Thapane 7 Loan
ESD Humps in Mokgapene, Mariveni, Nkambako, Bolobedu South and Nwamitwa
Road safety ESD 01/07/2009
30/06/2010
R 1,000,000.00
Mokgapene, Mariveni, Nkambako, Bolobedu South and Nwamitwa
Own Source
MM Disaster Housing Provide housing in case of a disaster
MM 01/07/2009 30/06/2010 R 100,000 All wards All wards Own Source
EED Rural Electrification Delivery of a basic services to ensure access to households electricity
EED 01/07/2009 30/06/2010 R 5, 000, 000.00 Own Source
EED Rita turn-off Maake Street lighting
Safety for our communities EED 01/07/2009 30/06/2010 R 333, 333.00 Rita 30 Own Source
Nkambako four-way stop Street Lighting
Safety for our communities EED 01/07/2009 30/06/2010 R 333, 333.00 Nkambako 5 Own Source

130
EED Moruji, Relela Taxi Rank Street Lighting
Safety for our communities EED 01/07/2009 30/06/2010 R 333, 333.00 Moruji and Relela 7, 8 Own Source
EED Mokwati Cross Street lighting
Safety for our communities EED 01/07/2009 30/06/2010 R 333, 333.00 Mokwati 2 Own Source
EED Mafarana Taxi Rank Street lighting
Safety for our communities EED 01/07/2009 30/06/2010 R 333, 333.00
Mafarana
22 Own Source
EED Nwamitwa Taxi Rank Street lighting
Safety for our communities EED 01/07/2009 30/06/2010 R 333, 335.00 Nwamitwa 12
EED Refurbish Electricity distribution area
Improve the network to for effective distribution
EED 01/07/2009 30/06/2010 R 10, 000, 000.0 Tzaneen 15 Loan
Electrical Department Capital Projects 2009/10 IDP RURAL
Project No Project Name Project Output Dept Start date End date
Capex
Location Ward Sources of Funding 2009/2010
EED Rebuilding lines
Improved access to the network and availability
EED 01/07/2009 30/06/2010 R 3,300,000.00
EED Power Factor Correction equipment
EED 01/07/2009 30/06/2010 R 1,500,000.00
EED Ring Feeds
EED 01/07/2009 30/06/2010 R 700,000.00
EED Metering Unit EED 01/07/2009 30/06/2010 R 100,000.00
EED Capital Tools
EED 01/07/2009 30/06/2010 R 150,000.00
EED Auto recloser EED 01/07/2009 30/06/2010 R 800,000.00
EED Waterbok
EED 01/07/2009 30/06/2010 R 600,000.00
Electrical Department Capital Projects 2009/10 IDP TOWN
Project No Project Name Project Output Dept Start date End date
Capex
Location Ward Sources of Funding 2009/2010
EED Strategic Lighting
EED 01/07/2009 30/06/2010 R 400,000.00 Tzaneen
EED Street Lights EED 01/07/2009 30/06/2010 R 1,000,000.00 Tzaneen

131
EED Capital Tools
EED 01/07/2009 30/06/2010 R 500,000.00
EED Upgrading of HT Cables EED 01/07/2009 30/06/2010 R 950,000.00 Own Source
Electrical Department Capital Projects 2009/10 IDP CAPACITY PROJECTS
Project No Project Name Project Output Dept Start date End date
Capex
Location Ward Sources of Funding 2009/2010
EED Purchase transformer (1x20Mva 66/11kv Design Line and Sub, EIA, Purchase Land Build 6 km 66 Kv Overhead lines
EED 01/07/2009 30/06/2010 R 30,000,000.00 Own Source
EED Farm Labour Housing (545 connections) Electrification of Mafarana, Ntsako, Lefara and Mogwazeni
EED 30/03/2010 R 20.829,000.00 Mafarana, Ntsako, Lefara and Mogwazeni
DME
MIG Projects 2009/10 IDP CAPACITY PROJECTS
Project No Project Name Project Output Dept Start date End date
Capex
Location Ward Sources of Funding 2009/2010
ESD Pharare Access Road ESD 01/07/2009 30/06/2010 R 2,442,0001.00 MIG
ESD Ramotshinyadi Internal streets – Phase 1
ESD 01/07/2009 30/06/2010 R 4,846,565.00 MIG
ESD Tzaneen Rural Waste Removal – Phase 2
ESD 01/07/2009 30/06/2010 R 16,000,000.00 MIG
ESD Gavaza Access Road ESD 01/07/2009 30/06/2010 R 2,779,584.00 MIG
ESD Hweetsi Access Road – Phase 1
ESD 01/07/2009 30/06/2010 R 2,446,050.00 MIG
ESD Makhefora Access Road – Phase
ESD 01/07/2009 30/06/2010 R 3,037,200.00 MIG

132
PROJECTS
Income generation : √ Project for the disadvantaged : Р Other : ×
2009/10 IDP Projects
Project Number Project Name Project Output Dept Start date End date
Capex
Location Ward Sources of Funding 2009/2010
CFO002 Network upgrade Improved access to the network and availability
CFO
01/07/2009 30/06/2010 R 130,000 Civic Centre All wards
GTM √
CFO003 Datawarehouse implementation
Systems intergrated
CFO
01/07/2009 30/06/2010 R 300,000 Civic Centre All wards
GTM √
CFO009 Waste Information Management system
Effective management of waste
CFO
01/07/2009 30/06/2010 R 300,000 Civic Centre All wards
GTM √
CFO010 GIS implementation Increased revenue CFO 01/07/2009 30/06/2010 R 70,000 Civic Centre GTM √
CORP002 Purchase Zippel Cabinets CORP 01/07/2009 30/06/2010 R 60,000 Civic Centre All wards GTM ×
CSD020 Cemetery Management EIA and establishment of new cemeteries for Mavele and Lenyenye.
CS 01/07/2009 30/06/2010 R 200,000 Mavele and Leneyenye
6,31 GTM √
CSD021 Replacement of Redundant and old equipment
Purchasing of a ride on 10 lawnmowers & brush cutters
CS 01/07/2009 30/06/2010 R 80,000 All wards GTM √
CSD026 Purchase Zippel Cabinets CSD 01/07/2009 30/06/2010 R 60,000 Civic Centre All wards GTM ×
ESD022 Carport - Museum Development of a carport at the Museum
ESD 01/07/2009 30/06/2010 R 110,000 Civic Centre All wards GTM ×
ESD036 Letsitele Library ablution Build an ablution block at Letsitele Library
ESD 01/07/2008 30/06/2009 R 190,000 Letsitele 23 GTM ×
ESD109
Petanenge access road 1,3 km road ESD 01/07/2008 30/06/2009 R 127,272 Petanenge 24 GTM Р
ESD110
Lephapane access road 600m road ESD 01/07/2008 30/06/2009 R 84,000 Lephapane 34 GTM Р

133
ESD111
Babanana access road 1,8 km road ESD 01/07/2008 30/06/2009 R 392,000 Babanana 11 GTM Р
ESD112
Maribathema access road 3,5km road ESD 01/07/2008 30/06/2009 R 355,000 Maribathema 14 GTM Р
ESD113
Tzangeni Pump station 100m ESD 01/07/2008 30/06/2009 R 92,200 Tzaneen 14 GTM √
ESD114
Mokgolobotho access road 3 km ESD 01/07/2008 30/06/2009 R 693,764 Mokgolobotho 17 GTM Р
ESD115 Lusaka Access road 1,7km ESD 01/07/2008 30/06/2009 R 595,764 Lusaka 16 GTM Р
ESD116
Maake Clinic access road 1 km ESD 01/07/2008 30/06/2009 R 100,000 Maake 33 GTM Р
ESD117
Mokhubidung access road 1,5 km ESD 01/07/2008 30/06/2009 R 160,000 Mokhubidung 27 GTM Р
MM001 Purchasing of Office Equipment and Furniture
Condusive working environment MM 01/07/2009 30/06/2010 R 60,000.00
Civic Centre All wards GTM
MM002 IGR Enhanced Cooperative Governance MM 01/07/2009 30/06/2010 R 60,000.00
MDM Disaster Centre N/A GTM
MM003
Purchase of Fridge and TV for MM‟s Office
MM
01/072009 30/06/2010 R 6,000.00 Civic Centre N/A
GTM
MM004
Purchasing of tools, electronic equipment and machines
Provision of relevant working tools to ensure multimedia packages
MM
01/07/2009 30/06/2010 R 4000,000.0
0
Civic Centre N/A
GTM
MM005
Production of promotional video, pamplets, advertorials and ebrochures for tourism and service delivery
MM 01/07/2009 30/06/2010 R 350,000 All Wards
All ×
MM006
Branding of all municipal buildings with new Coat of Arms
MM 01/07/2009 30/06/2010 R 1,000,000.
00
Municipal Buildings
All ×
MM007
Marketing ehibitions, promotions and campains
MM 01/07/2009 30/06/2010 R 300,000 All Wards
All ×
IDP project list – 2009 - 2010
Project no Project Name Project Output
Dept Start date
End date
Estimated Capex 2009/2010
Estimated Opex 2009/2010
Estimated Capex 2010/2011
Estimated Opex 2010/2011
Estimated Capex 2011/2012
Estimated Opex 2010/2012
Source of Income
Location Ward

134
Project no Project Name Project Output
Dept Start date
End date
Estimated Capex 2009/2010
Estimated Opex 2009/2010
Estimated Capex 2010/2011
Estimated Opex 2010/2011
Estimated Capex 2011/2012
Estimated Opex 2010/2012
Source of Income
Location Ward
CFO001
CCTV cameras (updgrade)
CFO 01/07/2009
30/06/2010
R 110,000 R 15,000 Own Source
GTM offices N.A ×
CFO002
Network upgrade CFO 01/07/2009
30/06/2010
R 130,000 R 100,000 R 70,000 R 100,000 R 100,000 Own Source
GTM office NA √
CFO003
Datawarehouse implementation
Accurate billing system
CFO 01/07/2009
30/06/2010
R 300,000 R 150,000 R 200,000 R 100,000 R 100,000 Own Source
√
CFO004
IT Equipment Purchase computors and laptops for new appointees
CFO 01/07/2009
30/06/2010
R 100,000 Own Source
GTM offices NA √
CFO005 Restructuring of LAN network
CFO 01/07/2009
30/06/2010
R 400,000 Own Source
GTM offices NA √
CFO006
Network Server upgrade
CFO 01/07/2009
30/06/2010
R 500,000 Own Source
GTM offices NA √
CFO007
Master Systems Plan
CFO 01/07/2009
30/06/2010
R 300,000 Own Source
GTM offices NA ×
CFO008
Councillor Laptops CFO 01/07/2009
30/06/2010
R 700,000 Own Source
GTM offices All wards ×
CFO009
Waste Information Management system
CFO 01/07/2009
30/06/2010
R 300,000 R 100,000 R 100,000 R 100,000 Own Source
GTM offices NA √
CFO010
GIS implementation
CFO 01/07/2009
30/06/2010
R 70,000 R 100,000 R 200,000 R 50,000 R 100,000 R 50,000 Own Source
GTM offices NA ×
CORP001
ABET
CORP 01/07/2009
30/06/2010
R 141,256 Own Source GTM N.A ×
CORP002
Purchase Zippel Cabinets
Efficient Service Delivery
CORP 01/07/2009
30/06/2010
R 60,000 Own Source
GTM offices N.A ×
CORP003
Purchase Aircon for Records office
CORP 01/07/2009
30/06/2010
R 15,000 Own Source
GTM offices N.A ×
CORP004 Extention of HR filing room
CORP 01/07/2009
30/06/2010
R 80,000 R 4,000 R 30,000 Own Source GTM offices N.A ×
CORP005
Customer Care Policy
CORP 01/07/2009
30/06/2010
R 10,000 Own Source
N.A ×
CORP006
Corporate Image strategy
CORP 01/07/2009
30/06/2010
R 20,000 Own Source N.A ×

135
Project no Project Name Project Output
Dept Start date
End date
Estimated Capex 2009/2010
Estimated Opex 2009/2010
Estimated Capex 2010/2011
Estimated Opex 2010/2011
Estimated Capex 2011/2012
Estimated Opex 2010/2012
Source of Income
Location Ward
CORP007
Cluster Governance Plan
CORP 01/07/2009
30/06/2010
R 10,000 Own Source NA ×
CORP008
Twinning Agreement with Dc Haque
CORP 01/07/2009
30/06/2010
R 250,000 R 100,000
R 100,000 Own Source
N.A ×
CORP009
HR Strategy Development
CORP 01/07/2009
30/06/2010
R 299,820
Own Source N.A ×
CORP010
Occupational Health and Safety Environment risk assessement
To establish risks attached to work activities and what precautionary measures are necessary to ensure acceptable levels of risks to Council employees.
CORP 01/07/2009
30/06/2010
R 96,000
Own Source
NA
CORP011
Purchase of a big screen TV and Pool Table
Entertainment of guests
CORP 01/07/2009
30/06/2010
R 20,000.00
Owm Source
Tzaneen Office
CSD001
Develop Libraries at Thusong Centres: UNFUNDED
Establish new libraries at Thusong Centres, purchase and install books, furniture and equipment and appoint and train staff.
R2,500,000 Building first
Thusong Centre Library
800,000 Operating
first Thusong
Library
2,500,000 Building 2nd Thusong Centre Library
1,760,000 Operating first and second Thusong Centre Library
Own Source
Bulamahlo; Runnymede; Relela and Lesedi MPCC‟s.
All Wards

136
Project no Project Name Project Output
Dept Start date
End date
Estimated Capex 2009/2010
Estimated Opex 2009/2010
Estimated Capex 2010/2011
Estimated Opex 2010/2011
Estimated Capex 2011/2012
Estimated Opex 2010/2012
Source of Income
Location Ward
CSD002
School / Community Libraries
Assist with establishment of school library collections through donations and providing interested schools with school library management guide
Donations
Donations
Donations
Donation Tzaneen library, Letsitele library and Hburg library
15,16, 23
CSD 003
Library development and reading promotion
Accurate information services, continuous user education, prompt lending services and balanced collection development
R 4,222,924
R 4,645,216
R 5,109,738
Own Source
Tzaneen library, Letsitele library and Hburg library
14,15,16,23 P Services to entire GTM area and beyond
CSD004
Library Arts & Culture events
Creative holiday programmes and book-related arts & culture events
R 5,000
R 5,500
R 6,050
Tzaneen library, Letsitele library and Hburg library
14,15,16,23 × Learners from entire GTM area attend
CSD005
Annual GTM Library Competition
Arrange & adjudicate competition, host awards function
Donations
Donations
Donations
Computerize Library lending
Replace outdated card
Network cabling
R 40,000
R 44,000
R 48,400
GTM & National
Tzaneen library,
14,15,16,23

137
Project no Project Name Project Output
Dept Start date
End date
Estimated Capex 2009/2010
Estimated Opex 2009/2010
Estimated Capex 2010/2011
Estimated Opex 2010/2011
Estimated Capex 2011/2012
Estimated Opex 2010/2012
Source of Income
Location Ward
CSD006
function
lending system with computerized lending system
already installed by
SITA
Treasury Library Grant
Letsitele library and Hburg library
CSD007
Develop Library in Nkowankowa UNFUNDED
Establish new library in Nkowankowa, purchase and install books, furniture and equipment and appoint and train staff.
R 2,500,000
R 800,000
2,500,000 Building
2nd Thusong
Centre Library
1,760,000 Operating first and second Thusong Centre Library
Possible funding by National Treasury Library Grant & NDPG
Bulamahlo; Runnymede; Relela and Lesedi MPCC‟s.
All Clusters
CSD008
Curbside collection and transportation
CSD 01/07/2009
30/06/2010
R 3,000,000
R 4,400,000 Own Source
Nkowankowa, Lenyenye, Letsitele, Haenertsburg
2,18,19 ,11,17,
CSD009
Village waste collections and recycling
CSD 01/07/2009
30/06/2010
R 960,000 R 280,000 R 2,200,000
R 600,000 R 5,100,000
R 1,000,000
Own Source
2 Schools per cluster
1,2,11,17,18,19,20 Р
CSD010
Bulk refuse removal System
CSD 01/07/2009
30/06/2010
R 900,000 R 1,100,000 Own Source
GTM area ALL √
CSD011 Landfill site CSD 01/07/
2009 30/06/2010
R 3,700,000
Own Source
Tzaneen 1,20 √
CSD012 Landfill Audit CSD 01/07/
2009 30/06/2010
R 45,000 R 60,000 Own Source
Tzaneen 1,20 √
CSD013
Composting of "Clean Greens" at land fill
CSD 01/07/2009
30/06/2010
Own Source
Tzaneen Landfill site
1,19 ×
CSD014
Recycling at source CSD 01/07/2009
30/06/2010
R 450,000 R 550,000 Own Source
Lenyenye, Letsitele, Haenertsburg
1,2,11,17,18,19,20 ×
CSD015
Distribution of solid waste map/ calendar
CSD 01/07/2009
30/06/2010
R 75,000 Own Source
Tzaneen, Nkowankowa, Lenyenye, Letsitele, Haenertsburg
2,11,17,18,19,20 ×

138
Project no Project Name Project Output
Dept Start date
End date
Estimated Capex 2009/2010
Estimated Opex 2009/2010
Estimated Capex 2010/2011
Estimated Opex 2010/2011
Estimated Capex 2011/2012
Estimated Opex 2010/2012
Source of Income
Location Ward
CSD016
Cemetery Management
New cemeteries for areas in need, EIA and authorisation and well maintained cemeteries in Nkowankowa, Tzaneen, Lenyenye and Haenertsburg.
CSD 01/07/2009
30/06/2010
R 200,000 R 400,000 R 750,000 R 1,000,000
Own Source
Tzaneen, Nkowankowa, Lenyenye, Letsitele, Haenertsburg
2, 19, 17, 18 & 20 √
CSD017
Replacement of Redundant and old equipment
Purchasing of a ride on 10 lawnmowers & brush cutters
CSD 01/07/2009
30/06/2010
R 80,000 R 150,000 R 350,000 Own Source
Tzaneen, Nkowankowa, Lenyenye, Letsitele, Haenertsburg
All wards ×
CSD018
Garden management
Designs and plans of new areas, maintenance plans of existing areas.
CSD 01/07/2009
30/06/2010
R 450,000 Own Source
Tzaneen, Nkowankowa, Lenyenye, Letsitele, Haenertsburg
17, 18, 20, 1, 19 ×
CSD019
Garden Expo Logistical arrangements and awareness campaign
CSD 01/07/2009
30/06/2010
R 30,000 Own Source
Tzaneen
All wards ×
CSD020
Open space management
Identify, develop and maintain open spaces
CSD 01/07/2009
30/06/2010
R 600,000 Own Source
Tzaneen, Nkowankowa, Lenyenye, Letsitele, Haenertsburg
2, 19, 17, 18 & 20 ×
CSD021
Sports and Recreation management
Installation and maintenance of play apparatus maintenance of stadium
CSD 01/07/2009
30/06/2010
R 240,000 Own Source
All wards×

139
Project no Project Name Project Output
Dept Start date
End date
Estimated Capex 2009/2010
Estimated Opex 2009/2010
Estimated Capex 2010/2011
Estimated Opex 2010/2011
Estimated Capex 2011/2012
Estimated Opex 2010/2012
Source of Income
Location Ward
grounds. Maintenance of swimming pool grounds and pool. Ensure water quality. Maintenance of play park grounds.
CSD022
Purchase Zippel Cabinets
Efficient Service Delivery
CSD 01/07/2009
30/06/2010
R 60,000 Own Source
Civic Centre
×
CSD021
Letaba River Rehabilitation
CSD 01/07/2009
30/06/2010
R 230,000.00
Own Source
Tzaneen
15
CSD 023
Sport programmes
Cluster Tambo games
CSD 01/07/2009 Nov/D
ec
2009
30/06/2010
15 000 -00
15 000 -00
15 00 – 00
Own source
All Wards
All Wards
CSD024 Local OR Tambo games
CSD January 2010
25 000 – 00
25 000 – 00
25 000 – 00
Own Source
All Wards
All Wards
CSD 025 Cluster Indigenous games
CSD April/M
ay
2010
15 000 – 00
15 000 -00
Own Source
All Wards
All Wards
CSD026
Arts & Culture programmes
Arts and Culture General Assembly
CSD July/August 2009
15 000 -00
15 000 -00
15 000 – 00
Own Source
All Wards
All Wards

140
Project no Project Name Project Output
Dept Start date
End date
Estimated Capex 2009/2010
Estimated Opex 2009/2010
Estimated Capex 2010/2011
Estimated Opex 2010/2011
Estimated Capex 2011/2012
Estimated Opex 2010/2012
Source of Income
Location Ward
Formation of Cluster Arts and Culture committee
CSD July/August 2009
10 000 – 00
10 000 – 00
10 000 – 00
Own Source
All Wards
All Wards
CSD 027
Arts and Culture Imbizo
CSD
Sep/Oct 2009
10 000 – 00
10 000 - 00
10 000 – 00
Own Source
All Wards
All Wards
CSD028
Arts and Culture Cluster competitions
CSD Oct/Nov 2009
10 000 – 00
10 000 – 00
10 000 -00 Own Source
All Wards
All Wards
CSD029
Arts and
Culture Local
competitions
CSD Oct/Nov 2009
55 000 -00 55 000 -00 55 000-00
Own
Source
All Wards All Wards
CSD030
Heritage and Museum programmes
Council meeting
CSD Feb/March 2010
5 000 – 00
5 000 – 00
5 000 – 00
Own Source
All Wards
All Wards
CSD031
Annual Assembly for Heritage and Museum
CSD March/April 2010
5 000 – 00
5 000 – 00
5 000 -00
Own Source
All Wards
All Wards
CSD032
Quarterly
meeting with
traditional
Healers
CSD April/May 2010
5 000 - 00 5 000 -00 5 000 - 00 Own
Source
All Wards All Wards

141
Project no Project Name Project Output
Dept Start date
End date
Estimated Capex 2009/2010
Estimated Opex 2009/2010
Estimated Capex 2010/2011
Estimated Opex 2010/2011
Estimated Capex 2011/2012
Estimated Opex 2010/2012
Source of Income
Location Ward
EED003
New Satelite Sub Station Ext 53
Build new substation
EED 01/07/2009
30/06/2010
R 3,500,000
R
3,500,000
R 71,000
R 142,000
Own Source
√
EED004
New Essenhout substation
Build new substation
EED 01/07/2009
30/06/2010
R 7,887,040
R 78,870 Own Source
Tzaneen 15 √
EED005
Extension 70 & 78 Development
Provision of bulk services to new extensions
EED 01/07/2009
30/06/2010
R 11,001,043
R 55,000 R 55,000 Own Source
Tzaneen 15 √
EED006
New 66/11 KV Sub Station (Western Tzaneen) 40MVA
Build new substation and 66 Kv line Tarentaalrand substation
EED 01/07/2009
30/06/2010
R 40,000,000
R 200,000 R 200,000 Own Source
Tzaneen 14 √
EED007
Street lighting EED 01/07/2009
30/06/2010
R 400,000 R 920,000 R 9,200 R 920,000 R 9,200 Own Source
Tzaneen, Nkowankowa, Lenyenye
15,19,31 √
EED008
Laborie - new sub station
New 66/33 KV Sub station and 66kV line(20 MVA)
EED 01/07/2009
30/06/2010
R 10,000,000
R 10,000,000
Own Source
Letsitele
23√
EED009
New line from Western Sub to Tzaneen.
New 66KV line
EED 01/07/2009
30/06/2010
R 6,000,000
R 30,000.00
R 60,000 Own Source
Tarentaal to Tzaneen
12√
EED010
Magoebaskloof - New substation
New 15km line and 20 MVA 66/33 KV Substation
EED 01/07/2009
30/06/2010
Own Source
Magoebaskloof
14√

142
Project no Project Name Project Output
Dept Start date
End date
Estimated Capex 2009/2010
Estimated Opex 2009/2010
Estimated Capex 2010/2011
Estimated Opex 2010/2011
Estimated Capex 2011/2012
Estimated Opex 2010/2012
Source of Income
Location Ward
EED011
Georges Vally - new substation
10 km Line and a new 20 MVA 66/33 KV Substation
EED 01/07/2009
30/06/2010
R 17,000,000
Own Source
Georges Valley
14√
EED012
Haenertsburg - new substation
Construct a new 4 MVA Substation and a 8km 33 KV line
EED 01/07/2009
30/06/2010
R 2,500,000
Own Source
Haenertsburg
13√
EED013
Power factor correction equipment equipment (Rural&Town)
Purchasing Powerfactor correction equipment 3 X 33 KV Capacitor units installed
EED 01/07/2009
30/06/2010
R 800,000 R 12,000 Own Source
Tzaneen Distribution area
All wards √
EED014
Pusela - New substation
1 X 33/11 KV 2 MVA Substation
EED 01/07/2009
30/06/2010
R 660,000 R 6,600 R 13,200 Own Source
Pusela
15√
EED015
Letsitele Town- New substation
1 X 33 KV - 2 MVA Substation
EED 01/07/2009
30/06/2010
R 750,000 R 7,500 R 15,000 Own Source
Letsitele
23 √
EED016
Agatha - New substation
1 X 33 KV - 2 MVA Substation
EED 01/07/2009
30/06/2010
R 2,000,000
R 15,000 R 15,000 Own Source
Agatha
20 √
EED017
Laparisa - New substation
New 33/11 - 2 MVA Substation
EED 01/07/2009
30/06/2010
R 750,000 R 15,000 Own Source
Laparisa
20√
EED018
System protection (Urban)
Protection System upgrade and pilot wire protection
EED 01/07/2009
30/06/2010
R 3,500,000
R 17,500 Own Source
15√
EED019
Skirving/ Loop str Sub station (SS1)
New cable to be installed
EED 01/07/2009
30/06/2010
R 2,875,628
R 28,756 R 28,756 Own Source
15√
EED020
Claude Wheatly Substation (SS2)
New cable to be installed
EED 01/07/2009
30/06/2010
R 6,200,000
R 62,000 R 62,000 Own Source
15√
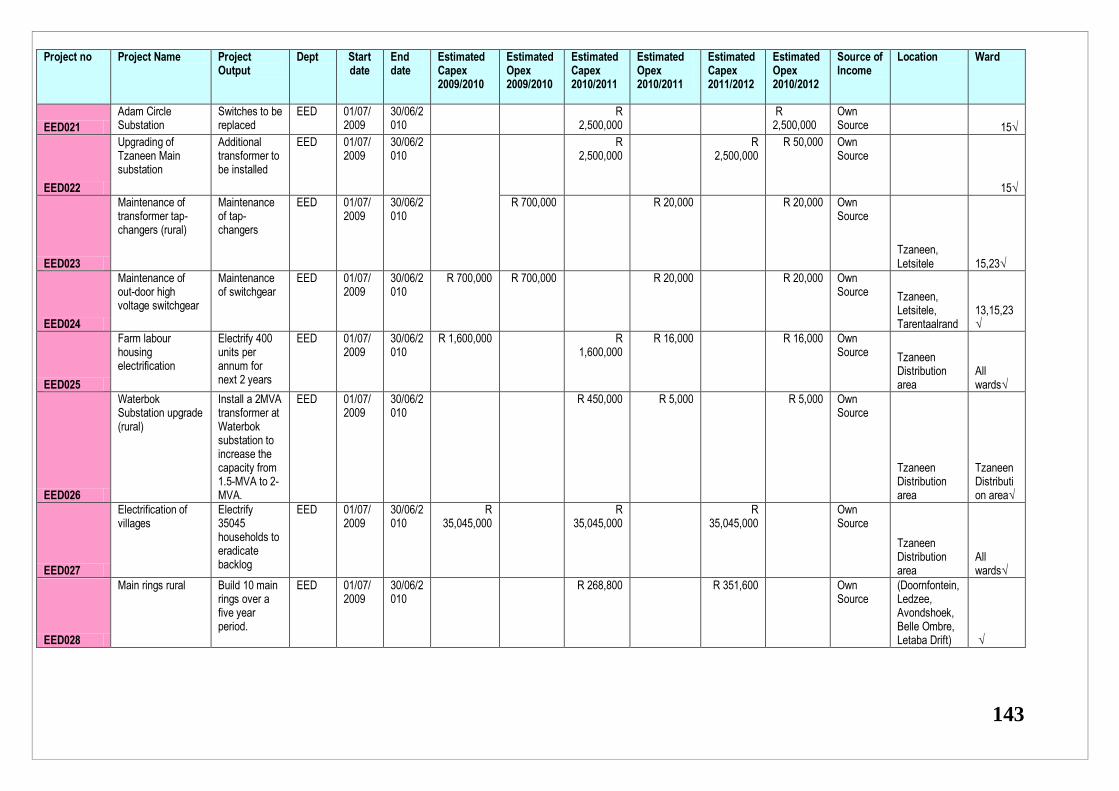
143
Project no Project Name Project Output
Dept Start date
End date
Estimated Capex 2009/2010
Estimated Opex 2009/2010
Estimated Capex 2010/2011
Estimated Opex 2010/2011
Estimated Capex 2011/2012
Estimated Opex 2010/2012
Source of Income
Location Ward
EED021
Adam Circle Substation
Switches to be replaced
EED 01/07/2009
30/06/2010
R 2,500,000
R 2,500,000
Own Source 15√
EED022
Upgrading of Tzaneen Main substation
Additional transformer to be installed
EED 01/07/2009
30/06/2010
R 2,500,000
R 2,500,000
R 50,000 Own Source
15√
EED023
Maintenance of transformer tap-changers (rural)
Maintenance of tap-changers
EED 01/07/2009
30/06/2010
R 700,000 R 20,000 R 20,000 Own Source
Tzaneen, Letsitele 15,23√
EED024
Maintenance of out-door high voltage switchgear
Maintenance of switchgear
EED 01/07/2009
30/06/2010
R 700,000 R 700,000 R 20,000 R 20,000 Own Source Tzaneen,
Letsitele, Tarentaalrand
13,15,23√
EED025
Farm labour housing electrification
Electrify 400 units per annum for next 2 years
EED 01/07/2009
30/06/2010
R 1,600,000 R 1,600,000
R 16,000 R 16,000 Own Source Tzaneen
Distribution area
All wards√
EED026
Waterbok Substation upgrade (rural)
Install a 2MVA transformer at Waterbok substation to increase the capacity from 1.5-MVA to 2-MVA.
EED 01/07/2009
30/06/2010
R 450,000 R 5,000 R 5,000 Own Source
Tzaneen Distribution area
Tzaneen Distribution area√
EED027
Electrification of villages
Electrify 35045 households to eradicate backlog
EED 01/07/2009
30/06/2010
R 35,045,000
R 35,045,000
R 35,045,000
Own Source
Tzaneen Distribution area
All wards√
EED028
Main rings rural Build 10 main rings over a five year period.
EED 01/07/2009
30/06/2010
R 268,800 R 351,600 Own Source
(Doornfontein, Ledzee, Avondshoek, Belle Ombre, Letaba Drift) √

144
Project no Project Name Project Output
Dept Start date
End date
Estimated Capex 2009/2010
Estimated Opex 2009/2010
Estimated Capex 2010/2011
Estimated Opex 2010/2011
Estimated Capex 2011/2012
Estimated Opex 2010/2012
Source of Income
Location Ward
EED029
Main line metering Install 4 x 33-kV Metering Units on 33/11-kV substations
EED 01/07/2009
30/06/2010
R 160,000 R 16,000 R 16,000 Own Source
Orangedene 1 substation, Westfalia Substation, Letaba Estates Housing Substation, Orangedene 2 substation.
GTM distribution area√
EED030
Purchase capital equipment
Purchase capital equipment for the maintenance of the electrical distribution network
EED 01/07/2009
30/06/2010
R 100,000 R 110,000 R 121,000 Own Source
NA Р
EED031
Strategic Lighting Lighting to be provided in crime hot spots
EED 01/07/2009
30/06/2010
R 1,000,000 R 10,000 R 10,000 Own Source
Letaba Crossing, Risaba Crossing, Mavela Crossing, Jopie crossing, Mamitwa Crossing and Tarentaalrand Crossing
All wards ×
EED032
Airconditioners Replacing of airconditioners for the Council Chamber and Cashiers
EED 01/07/2009
30/06/2010
R 200,000 R 10,000 R 10,000 Own Source
GTM offices N.A√
EED033
Electrical Information System
EED 01/07/2009
30/06/2010
R 2,500,000
R 2,500 Own Source
GTM offices NA√
ESD001
Water Reticulation NK. A
ESD 01/07/2009
30/06/2010
R 80,000 R 1,275,285
R 80,000 R 1,000,000
Own Source
17, 19√

145
Project no Project Name Project Output
Dept Start date
End date
Estimated Capex 2009/2010
Estimated Opex 2009/2010
Estimated Capex 2010/2011
Estimated Opex 2010/2011
Estimated Capex 2011/2012
Estimated Opex 2010/2012
Source of Income
Location Ward
ESD002
Paving Tzn Sewer Plant
ESD 01/07/2009
30/06/2010
R 60,000 R 30,000 R 20,000 Own
Source 15×
ESD003
Fencing Tzn Sewer Plant
ESD 01/07/2009
30/06/2010
R 30,000 R 100,000 R 30,000
R 40,000 Own Source 15×
ESD004
Billy Maritz Pump Station Maintenance
ESD 01/07/2009
30/06/2010
R 60,000 R 60,000 R 45,000
R 45,000 Own Source
15√
ESD005
Letaba Pump Station Maintenance
ESD 01/07/2009
30/06/2010
R 60,000 R 60,000 R 45,000
R 45,000 Own Source
15√
ESD006
Workshop Pump station Maintenance
ESD 01/07/2009
30/06/2010
R 30,000 R 60,000 R 30,000
R 40,000 Own Source
15√
ESD007
Water Reticulation - Leak detector (Pipe and Cable detector)
Pipe and cable detector system
ESD 01/07/2009
30/06/2010
R 60,000 R 111,112.70
R 60,000 R 70,000 Own Source
15,17,19,31 √
ESD008
Cemetery Ext 13 Pump Station maintenance
ESD 01/07/2009
30/06/2010
R 60,000 R 60,000 R 60,000 R 45,000 Own Source
15√
ESD009
Water Reticulation - Leak detector (Nk, Tz, Len)
Ferromagnetic Metal Detector
ESD 01/07/2009
30/06/2010
R 50,000 R 27,226.65
R 50,000 R 70,000 Own Source
15,17,19,21,31 √
ESD010
Water Reticulation - Lenyenye
Replacing of AC pipe with 2 500 M of PVC pipeline
ESD 01/07/2009
30/06/2010
R 100,000 R 687,500 R 100,000
R 100,000 Own Source
31√
ESD011
Flora Park Pump Station Maintenance
ESD 01/07/2009
30/06/2010
R 60,000 R 180,000 R 60,000 R 70,000 Own Source
15√
ESD012
Sewer Purification Upgrading and replacing of existing infrastructure
ESD 01/07/2009
30/06/2010
R 700,000 R 2,155,000
R 500,000
R 400,000 Own Source
15,17,19,31√
ESD013 Sewer Reticulation - Nkowankowa
Upgrading of the sewer line
ESD 01/07/2009
30/06/2010
R 656,320 R 2,035,200
R 550,000 R 371,840 Own Source
17,19,21

146
Project no Project Name Project Output
Dept Start date
End date
Estimated Capex 2009/2010
Estimated Opex 2009/2010
Estimated Capex 2010/2011
Estimated Opex 2010/2011
Estimated Capex 2011/2012
Estimated Opex 2010/2012
Source of Income
Location Ward
ESD014 Water supply - Tzaneen Purification Plant
Upgrading of existing infrastructure
ESD 01/07/2009
30/06/2010
R 100,000 R 1,150,000
R 100,000 R 80,000 Own Source
15√
ESD015
Equipping of boreholes
Maintenance of existing borehole infrastructure
ESD 01/07/2009
30/06/2010
R 1,000,000
R 1,000,000
Own Source
Rural Р wards
ESD016
Borehole Repair Repair and replace vandalised equipment
ESD 01/07/2009
30/06/2010
R 500,000 R 1,625,000
R 500,000
R 650,000 Own Source
Rural Р wards
ESD017
Tzangeni Pump Station Maintenance
Build roof over pump station
ESD 01/07/2009
30/06/2010
R 10,000 R 30,000 R 10,000 R 10,000 Own Source
15×
ESD018
Water reticulation - Tzaneen Extension 4,5
Replacing of AC pipe with 5 720 M of PVC pipeline
ESD 01/07/2009
30/06/2010
R 60,000 R 1,725,056
R 60,000 R 85,000 Own Source
15√
ESD019
Building Accessibility
ESD 01/07/2009
30/06/2010
Own Source ×
ESD020
Sewer plant maintenance
Maintenance of the sewer plants
ESD 01/07/2009
30/06/2010
R 180,000 Own Source
Tzaneen, Letsitele, Nkowankowa, Lenyenye
19, 21, 31, 15 and 23√
ESD021
Renovate Fire station
Renovation of Fire Station
ESD 01/07/2009
30/06/2010
R 150,000 Own Source
Civic Centre 15 ×
ESD022
Carport - Museum Development of a carport at the Museum
ESD 01/07/2009
30/06/2010
R 110,000
Own Source
Civic Centre
15×
ESD023
Nkowankowa testing station maintenance
Replace ceramic tiles
ESD 01/07/2009
30/06/2010
R 80,000 Own Source
Nkowankowa 19,21 ×
ESD024
Civic Centre Painting
Painting of the Civic Centre
ESD 01/07/2009
30/06/2010
R 70,000 Own Source
Civic Centre
15×
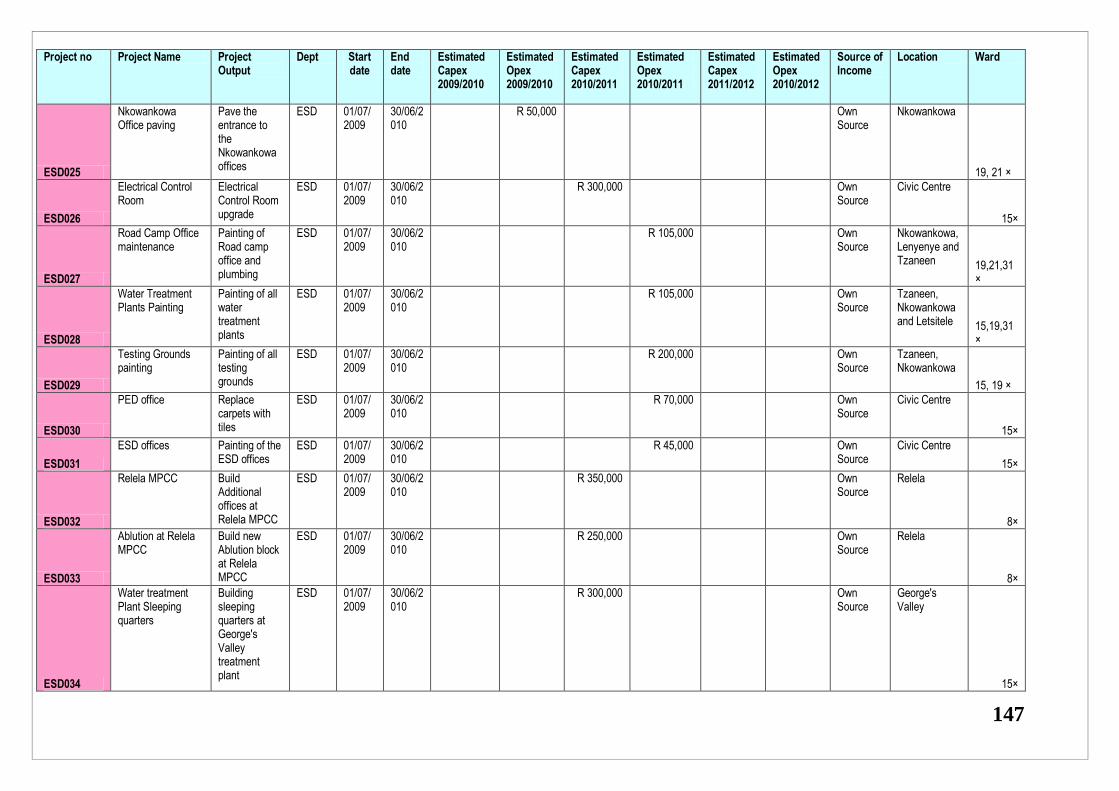
147
Project no Project Name Project Output
Dept Start date
End date
Estimated Capex 2009/2010
Estimated Opex 2009/2010
Estimated Capex 2010/2011
Estimated Opex 2010/2011
Estimated Capex 2011/2012
Estimated Opex 2010/2012
Source of Income
Location Ward
ESD025
Nkowankowa Office paving
Pave the entrance to the Nkowankowa offices
ESD 01/07/2009
30/06/2010
R 50,000 Own Source
Nkowankowa
19, 21 ×
ESD026
Electrical Control Room
Electrical Control Room upgrade
ESD 01/07/2009
30/06/2010
R 300,000 Own Source
Civic Centre
15×
ESD027
Road Camp Office maintenance
Painting of Road camp office and plumbing
ESD 01/07/2009
30/06/2010
R 105,000 Own Source
Nkowankowa, Lenyenye and Tzaneen 19,21,31
×
ESD028
Water Treatment Plants Painting
Painting of all water treatment plants
ESD 01/07/2009
30/06/2010
R 105,000 Own Source
Tzaneen, Nkowankowa and Letsitele 15,19,31
×
ESD029
Testing Grounds painting
Painting of all testing grounds
ESD 01/07/2009
30/06/2010
R 200,000 Own Source
Tzaneen, Nkowankowa
15, 19 ×
ESD030
PED office Replace carpets with tiles
ESD 01/07/2009
30/06/2010
R 70,000 Own Source
Civic Centre
15×
ESD031
ESD offices Painting of the ESD offices
ESD 01/07/2009
30/06/2010
R 45,000 Own Source
Civic Centre
15×
ESD032
Relela MPCC Build Additional offices at Relela MPCC
ESD 01/07/2009
30/06/2010
R 350,000 Own Source
Relela
8×
ESD033
Ablution at Relela MPCC
Build new Ablution block at Relela MPCC
ESD 01/07/2009
30/06/2010
R 250,000 Own Source
Relela
8×
ESD034
Water treatment Plant Sleeping quarters
Building sleeping quarters at George's Valley treatment plant
ESD 01/07/2009
30/06/2010
R 300,000 Own Source
George's Valley
15×

148
Project no Project Name Project Output
Dept Start date
End date
Estimated Capex 2009/2010
Estimated Opex 2009/2010
Estimated Capex 2010/2011
Estimated Opex 2010/2011
Estimated Capex 2011/2012
Estimated Opex 2010/2012
Source of Income
Location Ward
ESD035
Disability access to all buildings
Build concrete ramps for access by disabled to all buildings
ESD 01/07/2009
30/06/2010
R 1,000,000
Own Source
Lenyenye, Nkowankowa, Tzaneen 15,19,31
Р
ESD036
Letsitele Library ablution
Build a new ablution block at Letsitele library
ESD 01/07/2009
30/06/2010
R 210,000 Own Source
Letsitele
23×
ESD037
Ablution at Parks Ext 13
Build new ablution block at the Park in Ext 13
ESD 01/07/2009
30/06/2010
R 210,000 Own Source
Tzaneen
16×
ESD038
Nkowankowa and Lenyenye office painting
Painting of Nkowankowa and Lenyenye offices
ESD 01/07/2009
30/06/2010
R 200,000 Own Source
Nkowankowa, Lenyenye
19,31 ×
ESD039
Muhlaba II Hall Painting
Painting of the Muhlaba II Hall
ESD 01/07/2009
30/06/2010
R 80,000 Own Source
Nkowankowa
19,21 ×
ESD040
Haenertsburg library painting
Painting of the Haenertsburg library
ESD 01/07/2009
30/06/2010
R 70,000 Own Source
Haenertsburg
14×
ESD041
Public Toilet renovation
Renovate all public toilets in
ESD 01/07/2009
30/06/2010
R 300,000 Own Source
All wards×
ESD042
Nkowankowa testing station paving
Paving at Nkowankowa testing station
ESD 01/07/2009
30/06/2010
R 50,000 Own Source
Nkowankowa
19,21 ×
ESD043
MPCC general maintenance
General maintenance of all MPCCs
ESD 01/07/2009
30/06/2010
R 100,000 Own Source
Relela, Runnymede, Lesedi, Bulamahlo 6,8,27 ×
ESD044
Letsitele library painting
Painting and upgrading of stationary cabinets
ESD 01/07/2009
30/06/2010
R 80,000 Own Source
Letsitele
23×

149
Project no Project Name Project Output
Dept Start date
End date
Estimated Capex 2009/2010
Estimated Opex 2009/2010
Estimated Capex 2010/2011
Estimated Opex 2010/2011
Estimated Capex 2011/2012
Estimated Opex 2010/2012
Source of Income
Location Ward
ESD045
Runnymede MPCC Library
Establish library in Runnymede MPCC
ESD 01/07/2009
30/06/2010
R 450,000 Own Source
Runnymede
6×
ESD046
Electrical Dpt Kitchen
New kitchen at the Electrical Department
ESD 01/07/2009
30/06/2010
R 250,000 Own Source
Civic Centre
15 ×
ESD047
Electrical Dpt Showers
Showers for women at the electrical Dept
ESD 01/07/2009
30/06/2010
R 210,000 Own Source
Civic Centre
15×
ESD048
Tribal Authority offices maintenance
Maintenance of Tribal Authority offices
ESD 01/07/2009
30/06/2010
Own Source
4,24,32,33 ×
ESD049
Municipal offices roof sealing
Municipal offices Roofs Sealed
ESD 01/07/2009
30/06/2010
Own Source
Nkowankowa, Lenyenye, Tzaneen
19, 31×
ESD050
Unplanned maintenance
General repairs, painting and partitioning
ESD 01/07/2009
30/06/2010
Own Source
Tzaneen
15×
ESD051
Emergency Maintenance
Emergency maintenance. Repairs, painting and welding etc.
ESD 01/07/2009
30/06/2010
Own Source
Tzaneen
15×
ESD053
Khujwane Bus Route
Upgrade of access roads
ESD 01/07/2009
30/06/2010
R 3,258,000
R 3,258,000 R 3,500,000
Own Source
Р
ESD054
Sedan Access road Upgrade of access roads
ESD 01/07/2009
30/06/2010
R 1,710,000
R 1,710,000 R 2,000,000
Own Source
Р
ESD055
Tickyline access road
Upgrade of access roads
ESD 01/07/2009
30/06/2010
R 1,170,000
R 1,170,000 R 1,250,000
Own Source
Р
ESD056
Pulaneng Access Road
Upgrade of access roads
ESD 01/07/2009
30/06/2010
R 720,000 R 720,000 R 800,000 Own Source
Р

150
Project no Project Name Project Output
Dept Start date
End date
Estimated Capex 2009/2010
Estimated Opex 2009/2010
Estimated Capex 2010/2011
Estimated Opex 2010/2011
Estimated Capex 2011/2012
Estimated Opex 2010/2012
Source of Income
Location Ward
ESD057
Nkowankowa C Access Road
Upgrade of access roads
ESD 01/07/2009
30/06/2010
R 630,000 R 630,000 R 850,000 Own Source
Р
ESD059
Bonn Access Road Upgrade of access roads
ESD 01/07/2009
30/06/2010
R 2,430,000
R 2,430,000 R 2,700,000
Own Source
Р
ESD060
Lusaka,Mbambamencisi & Rhulani
Upgrade of access roads
ESD 01/07/2009
30/06/2010
R 1,422,000
R 1,422,000 R 1,650,000
Own Source
Р
ESD061
Mabiyakgoro Upgrade of access roads
ESD 01/07/2009
30/06/2010
R 360,000 R 360,000 R 400,000 Own Source
Р
ESD062
Madumani Main Road
Upgrade of access roads
ESD 01/07/2009
30/06/2010
R 90,000 R 90,000 R 120,000 Own Source
Р
ESD066
Mawa 12 Street Upgrade of Internal street
ESD 01/07/2009
30/06/2010
R 1,710,000
R 1,710,000 R 2,000,000
Own Source
Р
ESD068
Ramphelo Access Road
Upgrade of Access Road
ESD 01/07/2009
30/06/2010
R 22,500 R 22,500 R 30,000 Own Source
Р
ESD071
Buhuta Access Road
Upgrade of Access Road
ESD 01/07/2009
30/06/2010
R 144,000 R 144,000 R 180,000 Own Source
Р
ESD084
Mavele A Access road
Upgrade of Access Road
ESD 01/07/2009
30/06/2010
R 192,950,00
0
R 192,950,000
R 250,000 Own Source
Р
ESD086
Manmitwa B Upgrade of Access Road
ESD 01/07/2009
30/06/2010
R 84,193,920
R 84,193,920
R 900,000 Own Source
Р
ESD087
Mookgo Block B Upgrade of Access Road
ESD 01/07/2009
30/06/2010
R 334,439,00
0
R 334,439,000
R 370,000 Own Source
Р
ESD088
Musipani B Upgrade of Access Road
ESD 01/07/2009
30/06/2010
R 360,000 R 360,000 R 400,000 Own Source
Р
ESD091
Nkambako Upgrade of Access Road
ESD 01/07/2009
30/06/2010
R 13,108,050
R 13,108,050
R 180,000 Own Source
Р
ESD109
Leokwe Access Road
Upgrade of Access Road
ESD 01/07/2009
30/06/2010
R 405,000 R 405,000 R 450,000 Own Source
Р
ESD052
Dan Bus Route To ensure proper access to community.
ESD 01/07/2009
30/06/2010
R 1,170,000
R 1,170,000 R 1,250,000
Own Source
Р
ESD058
Lenyenye Access Road
Upgrade of access roads
ESD 01/07/2009
30/06/2010
R 1,080,000
R 1,080,000 R 1,100,000
Own Source
Р
ESD063
Mopye Access Road
Upgrade of access roads
ESD 01/07/2009
30/06/2010
R 360,000 R 360,000 R 410,000 Own Source
Р

151
Project no Project Name Project Output
Dept Start date
End date
Estimated Capex 2009/2010
Estimated Opex 2009/2010
Estimated Capex 2010/2011
Estimated Opex 2010/2011
Estimated Capex 2011/2012
Estimated Opex 2010/2012
Source of Income
Location Ward
ESD064
Mandlakazi Access Road
Upgrade of access roads
ESD 01/07/2009
30/06/2010
R 405,000 R 405,000 R 405,000 Own Source
Р
ESD065
Walli Internal Streets
Upgrade of Internal street
ESD 01/07/2009
30/06/2010
R 1,530,000
R 1,530,000 R 1,800,000
Own Source
Р
ESD067
Relela To Mabiyakgoro Access Road
Upgrade of Access Road
ESD 01/07/2009
30/06/2010
R 180,000 R 180,000 R 210,000 Own Source
Р
ESD069
Sethone Upgrade of Access Road
ESD 01/07/2009
30/06/2010
R 22,500 R 22,500 R 30,000 Own Source
Р
ESD070
Leokwe Access Road
Upgrade of Access Road
ESD 01/07/2009
30/06/2010
R 405,000 R 405,000 R 450,000 Own Source
Р
ESD072
Relela to Marironi Taxi Rank Access Road
Upgrade of Access Road
ESD 01/07/2009
30/06/2010
R 252,000 R 252,000 R 300,000 Own Source
Р
ESD073
Topanama Dam Access Road
Upgrade of Access Road
ESD 01/07/2009
30/06/2010
R 306,000 R 306,000 R 350,000 Own Source
Р
ESD074
Rikhotso Access Road
Upgrade of Access Road
ESD 01/07/2009
30/06/2010
R 126,000 R 126,000 R 160,000 Own Source
Р
ESD075
Mabjepilong Access Road
Upgrade of Access Road
ESD 01/07/2009
30/06/2010
R 720,000 R 720,000 R 800,000 Own Source
Р
ESD076
Mhangweni Access Road
Upgrade of Access Road
ESD 01/07/2009
30/06/2010
R 180,000 R 180,000 R 200,000 Own Source
Р
ESD077
Mafarana Access Road
Upgrade of Access Road
ESD 01/07/2009
30/06/2010
R 2,700,000
R 2,700,000 R 3,200,000
Own Source
Р
ESD078
Mokgolobotho Bus Route
Upgrade of Access Roads
ESD 01/07/2009
30/06/2010
R 1,980,000
R 1,980,000 R 2,400,000
Own Source
Р
ESD079
Relela To Mabiyakgoro Access Road
Upgrade of Access Road
ESD 01/07/2009
30/06/2010
R 252,000 R 252,000 R 300,000 Own Source
Р
ESD080
Moime to Joseph Mametja Access Road
Upgrade of Access Road
ESD 01/07/2009
30/06/2010
R 675,000 R 675,000 R 720,000 Own Source
Р
ESD081
Dan Internal Street Upgrade of Internal street
ESD 01/07/2009
30/06/2010
R 7,650,000
R 7,650,000 R 8,300,000
Own Source
Р

152
Project no Project Name Project Output
Dept Start date
End date
Estimated Capex 2009/2010
Estimated Opex 2009/2010
Estimated Capex 2010/2011
Estimated Opex 2010/2011
Estimated Capex 2011/2012
Estimated Opex 2010/2012
Source of Income
Location Ward
ESD082
Lusaka Internal Street
Upgraded Internal Street
ESD 01/07/2009
30/06/2010
R 3,510,000
R 3,510,000 R 4,000,000
Own Source
Р
ESD083
Khujwana Internal Street
Upgrade of Internal street
ESD 01/07/2009
30/06/2010
R 5,850,000
R 5,850,000 R 6,400,000
Own Source
Р
ESD085
Mamitwa A Upgrade of access Road
ESD 01/07/2009
30/06/2010
R 501,030,00
0
R 501,030,000
R 550,000 Own Source
Р
ESD089
Petanenge Access Road
Upgrade of Access Road
ESD 01/07/2009
30/06/2010
R 116,720,00
0
R 116,720,000
R 150,000 Own Source
Р
ESD090
Babanana Access Road
Upgrade of Access Road
ESD 01/07/2009
30/06/2010
R 155,291,00
0
R 155,291,000
R 200,000 Own Source
Р
ESD092
Georges Vally Access Road
Upgrade of Access Road
ESD 01/07/2009
30/06/2010
R 270,000 R 270,000 R 340,000 Own Source
Р
ESD093
Marivathema Upgrade of Access Road
ESD 01/07/2009
30/06/2010
R 315,000 R 315,000 R 370,000 Own Source
Р
ESD094
Mohlatlareng Upgrade of Access Road
ESD 01/07/2009
30/06/2010
R 360,000 R 360,000 R 420,000 Own Source
Р
ESD095
Rita Access Road Upgrade of Access Road
ESD 01/07/2009
30/06/2010
R 720,000 R 720,000 R 780,000 Own Source
Р
ESD096
Tockyline Internal Street
Upgrade of Internal street
ESD 01/07/2009
30/06/2010
R 585,000 R 585,000 R 640,000 Own Source
Р
ESD097
Myakayaka Access Road
Upgrade of Access Road
ESD 01/07/2009
30/06/2010
R 270,000 R 270,000 R 320,000 Own Source
Р
ESD098
Masoma Access Road
Upgrade of Access Road
ESD 01/07/2009
30/06/2010
R 315,000 R 315,000 R 318,000 Own Source
Р
ESD099
Maake Upgrade of Access Road
ESD 01/07/2009
30/06/2010
R 450,000 R 450,000 R 500,000 Own Source
Р
ESD100
Makhubidung Grave Yard Access Road
Upgrade of Access Road
ESD 01/07/2009
30/06/2010
R 135,000 R 135,000 R 180,000 Own Source
Р
ESD101
Bodoux Access Road
Upgrade of Access Road
ESD 01/07/2009
30/06/2010
R 540,000 R 540,000 R 600,000 Own Source
Р
ESD102
Juliesburg Access Road
Upgrade of Access Road
ESD 01/07/2009
30/06/2010
R 585,000 R 585,000 R 640,000 Own Source
Р

153
Project no Project Name Project Output
Dept Start date
End date
Estimated Capex 2009/2010
Estimated Opex 2009/2010
Estimated Capex 2010/2011
Estimated Opex 2010/2011
Estimated Capex 2011/2012
Estimated Opex 2010/2012
Source of Income
Location Ward
ESD103
Nkowankowa Cemetry road
Upgrade of Access Road
ESD 01/07/2009
30/06/2010
R 450,000 R 450,000 Own Source
Р
ESD104
Khopo New Gravel Road
Upgrade of Access Road
ESD 01/07/2009
30/06/2010
R 130,000 R 55,000 Own Source
Р
ESD105
Dan River Road Upgrade of Access Road
ESD 01/07/2009
30/06/2010
R 3,000,000
R 300,000 Own Source
Р
ESD106
Lenyenye Cemetry Road
Upgrade of Access Road
ESD 01/07/2009
30/06/2010
R 2,500,000
R 2,500,000
Own Source
Р
ESD107
Nkowankowa Internal Street
Upgrade of Internal street
ESD 01/07/2009
30/06/2010
R 3,600,000
R 360,000 Own Source
Р
ESD108
Lushof Road Upgrade of Access Road
ESD 01/07/2009
30/06/2010
R 3,800,000
R 380,000 Own Source
Р
ESD109
Petanenge access road
1,3 km road ESD 01/07/2009
30/06/2010
R 127,272 Own Source
Petanenge 34 Р
ESD110
Lephapane access road
600m road ESD 01/07/2009
30/06/2010
R 84,000 Own Source
Lephapane 11 Р
ESD111
Babanana access road
1,8 km road ESD 01/07/2009
30/06/2010
R 392,000 Own Source
Babanana 14 Р
ESD112
Maribathema access road
3,5km road ESD 01/07/2009
30/06/2010
R 355,000 Own Source
Maribathema 14 Р
ESD113
Tzangeni Pump station
100m ESD 01/07/2009
30/06/2010
R 92,200 Own Source
Tzaneen 17 Р
ESD114
Mokgolobotho access road
3 km ESD 01/07/2009
30/06/2010
R 693,764 Own Source
Mokgolobotho 16 Р
ESD115
Luseka Access road
1,7km ESD 01/07/2009
30/06/2010
R 595,764 Own Source
Lusaka 33 Р
ESD116
Maake Clinic access road
1 km ESD 01/07/2009
30/06/2010
R 100,000 Own Source
Maake 27 Р
ESD117
Mokhubidung access road
1,5 km ESD 01/07/2009
30/06/2010
R 160,000 Own Source
Mokhwibidung Р
ESD118
Aerodrome Maintenance
Aerodrome control officer, cutting grass and maintaining buildings
ESD 01/07/2009
30/06/2010
R 160,000 R 170,000 R 180,000 Own Source
Tzaneen
√

154
Project no Project Name Project Output
Dept Start date
End date
Estimated Capex 2009/2010
Estimated Opex 2009/2010
Estimated Capex 2010/2011
Estimated Opex 2010/2011
Estimated Capex 2011/2012
Estimated Opex 2010/2012
Source of Income
Location Ward
ESD119
Updgrade of Radio beacon
Upgrade of flying beacon at airfield
ESD 01/07/2009
30/06/2010
R 400,000 Own Source
Tzaneen
√
ESD120
Upgrade of runway lights
Replace runway lights
ESD 01/07/2009
30/06/2010
R 150,000 R 180,000 Own Source
Tzaneen
√
ESD121
Aerodrome infrastructure development
Upgrade of Electric and civil services to accommodate future development
ESD 01/07/2009
30/06/2010
R 200,000 R 200,000 Own Source
Tzaneen
×
ESD122
Upgrade of Taxiway
Upgrade of Taxiway around fuel depo for safety purposes
ESD 01/07/2009
30/06/2010
R 100,000 R 150,000 Own Source
Tzaneen
√
PLANNING & ECONOMIC DEVELOPMENT MANAGER
PED 1
2010 2010 Plan PVA events
PED R50 000 R2,6m
G T M
PED 2
PED Open days Informed communities
PED R70 000 G T M
PED 3
Strategic Sessions X 2
January 2010 September 2009
PED R10 000 G T M
PED 4
Partnerships Enhanced Relationship with other Implementors (Gov, NGO, etc)
PED R30 000 G T M

155
Project no Project Name Project Output
Dept Start date
End date
Estimated Capex 2009/2010
Estimated Opex 2009/2010
Estimated Capex 2010/2011
Estimated Opex 2010/2011
Estimated Capex 2011/2012
Estimated Opex 2010/2012
Source of Income
Location Ward
PED 5
NDPG - Rapid delivery initiative projects
Nkowankowa River Park
PED
R 211,687.8
0
National Treasury
Nkowankowa Cemetery Upgrading
PED
R
70,044.00
National Treasury
Nkowankowa Entrance Points
PED
R
82,057.20
National Treasury
Nkowankowa CBD Upgrade
PED
R 138,339.1
0
National Treasury
Nkowankowa Stand 944 Zone A
PED
R 103,507.0
0
National Treasury
Nkowankowa Stand 2065 Zone B
PED
R 128,018.2
4
National Treasury
Nkowankowa Stand 321 Zone C
PED
R 117,592.4
8
National Treasury
SOCIO-ECONOMIC DEVELOPMENT, TOURISM & LED
PED006
SMME Support PED 01/07/2009
30/06/2010
R 1,500,000
R 1,500,000 GTM All
PED007
Hawkers Regulation, Development and Support
PED 01/07/2009
30/06/2010
R1,5m R 200,000 R 500,000 R 300,000 GTM All
PED008
GTEDA PED 01/07/2009
30/06/2010
R2m R5m R7m GTM All
PED009 Ithusheng Feasibility study
PED
R 600,000 R 200,000 R1,5m R 200,000 GTM 31
PED010
Land Claims Support
PED 01/07/2009
30/06/2010
R5m R 100,000 R 100,000 R 100,000 GTM All

156
PED011
Muhlaba Lodge PED
R1,2m R 500,000 R 500,000 R 500,000 GTM and Irish Aid
24
PED012
Thabina Tented Camp
PED 01/07/2009
30/06/2010
R1,2m R 500,000 R 500,000 R 500,000 GTM and Irish Aid
34
PED013
Nkowanowa Tours PED 01/07/2009
30/06/2010
R1,2m R 500,000 R 500,000 R 500,000 GTM and Irish Aid
17
PED014 Incentive Policy PED
R 400,000 R 400,000 R 400,000 GTM All
PED015
Poverty Eradication Strategy
PED 01/07/2009
30/06/2010
R 500,000 GTM All
PED016 Partnerships Development
PED
R 250,000 R 250,000 R 250,000 GTM All
PED017
Job Creation Database
PED 01/07/2009
30/06/2010
R 100,000 R 100,000 R 100,000 GTM All
PED018
LED Strategy Marketing and promotion
PED 01/07/2009
30/06/2010
R 50,000 R 50,000 R 50,000 GTM All
GREATER TZANEEN ECONOMIC DEVELOPMENT AGENCY (GTEDA)
GTEDA001
Greater Tzaneen Tourism Framework
GTEDA
01/07/2009
30/06/2010
1m R5m R7m IDC All
GTEDA002
Letaba River Mile GTEDA
01/07/2009
30/06/2010
1m R5m R7m IDC All
GTEDA003
Livestock Improvement
GTEDA
01/07/2009
30/06/2010
R1m R5m R7m IDC All
GTEDA004
Subtropical Fruit and Nut Cluster
GTEDA
01/07/2009
30/06/2010
R1m R5m R7m IDC All
GTEDA005 New Shopping Centers
GTEDA
01/07/2009
30/06/2010
R1,5m R5m R7m IDC All
GTEDA006 Sapekoe Tea Estates
GTEDA
01/07/2009
30/06/2010
R1,5m R5m R7m IDC 14
GTEDA007 Community Radio Station
GTEDA
01/07/2009
30/06/2010
R1,570m R5m R7m IDC 31
GTEDA008
Business Support Center
GTEDA
01/07/2009
30/06/2010
R 350,000 R5m R7m IDC 31
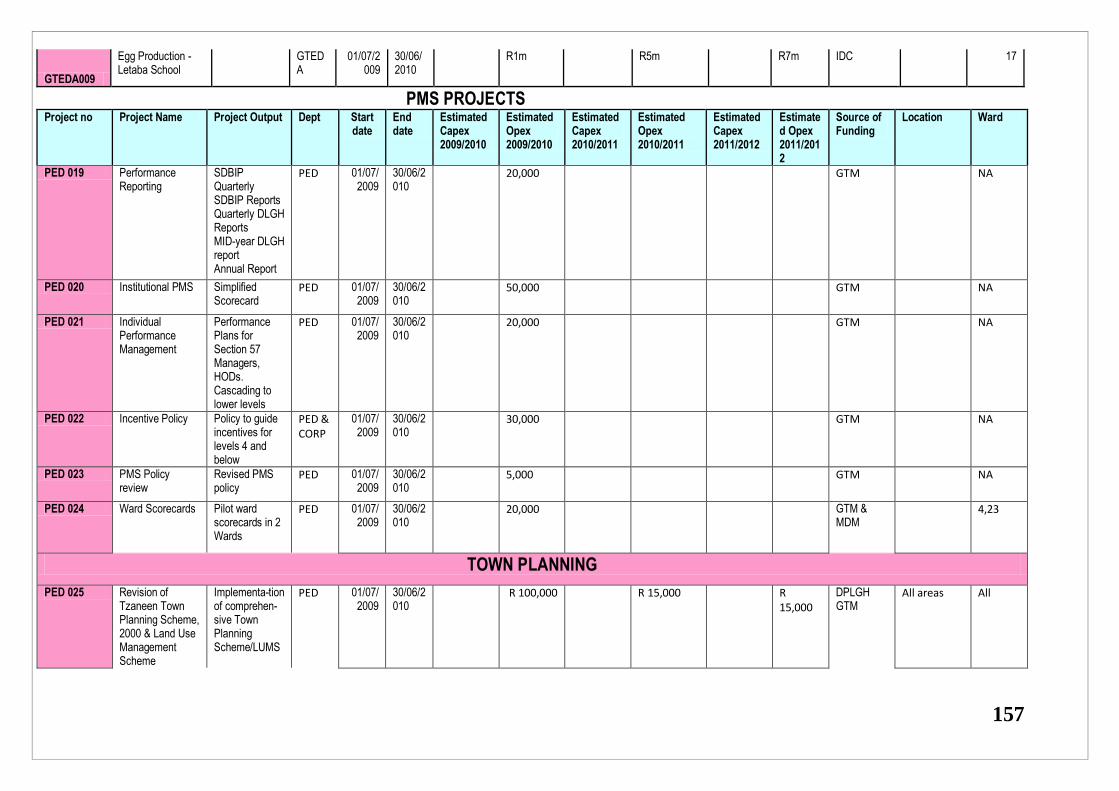
157
GTEDA009
Egg Production - Letaba School
GTEDA
01/07/2009
30/06/2010
R1m R5m R7m IDC 17
PMS PROJECTS Project no Project Name Project Output Dept Start
date End date
Estimated Capex 2009/2010
Estimated Opex 2009/2010
Estimated Capex 2010/2011
Estimated Opex 2010/2011
Estimated Capex 2011/2012
Estimated Opex 2011/2012
Source of Funding
Location Ward
PED 019 Performance Reporting
SDBIP Quarterly SDBIP Reports Quarterly DLGH Reports MID-year DLGH report Annual Report
PED 01/07/2009
30/06/2010
20,000 GTM NA
PED 020 Institutional PMS Simplified Scorecard
PED 01/07/2009
30/06/2010
50,000 GTM NA
PED 021 Individual Performance Management
Performance Plans for Section 57 Managers, HODs. Cascading to lower levels
PED 01/07/2009
30/06/2010
20,000 GTM NA
PED 022 Incentive Policy Policy to guide incentives for levels 4 and below
PED & CORP
01/07/2009
30/06/2010
30,000 GTM NA
PED 023 PMS Policy review
Revised PMS policy
PED 01/07/2009
30/06/2010
5,000 GTM NA
PED 024 Ward Scorecards Pilot ward scorecards in 2 Wards
PED 01/07/2009
30/06/2010
20,000 GTM & MDM
4,23
TOWN PLANNING
PED 025 Revision of Tzaneen Town Planning Scheme, 2000 & Land Use Management Scheme
Implementa-tion of comprehen- sive Town Planning Scheme/LUMS
PED 01/07/2009
30/06/2010
R 100,000 R 15,000 R 15,000
DPLGH GTM
All areas All

158
PED 026 Town Planning Policies
Integrated policies for urban & rural areas to create stable economic environment to attract suitable investorsformulation of a Social Contribution policy
PED 01/07/2009
30/06/2010
R 75,000 R 200,000 R 50,000
GTM All areas All
PED 027 Town Planning applications
Create stable economic environment to attract suitable investors
PED 01/07/2009
30/06/2010
R 50,000 R 50,000 R 50,000
G T M All areas All
PED 028 Town Planning Information & Cadastral
Updated cadastral information
PED 01/07/2009
30/06/2010
R 50,000 R 50,000 R 50,000
G T M All areas All
PED 029 Spatial Development Framework Implementa-tion
Identification of catalystic projects relating to Job Creation, Integration & Capital Investment
PED 01/07/2009
30/06/2010
R 30,000 R 50,000 R 40,000 R 60,000 R 80,000
GTM National Treasury
All areas All
PED 030 Formation of cooperative projects in rural areas
PED 01/07/2009
30/06/2010
R 350,000 R 40,000 R 500,000 R 50,000
GTM National Treasury Dept Agriculture
All areas All
PED 031 Township Establishment Tzaneen Extension 70
300 proclaimed sites
PED 01/07/2009
30/06/2010
R 5,000 R 4,000 DPLGH G T M
All areas All
PED 032 Demarcation of sites in rural areas
1600 and 200 suveyed sites at Mokgolobotho and Mariveni
PED 01/07/2009
30/06/2010
DPLGH MDM
All areas All
PED 033 Develop effective and sustainable stakeholder relations
Good IGR practices
PED 01/07/2009
30/06/2010
R 10,000 R 20,000 R 25,000
GTM All areas All

159
PED 034 Establishment of comprehen-sive GIS
Effective Management Information System
PED 01/07/2009
30/06/2010
R 75,000 R 200,000 R 80,000 R 300,000 R 100,000
GTM All areas All
PED 035 parnerships develop an effective policy on parnerships
ped 01/07/2009
30/06/2010
R 40,000 R 100,000 R 120,000 R140 000 All areas
YOUTH, GENDER AND DISABILITY Project no Project Name Project Output Dept Estimated
Capex 2009/2010
Estimated Opex 2009/2010
Estimated Capex 2010/2011
Estimated Opex 2010/2011
Estimated Capex 2011/2012
Estimated Opex 2011/2012
Source of Funding
Location Ward
PED 036 Youth Plenaries Feedback on youth service delivery
PED 01/07/2009
30/06/2010
R 30,000.00
R 40,000.00 R 50,000.00
Own Source
All Wards All Wards
PED 037 Annual Youth Assembly (Policy review)
Feedback on youth service delivery
PED 01/07/2009
30/06/2010
R 70,000.00
R 80,000.00 R 90,000.00
Own Source
All Wards All Wards
PED 038 June Youth month Youth participation in the June Youth Month
PED 01/07/2009
30/06/2010
R 100,00.00
R 100,00.00 R 100,00.00
Own Source
All Wards All Wards
PED 039 Disability Plenaries
Feedback on disability service delivery
PED 01/07/2009
30/06/2010
R 30,000.00
R 40,000.00 R 50,000.00
Own Source
All Wards All Wards
PED 040 Annual Disability Assembly (Adoption of Policy)
Feedback on disability service delivery
PED 01/07/2009
30/06/2010
R 70,000.00
R 80,000.00 R 90,000.00
Own Source
All Wards All Wards
PED 041 Disability month Disability participation in the Disability Youth Month
PED 01/07/2009
30/06/2010
R 50,00.00 R 50,00.00 R 50,00.00
Own Source
All Wards All Wards
PED 042 Gender Consultative meetings (Adoption of Policy)
Feedback on Gender programmes
PED 01/07/2009
30/06/2010
R 30,000.00
R 40,000.00 R 50,000.00
Own Source
All Wards All Wards
PED 043 Annual Women Assembly
Feedback on women service delivery
PED 01/07/2009
30/06/2010
R 70,000.00
R 80,000.00 R 90,000.00
Own Source
All Wards All Wards

160
PED 044 August Women‟s month
Women‟s participation in the August Women‟s Month
PED 01/07/2009
30/06/2010
R 50,00.00 R 50,00.00 R 50,00.00
Own Source
All Wards All Wards
INTEGRATED DEVELOPMENT PLAN
PED045 IDP Steering Committee Meetings
Consultative meetings to comply with legislation
PED 01/07/2009
30/06/2010
R 100,000.00
R 100,000.00 R 100,000.00
Own Source
All Wards All Wards
PED046 IDP Workshops Continiuos workshop for Management and politicians
PED 01/07/2009
30/06/2010
R 50,000.00
R 50,000.00 R 50,000.00
Own Source
All Wards All Wards
LAND, PROPERTY AND HOUSING PED047 Aquisation of
Land for Development
Intergrated Settlement. Access to affordavle Hoising. Increase revenue.
PED 1/07/2009
1/07/2011
R26 m GTM DLGH
PED048 Development of sites in Nkowankowa C
Access to affordable Housing.
PED 1/07/2009
1/07/2011
R700 000.00
GTM
PED049 Land Audit (Nkowankowa & Lenyenye)
Data on ownership of Land by GTM
PED Ongoing
Ongoing
R600 000.00
GTM
PED050 Land use Management and Prevention of illegal settlement
PED Ongoing
Ongoing
R30 000.00 GTM
PED051 Transfer of Land portion 292 and 293 of the farm Pusela 555 LT. Portion of the farm Moime. Transnet portions Nkowankowa, Letsitele and Tzaneen.
For Development To increase revenue
PED Ongoing
Ongoing
R10 M GTM

161
PED052 Farm Housing at Marimathema and Mosupatsela
Access to affordable Housing.
PED Ongoing
Ongoing
R10 M DLGH
PED053 Community Rental Units
Access to affordable Housing. Increase revenue.
PED Ongoing
Ongoing
R30 M DLGH
PED054 Housing Consumer Education
Public awareness on Housing code and other related acts.
PED Ongoing
Ongoing
R 40,000.00
GTM
PED055 Mariveni 50 units, Lephepane 100 units, Mandlakazi 100 units, Ward 5 PHP 100 units, Emergency units 20. Dan Ext 540 units.
Access to afford- able Housing
PED 01/08/2008
01/08/2009
DLGH
PED056 Implementation of Municipal Prop erty Rates Act in rural area and interim valuation
Increase Reve nue
PED 01/07/2009
R12 M GTM DLGH DBSA
PED057 Policies Reviewal of Alienation Policy Investigation of Sustainable Human Settllement
PED 01/07/2009
30/06/2010

162
Prevention of Illegal occupation of Land

163
MOPANI DISTRICT MUNICIPALITY 2009/ 2011 PRIORITY ISSUE: STRATEGIC INTENT: IMPROVE ACCESS TO SUSTAINABLE AND AFFORDABLE SERVICES PROGRAMME: FUNDER: MDM
IMPLEMENTING DEPARTMENT: TECHNICAL SERVICES
E: ECONOMIC S: SOCIAL & INFRASTRUCTURE G: GOVERNANCE No Name Category Target Location Budget Year 1
2008/09
Year 2
2009/10
Year 3
2010/11
Year 4
2011/12
Year 5
1012/13 1 Thabina RWS S & I Rural H/H GTM 19,015,296 19,015,296 - - - -
2 Lenyenye sewage works(plant and outfall sewer)
Social &
Infrastructure
GTM 121,082,000 8,222,000 112,860,000
3 LP002 Tours bulk water scheme(upgrading of pump station and reservoirs linking Lephephane
Social &
Infrastructure
GTM 15,000,000 15,000,000 - -
4 LP149 Ritavi RWS(upgrading and extension to existing plant, raising weir, additional pump mains)
Social &
Infrastructure
GTM 40,000,000 15,000,000 25,000,000 -
5 Jopie- Mawa Block 12- Ramotshinyadi bulk pipeline and reticulation
Social &
Infrastructure
GTM 15,000,000 15,000,000 - -
6 Upgrade of water reticulation and extensions: GTM
Social &
Infrastructure
GTM 31,000,000 - - 31,000,000
7 Mohlava- Moime cross road Social &
Infrastructure
GTM 4,500,000 4,500,000 - -
8 Modjadji to Mavele road upgrade
Social & GTM 13,600,000 13,600,000 - -
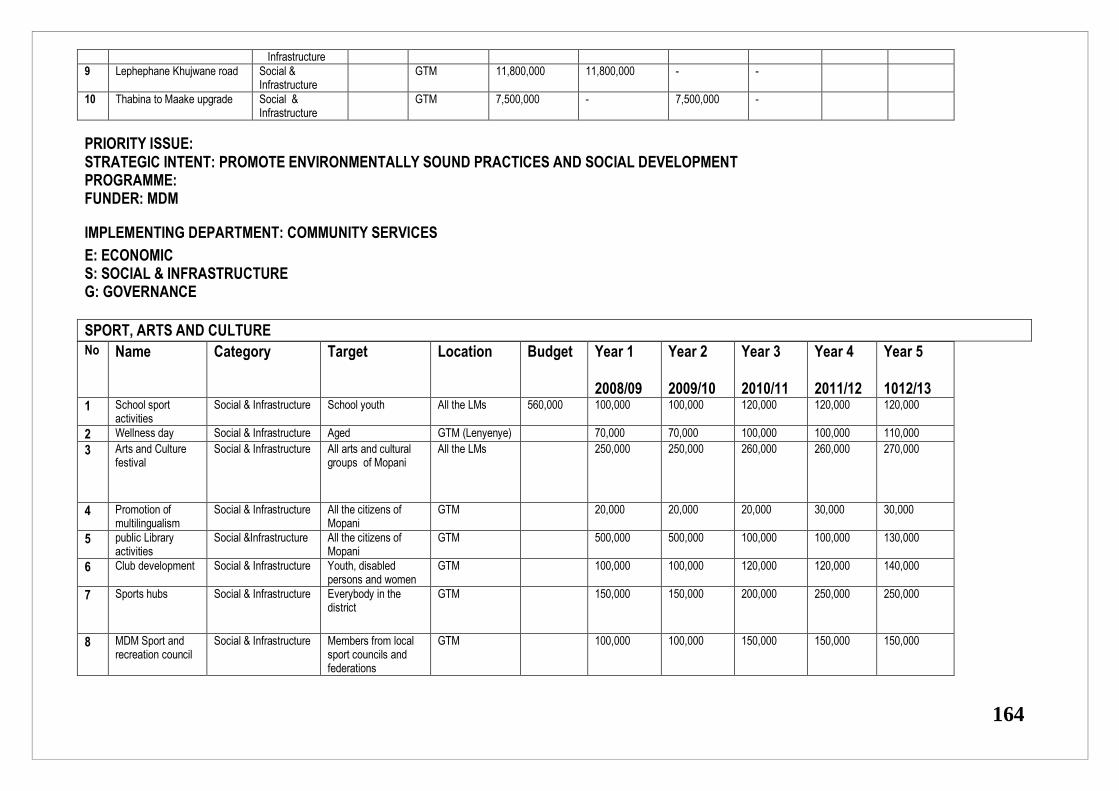
164
Infrastructure
9 Lephephane Khujwane road Social & Infrastructure
GTM 11,800,000 11,800,000 - -
10 Thabina to Maake upgrade Social & Infrastructure
GTM 7,500,000 - 7,500,000 -
PRIORITY ISSUE: STRATEGIC INTENT: PROMOTE ENVIRONMENTALLY SOUND PRACTICES AND SOCIAL DEVELOPMENT PROGRAMME: FUNDER: MDM
IMPLEMENTING DEPARTMENT: COMMUNITY SERVICES
E: ECONOMIC S: SOCIAL & INFRASTRUCTURE G: GOVERNANCE
SPORT, ARTS AND CULTURE
No Name Category Target Location Budget Year 1
2008/09
Year 2
2009/10
Year 3
2010/11
Year 4
2011/12
Year 5
1012/13 1 School sport
activities Social & Infrastructure School youth All the LMs 560,000 100,000 100,000 120,000 120,000 120,000
2 Wellness day Social & Infrastructure Aged GTM (Lenyenye) 70,000 70,000 100,000 100,000 110,000
3 Arts and Culture festival
Social & Infrastructure All arts and cultural groups of Mopani
All the LMs 250,000 250,000 260,000 260,000 270,000
4 Promotion of multilingualism
Social & Infrastructure All the citizens of Mopani
GTM 20,000 20,000 20,000 30,000 30,000
5 public Library activities
Social &Infrastructure All the citizens of Mopani
GTM 500,000 500,000 100,000 100,000 130,000
6 Club development Social & Infrastructure Youth, disabled persons and women
GTM 100,000 100,000 120,000 120,000 140,000
7 Sports hubs Social & Infrastructure Everybody in the district
GTM
150,000 150,000 200,000 250,000 250,000
8 MDM Sport and recreation council
Social & Infrastructure Members from local sport councils and federations
GTM 100,000 100,000 150,000 150,000 150,000

165
9 Development of cultural groups
Social & Infrastructure All the residents of Mopani
GTM
300,000 300,000 350,000 350,000 400,000
MUNICIPAL HEALTH SERVICES 10 District food control
activities Social &Infrastructure Women & youth and
disabled persons GTM
14,000 14,000 15,000 15,000 20,000
11 Food hygiene workshops
Social & Infrastructure Street traders (women & youth)
GTM
30,000 40,000 40,000 30,000 30,000
12 Food sampling Social & Infrastructure
All Mopani residents GTM
5,000 5,000 5,000 6,000 6,000
13 Water sampling and analysis
Social & Infrastructure All Mopani residents GTM
4,000 4,000 4,000 4,000 4,000
14 Initiation schools monitoring
Social & Infrastructure Youth GTM
11,000 11,000 12,000 12,000 12,000
15 Cleaning campaigns
Social & Infrastructure Women & youth GTM
80,000 80,000 80,000 90,000 90,000
ENVIRONMENT & WASTE MANAGEMENT 16 Air quality Social & Infrastructure All residents of MDM GTM
250,000 200,000 100,000 100,000 50,000
17 State of environment report school competition
Social & Infrastructure School youth GTM
80,000 80,000 90,000 90,000 100,000
18 Support recycling projects
Social & Infrastructure Youth, disabled & women
GTM
250,000 250,000 300,000 300,000 350,000
19 Support environmental management projects
Social & Infrastructure Youth, disabled & women
GTM
250,000 250,000 300,000 300,000 350,000
20 Improve sanitary facilities and fencing of cemeteries
Social & Infrastructure All citizens of MDM GTM
200,000 200,000 230,000 230,000 250,000
21 Eco schools Social & Infrastructure Schools GTM 35,000 35,000 30,000 30,000 30,000

166
22 Health and hygiene awareness
Social & Infrastructure
GTM
15,000 15,000 20,000 20,000 20,000
HIV AND AIDS
23 Funding of NGOs Social & Infrastructure NGO,s dealing with HIV and AIDS
GTM
500,000 500,000 500,000 600,000 600,000
24 District Aids Council
Social & Infrastructure All citizens of MDM GTM
55 000 55 000 55 000 60 000 60 000
25 Awareness campaigns ( 1st half)
-Dot supporter day
-School AIDS week
-Partnership
-Red Ribbon
-World Aids day
Social & Infrastructure
NGO‟s, FBO‟s, Youth, Disable and people living with HIV and AIDS
GTM 200,000 200,000 250,000 250,000 260,000
26 Awareness campaigns (2nd half)
-STI/Condom week
-TB day
-Candlelight memorial and -Moral regenesis
Social & Infrastructure NGO‟s, FBO‟s, Youth, Disable and people living with HIV and AIDS
GTM 200,000 200,000 200,000 250,000 250,000
27 Garden projects for HIV/AIDS purposes
Social & Infrastructure
NGO‟s, OVC, Chronic clients and PLHWA
GTM 200,000 200,000 250,000 250,000 280,000
28 Moral regeneration movement
Social & Infrastructure
Community, youth, People with disability and Aged
GTM 150,000 150,000 150,000 200,000 200,000

167
29 WIPPA and MIPPA
Social & Infrastructure
Men and Women GTM 50,000 50,000 55,000 60,000 60,000
30 IMPACT assessment HIV and AIDS Summit resolutions
Social & Infrastructure
NGO‟s, FBO‟s, Youth, People with disability , PLHWA and sectors
GTM - - 380,000 - -
HEALTH PROMOTION
31 Awareness campaigns (1st half)
- Cancer month
- World Diabetes day
- Wellness Day
Social & Infrastructure
Chronic clients ,the aged and people with disability
GTM
70,000 80,000 80,000 80,000 90,000
32 Clinic committees activities
Social & Infrastructure
All clinics GTM 50,000 50,000 50,000 60,000 60,000
33 Support visits to clinics, Hospital, visiting points and support groups for non- communicable disease
Social & Infrastructure
All clinics GTM 50,000 50,000 50,000 60,000 60,000
SAFETY AND SECURITY 34 Police cell
support Social & Infrastructure
Prisoners GTM - - - - -
35 Building Place of safety
Social & Infrastructure
Street kids, vulnerable children and geriatrics
t.b.d - - - 2million -
36 Funding of Victim Empowerment centre
Social & Infrastructure
Victims, NGO‟s and community
GTM 350, 000 350,000 360,000 360,000 380,000
37 Community policing forums
Social & Infrastructure
Community and CPF members
GTM 100,000 100,000 80,000 80,000 90,000

168
EDUCATION 38 Career exhibition Social &
Infrastructure Grade 12 learners GTM 100,000 100,000 100,000 120,000 120,000
39 School libraries Social & Infrastructure
All learners GTM 200,000 200,000 200,000 250,000 250,000
40 Further Education and Training
Social & Infrastructure
Students and community members
GTM 10,000 10,000 15,000 15,000 20,000
41 ABET Social & Infrastructure
Adult learners GTM 10,000 10,000 15,000 15,000 20,000
42 Support of crèches
Social & Infrastructure
Early childhood development associations
GTM - 150,000 180,000 200,000 250,000
PRIORITY ISSUE: STRATEGIC INTENT: CREATE A STABLE ECONOMIC ENVIRONMENT BY ATTRACTING SUITABLE INVESTORS PROGRAMME: FUNDER: MDM
IMPLEMENTING DEPARTMENT: PLANNING AND DEVELOPMENT E: ECONOMIC S: SOCIAL & INFRASTRUCTURE G: GOVERNANCE
PLANNING
No Name Category Target Location Budget Year 1
2008/09
Year 2
2009/10
Year 3
2010/11
Year 4
2011/12
Year 5
1012/13 1 Sites Demarcation
Support layout plan generating & surveying) Nkambako 250 sites
GTM 500 000
2 Site Demarcation Support (Surveying)
GTM 200 000

169
Mariveni 200 sites
3 Site Demarcation ( layout plan & surveying) Muhlaba Headkraal 150 sites
GTM - 500 000
4 Site demarcation (layout plan development & surveying) Mugwazeni 200 sites
GTM - 600 000
5 Site Demarcation( layout plan & surveying) Nkowa²
GTM - - 1 000 000
6 Site Demarcation( layout plan & surveying) N Lenyenye
GTM - - 1 000 000
Local Economic Development 7 Fresh Produce Market LED Farmers (GTM)Nkowankowa 22,900,000 8,700,000 8,300,000 5,900,000 8 Moshupatsela
Farm(Atchaar factory, Dried Fruit Factory, and Chilli Production Equipments)
LED Emerging Farmers
GTM(Tzaneen 8,288,000 4,688,000 1,700,000 1,900,000
9 International marketing and exhibitions
LED International investors
650,000 150,000 200,000 300,000
10 Summits:LED, Agric, Tourism and Mining
LED Farmers, Tourism Operators, Mining Houses, SMMEs
250,000 - - 250,000

170
PRIORITY ISSUE:
STRATEGIC INTENT: SUSTAINABLE QUALITY OF LIFE
PROGRAMME: FUNDER: Mopani District Municipality
IMPLEMENTING DEPARTMENT: Office of the Executive Mayor
LMs: BaPhalaborwa, Giyani, Letaba, Maruleng or Tzaneen
No
Name
Category
Target
Location
Budget
Year 1
2008/09
Year 2
2009/10
Year 3
2010/11
Year 4
2011/12
Year 5
1012/13
1
District Mayor‟s Forum
Governance
Local Mayors
LM
GE
GE
GE
GE
GE
GE
2
Izimbizo
Governance
Rural H/H
LM
990,000
150,000
170,000
200,000
220,000
250,000
3
Outreach Campaigns
Governance
Rural H/H
LM
GE
GE
GE
GE
GE
GE
4
House of Traditional Leaders
Governance
Traditional Leaders
LM
GE
GE
GE
GE
GE
GE
5
Anti-Corruption Forum
Governance
Business, Labour & Civil Society
LM
740,000
100,000
120,000
150,000
170,000
200,000
6
Mayor‟s Charity Cup
Social & Infrastructure
Football Clubs, Charity Org., Tourists
LM
6,400,000
1,000,000
1,200,000
1,300,000
1,400,000
1,500,000
7
Excellence Awards
Governance
Stakeholders & Public Servants
LM
2,350,000
350,000
400,000
450,000
500,000
550,000
8
Children‟s Advisory Council
Social & Infrastructure
Children‟s Organisations
LM
610,000
100,000
120,000
150,000
170,000
70,000
9
Children‟s Parliament
Social & Infrastructure
Children
LM
740,000
120,000
150,000
170,000
200,000
100,000
Social &
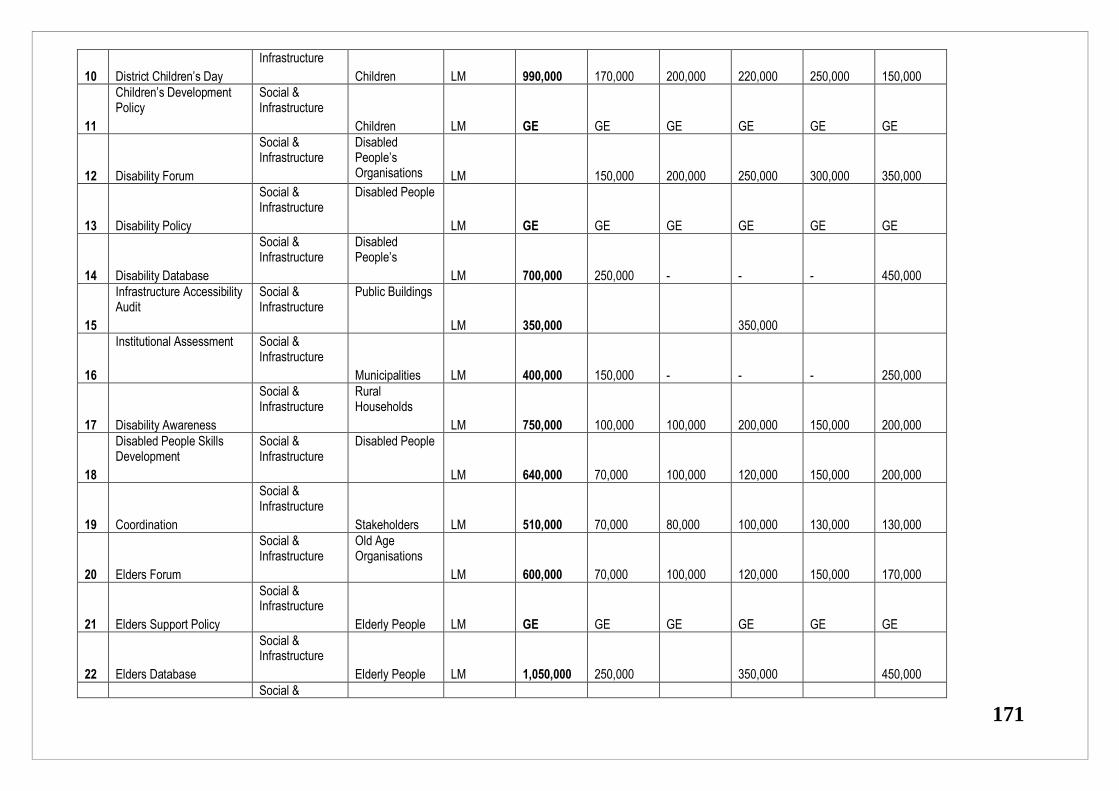
171
10 District Children‟s Day
Infrastructure
Children LM 990,000 170,000 200,000 220,000 250,000 150,000
11
Children‟s Development Policy
Social & Infrastructure
Children
LM
GE
GE
GE
GE
GE
GE
12
Disability Forum
Social & Infrastructure
Disabled People‟s Organisations
LM
150,000
200,000
250,000
300,000
350,000
13
Disability Policy
Social & Infrastructure
Disabled People
LM
GE
GE
GE
GE
GE
GE
14
Disability Database
Social & Infrastructure
Disabled People‟s
LM
700,000
250,000
-
-
-
450,000
15
Infrastructure Accessibility Audit
Social & Infrastructure
Public Buildings
LM
350,000
350,000
16
Institutional Assessment Social & Infrastructure
Municipalities
LM
400,000
150,000
-
-
-
250,000
17
Disability Awareness
Social & Infrastructure
Rural Households
LM
750,000
100,000
100,000
200,000
150,000
200,000
18
Disabled People Skills Development
Social & Infrastructure
Disabled People
LM
640,000
70,000
100,000
120,000
150,000
200,000
19
Coordination
Social & Infrastructure
Stakeholders
LM
510,000
70,000
80,000
100,000
130,000
130,000
20
Elders Forum
Social & Infrastructure
Old Age Organisations
LM
600,000
70,000
100,000
120,000
150,000
170,000
21
Elders Support Policy
Social & Infrastructure
Elderly People
LM
GE
GE
GE
GE
GE
GE
22
Elders Database
Social & Infrastructure
Elderly People
LM
1,050,000
250,000
350,000
450,000
Social &

172
23 Elders Day
Infrastructure
Elderly People LM 990,000 150,000 170,000 200,000 220,000 250,000
24
Elders Dialogue
Social & Infrastructure
Elderly People
LM
740,000
100,000
120,000
150,000
170,000
200,000
25
Gender Consultative Forum
Social & Infrastructure
Gender-Based Oranisations
LM
990,000
150,000
170,000
200,000
220,000
250,000
26
Men‟s Forum
Social & Infrastructure
Men and Boys
LM
730,000
100,000
120,000
150,000
170,000
200,000
27
Gender Policy
Social & Infrastructure
Men & Women
LM
GE
GE
GE
GE
GE
GE
28
Impact Assessment
Social & Infrastructure
Mopani Citizens
LM
350,000
-
350,000
-
-
-
29
Institutional Assessment Social & Infrastructure
Municipalities
LM
400,000
150,000
-
-
-
250,000
30
Women‟s Month
Social & Infrastructure
Women
LM
740,000
100,000
120,000
150,000
170,000
200,000
31
16 Days of Activism
Social & Infrastructure
Women & Children
LM
740,000
100,000
120,000
150,000
170,000
200,000
32
SAWID
Social & Infrastructure
Women
LM
540,000
120,000
30,000
150,000
40,000
200,000
33
Capacity Building
Social & Infrastructure
Women & Men
LM
780,000
70,000
100,000
150,000
200,000
250,000
34
Public Education & Awareness
Social & Infrastructure
Rural H/H
LM
740,000
100,000
120,000
150,000
170,000
200,000
35
Coordination
Social & Infrastructure
Stakeholders
LM
490,000
50,000
70,000
100,000
120,000
150,000
Social & Youth

173
36 Youth Council
Infrastructure Organisations
LM 990,000 150,000 170,000 200,000 220,000 250,000
37
Youth Policy
Social & Infrastructure
Youth
LM
GE
GE
GE
GE
GE
GE
38
Youth Database
Social & Infrastructure
Youth
LM
1,050,000
250,000
-
350,000
-
450,000
39
Institutional Assessment Social & Infrastructure
Municipalities
LM
400,000
150,000
-
-
-
250,000
40
Youth Civic Education/Campaigns
Social & Infrastructure
Youth
LM
250,000
-
100,000
-
150,000
-
41
Youth Month
Social & Infrastructure
Youth
LM
740,000
100,000
120,000
150,000
170,000
200,000
42
Youth Guide
Social & Infrastructure
Youth
LM
350,000
-
350,000
-
-
-
43
Youth Skills Development Social & Infrastructure
Youth
LM
600,000
100,000
150,000
100,000
100,000
150,000
44
Coordination
Social & Infrastructure
Stakeholders
LM
490,000
50,000
70,000
100,000
120,000
150,000

174
PRIORITY ISSUE:
STRATEGIC INTENT: PROMOTE ENVIRONMENTALLY SOUND PRACTICES AND SOCIAL DEVELOPMENT
PROGRAMME:
FUNDER: MDM
IMPLEMENTING DEPARTMENT: DISASTER MANAGEMENT
E: ECONOMIC
S: SOCIAL & INFRASTRUCTURE
G: GOVERNANCE
No
Name
Category
Target
Location
Budget
Year 1
2008/09
Year 2
2009/10
Year 3
2010/11
Year 4
2011/12
Year 5
1012/13
1 Disaster Management Centre and Fire Station(Implementation by Technical Services)
Emergency Services
MDM Households
Tzaneen 34,000,000 6,500,000 7,5000,000 8,000,000 8,500,000 -
2 Radio, Communication, Info.Management System
Emergency Services
MDM Households
Tzaneen 4,300,000 2,400,000 2,544,000 2,700,000 - -
3 Disaster Management Equipment
Emergency Services
MDM Households
Tzaneen 75,000 75,000 5,000 5,000 5,000 -
4 GIS & Information Connection
Emergency Services
MDM Households
Tzaneen 300,000 30,000 33,000 36,000 40,000 44,000
5 Awareness Campaigns Emergency Services
MDM Households
All Local Mun.
600, 000 187, 000 191,000 202,500 - -

175
MDM 2009/10 IDP PROJECTS IN GTM GTM SPECIFIC PROJECTS/ PROGRAMMES
Project Name Location Funder
Water & Sanitation
1. Lenyenye sewerage works (plant and outfall sewer) Lenyenye MDM
2. Tours bulk water scheme (upgrading of pump station and reservoirs linking Lephepane) GTM MDM
3. Nkambako RWS (Additional pump station)
4. Ritavi RWS (upgrading and extension to existing plant raising weir, additional pump station) GTM MDM
5. Upgrade of water reticulation and extensions: GTM GTM MDM
6. Upgrading of Tzaneen Sewerage plant Tzaneen MDM
7. Upgrading of Nkowankowa Sewerage Plant Nkowankowa MDM
8. Mopani Rural Household Sanitation 132 villages MDM
Project Name Location Funder
Infrastructure: Sporting facility & District Offices

176
1.Lenyenye Stadium Lenyenye MDM
2.Extension of Mopani Office Building Tzaneen MDM
Roads and Transport
1. Modjadji to Mavele Road upgrade GTM MDM
2. Lephepane – Khujwane road GTM MDM
3. Thabina to Maake Road upgrade GTM MDM
4. Kgweetsi – Tours Access Road GTM MDM
5. Upgrading of gravel to tar: Mawa-Mavele-Xihoko –GaMokgwathi-Dzumeri-Mushiyani-Makhuva GTM RAL
6. Upgrading of Gravel to tar: Rita/Tickyline- Burgersdorp-Julesburg/Rhulani-Hoveni to Callaise- Baloon-Sekororo
GTM RAL
7. Upgrading of gravel to tar: Deerpak to Mamitwa to Nkambako GTM RAL
8.Upgrading of Pedestrian footpath,Tzn-Lenyenye Tzaneen DoRT
9. Construction of Tzaneen K53 testing station GTM DoRT
Project Name Location Funder
ELECTRIFICATION
Mafarana phase 1: 1020 connections GTM ESKOM
Franchoise Vorster: 13 GTM DME
F.J. Du Toit: 5 GTM DME

177
Heindrich Kubannek: 1 GTM DME
Henk Schoeman A: 7 GTM DME
Henk Schoeman B: 12 GTM DME
Henk Schoeman C: 13 GTM DME
IG Van Rensberg: 8 GTM DME
Isak Lombaard: 11 GTM DME
J.P Kasselman: 3 GTM DME
Julius Smuts: 3 GTM DME
Maartin Visagie: 201 GTM DME
Neels Osmers: 1 GTM DME
Project Name Location Funder
ELECTRIFICATION
Nic van Schalkwyk A:17 GTM DME
Nic van Schalkwyk B: 5 GTM DME
Nic van Schalkwyk C: 2 GTM DME
Nico Devillers: 4 GTM DME

178
Pieter Human A: 3 GTM DME
Pieter Human B: 4 GTM DME
Pieter Venter: 2 GTM DME
Pieter Vermaak: 12 GTM DME
T. Parsons: 2 GTM DME
Westfalia Mahupa: 65 GTM DME
Westfalia Maruka B: 55 GTM DME
Mafarana: 788 GTM DME
Vick Walkensaw: 2 GTM DME
Project Name Location Funder
EDUCATION
Dinaledi Schools upgrading and revitalization
1. Hudson Ntsan‟wisi High GTM DoE
2. Tivumbeni EMPC GTM DoE
Condemned and Congested Schools
1. Letaba LSEN GTM DoE
2. Banana Primary GTM DoE
Maintenance and Repairs

179
1. Hoerskool Ben Vorster GTM DoE
2. Laerskool Dr Annecke GTM DoE
3. Laerskool Tzaneen GTM DoE
4. Merensky High GTM DoE
Project Name Location Funder
Local Economic Development
1. Fresh Produce Market Tzaneen MDM
2. Moshupatsela Programme Tzaneen MDM
3. Formalisation of Informal markets Letsitele MDM
AGRICULTURE: CASP (Comprehensive Agriculture Support Programme)
4. Mlangeni - Mapheto (irrigation infrastructure) GTM DoA
5. Madidi GTM DoA
AGRICULTURE: RESIS (Rehabilitation of Smallholder Irrigation Scheme) and IGP (Integrated Growth Product) Projects
6. Mapheto Trust (Banana Processing facility) GTM DoA
7. Ditubatse (Fruit grading facility) GTM DoA
Project Name Location Funder
Local Economic Development (cont.)
RESIS Project
7.Julesburg GTM DoA

180
8. Lephepane GTM DoA
9. Thabina GTM DoA
10. Tours GTM DoA
National Development Agency (NDA)
11. Choice Trust GTM DoA
12. Merekomme Farmers Co-operative GTM DoA
13. Human resource Information Centre GTM DoA
Spatial Development Planning
1.Site Demarcation Support to LMs Nkambako/Valoyi Mugwazeni/Valoyi
Nkowankowa Lenyenye Mariveni
250 sites 200 sites
1000 sites 1000 sites 200 sites
SECTOR DEPARTMENTS PROJECTS 2009 – 2013
Road Agency Limpopo 1. MDM Upgrading – gravel to tar Mamitwa to Mavele, Xihoko to
Gawale, GaMokgwathi to Dzumeri, Mushiyani to Makhuva
53 000 000 35 000 000 - 18 000 000
2. MDM Upgrading –gravel to tar Mokwakwaila 53 000 000 35 000 000 - 18 000 000
3 MDM Upgrading –gravel to tar Rita/Tickieline – Burgersdorp,Julesburg/Rhulani – Hoveni, Calaise t- Balloon to Sekororo
53 000 000 - 33 000 000 20 000 000
4 GTM Upgrading gravel to tar Mooketsi – Houtbosdorp 48 000 000 - 15 000 000 33 000 000
5 MDM Upgrading gravel to tar Thomo/Altein – Khakhala -Gwula - Mahlathi- Ndindani Hlomela –Phalaubeni. Mbawula -Phalaborwa
53 000 000 5 000 000 15 000 000 333 000 000
Roads and Transport 1 GTM Regravelling P 17/3- P112/2- D1826 (30.44km) 1 510 358 1 510 358 - -
2 GTM Rgravelling Ramochinyali – Mokgwati (8 km) 396 940.40 - 396 940.40 -

181
3 GTM Regravelling Grootbosh – D1801(6.68 km) 331 445.20 - - 331 445.20
Department of Health and Social Development Infrastructure Planning
Social Development Infrastructure projects 4 GTM One Stop Centre Satellite Relela 2 000 000 - 1 200 000 800 000
5 GTM One Stop Centre Satellite Tickyline 2 000 000 - 1 200 000 800 000
Health Infrastructure Projects 6 GTM Letaba Hospital Nkowankowa 69 000 000 67 000 000 2 000 000 -
7 GTM Mawa Clinic Mawa Block 8 460 000 460 000 - -
8 GTM Lenyenye Clinic Lenyenye 2 780 000 2 780 000 - -
9 GTM Loloka Clinic Loloka 4 700 000 - 2 500 000 2 200 000
10 GTM CN Phatudi EMS 4 714 000 4 714 000 - -
Department of Public Works 1 MDM Maintenance of residential houses Renovation of (53)
residential houses
250 000
Renovation of (59) houses
290 000
Renovation of (44) houses
200 000
2 MDM Acquisition of mechanical and construction equipments
650 000 500 000 400 000
3 MDM Construction of government buildings Electrical reticulation at Benfarm
380 000
Construction of 30 camp houses
926 100
Construction of 30 camp houses
972 405
4 MDM Construction of 20x covered parkings in Tzaneen
80 000
Construction of 20x covered parkings at Naphuno
80 000
Construction of 20x covered parkings at Phalaborwa
80 000
5 MDM Construction of Palisade fence Construction of palisade fence at Giyani main stores (900m)
390 000
Construction of palisade fence at Naphuno cost centre 600m
300 000
Construction of palisade fence at Tzaneen cost centre (800m) & Sekgosese cost centre (400m)
800 000
6 MDM ECD Project(construction of 2 classrooms, fence and borehole
5 day care centre 3 day care centres, molatelo, Ngode drop in centre &
4 day care centres, Nhlalala, Seoratsatsi day care, Mpo crèche & Rotterdam

182
3 250 000
Gingirikani
2 145 000
drop in centre
3 146 000
7 MDM Eradication of mud schools Construction of 5x4 classroom blocks
2 475 000
Construction of 5x4 classroom blocks
2 722 500
Construction of 5x4 classrooms
2 994 750
8 MDM Maintenance and development of grounds
Development of landscaping Giyani cost centre (10334m²) and maintenance of 22.3 hectares
826 720
Development of landscaping Sekgosese cost centre (2575m²) & maintenance of 22.5 hectares
300 000
Development of landscaping Tzaneen cost centre (3500m²) & maintenance of 23hectares
350 000
No. Mun. Project Location Budget 2008/09 2009/10 2010/11
Department of Education
Off Shoot Schools 1. GTM Mabje-a-Kgoro Primary 6,000 3,500 3,500
Condemned/Congested Schools (Additional Classrooms & Sanitation Facilities) 2. GTM Mamoding Secondary 700 1,500 1,600
3. GTM Unity Primary 700 1,500 1,600
4. GTM Senwabakgololo Sec. 1,400 1,500 1,600
Condemned/Congested Schools- (2nd Phase – Admin Blocks) 5 GTM Mushothi Primary 750 800
6 GTM Vhulakanjhani Primary 750 800
7 GTM Nyavana Primary 750 800
8. GTM Botludi Primary 750 800
Upgrading & Revitalise Infrastructure 1. GTM Hudson Ntsanwisi P. 6000 7000 8000
Emergency Renovation & Maintenance 2 GTM Mushothi Primary 750 800
3 GTM Vhulakanjhani Primary 750 800
4 GTM Nyavana Primary 750 800
5 GTM Botludi Primary 750 800

183
Upgrading & Revitalise Infrastructure 1. GTM Hudson Ntsanwisi P. 6000 7000 8000
Emergency Renovation & Maintenance 1. MDM Allowance for Emergency &
Maintenance 4,405.00 5,780.00 6,800.00
SECTOR DEPARTMENTS PROJECTS 2009 – 2013
Road Agency Limpopo 1. MDM Upgrading to tar( Gy-
Phalaborwa road GGM 69 000 000 - 33 000 000 36 000 000
2. MDM Upgrading – gravel to tar Mamitwa to Mavele, Xihoko to Gawale, GaMokgwathi to Dzumeri, Mushiyani to Makhuva
53 000 000 35 000 000 - 18 000 000
3. MDM Upgrading –gravel to tar Modjadji-Mokwakwaila- Bambeni-Nkomo
53 000 000 35 000 000 - 18 000 000
4 MDM Upgrading –gravel to tar Rita/Tickieline – Burgersdorp,Julesburg/Rhulani – Hoveni, Calaise t- Balloon to Sekororo
53 000 000 - 33 000 000 20 000 000
5 GTM Upgrading gravel to tar Mooketsi – Houtbosdorp 48 000 000 - 15 000 000 33 000 000 6. GGM Ugrading: Gundu-Lashu Homu14b Homu 14a ,Mapayeni-
Mahlathini & Mapayeni to Vuhehli 6 300 000 - - 6 300 000
7 MDM Upgrading gravel to tar Thomo/Altein – Khakhala -Gwula - Mahlathi- Ndindani Hlomela –Phalaubeni. Mbawula -Phalaborwa
53 000 000 5 000 000 15 000 000 333 000 000
8 MLM Upgrading – gravel to tar Hoedspruit to Timbavati Reserve 29 000 000 - 10 000 000 19 000 000
9. GGM Upgrading gravel to tar Thomo to Altein to Shangoni gate 61 000 000 - 33 000 000 28 000 000 10 GLM Ugrading : Gundo lashu Nakampe – Botshabelo- Skhiming 10 950 000 - 7 500 000 3 450 000
11 MLM Ugrading : Gundo lashu Mulalane- Crossing Mabins 7 500 000 - 7 500 000 -
12 GLM Upgrading : Gundo lashu Mafarana – Gabaza 7 000 000 - 7 000 000 -
13 MLM Upgrading : Gundo Lashu Tickyline – Sofaya 3 500 000 - 3 500 000 -
14 GGM Upgrading : Gundo lashu Jokong – Shimange 5 700 00 - - 5 700 000
15 MDM Maintenance of Gundo lashu roads
MDM 2 000 000 - 1 000 000 1 000 000
Roads and Transport 1 GTM Regravelling P 17/3- P112/2- D1826 (30.44km) 1 510 358 1 510 358 - -
2 GTM Rgravelling Ramochinyali – Mokgwati (8 km) 396 940.40 - 396 940.40 -

184
3 GTM Regravelling Grootbosh – D1801(6.68 km) 331 445.20 - - 331 445.20
Department of Health and Social Development Infrastructure Planning
Social Development Infrastructure projects
4 GTM One Stop Centre Satellite Relela 2 000 000 - 1 200 000 800 000 5 GTM One Stop Centre Satellite Tickyline 2 000 000 - 1 200 000 800 000
Health Infrastructure Projects
6 GTM Letaba Hospital Nkowankowa 69 000 000 - 46 995 000 2 000 000 -
7 GTM Mawa Clinic Mawa Block 8 460 000 460 000 - -
8 GTM Lenyenye Clinic Lenyenye 2 780 000 2 780 000 - -
9 GTM Loloka Clinic Loloka 4 700 000 - 2 500 000 2 200 000
10 GTM CN Phatudi EMS 4 714 000 4 714 000 - -
Department of Public Works 1 MDM Maintenance of Government
buildings Giyani and Namakgale Refurbishment of
Giyani cost centre, Giyani main store & Namakgale govt. complex 1 600 000
Refurbishment of Tzaneen cost centre 230 000
Refurbishment of Naphuno cost centre 550 000
2 MDM Maintenance of residential houses
Renovation of (53) residential houses 250 000
Renovation of (59) houses 290 000
Renovation of (44) houses 200 000
3 MDM Acquisition of mechanical and construction equipments
650 000
500 000
400 000
4 MDM Construction of government buildings
Electrical reticulation at Benfarm 380 000
Construction of 30 camp houses 926 100
Construction of 30 camp houses 972 405
5 MDM Construction of 20x covered parkings in Tzaneen 80 000
Construction of 20x covered parkings at Naphuno 80 000
Construction of 20x covered parkings at Phalaborwa 80 000
6 MDM Construction of Palisade fence Construction of palisade fence at Giyani main stores (900m)
Construction of palisade fence at Naphuno cost centre 600m
Construction of palisade fence at Tzaneen cost centre (800m) & Sekgosese cost

185
390 000
300 000
centre (400m) 800 000
7 MDM ECD Project(construction of 2 classrooms, fence and borehole
5 day care centre 3 250 000
3 day care centres, molatelo, Ngode drop in centre & Gingirikani 2 145 000
4 day care centres, Nhlalala, Seoratsatsi day care, Mpo crèche & Rotterdam drop in centre 3 146 000
8 MDM Eradication of mud schools Construction of 5x4 classroom blocks 2 475 000
Construction of 5x4 classroom blocks 2 722 500
Construction of 5x4 classrooms 2 994 750
9 MDM Maintenance and development of grounds
Development of landscaping Giyani cost centre (10334m²) and maintenance of 22.3 hectares 826 720
Development of landscaping Sekgosese cost centre (2575m²) & maintenance of 22.5 hectares 300 000
Development of landscaping Tzaneen cost centre (3500m²) & maintenance of 23hectares 350 000

186
6. PHASE 4- INTEGRATION
INTRODUCTION
During Phase 4, sub-programme proposals, which were presented in the preceding phase, have to be harmonized in terms of contents, location and timing in order to achieve consolidated integrated programmes for the Greater Tzaneen Municipality. The major output for Phase 4 is an INTEGRATION OF PLANS AND PROGRAMMES which includes:
1. Financial Recovery Plan 2. Electricity Plan 3. Transport Plan 4. Integrated Waste Management Plan 5. Spatial Development Framework 6. Integrated Disaster Management Plan 7. Environmental Management Plan 8. HIV/AIDS Plan 9. Local Economic Development Strategy 10. Oganisational Performance Management System 11. Employment equity Plan 12. Housing Chapter
The foolowing are not available:-
a) Air quality plan b) Five Year Financial Plan c) Risk Management Plan‟ d) Five Year Capital Investment Plan e) Water Sector Development Plan f) Health Plan g) Social Crime Prevention Strategy h) Poverty Alliviation Plan i) Organisational Plan j) Education Plan
1. INTERNAL FINANCIAL RECOVERY PLAN - REVISED Purpose of the report
To develop and implement a discretionary recovery plan to prevent a possible intervention by the Provincial Executive in terms of section
141 of the MFMA
Background
Chapter 13 of the MFMA provides for cases where a municipality experiences financial problems. Section 135(1) provides that the
responsibility to avoid, identify and resolve financial problems rests with the municipality itself.
Section 135(3) provides that if a municipality experiences financial problems or anticipates problems in meeting its financial obligations it
must immediately seek solutions for the problem. The section goes on further to provide that the MEC for Local Government must be
informed together with SALGA. The Act further states that when the MEC becomes aware of potential problems in a municipality he should
investigate the problem and amongst others institute a financial recovery plan that would ensure that the municipality is able to render
services and meet its financial obligations.
Section 138 provides the following criteria for determining serious financial problems:

187
“The municipality has failed to make payments as and when due;
The municipality has defaulted on financial obligations for financial reasons.
The actual current expenditure of the municipality has exceeded the sum of its actual current revenue plus available surpluses for at least two consecutive financial years.
The municipality had an operating deficit in excess of five per cent of revenue in the most recent financial year for which financial information is available.
The municipality is more that 60 days late in submitting its annual financial statements to the Auditor General in accordance with section 126.
The Auditor General has withheld an opinion or issued a disclaimer due to inadequacies in the financial statements or records of the municipality or has issued an opinion which identifies a serious financial problem in the municipality.
Any of the conditions exists in a municipal entity…
Any other material condition exists which indicates that the municipality… is likely to be unable for financial reasons to meet its obligations.”
While the municipality has not as yet satisfied most of the criteria indicated above it should be indicated that current developments have
indicated that the municipality has certainly met condition (h). Unless drastic measures are taken the municipality could soon meet most of
the conditions as indicated above with the consequent action by the MEC.
Taking into account the severity of the problem facing the municipality and the consequent negative publicity that will follow a mandatory
provincial intervention as per section 139 of the MFMA a decision was taken to draft a self-imposed financial recovery plan that would take
into account all the principles of financial recovery plan as per Chapter 13 of the MFMA. In line with the spirit of section 146 the
implementation of the IDP and budget will be in such a way as to give effect to this plan. This plan also aims to address the issues raised
during the budget adjustment process. It should further be borne in mind that a financial recovery plan can on its own not resolve the
problems as identified unless is it is accompanied by financial discipline and buy-in from all concerned.
Deliberations
The financial problems that are besetting the municipality have been identified for some time and some measures were previously taken to
address these. These measures included the decision by the Municipal Manager during the last financial year to embark on a financial
belt-tightening exercise. Subsequent to that a report was submitted to the Mayor indicating the nature of the problems facing the
municipality. This report is attached hereto for information purposes. An obvious indication of the problems facing the municipality was the
need to increase the municipality‟s overdraft from R5 million to R20 million and the fact that the municipality will have to fund its capital
projects for the current year out of a loan. According to the provisions of the MFMA the municipality should not have an overdraft at year-
end but as of the 2006/07 financial year-end the municipality still had an overdraft of R17 million outstanding. At the end of the 2005/06
financial year the overdraft was standing at about R4 million. An investigation of the collections as per the budget has indicated that the
municipality is collecting all monies as budgeted after taking into account the provision for bad debts. This is then is an indication that the
problem is not resting only in the current financial year but is both the effect of current operations and past problems that were not
addressed.
Some of the past problems that have been carried forward without being addressed are the following:
Grant money received in previous years was used to finance other operational expenditure resulting in cash flow deficit of about R 24 million.
Appointment of personnel for which no budgetary provision was made.
Increase in Councillors‟ allowances after the budget was approved.
Current budgets that did not take into account the overdraft existing at the end of the financial year.
As of 09 July 2007 the municipality effectively has no cash in the bank as it currently has an overdraft of R 18,4 million and still has
payments to be made for the June 2006 month-end. The high collection period for the municipality is from 20th to 25th of every month. This
is then an indication that nothing major in terms of collection can happen until that time, which is two weeks away. A detailed cash flow
analysis, which is submitted as part of the monthly reports, which indicates the severity of the problem is attached hereto.
Strategies
Appointments
Each proposed appointment should be motivated to ensure that the position is indeed critical, necessary and budgeted for and that it be
submitted to the Executive Committee for approval

188
The prior approval of the CFO and the MM be obtained for appointment of temporary personnel, casuals and students and only if provision
has been made on the budget for such (Council Resolution A10 of 29 May 2007)
All cases of suspended officials be finalized as soon as possible but not later that 3 months.
Overtime
The decision of EXCO with regards to overtime Item A10 of 29 May 2007 be reconfirmed and changed to read as follows strictly adhered
to:
“(c) That the payment of overtime for all officials, with the exception of the officials on official standby Civil Engineering
Department, Community Services Department and Electrical Engineering Department be stopped.
That where necessary time off be given for overtime worked by officials not in the departments mentioned above.
That a list of officials who may work paid overtime mentioned in “C” above be submitted by the relevant departments to the Chief
financial Officer.
That all paid overtime be approved by the Head of Department (Manager).”
A report on all overtime worked indicating the nature of the work done and reasons for paid overtime to be submitted to EXCO as part of
the monthly reports.
Acting allowance
All acting allowance must be assessed and confirmation received that provision has been made on the budget to accommodate it before
the person can act in that position. The Chief Financial Officer must approve the acting allowance and confirm that provision was made
on the 2007/2008 budget.
Procurement of goods and services
That no procurement of goods, services and long-term contracts be entered into prior to written confirmation from the CFO of the
availability of funds and the financial viability of the project.
Capital expenditure
No capital expenditure be entered into for the 2007/08 financial year until the loan has been finalized and the funds received.
That a cash flow schedule be submitted to the CFO not later than the end of July 2007 by the relevant manager for all capital projects
indicating the timing of all cash requirements.
That no bid be awarded if the cost is more than the budgeted amount.
General expenditure
That the prior approval of the Chief Financial Officer be obtained for expenditure other than fixed cost. (Council Resolution A 10 of 29
May 2007).
The Telephone calls must be managed by the HOD‟s and Managers.
Control measures
To accommodate the R 24 million cash flow backlog it is recommended that:
Actual expenditure be kept less than R3 million of the actual revenue received to address the cash flow problem within 7 months.
Monthly reports, including cash flow statements on achieving the above mentioned goals be compiled and submitted to the
Municipal Manager and the Mayor.
That the results of the Discretionary Financial Recovery Plan be assessed during December 2007 and that corrective measures be implemented if necessary.
Weekly management meetings of HOD‟s and managers be held to assess progress
All temporary positions be assessed and motivated and a report be submitted to management
The financial recovery plan must be approved by Council
189
Full credit control be instituted on all accounts in Lenyenye and Nkowankowa on which there is not dispute.
Legal action be taken to recover all outstanding monies for stand sales
Investigate methods of responsible disposal of municipal land
Encashment of leave days should be done as per the attached plan
All redundant municipal assets should be auctioned before the end of October 2007.
Urgent and concerted efforts should be made to collect all outstanding traffic fines.
2. ELECTRICAL PLAN Electrical Department of the GTM Introduction Management recently completed a “Departmental Crisis Report”, also known as the “420 Million” report which is a plan to address all the major issues preventing the Electrical Department from providing electricity at sufficient capacity and quality to all the inhabitants of both the GTM area of jurisdiction and within the licensed electrical distribution area as approved by NERSA (National Energy Regulator of South Africa). The three main issues addressed in the Crisis Report were
a) Electrification b) Deteriorating state of the existing system (including both maintenance and capital reinvestment without which
the quality of supply constantly deteriorates) c) Insufficient available capacity to supply additional electrical load and natural load growth
The recent unprecedented growth and mushrooming developments in the area has placed the Council in the thorny position of not being able to provide future developments with electrical capacity due to the combined effects of an aged system and insufficient infrastructure due to lack of sufficient capital reinvestment. The effect of this is to prevent future developments from occurring which in turn „puts a cap‟ on Council‟s potential growth in income from electricity sales. This unfortunate necessity has the potential to sound the „death knell‟ of the Municipality and is probably the biggest threat to Councils continued sustainability. This Financial Recovery Plan is supplemental to the Crisis Report and addresses the specific issue of,
„What are the minimum technical inputs to be able to confidently supply all current and predicted developmental nodes with sufficient electrical capacity and quality, in the quickest and most cost effective manner?‟
A timeline from the point of acquiring satisfactory funding, initiating the projects and being able to confidently supply the requested loads in a minimum of two years!!.. hence the urgency of the matter. The two years period is largely due to the fact that the order, design and manufacture of the required transformers are two years. Much effort and time by both officials and specialist consultants has been put into this report and relevant investigative studies, for which we are eternally grateful. Identified Critical Developmental Nodes and Developments The following areas are listed in order of priority based on the primarily „capacity challenged‟ areas and the level of development occurring in that area. 1. Tzaneen CBD / Residential (Development & Growth) 2. Letsitele Town (Development & Growth) 3. Doornhoek / Manorvlei (Development)
4. Haenertsburg (Development & Growth)
5. Waterbok (Letaba Ranch) (Development) 6. Hotel – Huysers (bridge) (Development)
7. JDM Keet / Avondshoek / Fonteinplaas (Development) 8. Northern Timbers (Development)

190
Upgrades required to address Capacity Limitations Below are the identified nodes, which once upgraded / constructed, will satisfy the current and future capacity demands of the development areas mentioned in brackets. As can be seen, the Tzaneen Main Sub and Western Sub will have the most dramatic impact. Tzaneen Main, Western Sub (1, 3, 7 & 8)
Letsitele Sub / Letsitele Town (2)
Haenertsburg (4)
Waterbok (5)
Pusela (6)
Tarentaalrand T-off (7) Brief Project Requirements and Cost Implications
Tzaneen Town Electrical Priorities Pusela, Main, Western
Priority Year Project Description Cost
1
2007/8 - Construct the new proposed 66/11kV Western Substation equipped with one new 66/11kV 20MVA transformer
R 4,562,400.00
2007/8 - Construct a new 66kV Bear overhead line from Tzaneen Main Substation to the new proposed 66/11kV Western Substation
R 7,125,000.00
2007/8 - Construct the new proposed Ext 53 Substation and equip the substation with required electrical infrastructure
R 4,694,400.00
including the cable works required for incorporating the new substation into the existing Tzaneen Town network
2007/8 - Install a new 240mm² x 3c Cu PILC cable from Tzaneen Main Substation to the new proposed Ext 53 Substation
R 4,432,800.00
2007/8 - Service existing 66/11kV 5MVA transformer to be placed temporarily at the new proposed 66/11kV Western Substation
R 250,000.00
2008/9 - Construct the new proposed 66/11kV Western Substation equipped with one new 66/11kV 20MVA transformer (continue)
R 4,562,400.00
2008/9 - Equipe Essenhout Street Substation with the required electrical infrastructure including the cable works required for
R 2,786,400.00
incorporating the new substation into the existing Tzaneen Town network
2008/9 - Install a new 240mm² x 3c Cu PILC cable from the new proposed 66/11kV Western Substation to the new proposed Essenhout
R 2,316,000.00
Street Substation
2008/9 - Install a new 240mm² x 3c Cu PILC cable from the new proposed 66/11kV Western Substation to Aqua Substation
R 8,893,200.00
including a new 11kV indoor switchgear panel at Aqua Substation
2
2007/8 - Order one new 66/11kV 20MVA transformer for the new proposed 66/11kV Western Substation R 0.00
2007/8 - Install a new 240mm² x 3c Cu PILC cable from the new proposed 66/11kV Western Substation to the new proposed
R 2,316,000.00
Essenhout Street Substation
2008/9 - Install the second new 66/11kV 20MVA transformer at the new proposed 66/11kV Western Substation including the
R 6,729,600.00
relevant electrical infrastructure
2008/9 - Install two new 240mm² x 3c Cu PILC cables from the new proposed Essenhout Street R 4,120,800.00

191
Substation to Adam Circle Substation
2008/9 - Replace the existing T1 switches at Adam Circle Substation with new 11kV indoor switchgear panels
R 1,728,000.00
3
2007/8 - Construct the new proposed Ext 74 Substation and equip the substation with the required electrical infrastructure
R 1,656,000.00
2007/8 - Install a new 240mm² x 3c Cu PILC cable from the new proposed Ext 53 Substation to the new proposed Ext 74 Substation
R 2,451,600.00
2008/9 - Install a new 240mm² x 3c Cu PILC cable from Aqua Substation to the new proposed Ext 74 Substation including a new 11kV
R 2,064,000.00
indoor switchgear panel at Aqua Substation
4
2007/8 - Install a new 240mm² x 3c Cu PILC cable from the new proposed 66/11kV Western Substation to Aqua Substation including
R 8,893,200.00
a new 11kV indoor switchgear panel at Aqua Substation
2008/9 - Install two new 240mm² x 3c Cu PILC cables from Adam Circle Substation to Claude Wheatley Substation including two new
R 4,920,000.00
11kV indoor switchgear panels at Claude Wheatley Substation
5
2007/8 - Install a new 240mm² x 3c Cu PILC cable from Tzaneen Main Substation to the new proposed Ext 53 Substation
R 4,432,800.00
2007/8 - Install a new 240mm² x 3c Cu PILC cable from Aqua Substation to the new proposed Ext 74 Substation including a new 11kV
R 2,064,000.00
indoor switchgear panel at Aqua Substation
2008/9 - Install a new 240mm² x 3c Cu PILC cable from the new proposed Ext 53 Substation to the new proposed Ext 74 Substation
R 2,451,600.00
Priority 1: 2007/8 = R 21,064,600.00
2008/9 = R 18,558,000.00
Priority 2: 2007/8 = R 2,316,000.00
2008/9 = R 12,578,400.00
Priority 3: 2007/8 = R 4,107,600.00
2008/9 = R 2,064,000.00
Priority 4: 2007/8 = R 8,893,200.00
2008/9 = R 4,920,000.00
Priority 5: 2007/8 = R 6,496,800.00
2008/9 = R 2,451,600.00
Total: 2007/8 = R 42,878,200.00
Total: 2008/9 = R 40,572,000.00
Total Cost = R 83,450,200.00
New Proposed Substation (Eiland Area) W/bok, Lets main & town

192
Priority Year Project Description Cost
1
2007/8 - Construct a new 66kV Bear overhead line from the Letsitele Main Substation northwards to the La Cotte T-Off area (Eiland area)
R 22,693,384.00
2007/8 - Construct the new proposed 66/33kV substation equipped with one new 66/33kV 10MVA transformer
R 5,169,600.00
2007/8 - Service the existing 66/33kV 5MVA transformer R 360,000.00
2008/9 - Construct the new proposed 66/33kV substation equipped with one new 66/33kV 10MVA transformer (continue)
R 5,169,600.00
2008/9 - Install the existing 66/33kV 10MVA transformer from Rubberville Substation at the new proposed 66/33kV substation and
R 144,000.00
install the existing 66/33kV 5MVA transformer at Rubberville Substation (swop transformers)
Priority 1: 2007/8 = R 28,222,984.00
2008/9 = R 5,313,600.00
Total Cost = R 33,536,584.00
Tarentaalrand "T-Off" Substation
Priority Year Project Description Cost
1 2007/8 - Replace the existing 2 x 66/11kV 1.6MVA transformers with two new 66/11kV 5MVA transformers
R 5,772,000.00
Priority 1: 2007/8 = R 5,772,000.00
New Proposed Substation (George's Valley Area) H/burg
Priority Year Project Description Cost
1
2007/8 - Construct a new 66kV Bear overhead line from the new proposed 66/11kV Western Substation to the new proposed
R 15,568,419.00
66/33kV George's Valley Substation located between Asgard and New Orleans Substations
2007/8 - Construct the new proposed 66/33kV George's Valley Substation equipped with one new 66/33kV 10MVA transformer
R 4,320,000.00
2007/8 - Order the second new 66/33kV 10MVA transformer for the new proposed 66/33kV George's Valley Substation
R 0.00
2008/9 - Construct the new proposed 66/33kV George's Valley Substation equipped with one new 66/33kV 10MVA transformer (continue)
R 4,320,000.00
2008/9 - Install the second new 66/33kV 10MVA transformer at the new proposed 66/33kV George's Valley Substation
R 3,900,000.00
Priority 1: 2007/8 = R 19,888,419.00
2008/9 = R 8,220,000.00
Total Cost = R 28,108,419.00

193
Letsitele Valley Substation
Priority Year Project Description Cost
1 2007/8
- Construct a new 33kV Hare overhead line from the existing 33kV Ebenezer overhead line (Agatha Feeder)
R 764,400.00
2007/8 - Construct a new 33/11kV 2MVA substation R 1,812,000.00
Priority 1: 2007/8 = R 2,576,400.00
Total Tzaneen Electrical Costs
Rural: 2007/8 = R 56,459,803.00
2008/9 = R 13,533,600.00
Rural: Total = R 69,993,403.00
Town: 2007/8 = R 42,878,200.00
2008/9 = R 40,572,000.00
Town: Total = R 83,450,200.00
Tzaneen: 2007/8 = R 99,338,003.00
2008/9 = R 54,105,600.00
Tzaneen: Total = R 153,443,603.00
Conclusion Although already mentioned, the gravity of the situation needs to be reiterated... “Without the requested Financial Intervent ion, Tzaneen will not be able to supply the required electrical capacity of new and proposed developments, effectively stunting Tzaneen‟s growth and financial income!!” In fact, if intervention is not sufficiently swift, even the existing loads will be is jeopardy. This „Financial Recovery Plan‟ must not be seen as a fixed term plan, but rather a plan that must be implemented as soon as practically possible!! The five „projects‟ will be required to all start in year one if all are to be completed in the quickest possible time. As stated earlier, due to technical equipment manufacturing constraints, it is realistic to expect the full process to take a minimum of two years, although with some innovative planning, it may be possible to start reaping some benefits of minimal extra capacity in selected areas after about 12 months. Finally, due to manpower and technical expertise restraints, it will further be necessary to make use of an „overall coordinating Consultant‟ to ensure the smooth flow and acceptable technical implementation of the various projects.

194
3. TRANSPORT PLAN LEGISLATION / POLICY PRESCRIPTION 1. THE NATIONAL LAND TRANSPORT TRANSITION ACT 22 OF 2000
- Contains the statutory requirements relating to various planning elements. - The requirements of this Act relates to various aspects of transport planning viz: -
strategic objectives to be achieved through planning
contents of any particular plan
planning process or procedures
planning programme
publication of plans
integration of planning
public participation
responsibility for planning 2. WHITE PAPER ON NATIONAL TRANSPORT POLICY
- The Land Passenger section of the White Paper on National Transport Policy consists of two main parts namely:
a description of the strategic objectives of government for land transport and;
the development and description of land transport policy. 3. MOVING SOUTH AFRICA ACTION AGENDA
- Followed on the 1996 White Paper on National Transport Policy with the focus shifting more to the customer and to the concept of differentiated customers with a diverse range of needs viz:
the need for sustainability
level of action
steps to realize the integrated vision
strategic principles to guide implementation
The White Paper together with the Moving South Africa Action Agenda are the cornerstones of the National Land Transport Transition Act 22 of 2000.
ANALYSIS / STATUS QUO
The Greater Tzaneen Municipality forms part of the Mopani District Municipality together with the following Municipalities - Greater Letaba - Greater Giyani and - Ba-Phalaborwa
As roads connect the above-mentioned Municipalities it is of great importance that the Transport Plans of all the above mentioned municipalities be integrated with that of Greater Tzaneen Municipality.
THE TRANSPORT SYSTEM CONSISTS OF FOUR BASIC ELEMENTS NAMELY: Modes of Transport Infrastructure Users of the system Planning, Implementation, Monitoring and Maintenance of the system.
MODES OF TRANSPORT
Modes of transport include: A. Private and public vehicles B. Buses and taxis C. Pedestrians, motorcycles, bicycles etc D. Delivery and emergency vehicles
A. PRIVATE/ PUBLIC VEHICLES

195
A.i 57 000 Private vehicles were registered at the Municipality as per 25/08/2004 statistics. A.ii No Passenger Train Transport is presently functioning from Tzaneen station to other areas within Greater Tzaneen
Municipality area. A.iii Donkey-cart Transport is often used in rural areas. A survey is to be conducted as to the number of such mode of
transport
B. BUSES AND TAXI‟S
B.1 Buses and Taxi‟s forms a large component of the Public Transport, carrying commuters from villages and suburbs into Tzaneen town and surrounding municipalities.
i Bus companies carry school children from the above areas into Tzaneen schools are - Netshitudi Bus Service owing 8 Buses - Machris Bus Service - 1 Bus - Truslea Bus Service with 4 Buses - Fouché Bus Service with 3 Buses
ii Bus companies carrying commuters for long and short distances to Greater Tzaneen Municipality are: - Great North Bus Services - RBS (former Risaba Bus Service) - Translux - MBS Public Transport routes used by Buses and Taxis from Ward 1 to Ward 33:
Tzaneen to Maponya - Vol 255 passengers Tzaneen to Khujwana - Vol 170 passengers Tzaneen to Lenyenye - Vol 208 passengers Tzaneen to Sunnyside - Vol 189 passengers Tzaneen to Moime - Vol 255 passengers Tzaneen to Mogoboya - Vol 85 passengers Tzaneen to Maake - Vol 170 passengers Tzaneen to Shiluvane - Vol 170 passengers Tzaneen to Mogapeng - Vol 85 passengers Tzaneen to Pharare - Vol 85 passengers Tzaneen to Masoma - Vol 85 passengers Tzaneen to Julesburg - Vol 85 passengers Tzaneen to Sedan - Vol 85 passengers Tzaneen to Zangoma - Vol 85 passengers Tzaneen to Shikwambane - Vol 85 passengers Tzaneen to Petanenye - Vol 85 passengers Tzaneen to Burgersdorp - Vol 104 passengers Tzaneen to Mokwakwaile - Vol 255 passengers Tzaneen to Modjadji - Vol 170 passengers Tzaneen to Medingeng - Vol 85 passengers Tzaneen to Madumane - Vol 255 passengers Tzaneen to Thapane - Vol 85 passengers Tzaneen to Kubjane - Vol 85 passengers Tzaneen to Motupa - Vol 85 passengers Tzaneen to Xihoko - Vol 85 passengers Tzaneen to Wally - Vol 85 passengers Tzaneen to Mandlakazi - Vol 85 passengers Nkowankowa to Xihoko - Vol 170 passengers Nkowankowa to Manolakazi - Vol 85 passengers Nkowankowa to Maponya - Vol 85 passengers Nkowankowa to Mlati - Vol 85 passengers Nkowankowa to Shiluvane - Vol 85 passengers Petanenge to Nkowankowa - Vol 85 passengers Tzaneen to Lenyenye - Vol 85 passengers

196
Tzaneen to Muhlabe cross - Vol 85 passengers Tzaneen to Dan Village - Vol 85 passengers
B.2 Taxi Associations operating within and outside Greater Tzaneen Municipality are:
Boyne
Pusela
Nkowankowa
Nwamitwa
Bolobedu (Buta)
Bakgaga
The oaks and
Letaba
New Chairpersons for this Association elected during the week of 3-6 May 2005 Maxi Taxi's
No Maxi Taxi‟s services are available from Tzaneen CBD to various residential areas like Aqua Park, Arbor Park, Flora Park and Industrial areas.
At present only illegal Taxi‟s operate from CBD to Flora Park and Industrial area. Consultation was done with Provincial Department Transport (Mopani District) about licencing Maxi Taxi's.
B.3 BUSES AND TAXI‟S - Main Lines
Ba-Phalaborwa to Tzaneen:
±1530 passengers per week use buses and taxi‟s.
Translux Bus Services 2 Buses per day ± vol 85 per single trip. (± 1190 passengers per week.) TAXI‟s Tzaneen to Gauteng (Pretoria – Johannesburg)
± 1190 passengers by Taxis (Pusela Taxi Association) per week, Depending on the number of trips undertaken.
TAXI RANK INFORMATION WITHIN GREATER TZANEEN MUNICIPALITY - Burgersdorp Taxi Rank
This Taxi Rank is situated in Burgersdorp on road reserve along the R36 Tzaneen Lydenburg Road. It is an informal Taxi Rank and has no facilities for commuters e.g. Shelter, Toilets, etc. It operates from the site as a starting point and has several destination points: Julesburg via Ofcolaco; Nkowankowa and Tzaneen via Bridgeway on the R36 road to Tzaneen; the taxi rank is busy during morning and off-peak periods. The most utilized route by the taxis s the R36 TRL.
- Gabaza Taxi Rank
Gabaza Taxi Rank is situated in Gabaza opposite Burgersdorp Taxi Rank across the R36 tarred road. It is an informal taxi rank on road reserve. It is operating from the site as a starting point to Letsitele via Mafarana.
- Lenyenye Taxi Rank
Lenyenye Taxi Rank is situated at the entrance to the town opposite the garage. It is an informal taxi rank with destinations such as Tzaneen, Phalaborwa and Metz.
Taxi's also load/off load commuters informally at the CBD of the town. - Leolo Taxi Rank
Leolo Taxi Rank is situated in Leolo Settlement. It is an informal taxi rank on road reserve sharing with buses. It serves the community traveling from and to Lenyenye via Rakoma.
- Lephephane Taxi Rank
It is an informal taxi rank in Lephepane near the market place on the road reserve. There are facilities available.

197
- Letsitele Taxi Rank Letsitele Taxi Rank is situated in Letsitele CBD area. It is a formal taxi rank occupying an area of about 475m². There are 7 platforms without shelters for loading purposes. There is an office and toilets that are provided and maintained by Greater Tzaneen Municipality. There is also an informal car wash some 150m away which is utilized by taxi drivers to wash their taxis.
- Letaba Cross Taxi Rank
It is a very informal taxi rank situated near the intersection between Roads D673 and R36 on the Lydenburg/Tzaneen road. It aims to helping people who reside near Bindzulani shopping centre, Dan and Lusaka Settlements. It is busy early in the morning as people are going to Tzaneen for work and slow-downs during off-peak periods and almost no action during afternoon peak period. There are no facilities at this taxi rank.
- Letaba Hospital (E) Taxi Rank
It is an informal taxi rank opposite Letaba Special School and Letaba Hospital on road reserve D673. This taxi rank is aimed at serving people from Mamitwa to Letaba Hospital and vice versa. It is not a busy taxi rank. There are no facilities.
- Letaba Hospital (W) Taxi Rank
It is an informal taxi rank at the entrance of Letaba Hospital utilizing the public parking area meant for visitors to the hospital. The area is paved and has 30 demarcated parking bays. This taxi rank is aimed to serve people coming to the hospital to Nkowankowa, Gabaza and Burgersdorp via Bridgeway. The most utilized route from this taxi rank is road D673 and R36.
- Mafarana Taxi Rank
It is an informal taxi rank at the entrance of Mafarana on road reserve at an intersection of roads D8 and MLB TRL/NBS TRL. There are no facilities available. It serves people from Mafarana to several destinations like Mulati, Bonn, Sedan and Letsi tele. The taxis from this taxi rank utilizes mostly road D8 to Letsitele CBD area.
- Mamitwa Taxi Rank
This taxi rank is situated in Mamitwa near the Mamitwa Head Kraal. It is an informal taxi rank on the road reserve from Mami twa to Mandlakazi. There are no facilities except the pit-latrines. It is aimed at serving people from Mamitwa to Mokgwathi via Shihoko, Thapane and Tzaneen. The most utilized route by taxis from this rank is the D3247/D1292/P43 to Tzaneen.
- Madumane Taxi Rank
Madumane is an informal taxi rank situated in Madumane on the road splitting to Morapalala, Mohokgo Block 6 and Pakong. There are no facilities at all. It is aimed at serving people from the area to Tzaneen via Mutupa/Relela areas. The taxi rank is busy during morning peak and off-peak period.
- Moime Taxi Rank
It is an informal taxi rank at the South entrance of Moime Village. It is an on street taxi rank and without facilities. Is aimed at taking people from Moime via Bridgeway to town on the road R36/P17. The taxi rank is busy during morning and off peak periods.
- Mokgwathi Taxi Rank
Mokgwathi is another informal taxi rank at Mokgwathi at the T-Junction of the road from Merekome and D319. There are no facilities. It is aimed at taking people from the village traveling to town via Merekome to Tzaneen and people traveling to Mamitwa via Shihoko, Hlohlokwe via Mawa.
- Motupa/Relela Taxi Rank
Motupa/Relela taxi rank is an informal taxi rank on the road reserve at Mutupa Village. There are no facilities. It is aimed at people from the area to Tzaneen and vice-versa. It is very busy during the morning and the off-peak periods. Taxis from this taxi rank utilize the road D1350 to Tzaneen and back.
- Nkambako Taxi Rank
Nkambako taxi rank is situated at Nkambako Risaba junction on the road reserve. It is an informal taxi rank and there are no facilities. Taxis from this taxi rank are destining to Mamitwa, Letsitele, Tzaneen and Giyani. The most utilized route from the taxi rank is the D1267 to Giyani, Letsitele and Tzaneen via Tarentaal.
- Nkowankowa Taxi Rank
The taxi rank is on Site 215A, Bankuna Street. The area has integrated facilites for hawkers and taxis.

198
The taxi rank is busy during mornings and afternoon peak hours when commuters travel to and from work and has several destinations namely; Tzaneen, Phalaborwa, Burgersdorp, Mamitwa, Letsitele, Petanenge, Letaba Hospital and Giyani. The loading-off loading area for taxi's has been clearly marked, but shelter for taxis, and a waiting/sitting area for commuters have not been provided.
- Nwamahori Taxi Rank
Nwamahori is an informal taxi rank situated in Khujwana. It is an on street type of taxi rank but has got a big area which is going to be used for the taxi rank in future next to the road near the Peace Makers Football Club Soccer Field. It is targeted for people mainly from Khujwana traveling to Tzaneen on R36/P17 road. There are no facilities.
- Petanenge Taxi Rank
Petanenge taxi rank is an informal taxi rank on the entrance of Petanenge coming from Nkowankowa side under the marula tree. It is not a busy taxi rank. It is aimed at people from the village traveling to Nkowankowa and to Tzaneen via Mhlava and Sasekani on R36 road.
- Rita 1 Taxi Rank
It is an informal taxi rank on road reserve on the turn off to C.N. Phatudi road from R36 road. It is a very busy taxi rank especially during morning peak hours. The taxi rank stops operating from area at 15:00 as all the taxis rush to Sanlam Centre taxi rank in Tzaneen to take people from town to the homes. There are no facilities at all. At night some of the taxi uses the garage opposite the taxi rank as a holding area. The most utilized road from this taxi rank is the R36 to Tzaneen.
- Rita 2 Taxi Rank
It is an informal taxi rank at a turn off to Letsitele via Lefaro/Zangoma from the R36 road. It is an on street type of taxi rank aimed at people traveling to Letsitele via Lefara and Zangoma on road D3766. It is not a busy taxi rank. There are no facilities at all.
- Thapane Taxi Rank
It is an informal taxi rank on the road reserve. There are no facilities at this taxi rank. It is aimed at people traveling from the village and Muruji area traveling to Tzaneen using the Deerpark road on D978. The taxi rank is busy during morning peak and off peak period. The most utilized route from the taxi rank is the D978 to Tzaneen.
- Tzaneen Crossing (Old Sanlam Centre) Taxi Rank
This taxi rank was established in toto and hawkers‟ esplanades installed with full infrastructure by the developers of the Centre at their costs of R2mil. It is a formal taxi rank situated at to Sanlam Centre shopping area occupying an area of about 3934m². There are 11 loading platforms with shelters which are still not enough as the taxi rank is extremely busy. The undercover seats at he shelters are inadequate. There are toilets inside the shopping centre for public use. The taxi rank is very busy even at of- peak period and until lete afternoons. Most utilized route is P17/R36 with destinations such as Nkowankowa, Dan, Lusaka, Mokgolobotho, Khujwana, Lephephane, Lenyenye, Thickeyline, etc.
- Tzaneen Pick „n Pay Taxi Rank
It is a formal taxi rank situated at Tzaneng Mall (Pick „n Pay) occupying an area of ±4763m². There are two separate loading areas in the taxi rank. The one loading area is for local destine and the other for far distances e.g. Boyne, Polokwane, Johannesburg, Giyani, Pretoria, etc. There are 14 loading platforms combined in the taxi rank. The local one has several destinations like Duiwelskloof, Kgapane, Motupa/Relela, Thapane, Mamitwa, Acornhoek, etc. This part of the taxi rank is very busy during the off peak period and the afternoon peak period. The most utilized route by taxis from this rank is the D978 via Deerpark followed by P43/3 via D1292 to Mamitwa.
The far destine part of the taxi rank is busy from morning peak until 16:00 as a transfer station. The most utilized route from this part of the taxi rank is the D528 and P17 roads via George‟s Valley and Makgoebaskloof to Polokwane respectively.

199
CAPACITY UTILISATION OF TAXI RANKS (As per Khanyisa Consultants for Mopani Municipality)
Facility Code Rank Description Utilisation (%)
AM Peak MID Peak PM Peak
L-F0001M Burgersdorp Taxi Rank 1316.7 937.5 650
L-F0002M Gabaza Taxi Rank 83.33 181.25 125
L-F0003M Lenyenye Taxi Rank 783.3 675 141.7
L-F0004M Leolo Taxi Rank 200 206.3 116.6
L-F0005M Letsitele Taxi Rank 38 68.6 70.3
L-F0006M Letaba Cross Taxi Rank 166.7 106.3 0
L-F0007M Lephepane Taxi Rank 0 0 0
L-F0008M Letaba Hospital East Taxi Rank 158.3 406.3 50
L-F0009M Letaba Hospital West Taxi Rank 300 812.5 116.7
L-F0010M Mafarana Taxi Rank 100 56.3 8.3
L-F0011M Mamitwa Taxi Rank 132.5 1206.5 575
L-F0012M Madumane Taxi Rank 166.7 137.5 91.6
L-F0013M Moime Taxi Rank 258.3 206.5 108.3
L-F0014M Mokgwathi Taxi Rank 333.3 131.5 25
L-F0015M Motupa / Relela Taxi Rank 1675 1375 783.3
L-F0016M Nkambako Taxi Rank 325 137.5 58.3
L-F0017M Nkowankowa Taxi Rank 189.5 236.9 56.1
L-F0018M Nwamahori Taxi Rank 233.3 243.7 266.6
L-F0019M Petanenge Taxi Rank 100 100 100
L-F0020M Rita 1 Taxi Rank 766.8 135.3 108.4
L-F0021M Rita 2 Taxi Rank 100 125 108.3
L-F0022M Thapane Taxi Rank 541.6 256.2 116.6
L-F0023M Tzaneen Pick „n Pay Taxi Rank 118.0 123.9 91.5
L-F0024M Tzaneen Crossing (Old Sanlam Centre Taxi Rank)
27.8 141 68.3

200
INFRASTRUCTURE
The four main roads lead into Greater Tzaneen Municipality are declared National Roads maintained by the National Road Agency viz:
Lydenburg road
Gravelotte – Ba-Phalaborwa road
Magoebaskloof – Greater Letaba Road
Georges Valley road.
These roads are tarred and upgraded during 2001 – 2002. Lydenburg road carries a large volume of Traffic, especially during peak hours and cannot cope with such volumes. A total number of 517 accidents were reported during 2003-2004
USERS OF THE SYSTEM. * Private road users - 57 000 private vehicles registered in Greater Tzaneen Municipality together with other
vehicles from outside areas passing through Greater Tzaneen Municipality and other visiting. * Pedestrians - on sidewalks for shopping and other commitments. * Hawkers - also on sidewalks, hawker esplanades and demarcated areas for hawking. * Public transport: - buses and taxis carrying commuters into and out of Tzaneen. * The transportation of produce by farmers, sawmills, quarry/mining transport etc C. MOTORCYCLES, BICYCLES AND PEDESTRIANS also form part of our traffic. Pedestrian related accidents raise
fatality rates to undesired levels. D. DELIVERY & EMERGENCY TRANSPORT: D.1 DELIVERY TRANSPORT: * Courier services - Spoed Vervoer - Budget - X.P.S - Sun Couriers - Capricon Couriers - D.H.L Couriers - E.P.X Couriers - C.C.T. Couriers - Fleat Rent - Y2k Services
* Farmers - C.P. Minnaar 30 trucks - Kobus Minnaar 45 trucks - Premium Trucking 16 trucks - Van Rooyen Machinery 2 trucks for abnormal loads * Quarry (mining) and sand transport - Geldenhuys Transport - Letaba Bricks
* Tanker Services (Transporting of Hazardous substances) Local Depots: BP Depot, Shell, NPS Excell, Polox, DED Distributors, Bosbok Gas, Gasman, B & F Distributors, Bosbok oil, Stuarts Transport, Afrox, and Mabunda blasting.
* Sawmills Letaba Sawmill - 3 trucks (extra heavy) Schoeman Sawmill - 2 trucks (extra heavy)
Visagie Sawmill - 1 truck (extra heavy) Northern Timbers - 10 trucks (extra heavy)

201
* Transportation of Hazardous substances
Transportation of hazardous substances into and via Greater Tzaneen Municipality is not regulated at present. Vehicles from local fuel depots use any road to pass through Greater Tzaneen Municipality, which is a dangerous practice to life.
D.2 EMERGENCY SERVICES
* Emergency Services: Mopani District Municipal is in possession of the following: 1. Disaster management unit (bus) 2. Fire Department - 1 Command vehicle - 4 fire fighting trucks - 4 LDV vehicles - 1 Rubber duck - 3 Grass fire fighting vehicles - 1 Fire prevention vehicles - Rescue services- 2 vehicles - Response unit - 1 LDV - Advance support - 1 LDV * Ambulances - Private ambulance companies = NPR = Zambi 2 ambulances - Government Ambulances = 6 Ambulances = 5 Buses and = 1 truck Greater Tzaneen Municipality - Traffic 9 vehicles comprising of = 7 sedan (marked) and = 2 LDV (marked)
IMPLEMENTATION, MONITORING & MAINTENANCE
Responsible Stakeholders: Mopani District Municipality, Greater Tzaneen Transport Forum, Developers, National Government, Provincial
Government, consulting engineers, town planners, community, police and traffic police together with landscape architects.
PRIVATE/PUBLIC PARTICIPATION
The Transport Forum was established within the Greater Tzaneen Municipality to ensure a stage for public participation. Attendance of such Forum meetings is not yet fully participated but progress is made to draw community awareness.
PRELIMINARY PRIORITIES
1. - Public Participation needs to be fully participative and maintained so as to serve as a platform for all
transport stakeholders to participate in transport related issue, to unite the transport industry, monitor transport needs and monitor the implementation of measures to meet these needs by means of:
- Being part of the planning and operational process

202
- Being part of the process for making policy and drafting legislation - Ensuring peace and stability in the area by means of conflict resolution. - Improving transport in general - Providing economic assistance - Ensuring safe road conditions by enforcing adherence to traffic rules and regulations. 2. Objectives 2.1 To improve transport infrastructure, facilities and services within Greater Tzaneen Municipality within a 5 year period. 2.2 To democratize decision – making progess through consultation and public participation e.g. Transport Forum. 2.3 To control and divert transportation of hazardous chemicals within Greater Tzaneen Municipality residential areas and CBD 2.4 To alleviate poverty through the application of local employment development (LED).
4. INTEGRATED WASTE MANAGEMENT PLAN
Reporting Level Description.
1. LEVEL OF SERVICE. a) A full kerbbside collection service are rendered to all communities in the following suburbs of Greater Tzaneen Municipality, which represents only 11% of all households. All general and bio-hazardous waste are removed from viz: Tzaneen, Nkowankowa, Lenyenye, Letsitele, Haenertsburg [ at present 300 000m3 ]
2. BACKLOGS. a)0% of households in the total rural areas, representing ±80034 households. b)The cost to address the service in full with immediate effect, will be approximately R40,000,000-00 for all 125 villages.
3. STAFF COMPONENTS. a) The jurisdiction area is divided by the main roads from Politsi via Tzaneen, Tarentaalrand, Letsitele and Trichardtsdal, in a Northern and Southern service region.
4. WASTE MINIMIZATION. a) The following production of refuse exists in the GTM area, resulting in a life-span of ± 20 years.
* Volumes generated = 300 000 m 3 p.a. * Capacity of the Landfill = 1,600,000m³ * Compaction = 5:1
b) The landfill site is presently utilized as a Regional landfill receiving solid waste from Tzaneen and Greater Letaba.[Modjadjiskloof.] c) Presently all organic waste (garden) are treated at the composting site adjacent to the landfill site. [ Presently _+ 30 000m3
5. LITTER PICKING. (MAIN ROADS & STREETS) a)All streets & main roads are cleaned on a regular and period schedule from all debris and solid waste.[ 24 000 m3 p.a. ]
6. RECYCLING. a) Recycling takes place at the source of origin and are removed by private enterprise from industrial and business premises. [31 000m`3 p.a. ]
b) Recycling at the Tzaneen Landfill [ 16 800 m3 p.a.] 7. THE SERVICES MUST BE EXTENDED TO INCLUDE: a) ± 125 Villages of another 80034 residential stands, which are
1.Overview of the Waste Management Service.

203
situated within the jurisdiction area of G.T.M. b) The mandate of GTM is to: i) Provide all households with a basic removal service.
2. Description of the Solid Waste Management function which are administered as follows.
1. REMOVAL SERVICES: a)LEVEL OF SERVICE.
i) A full curbside collection service are rendered to all communities in the following suburbs of Greater Tzaneen Municipality, which represents only 11% of all households ALL general and bio-hazardous waste are removed viz: Tzaneen, Nkowankowa, Lenyenye, Letsitele, Haenertsburg
b) BACKLOGS. i) 0% of households in the total rural areas, representing ±80034 households, receive a basic service. Two (2) x trial projects are however at present undertaken in rural areas which failed due to the lack of cooperation with Prov & Gov departments and the lack of manpower, financial & infrastructural support. ii) The cost to address the service in full with immediate effect will be approximately R40, 000,000-00 for all 125 villages.
2. LITTER PICKING/STREET CLEANSING. a) All streets and main roads are cleaned on a regular and period schedule from all debris and solid waste [24 000 m`3 p.a.]
3. PUBLIC OFF LOADING FACILITIES/LANDFIll. a) 1x Regional landfill, 4 km. from Tzaneen.[ 5xha in size.]
b) Fully permitted from 1/12/2004 as a G.M.B- site. c) Landfill being managed by a M S P (Waste Group Ingwe) in
compliance with speccifications from the I.W.M.P.[Integrated Waste Management Plan]
d) Public off loading facility each at: Nkowankowa, Lenyenye, Letsitele,and Haenertsburg. [Only for OFF- LOADING by the Public: NOT A TRANSFERSTATION ] e) 6m³ skips utilized for this purpose and are cleaned on a daily basis at the Tzaneen Regional Landfill. f) All P.O.F.`s (public offloading facilities) are managed by a MSP (Waste Group Ingwe ) g) No municipal employee utilized at these facilities
4. PUBLIC TOILETS a) 8x public toilet blocks managed by Tzaneen Solid Waste
*4x block at Tzaneen *1x block at Nkowankowa *1x block at Letsitele *1x block at Haenertsburg *1x block at Lenyenye
b)Blocks open for 12 hours daily c)Cleaning and disinfecting of blocks every 5 hours d)Provision of toilet paper
3. Strategic objectives. 1. WASTE MINIMIZATION a)Recycling. b)Composting. c) Re-use. d)Clean schools programme.[Rural areas]
2. COLLECTION AND TRANSPORTATION. a) Kerbside collection. b) Recycling at resource.
c) Public off loading facilities. d) Waste by rail.
e) Litter picking. f) Hazardous waste.
3. DISPOSAL AND TREATMENT.

204
a) Permitted treatment facilities. b) Permitted disposal sites. c) Registered transfer stations/public off-loading facilities.
4. ORGANISATIONAL MEASURES. a) Key focus areas/role players. b) MIS [Info Systems] c) Key performance indicators. d) Electronic capturing.
4. Key Focus Areas versus problems/challenges.
1. WASTE MINIMIZATION (DESCRIPTION/PROBLEMS. a) Formal recycling system exists.=1X project p.a.[2005 in Tzaneen ]
b) Formal composting plant exists[adjacent to the Landfill] c) No gas extraction system exists on the landfill site.
2. WASTE COLLECTION & TRANSPORT. (DESCRIPTION/PROBLEMS) a) OLD VEHICLES – vehicle fleet 15+ years old (no stand-by vehicles) no transportation cost study exits.
b) RURAL & VILLAGES – no removal of bio-hazardous waste from rur al areas. c) MAIN ROADS CLEANING – no removal of general waste from rural areas.
3. POLLUTION CONTROL. (DESCRIPTION/PROBLEMS) a) POLICING OF ILLEGAL DUMPING – No regular policing of illegal dumpings. b) COURT PROCEDURES – lack of municipal court/sentences.
4. TREATMENT & DISPOSAL. (DESCRIPTION/PROBLEMS) a) PERMITS – landfill permit issued [1/12/2004] b) REGISTRATION OF TRANSFER STATIONS – application for exemptions. c) DEVELOPMENT PLAN – scale model.
5. ORGANIZATIONAL STRUCTURE. (DESCRIPTION/PROBLEMS) a) ADMIN SUPPORT. *No Admin-Officer.
*Electronic capturing of info. *Budget support [ grants and funds ] *Lack of appropriate software.
b) MIS-No Provincial waste info system. c) INTEGRATED MANAGEMENT – lack of dedication from other
sections in “Clean Town Committee”
5.Analyses of the functions. 1.Number & cost to employer of all personnel associated with refuse removal:
Professional (HoS)
Field (Team Leader)
Office (Superintendents)
Non-professional (Labourers)
Temporary (Prov Employees)
Contract (3x contractors)
2.Number of households receiving regular refuse removal services, and frequency and cost of service.
Removed by municipality at least once a week
Removed by municipality less often
Communal refuse dump used
No rubbish disposal
Total cost of removal and disposal.
3.Total and projected tonnage of all refuse disposed.
Domestic/commercial
Garden
4.Total number, capacity and life expectancy of refuse disposal sites.
Domestic/commercial (x1)
Garden (x1)

205
5.Anticipated expansion of refuse removal service.
Domestic/commercial
Garden 6.Free basic service provision.
Quantity (Number of households affected)
Quantum (value to each household)
7.Total operating cost of solid waste management function. 6.Key Performance Area.
Performance during the year, performance targets against actual achieved and plans to improve performance
1. Waste Minimization. a) Recycling at landfill. b) Recycling at Premises. c) Re-use.[ Gas extraction] d) Compost terrain.
2. Treatment and Disposal. a) Permit of Landfill.
3. Collection & Transportation. a) New, appropriate and purpose made fleet. b) Village collections.
4. Collection & Transportation. a) Removal on all generators of medical refuse
2004/5 year
1
11 2
68 39 3
- - - - - R5,359,873
9321
0 0
70713 0
- - - - R14,119,951
300 000 m³ p.a. 24 000 m³ p.a.
1 600 000 m³ 180 000 m3
20 years 20 years
2560
0
R1,000,000 0

206
During construction of roads, taxi ranks and ablution facilities, local people may be appointed - thus alleviating poverty 2.5 To minimize the negative side effects which Transport may have on environment? 2.6 The correct coding of Taxi Ranks; numbering; and clear direction signs for tourists as where to find transport to various destinations. INITIATIVES / PRIORITIES 1. Construction and upgrading taxi and bus termini and ablution facilities to enhancing a healthy environment for our commuters in partnership with Provincial Department, Mopani District Municipality and other stakeholders.
2. Invite all stakeholders to participate in Transport Forum where all decisions, consultations and public participation can be enhanced. (Ward Councilors also included)
3. Consult with local depots dealing with hazardous substances; the SAPS and Fire Department to initiate
proposals of diverting the route of transporting such substances. Proposed routes through Tzaneen CBD
R21 – from Greater Letaba Municipality into Ba-Phalaborwa /Gravellote Road passing outside Tzaneen Town. Entering Tzaneen CBD, turning right into Claude Wheatley into Sapekoe Drive and out on the Lydenburg road.
Route for both directions Enforced local deliveries of hazardous subsistence with the necessary Delivery Notes. Municipal Traffic
Department will display signs prohibiting the usage of certain roads by such transportation.
4. drafting a Transport By-Laws for implementation at all upgraded taxi ranks - Including tariffs. 5. Consultation with various stakeholders such as Department Transport and Taxi Associations towards to
recapitalization process initiated by the National Department of Transport on the process of substituting mini-buses with midi-buses. Maxi Taxi licencing will also be attended to during this consultation.
5. SPATIAL DEVELOPMENT FRAMEWORK
1. GENERAL BACKGROUND
A Spatial Development Framework is a key component to the successful compilation and implementation of an Integrated Development Plan (IDP). The purpose of a Spatial Development Framework (SDF) is to provide guidance in respect of decision-making and action towards the establishment of integrated and habitable towns. A secondary purpose of the SDF is to establish a strategic framework for an appropriate land use management system. The formulation of the SDF gives effect to further compliance with the Municipal Systems Act, 2002, and the Municipal Performance Management Regulations. The Land Use Bill also stipulates that each municipality shall formulate and implement a Spatial Development Framework The abbreviated framework presented below represents a very concise extract from the Greater Tzaneen Spatial Development Framework.
2. THE SITUATION
Tzaneen Town is situated roughly in the centre of the municipal area at the convergence of major arterial routes. Although settlement concentration is average by comparison (i.e. in terms of the total number of residential sites) the town has by far the highest concentration of business, industrial, social, financial, recreational and infrastructural facilities and services within the municipal area. The town takes up approximately 849 ha. Nkowankowa, situated some 13 km east of Tzaneen and north of the Provincial Road P 17/3 is the largest proclaimed town within the municipal area (862 ha) with the highest number of stands (5250).
Equitable share =
R5,295,072
R20202958
Current
Target
10% 10% 0%
100%
20% 45%
100% 100%
100% 100% 0% 0%
100% 10% p.a.
98% 100%

207
Lenyenye situated 10 km further east of Nkowankowa on the southern side of the same arterial, extends over roughly 230 ha and has 2519 stands, which makes it the smallest of the three major proclaimed towns, but also the most compact in terms of settlement density. Haenertsburg, a small proclaimed town (142 ha) is situated at the western gateway to the municipality, exhibits a very limited residential component and a low settlement density, but serves as service node with considerable tourism appeal and potential. Letsitele, situated nine kilometres east of Nkowankowa and south of the P43/3, is the smallest of the proclaimed towns, extending over 102 ha with a total of 123 stands has an unusually well-developed business area, which is attributed to the fact that the town serves as retail and social service centre to a large farming community and the resident population of a number of rural villages within a 10km radius of the town. By far the largest concentration of rural settlements occurs in the southern quadrant of the municipal area where 69 % of the population resides on 67 % of the residential stands. The second concentration of rural settlements occurs in the northern quadrant of the municipal area, where 27% of the people reside on 26,5.% of residential stands.
3. SPATIAL PATTERNS AND TRENDS 3.1 RESIDENTIAL DEVELOPMENT
Approximately 10, 5% of residential stands occur in the proclaimed towns, while the remaining 89, 5% of residential stands are informally demarcated sites in rural villages. This has the implication that only 10% of households within the municipality have permanent title to their houses, and the advantages commensurate with tenure. A characteristic of current residential development is that it is low density; the average density being 5 stands per ha. This is conducive to urban sprawl as a gross rate of 2000 m² per stand relates to an average nett extent of 1 440 m² per residential stand. With an average floor area of residential dwellings calculating to 172m², this represents a floor area ratio of 0, 12 (12% coverage). It can therefore be deduced that residential land, which is a scarce resource, is generally being grossly underutilized, as acceptable norms dictate coverage of 50%. Simply put, residential stands are currently too big on average, the average floor area of dwellings dictating that residential erven should expand over 350m².
3.2 BUSINESS AND INDUSTRIAL DEVELOPMENT
Business and industrial development is concentrated in TZANEEN town, where there are 402 retail businesses and industries on 298 stands concentrated in the CBD and industrial areas of the town. In addition, the town boasts a full complement of financial and banking institutions and facilities and an extended office zone. A total of 37% of all businesses and industries within the municipality are concentrated in one town on 48, 7% of land designated for this purpose (158 ha out of a total of 324 ha). A further characteristic of especially the business development in Tzaneen is its sophistication in relation to the rest of the municipal area (excellent variety of goods and services, variety of choice, and competition). In general, business erven in Nkowankowa and Lenyenye are under-utilized or vacant. A characteristic is further that residential sites are being developed as business premises. Limited growth of business, in spite of the considerable population concentration within the catchment area suggests that business in Nkowankowa and Lenyenye succeeds in intercepting only a modest share of the expendable income present within the local economy. A problem throughout the municipality, but especially at transportation hubs, is informal trading which is a potential traffic and pollution hazard. Incidences of this phenomenon are prevalent at intersections of district routes and provincial routes, especially where this occurs at a village (Dan, Mohlaba Cross, Maake, Lenyenye, Rita, to name a few examples). An exposition of extent and distribution of business and industrial development is contained in Table 1. TABLE 1: INCIDENCE AND EXTENT OF BUSINESS AND INDUSTRY WITHIN GTM (2003-07-17)
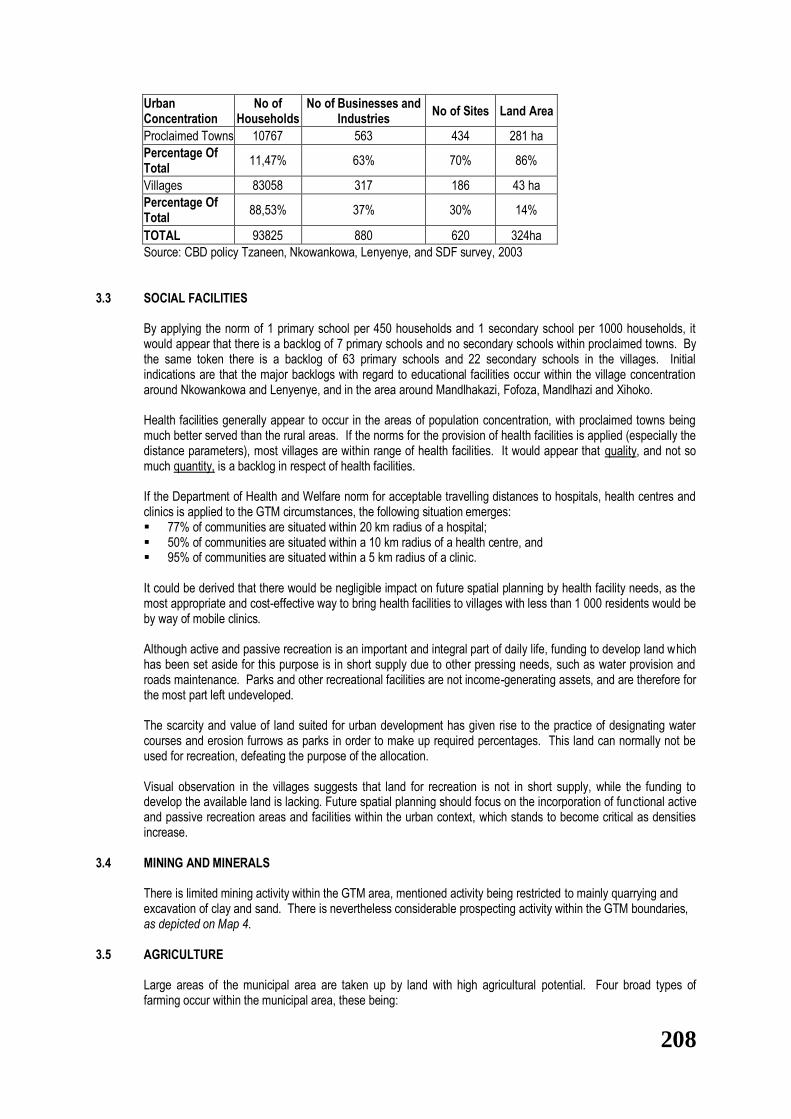
208
Urban Concentration
No of Households
No of Businesses and Industries
No of Sites Land Area
Proclaimed Towns 10767 563 434 281 ha
Percentage Of Total
11,47% 63% 70% 86%
Villages 83058 317 186 43 ha
Percentage Of Total
88,53% 37% 30% 14%
TOTAL 93825 880 620 324ha
Source: CBD policy Tzaneen, Nkowankowa, Lenyenye, and SDF survey, 2003
3.3 SOCIAL FACILITIES
By applying the norm of 1 primary school per 450 households and 1 secondary school per 1000 households, it would appear that there is a backlog of 7 primary schools and no secondary schools within proclaimed towns. By the same token there is a backlog of 63 primary schools and 22 secondary schools in the villages. Initial indications are that the major backlogs with regard to educational facilities occur within the village concentration around Nkowankowa and Lenyenye, and in the area around Mandlhakazi, Fofoza, Mandlhazi and Xihoko. Health facilities generally appear to occur in the areas of population concentration, with proclaimed towns being much better served than the rural areas. If the norms for the provision of health facilities is applied (especially the distance parameters), most villages are within range of health facilities. It would appear that quality, and not so much quantity, is a backlog in respect of health facilities. If the Department of Health and Welfare norm for acceptable travelling distances to hospitals, health centres and clinics is applied to the GTM circumstances, the following situation emerges: 77% of communities are situated within 20 km radius of a hospital; 50% of communities are situated within a 10 km radius of a health centre, and 95% of communities are situated within a 5 km radius of a clinic. It could be derived that there would be negligible impact on future spatial planning by health facility needs, as the most appropriate and cost-effective way to bring health facilities to villages with less than 1 000 residents would be by way of mobile clinics.
Although active and passive recreation is an important and integral part of daily life, funding to develop land which has been set aside for this purpose is in short supply due to other pressing needs, such as water provision and roads maintenance. Parks and other recreational facilities are not income-generating assets, and are therefore for the most part left undeveloped. The scarcity and value of land suited for urban development has given rise to the practice of designating water courses and erosion furrows as parks in order to make up required percentages. This land can normally not be used for recreation, defeating the purpose of the allocation. Visual observation in the villages suggests that land for recreation is not in short supply, while the funding to develop the available land is lacking. Future spatial planning should focus on the incorporation of functional active and passive recreation areas and facilities within the urban context, which stands to become critical as densities increase.
3.4 MINING AND MINERALS
There is limited mining activity within the GTM area, mentioned activity being restricted to mainly quarrying and excavation of clay and sand. There is nevertheless considerable prospecting activity within the GTM boundaries, as depicted on Map 4.
3.5 AGRICULTURE
Large areas of the municipal area are taken up by land with high agricultural potential. Four broad types of farming occur within the municipal area, these being:

209
timber in the south western and western parts of the municipality; subtropical fruit and citrus production in the western and central parts; cattle and game farming in the eastern section of the municipality, and Dryland cultivation of maize on the outskirts of villages in the rural areas. High potential agricultural land takes up roughly 27% of the land area of the municipality. The incidence and location of high potential agricultural land have been depicted on Map 2.
3.6 CONSERVATION AREAS
Three significant designated conservation areas occur within the study area, these being: a cluster of 24 farms in the western quadrant, extending from Kolbosch 961 LS in the south to Weltevreden
442 LT in the north, and including De Hoek 547 LT, and Grootbosch 444 LT; a group of 4 farms situated on the southern boundary of the municipality, including Wolkberg 634 LT and
Forest Reserve 8 KT, and the farm Duplex 467 LT, situated 18 km east of Tzaneen, which has been listed due to the diversity of plant
species. The designated conservation areas are estimated to extend over roughly 5% of the land area of the municipality. An application is lodged to declare the grasslands at Haenertsburg Town as an Environmental Heritage site as a means to conserve, protect and manage the grasslands area in the Wolkberg. The entire drainage system, inclusive of the six major dams, is considered to be environmentally sensitive areas largely due to the ever-present danger of damage to the eco-systems through over-exploitation and pollution. The locality and extent of conservation areas, exemption farms and other environmentally sensitive areas are depicted on Map 2.
3.7 LAND OWNERSHIP AND REFORM
In terms of land area, roughly 38% of the 3240 sq.km is registered in ownership to the State. This calculates to 1231 sq.km. The remainder of the land (2009 sq.km) is in private ownership. A characteristic of the Greater Tzaneen Municipality is that traditional commonage (vacant land in ownership of the local authority) does not exist. This has the implication that all land for development purposes must either be released by a State Department, traditional authority, or purchased from private landowners.
4. SPATIAL OBJECTIVES AND STRATEGIES 4.1 OBJECTIVES
The Greater Tzaneen Municipality will pursue the following objectives to achieve the desired spatial form of the municipality. Objective 1: The sustainable utilization of all land within the municipal area to its fullest potential and
benefit. Objective 2: The restriction of wastage of land through urban sprawl, degradation of the natural
environment and/or sterilization of resources. Objective 3: The concentration of development to derive social and economic benefits for the
community. Objective 4: The utilization of existing development and infrastructure capacity. Objective 5: The promotion of good internal and external accessibility through the optimal use of
existing roads network. Objective 6: The support of economic growth through the judicious exploitation of natural and artificial
resources. Objective 7: The promotion of orderly development through timeous preparation and planning. Objective 8: The manipulation of development to achieve a hierarchal settlement development pattern. Objective 9: The promotion of land restitution and reform to achieve equitable access to land and
security of tenure.

210
4.2 STRATEGIES
The achievement of the Spatial Objectives of the GTM revolves around: support of natural/inherent potential; anticipation of growth and timeous action, and Manipulation and intervention.
The strategies to achieve the listed objectives are presented below: Strategy A: Determine utilization potential of all land and limit development to best usage through
policy and/or statutory plan. Strategy B: Adopt applicable minimum standards as policy. Strategy C: Enforce and/or support enforcement of legislation regulating environmental and resource
conservation. Strategy D: Manipulate placement of social and economic facilities and opportunities both directly and
undirectly at places with inherent development potential. Strategy E: Determine surplus infrastructural capacity areas and plan to optimise utilization. Strategy F: Place development at, and in proximity to, existing arterial routes. Strategy G: Support economic growth opportunities by creating the spatial and infrastructural
framework for economic and commercial opportunities. Strategy H: Anticipate growth and plan ahead, both spatially and physically. Strategy I: Concentrate municipal development in the identified development potential areas. Strategy J: Institute a formalization program to systematically formalize settlements to effect tenure. Strategy K: Support judicious land reform initiatives.
5. IDENTIFICATION OF BENEFICIAL SPATIAL PATTERN 5.1 GENERAL PRINCIPLES
The desired spatial form of the municipality is dependent on the meticulous application of the following principles: Sustainable use of land to fullest potential and benefit; Minimal wastage of land through sprawl, degradation, sterilization; Concentration of development to the social and economic benefit of the community; Utilization of existing development and infrastructure capacity; Good accessibility through well-developed roads network and optimal use of existing roads; Vibrant economy and economic growth through spontaneous growth of economic sector; Orderly development; Concentrated urban core, intermediate levels of development and hinterland (hierarchy of towns and
settlements), and Tenure/land reform.
5.2 DEVELOPMENT HIERARCHY AND SPATIAL DEVELOPMENT NODES
The application of the criteria has resulted in the emergence of a hierarchal order of four distinct levels of development, which are presented in Table 2 below and are in line with the Provincial Spatial Rationale. The last column summarizes the focus of development in the node, which should guide IDP project planning and budgeting. The nodes/clusters have been listed together and in descending order.
TABLE 2: SETTLEMENT HIERARCHY GREATER TZANEEN MUNICIPALITY
DEVELOPMENT AREA DESIGNATION AFFECTED TOWNS &
VILLAGES FUNCTION DEVELOPMENT FOCUS

211
DEVELOPMENT AREA DESIGNATION AFFECTED TOWNS &
VILLAGES FUNCTION DEVELOPMENT FOCUS
1st ORDER : PRIMARY NODES High Potential for
development. Have sizable economic sector providing jobs. Have regional function and large number of social
and institutional facilities. High population.
1 NKOWANKOWA/ LETSITELE VILLAGES
Nkowankowa, Letsitele, Dan, Lusaka, Mbambamencisi
Khujwana, Mariveni, Petanenge, Mokgolobotho
Residential, business, industries,
institutional
To become the primary development area which attracts people from the region or beyond, through the creation of a conducive environment for business, industrial and
institutional development. Urban Renewal: Revival of Bindzulani centre and industrial development. – Study on Urban development in Nkowankowa and interventions needed to establish town
as a primary node. Acquisition of land and township establishment to timeously provide serviced sites. Prevention of indiscriminate settlement.
First priority to provide and encourage residential, formal business, industrial, infrastructural, social and economic development. Formalisation of informal settlements.
Community and village tourism development.
2 TZANEEN Tzaneen Residential, business, industries,
institutional, tourism
To sustain the area as a primary development area through receiving first priority for provision and encouragement of residential, formal business, industrial,
infrastructural, social and economic development. Acquisition of land and township establishment to timeously provide for serviced sites. First priority for Tourism Development (Tzaneen Dam,
Tourist Information centre)
1st ORDER : SECONDARY NODES High Potential for
development. Have sizable economic sector providing jobs. Have regional function and large number of social
and institutional facilities. High population.
LENYENYE Lenyenye, Mohlaba Cross, Moime, Rita, Khopo, Marumafase,
Maake, Pulaneng
Residential, business, institutional
Second priority for residential, infrastructural, social and economic development. 1st Priority for development of Filling station with Taxi Rank
and Hawker Esplanades. First Priority for development of Maake Shopping Centre First priority for provision of a cemetery. Prevention of indiscriminate settlement
Community and village tourism development. Acquisition of land for township extensions
1st ORDER : TERTIARY NODES
Smaller economic sector, few local businesses. Few higher order social and institutional activities. Have reasonable
number of people. Exhibit natural growth potential if positively stimulated.
1 MAMITWA Nwamitwa, Mandlhakazi, Nwajaheni, Fofoza,
Mandlhazi, Lwandlamuni
Residential, business
Third priority for residential, infrastructural, social and local economic development.
3rd Priority for development of a formal business, bus/taxi terminal and hawkers esplanades. Development of a multi-purpose service centre.
2 HAENERTSBURG Haenertsburg Business,
tourism
Third priority for residential, infrastructural, social and local
economic development. First priority for Conservation and Tourism Development. Acquisition of land for creation of sites(Haenertsburg Town and Townlands). Provision for service industrial sites.
First priority for declaring grasslands as Environmental Heritage Site.
3 BURGERSDORP Burgersdorp, Gabaza, Myakayaka, Shiromong,
Sunnyside, Shiluvane.
Residential Third priority for residential, infrastructural, social and local economic development.
Development of a multi-purpose service centre.
2nd ORDER : POPULATION CONCENTRATION POINTS
(As defined in Spatial Rationale) Villages with small or virtually no economic base, meaningful social and often
institutional activities. Located adjacent to main roads or intersections.
1 THAPANE Mopye, Motupa, Marirone, Thapane, Mapitlula,
Fobeni, Lerejeni, Leokwe, Motlakong, Morutji, Bokhuata, Relela, Sethome, Botludi,
Mothomeng, Semarela, Khethneeng, Ramphelo, Phadasediba, Kubjane
Rural residential
Fourth priority for residential, infrastructural, social and local economic development.
To attract people from smaller villages in the area with a lower level or no service infrastructure.
2 Parare, Mogapeni Fourth priority for residential, infrastructural, social and
local economic development. To attract people from smaller villages in the area with a lower level or no service infrastructure.
3 MOGOBOYA Mogoboya, Khopo, Segabeni
Fourth priority for residential, infrastructural, social and local economic development. To attract people from smaller villages in the area with a lower level or no service
infrastructure. Development of a multi-purpose service centre.
3rd ORDER : LOCAL SERVICE POINTS
Exhibit some development potential based on population
1 Runnymede, Xihoko, Nwamugololo,
Fifth priority for residential, infrastructural, social and local economic development.
Development of a multi-purpose service centre. Establish a skills development centre.

212
DEVELOPMENT AREA DESIGNATION AFFECTED TOWNS &
VILLAGES FUNCTION DEVELOPMENT FOCUS
growth and/or service function potential. Very limited or no economic base. Most have
5000+ people. Isolated settlements. Potential for self-sustained development growth is limited by lack of
development opportunities. Some have government and/or social services.
2 Senagwe, Senopelwa Fifth priority for residential, infrastructural, social and local economic development.
3 Mokgwathi Block 10 and 11
Fifth priority for residential, infrastructural, social and local economic development.
4 Maweni Fifth priority for residential, infrastructural, social and local
economic development.
5 Miragoma, Malubana Fifth priority for residential, infrastructural, social and local economic development.
4th & 5th ORDER : VILLAGES Small settlements with less than 5000 people, usually
less than 1000 people. Group of settlements are usually mutually dependent on social infrastructure.
All remaining villages
Sixth priority(long term) for residential, infrastructural(RDP standard), social and local economic development. Larger villages to receive first preference in this category
5.3. DIRECTION AND EXTENT OF DEVELOPMENT 5.3.1 DETERMINATION OF GROWTH
In order to predict extent and direction of growth, it is necessary to anticipate the rate of growth in population at each nodal point and then to translate this growth into a land requirement.
5.3.2 DIRECTION OF DEVELOPMENT IN PERSPECTIVE
From the analysis of spatial patterns and trends and the calculation of anticipated scale of development within the planning period, the following observations can be drawn: the scale of anticipated development is not sufficient to completely correct the spatial pattern in the coming
10 years, and the incidence of competing land uses (agriculture, mining, tourism) will impact on the placement of future
urban development. TABLE 3 : DIRECTIONS OF DEVELOPMENT
NODAL POINT AREA DIRECTION LAND DESCRIPTION EXTENT
PRIMARY NODES
Nkowankowa, Letsitele and
North-west Part of Mohlaba Location 567 LT 202 ha
villages North-west Part Ledzee 559 LT 398 ha
East/South east Part Mohlaba's Location 567 LT 443 ha
Tzaneen Central Pusela 555 LT Ptn 183, 184, 186, 241, 266, 391, 48, 51, 57, 58, 59, 75
46 ha
West Ptn 4 Pusela 555 LT 193 ha
South Part Extension 40 100 ha
South-West Part Extension 18 30 ha
SECONDARY NODES
Lenyenye and villages North Mohalaba's Location 567 LT 515 ha
TERTIARY NODES
Nkambako/Mamitwa and villages
Convergent 160 ha
Burgersdorp/Gabaza South east 140 ha
5.3.3 MAJOR TRANSPORT & MOVEMENT CORRIDORS 5.3.3.1 EXTERNAL MOVEMENT CORRIDORS
The Greater Tzaneen Municipal area is transversed by a national road which intersects the N1 approximately 30 km south of Makhado and joins the N4 at Nelspruit, the latter-mentioned route being the Maputo Corridor, and

213
the N1 being the major route to Zimbabwe and other Southern African states. The route through Tzaneen has been designated as a Maputo sub-corridor. See Map 6.
The most direct route linking Tzaneen to Gauteng is the Provincial Route P17-2 over Polokwane, where it joins the N1. This route bears the highest volume of commercial and passenger traffic, which is largely due to: The economic activity in the north-eastern Lowveld (sub-tropical and citrus fruit for export, mining activity at
Gravelotte and Phalaborwa); The high concentration of people in the area, and their employment links with Gauteng; The popularity of the Ba-Phalaborwa Gate of the Kruger National Park, and The link that Tzaneen has with Polokwane, which is the capital of the Limpopo Province.
5.3.3.2 INTERNAL MOVEMENT CORRIDORS
The following significant internal movement corridors within the municipality have been identified and are listed in perceived descending order of utilization: P17/3 between Tzaneen and Burgersdorp/Gabaza; P43/3 and D978 linking Tzaneen to the western part of the rural north villages; P43/3 and D1292 linking Tzaneen to the eastern part of the rural north villages; P43/3 between Tzaneen and Letsitele, and D5011 and D8 between Nkowankowa and Letsitele. The most travelled major arterial within the Greater Tzaneen area is the section of the P17/3 between Nkowankowa and Rita. The movement between Tzaneen and Nkowankowa, Lenyenye and rural south villages comprises public and private passenger transport mainly in the form of passenger buses and minibus taxis. The traffic is generated due to employment opportunities in Tzaneen and the retail function of the Tzaneen CBD. Transportation of agricultural produce and manufactured goods also contributes to traffic generation along this route. It is estimated that roughly 74% of people employed in Tzaneen, who reside outside the town, make use of this transportation corridor (Housing Project Survey, 1999), therefore emphasizing the necessity to upgrade the road. The vehicular traffic between Tzaneen and the rural north villages is almost exclusively public passenger transportation. Movement between Letsitele and Tzaneen is thought to be more commercial than passenger, while the causes for movement between Nkowankowa and Letsitele are employment and retail. The movement along the significant arterials has been schematically depicted on Map 6.
6. GENERAL GUIDELINES FOR LAND USE MANAGEMENT SYSTEM
A future land use management system(lums) for Greater Tzaneen Municipality should consider the following general guidelines:
the lums should be consistent with, and support the objectives of, the local SDF, the local IDP, the provincial SDF, provincial and national environmental and planning legislation and plans;
the lums should ideally determine land uses and conditions for every piece of land within the municipal area;
the conditions should be rigid enough to effectively control and manage land use and development but flexible enough to accommodate various levels of development with varying impact on the land use pattern of the municipality, and
the lums should incorporate municipal policies in respect of land use, development zones, areas designated for specific types and intensities of development.
7. CAPITAL INVESTMENT FRAMEWORK
The compilation of a capital investment framework for the implementation of the Spatial Development Framework before the finalization of the Plan is, at best, a theoretical exercise. The main cost components for the spatial implementation of the Plan are:

214
purchase of land, and
Statutory preparation of land, inclusive of geotechnical and environmental investigations, town planning, survey, legal fees, etc.
The capital investment framework could be extended to include the provision of infrastructural services. The costs to this component are extremely variable as proximity and capacity of bulk services and the level of services impact on the end cost per unit. By the same token statutory preparation costs are quite stable and therefore predictable, while land cost could vary from zero to R150 000/ha. The programming for implementation also impacts on the end cost. A capital investment framework is presented in Table 4. TABLE 4 : CAPITAL INVESTMENT FRAMEWORK 2003 - 2013
FINANCIAL CYCLE
COST
COMPONENT
BACKLOG 2003/2004 2004/2005 2005/2006 2006/2007 2007/2008 2008/2013 TOTAL
LAND ACQUISITION R 14.4M R 4.15M R 4.15M R 4.15M R 4.15M R 4.15M R 24.90M R 60.05M
GEOTECHNICAL SURVEY R 0.23M R 0.12M R 0.12M R 0.12M R 0.12M R 0.12M R 0.72M R 1.55M
ENVIRONMENTAL IMPACT ASSESSMENT R 0.45M R 0.28M R 0.28M R 0.28M R 0.28M R 0.28M R 1.35M R 3.2M
TOWN PLANNING R 1.85M R 0.45M R 0.45M R 0.45M R 0.45M R 0.45M R 5.20M R 9.3M
SURVEY R 3.8M R 0.8M R 0.8M R 0.8M R 0.8M R 0.8M R 11.49M R 19.29M
LEGAL WORK R 0.2M R 0.05M R 0.05M R 0.05M R 0.05M R 0.05M R 0.7M R 1.15M
INFRASTRUCTURAL RETICULATION (NO BULK) R 74.5M R 14.9M R 14.9M R 14.9M R 14.9M R 14.9M R 205.8M R 354.8M
TOTAL R 95.43M R 20.75 M R 20.75 M R 20.75 M R 20.75 M R 20.75 M R 250.16 M R 449.34 M
8. LAND USE POLICY AND DEVELOPMENT GUIDELINES
The following represent a summary of land use policies and land development principles, according to which decisions will be made by Council regarding future use and development of land within the municipal area. Land use development policies will be updated on yearly basis through the IDP and SDF to conform to dynamic trends and community needs. The following should be applied and read together with existing legislation and policy documents related to land management and development.
8.1 General Land Development Policy Principles
a) Nodal areas are urban areas with highest potential for development according to spatial nodal hierarchy. b) Priority areas for development, provision of physical infrastructure, and provision of social and economic
facilities are as follows in descending order: i) Primary Node - Nkowankowa, Dan, Khujwana, Mariveni, Petanenge, Mokgolobotho, Letsitele,
Tzaneen. ii) Secondary Node - Lenyenye, Mohlaba Cross, Moime, Marumafase, Maake. iii) Tertiary Node - Burgersdorp, Nkambako, Mamitwa, Mandlakazi, Gabaza, Haenertsburg. iv) Residential Village - Majority of village has stands with an extent up to and including 1 500m².
Primary use is residential. Some demarcated with general plan, majority demarcated by former Department of Agriculture.
v) Agricultural Village - Majority of village has stands with an extent in excess of 1 500m². vi) Agricultural Holding - As defined in terms of the Agricultural Holdings Registration Act, 1919. vii) Agricultural Land
c) Land development to prevent low density urban sprawl. d) Land development to support fill-in development and development of compact urban areas. e) Land development and land use to support and ensure village areas become economically sustainable. f) All development to be environmentally sound. g) All development to make optimum use of available resources. h) Timeously and pro-actively identify, acquire and develop land for settlement purposes to counteract
illegal occupation of land. i) Prevention of development of scattered business on agricultural land. j) Encouragement and active marketing of industrial development according to hierarchy. k) All land use development and management to conform to Map 6: Spatial Development Framework and
the individual nodal plans.

215
l) All developments, including demarcations of rural residential sites, undertaken by parastatal government departments, must be planned and executed in consultation with GTM.
m) All land development and usages to conform to related legislation, such as Environmental Impact Assessment Regulations, Development Facilitation Act, 1995(DFA), etc. and requirements from government departments.
n) All land development and usages to conform to IDP integrated plans and sector plans.
8.2 Residential Development
a) Primary, secondary and tertiary nodes: i) Priority be given to residential development within these nodal hierarchies by means of :
acquisition of land, creation of affordable erven, provision of RDP housing, servicing of existing demarcated erven as a means to provide in the extreme need for erven, encouragement of private sector to invest in residential development and to service and/or
develop available erven, and Formalization and servicing of informal settlements.
b) Residential Villages :
(Majority of village has stands with extent up to and including 1500m² (general norm for residential stands on communal land is 20m x 40m = 800m²) i) Residential extensions to these villages should be limited. Extension should equal need created by
natural population growth rate. ii) Encouragement of densification of stands and prevention of wastage of land. iii) Villages to receive basic services. Priority be given to areas with greatest need, closest to urban
areas, and where most people will benefit, as determined in sector plans.
c) Agricultural Villages: (Majority of village has stands with extent more than 1500m², used for residential and agricultural purposes) i) Residential extensions to these agricultural villages will be discouraged. ii) Densification of stands will be discouraged because it will create unsustainable living units. iii) Application for densification and creation of agricultural stands will be considered on individual
basis and according to need, desirability and after consideration of environmental impact. iv) Agricultural villages to receive basic services. Priority is given to areas with greatest need, closest
to urban areas, as determined in sector plans.
d) Formalisation: i) Formalisation of informal settlements will be directed towards, and priority be given to areas
situated directly adjacent to proclaimed towns and within primary nodal areas. ii) Implementation of valuations and assessment rates to support formalisation.
e) Private residential development:
i) Will be encouraged and considered on an individual basis according to compliance to the SDF, Nodal plans, DFA land development principles, need, desirability and after consideration of environmental impact.
f) RDP housing:
i) Priority allocation to be made where greatest need exists in nodal areas. ii) Individual allocation to be scattered within settlements.
g) Densification:
i) Promotion of densification of residential areas that would not negatively impact on valuation of land, service infrastructure and residential character. Form and size of subdivisional portions should fit in with configuration of sites in surrounding area. Existing policy regarding minimum extent of Single Residential erven is confirmed: Tzaneen Town, except Tzaneen Extension 13: 500m², panhandle or right of way servitude
excluded.
216
Tzaneen Extension 13, extensions thereto and all suburbs: 250m², panhandle or right of way servitude excluded.
ii) Maximum size of future single residential erven in villages to be 1000m² which provides for adequate space for self-sustainable gardening, ensures viable service provision and prevention of wastage of residential and agricultural land.
iii) Residential 3 and Residential 4 zonings will only be allowed within urban transitional zones and in areas as depicted and or specified in terms of accepted guideline policy documentation to be adopted by Council in terms of the Nodal Development Policy and Plan.
h) Size of dwelling:
i) Existing policy regarding minimum extent of a dwelling together with outbuildings to be erected on single residential erven, is confirmed: Tzaneen Town, except Tzaneen Extension 13: 60m² Tzaneen Extension 13 and extensions thereto : 40m², Suburbs of Tzaneen : 25m²
i) Disposal of Municipal land:
i) Allocation of newly demarcated and serviced stands and alienation of stands will be according to the Policy on Alienation and Disposal of Municipal Land.
8.3 Business development
Tzaneen, Nkowankowa, Letsitele, Lenyenye and Haenertsburg are regarded as the formal business nodes within GTM. The remaining business development occurs mainly scattered along arterial routes or within settlement areas.
a) Business development, especially in villages to move towards creation of central business areas at
central accessible localities to ensure viable local service points that provide a wider variety of commodities and services to surrounding community. Scattered business development will be prohibited.
b) Corner shops/spaza‟s within residential areas that provide basic commodities to surrounding residents, will only be allowed within 200m of each other.
c) Telecommunication containers within residential areas will only be allowed within 500m of each other. d) LED strategy and Incentive policy to encourage the development of vacant business erven, especially
in Nkowankowa and Lenyenye. e) To plan and facilitate the development of a bus/taxi rank with hawker facilities in Lenyenye on Erven
2160 and 2161. f) Need for Tzaneen CBD to expand should be made viable through budgeting for building of bridge to
provide access to land opposite the Letaba River. g) Business development adjacent to provincial roads to comply to building lines and development
requirements. h) CBD DEVELOPMENT PLANS:
Office and Business development and extensions within proclaimed townships will be only allowed if it is in line with the zones contained in the CBD Policy Plans for Tzaneen, Nkowankowa and Lenyenye, which policy plan and zones are approved as part of the SDF Nodal Development Plans (Map 6, 6-1,6-2). Tzaneen CBD Policy Plan, dated May 2005: To counter the negative effect that overprovision of land could have on Tzaneen CBD momentum, Council adopts a policy that the state of development of Phase 1 future business and/or office zone, should be 75% developed before permission will be allowed for extension of offices or business in Phase 2 (arrows on SDF Map 6-1). Suburban business centres will be allowed on merit on an individual basis, according to the Nodal Development Plan. Nkowankowa CBD Policy Plan, dated May 2005 The CBD should be centrally located in the catchment area with a high degree of internal and external accessibility, and should serve as the main shopping centre. The CBD should ideally comprise the largest concentration of business activities, administration, government functions and high density development. A hierarchy of business centre should be developed in such a fashion that these

217
centres do not complete with, but rather complement the CBD. . Interventions should be sought to ensure Nkowankowa develop to its optimal potential as a business node, after thorough analysis of the trends and tendencies of business development within the town. Criteria to be implemented: The business area in Unit A be the designated CBD for Nkowankowa, and that support be given
to the spatial, infrastructural and economic development of this area; Bindzulani area be designated a suburban shopping centre, to serve Dan and extensions, and to
act as interceptor for trade which would otherwise be lost to Nkowankowa; The status quo for business land in Unit B and C be limited to existing business-zoned land and
to allow market forces to determine ultimate utilization (i.e. change of land use to residential usages for example);
New spaza’s will be allowed on condition that there is no spaza or business site within 200 metres of the development site.
Telecommunication containers be allowed in the event of there being no other container within a radius of 500 metres.
Lenyenye CBD Policy Plan, dated May 2005: Suburban node: Market forces are responsible for the spontaneous development of business at the entrance to Lenyenye. This development coincides with a public transportation break point, where commuters to rural areas disembark. It is the intersection in Lenyenye which carries the largest volume of traffic. This intersection will be the only designated suburban business node in Lenyenye. Corner shops and spaza’s: In terms of the norms, there should be eight corner shops in Lenyenye. The spaza’a has largely taken over the role of corner shops. Corner shop development will be evaluated on an ad hoc basis according to merit. New spaza’s will be allowed on condition that there is no spaza or business site within 200 metres of the development site. Telecommunication containers be allowed in the event of there being no other container within a radius of 500 metres.
i) Business and commercial development on agricultural land will be judged on an individual basis after thorough analysis of:
proof of need for development; proof of desirability of development; motivation for decentralization; should be a single development; environmental impact assessment; consideration of alternative sites; compliance to SDF Nodal Plan; and compliance to DFA principles
j) Rural Community Centres:
i) Community centres (for purposes of business, taxi/bus ranks, recreation, education, tourism etc.)
should be planned, marketed for development and/or upgraded through strategic partnerships at: Bindzulani Centre Maake Plaza Mamitwa Centre
ii) Private initiative should be supported for sustaining development of Tarentaalrand Crossing and The Junction, Letsitele as centres for tourism, recreation and educational purposes.
iii) Rural community centres should not replace, duplicate or negatively affect central business areas in towns, therefore expansion will be limited.
8.4 Industrial and Mining development
Nkowankowa is regarded as the primary industrial node and Tzaneen as the secondary industrial node. a) Industrial development and attracting investors should be marketed through LED Strategy and in
conjunction with Limdev and other stakeholders. LED Strategy to include the provision of incentives (tax holidays, low/free land cost, residential erven etc.) to attract investors. Industrial area of Nkowankowa should be made accessible and attractive to industrialists through attending to:

218
creation of option for private land ownership; upgrading of security at stands; subdivision of industrial erven to be made possible for smaller service and light industries; and Provision of incentives.
b) Industrial development on agricultural land will be prohibited. Industrial development that will be allowed on agricultural land should at least conform to the following: resource-orientated; packaging and/or processing and/or assembling of agricultural products produced on own
farm(s); and Environmental impact assessment mitigation measures.
c) Other industrial developments such as power plants will be judged on merit after thorough analysis of environmental impact and consideration of alternative sites.
d) Community LED projects which are mostly service or light industrial activities such as brick-making, sewing, carpentry, etc., should also conform to the Spatial Development Policy requirements. In the case of communal land, it should preferably be located adjacent to central business areas to strengthen the business centre as local service points, to be near their market for their products, and in close proximity to major link roads.
8.5 Tourism and Recreation
The implementation of the Tourism Framework and LED Strategy would market the development of the identified tourism projects. The priority tourism projects that might have a significant influence on the current economic situation are: a) Development of De Marrilac and Avondhoek Peninsulae as the Tzaneen Dam Provincial Flagship
Project. b) Development of Portion 2 of Erf 872 and Extension 54 as complementary to the opposite Dam
development with focus on serving the local and regional community, and more specifically entertainment and educational facilities for the children and youth.
c) Marketing and conserving Haenertsburg town and commonage (Haenertsburg Town and Townlands) as a tourism village and facilitating the development of land adjacent to the provincial road for tourism purposes through a strategic partnership.
d) Marketing and development of the Thabina Dam Nature Reserve and Noko Cultural village as tourism destinations.
e) The support of village tourism.
8.6 Conservation areas and Public Open Spaces
a) All land development and usages, should conform to the Environment Conservation Act, 1989 and its Regulations and the Environmental Management Plan and National Environmental Management Act, 1998.
b) Environmental sensitive areas, nature reserves, parks and related environments should be conserved.
c) Parks should constitute not less than 10% of the total area of a township extension, excluding flood areas.
d) Development and alienation of environmental sensitive areas, nature reserves and public open spaces should be judged after thorough analysis of the type of development, its environmental impact and how the development contributes towards conserving the natural environment.
e) Communities should become involved in the development and maintenance of parks within neighbourhoods.
8.7 Agricultural Land
a) Agricultural land as a scare natural resource should ultimately be conserved and development thereon
limited. b) Applications for land use change to develop on agricultural land, will be judged on an individual basis
after thorough analysis of: proof of need for development; proof of desirability of development; motivation for decentralization; should be a single development;

219
environmental impact assessment; alternative sites; compliance to DFA principles; availability of services; and Agricultural potential of land(consent from National Department of Agriculture required, where
applicable). c) Subdivision of high potential agricultural land will be discouraged. Applications for subdivision will only
be recommended in the following instances and according to the approved Policy on Subdivision of Agricultural Land: Subdivision needed as result of a physical boundary, example a railway line, river or national
road. A pre-requisite might be the consolidation with adjacent property to ensure a viable economic agricultural unit;
Subdivision of existing or proposed non-agricultural land uses, example business; In cases where subdivision would precede consolidation into more functional agricultural units; For purposes of township establishment or creation of land development areas (DFA); and Availability of adequate quality and quantity of water.
8.8 Municipal Offices
a) The Municipal Civic Centre is the main office for municipal administration purposes and supported by
offices in Nkowankowa, Lenyenye, Letsitele and Haenertsburg (library). b) Planning and Implementation for community/Thusong service centres should receive priority to bring
municipal and government parastatal services closer to the people. The following clusters have been identified: Cluster 1 Motupa Constituency Office (Ward 23, 24, 25, 26 and 33)
Tzaneen Office (Ward 1, 2, and 19) Cluster2 Lesedi Centre (Ward 3, 4, 5, 6, 7, 8, 9, 10, 11, 12 and 13) Cluster3 Nkowankowa Office (Ward 14, 15, 16, 17, 18 and 20) Cluster4 Runnymede Training Centre (Ward 21; 22; 27; 28; 29; 30; 31; 32 and 33)
c) Potential usages for Erf 88 and 89, Tzaneen should be investigated. Previous indications referred to
extension of Civic Centre to these properties. Erf 89 is still in process of transfer from Department of Public Works to GTM.
8.9 Cemeteries
Adequate provision is made for cemeteries for Tzaneen Town. The same does not apply to the rest of the municipal area. Currently individual graves occur on existing residential and agricultural stands on especially communal land due to lack of central cemeteries. Various private graveyards are established on agricultural land. a) Priority be given to establishment of cemeteries at Lenyenye, Mavela and Maunatlala to prevent ad hoc
burials. b) Establishment of cemeteries to comply to Environmental Impact Assessment, Geo-technical
Assessment and requirements of Department of Water Affairs.
8.10 Link Roads and Public Transport
a) Priority be given to upgrading of main road between Tzaneen, Nkowankowa, Lenyenye to Proposed Maake Shopping Complex as it is the road carrying the highest vehicle traffic, and because it is a main public transport route.
b) Priority should be given to construction, upgrading and rehabilitation of link roads between central business areas, community centres, municipal service centres, schools and hospitals, tourism areas, and streets according to assessment and priority in Sector Plan.
c) Priority link roads to be constructed or upgraded or rehabilitated are: Construction of a tar link road between Mamitwa nodal cluster and the Giyani road to receive
priority. Road D978 – Modjadji Road Road D1292 - Tarantaalrand to Mamitwa Road D350 – Tarentaalrand - Modjadji Road D5011 and D8 between Nkowankowa and Letsitele

220
Road D1267 - Eiland / Giyani road Thabina Dam - Maake road construction
d) Priority be given to public transport routes as contained in Public Transport Plan. e) Public Transport Plan to investigate rail passenger transport between Nkowankowa and Tzaneen.
8.11 Physical Infrastructural Service Provision
(Water, sewer, electricity, roads and stormwater, refuse removal, maintenance) a) RDP principles and minimum levels of services should be applicable to each individual internal service. b) Higher levels of service provision should be applicable and possible for higher order settlements(1st and
2nd order nodes as per Table 14) as categorized in the Spatial Settlement Hierarchy. c) Decision with regard to especially bulk service provision should primarily be based on cost effectivity (to
provide a service to as many people as possible within budget limitations). d) Source development and bulk supply networks should focus on priority development areas(1st and 2nd
order nodes), allowing for the option of higher levels of services to these higher order settlements, and minimum RDP levels of service provision to lower order nodes, which are located in the supply networks.
e) Focus and priority should also be on service provision to 1st and 2nd order nodes with simultaneous (if possible) provision to lower order settlements which do not comply with minimum RDP standards.
f) Services provision should only be considered for new development if it is situated in the spatial primary, secondary and tertiary nodal areas(1st order), as well as the population concentration points(2nd order).
g) Service provision for new development to local service points(3rd order) must be considered on merit, and with good motivation.
h) Service provision for new development in 4th and last order settlements, thus for the remaining villages, should as a rule not be considered. This principle for the 3rd and 4th order villages however does not exclude to upgrade the service level to minimum RDP standard.
8.12 Social Facility Development
a) Higher order social facilities(hospital, health centre, police station, secondary school, training centre etc.)
must be located in higher order nodes (1st and 2nd order nodes) b) Lower order and/or support or even temporary services should be provided to lower order nodes, such
as satellite police station, mobile clinic.
6. INTEGRATED DISASTER MANAGEMENT PLAN Emergencies are defined as situations, or the threat of impending situations abnormally affecting the lives and property of our society which, by their nature, or magnitude require a coordinated response by a number of role players, both governmental and private, under the direction of the appropriate elected officials, as distinct from routine operations carried out by role players as normal day to day procedures, e.g. fire fighting, police activities, normal hospital routines, ambulance routines.
While most peacetime emergencies could occur within the geographical area of responsibility of the Greater Tzaneen Municipality, those most likely to occur are:-
Windstorms
Floods
Epidemics
Transportation accidents
Air or rail crashes
Toxic or flammable gas leaks
Electric power blackouts
Building or structural collapse
Uncontrollable fires
Explosions
Breakdown of essential services / supplies, or any combination thereof.

221
The aim of the Greater Tzaneen Municipal Emergency Plan is to outline a plan of action for the efficient deployment, and coordination of the Municipalities services, role players and personnel to provide the earliest possible response in or to:-
Protect and preserve life and property
Assist the Mopani District Municipality and/or other municipalities as requested.
Minimize the effects of the emergency or disaster on the Greater Tzaneen Municipality; and
Restore essential services. The following are also components of the Disaster Management Plan:- RISK ANALYSIS
The timely identification of potential emergencies/disasters. The impact thereof must be completed by each department. This will lead to the mustering of resources and
personnel. Should the department be unable to cope with the emergency the Joint Operational Centre (JOC) will assume
responsibility. The evaluation and risk analysis should be completed in conjunction with the relevant departments and Disaster
Management.
INTRODUCTION AND USAGE OF JOINT OPERATIONAL CENTRE.
In the event of an emergency a Joint Operational Centre (JOC) will be established. The Disaster Management Committee and many other role players congregate and work together at the JOC to make decisions, share information and provide support as required to mitigate the effects of the emergency. The Disaster Manager is responsible for the coordination of all operations within the JOC.
MITIGATION AND RESPONSE INITIATIVES
A programme must be added to the IDP, Community Training and Building Methods.
Short courses with reference to building materials, building methods, different sand and river sand mixtures must take place.
The treatment of wooden poles,rafters must taught and explained
Roof construction must be explained.
The placing of the house with reference to wind prone areas
The building of a house in 50 to 100 year flood lines.
7. INTEGRATED ENVIRONMENTAL MANAGEMENT PLAN
TABLE OF CONTENTS
1. INTRODUCTION 2. POLICY AND LEGISLATIVE MANDATE 3. ENVIRONMENTAL QUALITY AND PROTECTION 4. ENVIRONMENTAL IMPACT MANAGEMENT 4.1 DPSIR Framework 4.2 Environmental Issues 4.3 Prioritization 4.4 IDP Project requiring EIA 5. ENVIRONMENTAL MANAGEMENT PROGRAMME 1. INTRODUCTION
The purpose of the Environmental Management plan is to promote co-operative environmental governance and set up procedures for co-ordinating environmental functions excused by the Municipality.

222
2. POLICY AND LEGISLATIVE MANDATE
The legislative requirements for environmental management are set out in these national laws and government policies:
1. National Environmental Management Act (Act no 107 of 1998) 2. Environmental Conservation Act (Act 73 of 1989) 3. National Water Act (Act 73 of 1989) 4. Forest Act (Act 122 of 1984) 5. Atmospheric Pollution Prevention Act (Act no 45 of 1965) 6. Health Act (Act no 63 of 1977) 7. Development Facilitation Act (Act 67 of 1995) 8. Housing Act (Act 107 of 1997) 9. Electricity Act (Act 41 of 1987) 10. National Building Regulations and Building Standard Act (Act 103 of 1977) 11. Minerals Act (Act 50 of 1991) 12. National Roads Act (Act 54 of 1971) 13. Environmental Management Policy – DEAT 14. Integrated Pollution and Waste Management Policy – DEAT
3. ENVIRONMENTAL QUALITY AND PROTECTION
3.1 Environmental quality and protection provides for:
The implementation of the Integrated Waste Management Plan
Ensuring emergency response and preparedness through the Disaster Management Act
Sustainable mobility for all through the Transport Plan
Integrated pollution prevention
Poverty alleriation 3.2 Description of Environmental Management functions:
Prevent, reduce and manage pollution
Increase recycling and reclaiming of waste
Promote cleaner production technology in key pollution sectors
Develop and implement environment of air quality
Enforce air quality legislation
Collect, co-ordinate and manage data of pollutants released into the environment
Enforce legislation and regulations dealing with Environmental Impact Assessment
Promote sound management of bio-diversity for sustainable and equitable use
Implement international conventions and treaties
Develop an integrated state of the environment reporting system
The Driving force-Presure-State-Impact-Response (DPSIR) Framework was used to establish key environmental issues in our Municipal Area of Jurisdiction.
DPSIR FRAMEWORK
D
P
S
I
R

223
Description of the components of the DPSIR framework: D - Driving Force: These are the underlying social and economic activities that lead to environmental change.
Population growth, poverty, agriculture and industrial production are common examples. P - Pressure: These are pressures on the environment which result from the driving forces, for examples pollution of
air, water and soil from industrial production, or depletion of fish stocks through human consumption. S - State: This component describes the current state of the environment and recent trends in environmental quality. I - Impacts: These are the consequences of the pressures on the environment, for example reductions in
biodiversity, soil degradation, poor human health, and lack of clean, safe water. R - Responses: This component describes the human responses to environmental change, including policies and
management strategies to reduce environmental damage, rehabilitate damaged environments and encourage sustainable development.
The DPSIR approach was applied to all the environmental issues.
The Environment issues were identified in the Analysis phase as follows: 1. Pollution and degradation of the environment
2. Minimizing waste and those efforts to recycle at this stage are minimal as compared to the volume of waste
generated.
3. Exploitation of non-renewable resources.
4. No effective public participation in environmental governance.
5. Development results in the ecosystem disturbance and loss of biodiversity.
6. Environmental considerations are not taken into account during the life cycle of projects.
ACTIVITY/SERVICE ASPECT IMPACT OR POSSIBLE IMPACT
Sewerage purification Screenings deposited in a pit
Release of methane gas
Effluent discharged into a river
Pre-mature release of sludge from the digesters
Illegal dumping in the oxidation ponds
- Under ground water pollution - Air pollution - Water pollution - Land pollution, vegetation contamination - Natural purification interfered with
resulting in water cause pollution
Water Purification Uncontrolled consumption of purified water
Emptying septic tanks
Deposition of raw sewage into oxidation pod
Maintenance of sewage collection tank
- Loss of valuable resource
Road construction Bulk earth works
Mining of suitable road construction material.
Repairs and maintenance on site.
- Dust (Air pollution) - Loss of vegetation and habit. - Surface + ground water pollution with
hazardous material.
Storm water management
Collection of run-off and discharge of storm water.
- Soil erosion - Disturbance vegetation.
Fleet management Storage, decanting and use of leaded fuel
Washing of engines
- Air pollution - Storm water pollution
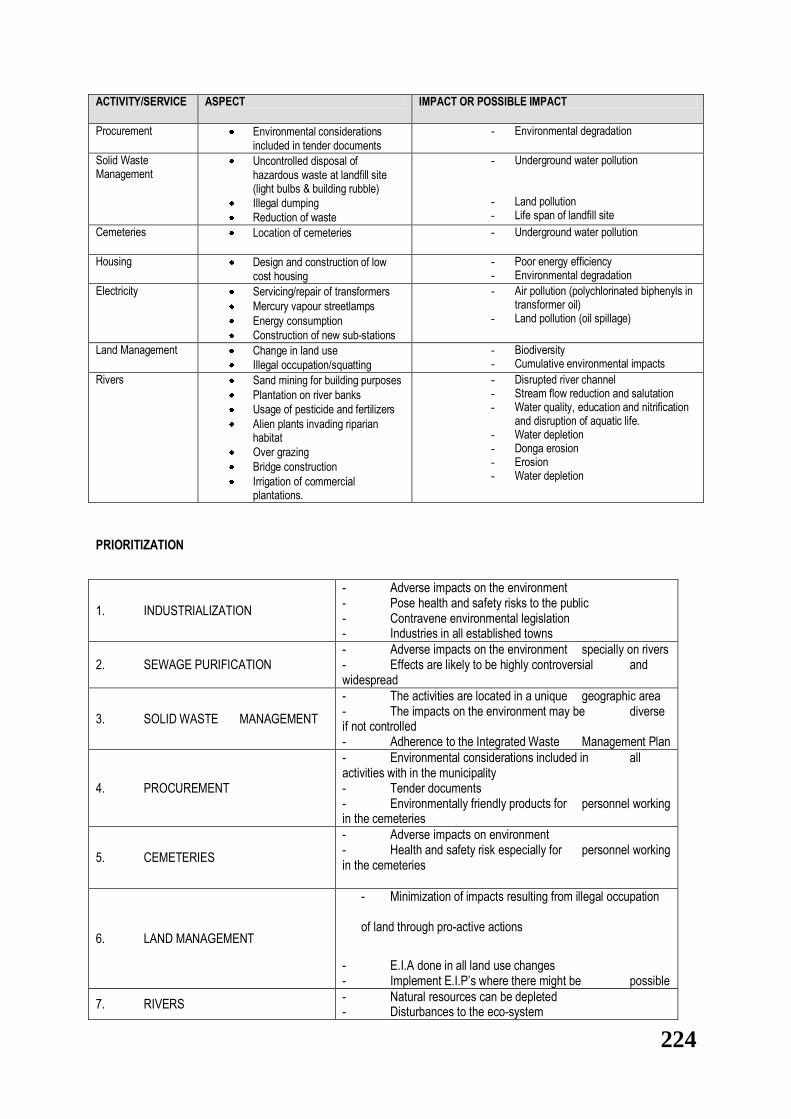
224
ACTIVITY/SERVICE ASPECT IMPACT OR POSSIBLE IMPACT
Procurement Environmental considerations included in tender documents
- Environmental degradation
Solid Waste Management
Uncontrolled disposal of hazardous waste at landfill site (light bulbs & building rubble)
Illegal dumping
Reduction of waste
- Underground water pollution
- Land pollution - Life span of landfill site
Cemeteries Location of cemeteries - Underground water pollution
Housing Design and construction of low cost housing
- Poor energy efficiency - Environmental degradation
Electricity Servicing/repair of transformers
Mercury vapour streetlamps
Energy consumption
Construction of new sub-stations
- Air pollution (polychlorinated biphenyls in transformer oil)
- Land pollution (oil spillage)
Land Management Change in land use
Illegal occupation/squatting
- Biodiversity - Cumulative environmental impacts
Rivers Sand mining for building purposes
Plantation on river banks
Usage of pesticide and fertilizers
Alien plants invading riparian habitat
Over grazing
Bridge construction
Irrigation of commercial plantations.
- Disrupted river channel - Stream flow reduction and salutation - Water quality, education and nitrification
and disruption of aquatic life. - Water depletion - Donga erosion - Erosion - Water depletion
PRIORITIZATION
1. INDUSTRIALIZATION
- Adverse impacts on the environment - Pose health and safety risks to the public - Contravene environmental legislation - Industries in all established towns
2. SEWAGE PURIFICATION - Adverse impacts on the environment specially on rivers - Effects are likely to be highly controversial and widespread
3. SOLID WASTE MANAGEMENT
- The activities are located in a unique geographic area - The impacts on the environment may be diverse if not controlled - Adherence to the Integrated Waste Management Plan
4. PROCUREMENT
- Environmental considerations included in all activities with in the municipality - Tender documents - Environmentally friendly products for personnel working in the cemeteries
5. CEMETERIES
- Adverse impacts on environment - Health and safety risk especially for personnel working in the cemeteries
6. LAND MANAGEMENT
- Minimization of impacts resulting from illegal occupation
of land through pro-active actions
- E.I.A done in all land use changes - Implement E.I.P‟s where there might be possible
7. RIVERS - Natural resources can be depleted - Disturbances to the eco-system

225
- Expensive to treat polluted water for human consumption
8. WETLANDS - Prevention of illegal activities around wetland – fishing – draining of water for other purposes - Maintain the natural state of wetlands
9. FLEET MANAGEMENT - Promote the use of unleaded petrol to minimize lead emissions in to the atmosphere
IDP PROJECTS REQUIRING EIA
Project Name Activity Department Legal Requirements
Housing Construction of RDP units CEM National Building Regulations and building standard Act 103 of 1997 National Housing Act 107 of 1997 Health Act 63 of 1997 Development facilitation Act 67 of 1997 Physical planning Act 125 of 1991
Water Laying of water reticulation system
CEM National Water Act 36 of 1998 Health Act 63 of 1977
Sanitation Extension of Tzaneen sewer purification plant
CEM National Water Act 36 of 1998 Environment Conservation Act 73 of 1989 Health Act 63 of 1977
Waste Management CSM Hazardous substances 15 of 1973 Act 73 of 1989 Health Act 63 of 1977 National Environment Management Act 107 of 1998 National Water Act 36 of 1998
Electricity Installation of underground cable
EEM National Environment Management Act 107 of 1998
Road construction Road construction in an environmentally sensitive area.
CEM National Roads Act National Environment Management Act 107 of 1998 Physical Planning Act 125 of 1991
Land Management Rezoning Township establishment
S & D National Environment Management Act 107 of 1998 Physical Planning Act 125 of 1991 Development facilitation Act 67 of 1997 Environment conservation Act 73 of 1989

226
ENVIRONMENTAL MANAGEMENT PROGRAMME
Policy Commitment Objectives Targets Responsible Department
1. Ensuring that the Municipality‟s own activities and services comply with environmental legislation and other environmental requirements
To establish an integrated Environmental Management System
1. Identifying environmental aspects by June 2003
2. Training on environmental management system for senior management and strategic middle management
3. Conduct environmental Legal Compliance Audit by 2004
4. Monitor and measurement management review by 2005
5. System Audited by 2007
CSM
2. To become an environmental sustainable community by creating a safe and healthy environment
1. To evaluate and monitor the achievement, promotion and protection of a sustainable environment 2. To contribute to a healthy environment by ensuring that envisaged project has no negative impacts on the natural environment. 3. To co-ordinate harmonize the environmental policies, plans, programmes and decisions of all the Departments in order to promote consistency in the exercise of functions that may effect the environment
Monitor and evaluate once a year compliance with relevant environmental legislation and regulations Environmental inputs in all contracts and projects by December 2004 Develop the following plans by December 2003
1. Integrated Waste Management Plan.
2. Water sector plan 3. Infrastructural provision
plan 4. Transport plan 5. Disaster Management
plan
CSM All Departments CSM CEM CEM CSM CSM
3. Education and training on environmental issues
1. To develop a public participation strategy on
a) Sustainable water usage
b) Handling of hazardous domestic waste
c) Energy efficiency d) Nature conservation
2. To educate and train employees whose work activities can have significant impact on the environment
1.Cleanest School Competition 2. Internal workshop on Environmental issues
Schools All Departments
4. Waste Management
To minimize environmental impact of transfer stations and the landfill sites by ensuring that sites are permitted. To ensure that each waste type receives the correct method of
Permits for all transfer stations by 2006
1. 100% utilization of the medical waste
CSM

227
Policy Commitment Objectives Targets Responsible Department
disposal removal system 2. Develop strategies
for the collection and transfer facilities for hazardous domestic waste.
5. Pollution prevention
To minimize waste by promoting recycling and composting To ensure that EIA is conducted before the commencement of any scheduled process
Promote recycling projects Composting of garden refuse/organics by Dec 2004 EIA conducted for all scheduled processes
CSM
6. State of the Environment Reporting System
To establish and provide access to environmental information
Finalize State of the Environment Report By June 2009 Geographic information systems Core set of Environmental indicators identified by June 2010 Core set sustainability indicators established by Sept 2010 Implement for monitoring and reporting established by Dec 2009 State of the environment report produced every four years
CSM
8. HIV/AIDS PLAN
BACKGROUND
Since the democratic elections in December 2000, the issue of HIV/AIDS, which always was a national and provincial matter, became the responsibility of local government as well. As the pandemic increases in severity and magnitude the following has inter alia become necessary for Council to consider: a) The approval of an appropriate policy on HIV/AIDS in the workplace. b) The approval of a 5-year strategic plan of action for the whole area of jurisdiction. c) The establishment of a sub-district AIDS-Council from all relevant stakeholders to amalgamate all current ad-hoc
HIV/AIDS- activities and provide guidance on the way forward. d) The drafting of appropriate awareness programs via the AIDS-Council and the implementation thereof in schools,
communities, etc. The proposed policy in (a) above was drafted and served before Council during July 2002. Approval by Council for establishing an AIDS-Council as in (c) above was granted recently. This is a major and time consuming task that requires a lot of research, liaison and negotiations with potential roll players. This item serves the purpose of submitting a 5-year strategic action plan as in (b) above. Please note that a Distinct AIDS-Council was elected and launched for the Mopani District during December 2001. This council should provide guidance towards all Local Municipalities in the Mopani District. The role of the District AIDS-Council (D.A.C) will include inter alia: 1. Drafting of policies within national and provincial guidelines. 2. Advising municipalities in its area of jurisdiction.
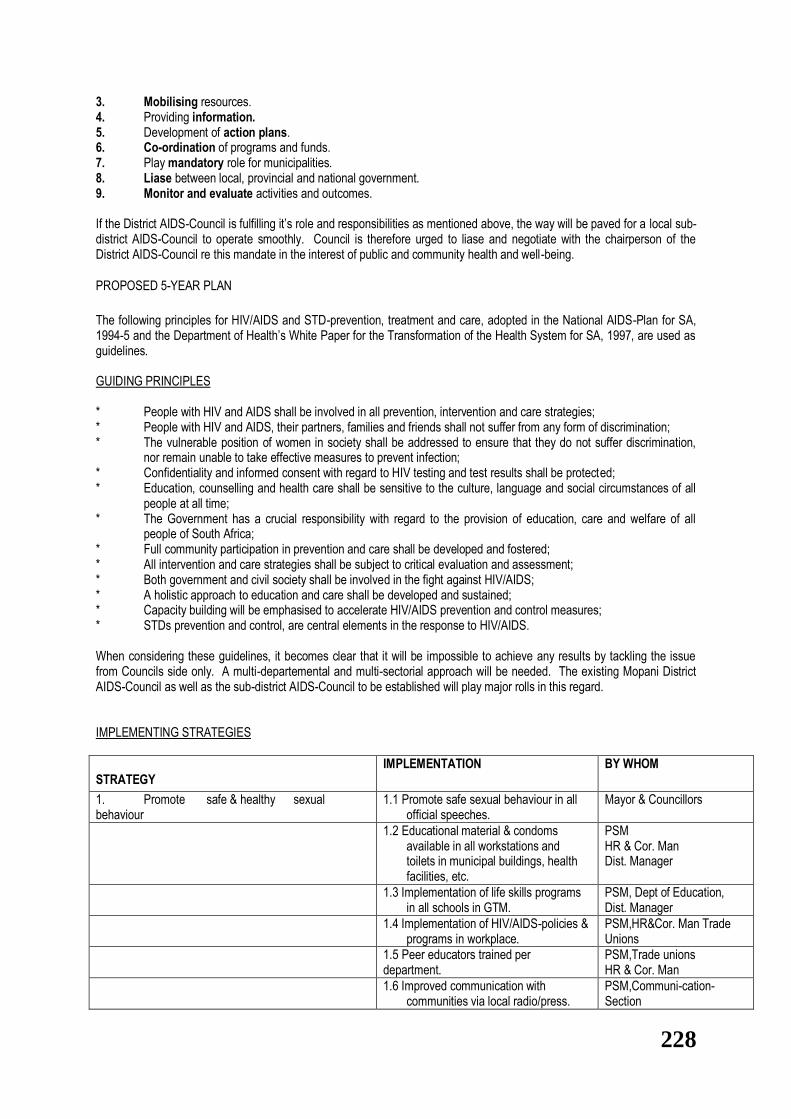
228
3. Mobilising resources. 4. Providing information. 5. Development of action plans. 6. Co-ordination of programs and funds. 7. Play mandatory role for municipalities. 8. Liase between local, provincial and national government. 9. Monitor and evaluate activities and outcomes. If the District AIDS-Council is fulfilling it‟s role and responsibilities as mentioned above, the way will be paved for a local sub-district AIDS-Council to operate smoothly. Council is therefore urged to liase and negotiate with the chairperson of the District AIDS-Council re this mandate in the interest of public and community health and well-being.
PROPOSED 5-YEAR PLAN
The following principles for HIV/AIDS and STD-prevention, treatment and care, adopted in the National AIDS-Plan for SA, 1994-5 and the Department of Health‟s White Paper for the Transformation of the Health System for SA, 1997, are used as guidelines. GUIDING PRINCIPLES * People with HIV and AIDS shall be involved in all prevention, intervention and care strategies; * People with HIV and AIDS, their partners, families and friends shall not suffer from any form of discrimination; * The vulnerable position of women in society shall be addressed to ensure that they do not suffer discrimination,
nor remain unable to take effective measures to prevent infection; * Confidentiality and informed consent with regard to HIV testing and test results shall be protected; * Education, counselling and health care shall be sensitive to the culture, language and social circumstances of all
people at all time; * The Government has a crucial responsibility with regard to the provision of education, care and welfare of all
people of South Africa; * Full community participation in prevention and care shall be developed and fostered; * All intervention and care strategies shall be subject to critical evaluation and assessment; * Both government and civil society shall be involved in the fight against HIV/AIDS; * A holistic approach to education and care shall be developed and sustained; * Capacity building will be emphasised to accelerate HIV/AIDS prevention and control measures; * STDs prevention and control, are central elements in the response to HIV/AIDS. When considering these guidelines, it becomes clear that it will be impossible to achieve any results by tackling the issue from Councils side only. A multi-departemental and multi-sectorial approach will be needed. The existing Mopani District AIDS-Council as well as the sub-district AIDS-Council to be established will play major rolls in this regard. IMPLEMENTING STRATEGIES
STRATEGY
IMPLEMENTATION BY WHOM
1. Promote safe & healthy sexual behaviour
1.1 Promote safe sexual behaviour in all official speeches.
Mayor & Councillors
1.2 Educational material & condoms available in all workstations and toilets in municipal buildings, health facilities, etc.
PSM HR & Cor. Man Dist. Manager
1.3 Implementation of life skills programs in all schools in GTM.
PSM, Dept of Education, Dist. Manager
1.4 Implementation of HIV/AIDS-policies & programs in workplace.
PSM,HR&Cor. Man Trade Unions
1.5 Peer educators trained per department.
PSM,Trade unions HR & Cor. Man
1.6 Improved communication with communities via local radio/press.
PSM,Communi-cation- Section

229
STRATEGY
IMPLEMENTATION BY WHOM
2. Improve the management & control of STD‟s 2.1 Training of all health care workers in: - management of STD‟s
- youth friendly services - HIV/AIDS - counselling
PSM HR & Cor. Man Trade Unions Dist. Manager
3. Reduce mother-to-child transmission (MTCT) 3.1 Training of all health care workers in HIV- counselling & Testing
PSM,HR&Cor. Man Dist. Manager
3.2 All health facilities fully accessible & offering a comprehensive service to HIV-positive mother.
PSM Dist. Manager
4. Provide appropriate post-exposure service 4.1 Appropriate policies on needle stick exposure fully implemented in all health facilities with all staff trained in procedures.
PSM Dist. Manager
5. Improve access to voluntary testing & counselling (VCT)
5.1 Training for all health care workers on VCT according to national minimum standards
PSM Dist. Manager
6. Provide treatment, care & support services in health care facilities
6.1 Ensure complete guidelines for treatment & care of HIV/AIDS- patients fully implemented in health care facilities.
PSM Dist. Manager
6.2 Ensure an uninterrupted supply of appropriate drugs for treatment of opportunistic infections.
PSM Dist. Manager
6.3 Ensure appropriate in-service training for health care workers in treatment, care and support of HIV/AIDS, STD and TB- patients.
PSM Dist. Manager
6.4 Ensure significant reduction in TB incidence in GTM
PSM Dist. Manager
7. Provide adequate treatment, care & support services in communities.
7.1 Ensure the implementation of approved home-based care guidelines.
PSM, Dist Man NGO‟s, Youth Groups.
7.2 Ensure establishment of inter-sectoral task teams at community level to implement home-based care programs in wards.
PSM Dist. Manager Ward Councillors
7.3 Ensure establishment of poverty alleviation projects via public/ private & community partnerships.
Public Service Manager, S&D Manager, Dist. Manager Chairperson Local Economic Portfolio
8. Develop & expand the provision of care to orphans & children
8.1 The health situation and social needs of children affected by HIV/AIDS to be addressed in all official speeches and meetings with communities and negotiations with national & provincial government & private business sector.
Mayor Speaker Councillors
9. Investigate treatment & care options. 9.1 Regular review of all policies on anti-retroviral use, mother-to-child transmission, etc, to keep within national guidelines.
PSM Dist. Manager
9.2 Regular in-service training of health care workers to stay abreast of latest developments.
PSM Dist. Manager

230
STRATEGY
IMPLEMENTATION BY WHOM
10. Conduct regular surveillance 10.1Co-ordinate surveys on prevalence & spread of pandemic, effect of programs & interventions.
PSM Dist. Manager
10.2 Update data-base regularly Public Service Manager, Dist. Man
11.Create a supportive and caring environment 11.1 HIV/AIDS to be a standing agenda point on all political & Council meeting agendas.
Mayor Speaker Councillors
11.2 All political leaders to wear HIV/AIDS- ribbons during public appearances.
Mayor Speaker Councillors
11.3 All awareness programs be integrated & co-ordinated with municipal services.
PSM Mayor MM
12.Develop an appropriate legal & policy environment 12.1 Full implementation of the HIV/AIDS Code of Good Practice with all health related activities.
PSM Dist. Manager Mayor MM
F) PROJECTS / SERVICES
Project No Strategy Project / Service Stake-holders 02/3 03/4 04/5 05/6 06/7
HIV 1 Promote safe & healthy sexual behaviour
1.1Training of communities on all aspects related to HIV/AIDS in all spheres of life.
GTM, DOH Dept of Educ Church NGO” /CBO‟s. Agriculture Business Sector Trade Unions Youth Groups
x x x x x
1.2 Drafting of Workplace policy/life skills programs.
PSM & All.Mun .Depts DoH
x x
1.3Distribution of condoms / promotion of condom use.
GTM/ DoH Trade Unions
x x
x
x
x
HIV 2 Improve the management & control of STD‟s.
Training for health care workers on
- STD-
management
- Youth friendly services
- HIV/AIDS counselling
- Male sexuality
DoH GTM Trade Unions
x x x x x
HIV 3 Reduce mother-to -child transmission
Training for Health care workers in use of anti-retro viral drugs.
DoH x x x x x
HIV 4 Improve access to voluntary testing & counsel-ling(VCT)
4.1Promote VCT-program
DoH x x x x x

231
Project No Strategy Project / Service Stake-holders 02/3 03/4 04/5 05/6 06/7
4.2Training of health care workers in procedures
DoH x
x x x x
HIV 5 Provide treatment, care & support services in health care facilities & communities
5.1 Develop a home based care (HBC) program
GTM, DoH NGO‟s/ Youth Groups
x
5.2 Train / capacitate volunteers.
GTM/DoH NGO‟s/ Youth Groups
x x x x
5.3 Implement /drive HBC program in all wards.
Ward Councillors GTM DoH
x x x x
5.4 Provision of anti-retro viral drugs to the infected.
DoH x x x x
5.5 Facilitate poverty- alleviation programs.
GTM, Agriculture Trade & Industry Business Sector
x x
x x x
HIV 6
Develop & expand the provision of care to children & orphans
Develop community social development / upliftment programs focussing on HIV/AIDS
GTM / DoH Social Development. NGO‟s/CBO‟s Business Sector Youth Groups
x x x x
9. LOCAL ECONOMIC DEVELOPMENT STRATEGY
INTRODUCTION Local Economic Development is the major drive for economic growth within the Municipal area. The overriding economic challenges for South African local authorities are poverty and unemployment. These should be addressed by creating an enabling environment for economic growth through attraction of investors and infrastructure development and this can be achieved by developing the LED plan/strategy
STRATEGIES FOR LED 1. POLICIES AND LEGISLATIVE FRAMEWORK The reviewed LED strategy for the Municipality (2007) has identified several strategies in accordance with the National and Provincial policies and certain legislative frameworks.
The White Paper on Local governance (1998)
Local and District LED Strategies
Limpopo Growth and Development Strategy
AsGISA
BBBEE
Cooperative Act
National Spatial Development perspective
LRAD
SEDA 2. STRATEGIC THRUSTS
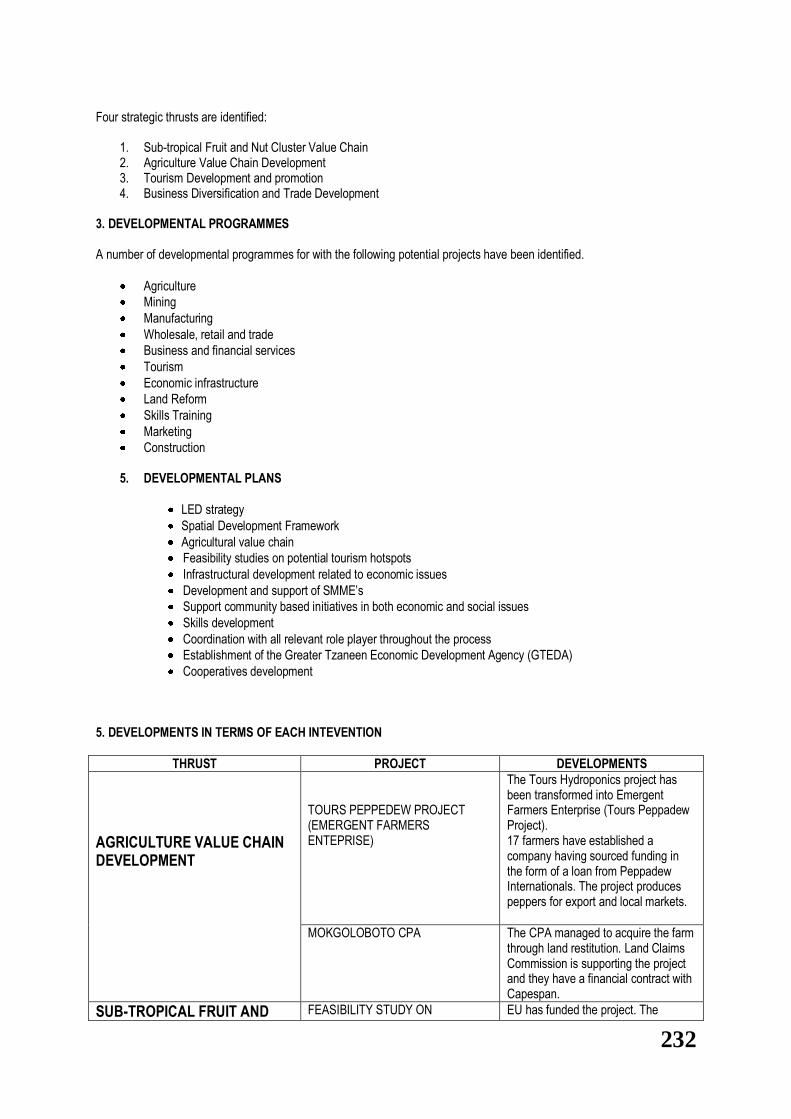
232
Four strategic thrusts are identified:
1. Sub-tropical Fruit and Nut Cluster Value Chain 2. Agriculture Value Chain Development 3. Tourism Development and promotion 4. Business Diversification and Trade Development
3. DEVELOPMENTAL PROGRAMMES A number of developmental programmes for with the following potential projects have been identified.
Agriculture
Mining
Manufacturing
Wholesale, retail and trade
Business and financial services
Tourism
Economic infrastructure
Land Reform
Skills Training
Marketing
Construction
5. DEVELOPMENTAL PLANS
LED strategy
Spatial Development Framework
Agricultural value chain
Feasibility studies on potential tourism hotspots
Infrastructural development related to economic issues
Development and support of SMME‟s
Support community based initiatives in both economic and social issues
Skills development
Coordination with all relevant role player throughout the process
Establishment of the Greater Tzaneen Economic Development Agency (GTEDA)
Cooperatives development
5. DEVELOPMENTS IN TERMS OF EACH INTEVENTION
THRUST PROJECT DEVELOPMENTS
AGRICULTURE VALUE CHAIN DEVELOPMENT
TOURS PEPPEDEW PROJECT (EMERGENT FARMERS ENTEPRISE)
The Tours Hydroponics project has been transformed into Emergent Farmers Enterprise (Tours Peppadew Project). 17 farmers have established a company having sourced funding in the form of a loan from Peppadew Internationals. The project produces peppers for export and local markets.
MOKGOLOBOTO CPA The CPA managed to acquire the farm through land restitution. Land Claims Commission is supporting the project and they have a financial contract with Capespan.
SUB-TROPICAL FRUIT AND FEASIBILITY STUDY ON EU has funded the project. The

233
NUT CLUSTER VALUE CHAIN SUBTROPICAL FRUIT AND NUT CLUSTER VALUE CHAIN
feasibility study was completed in 2007 with project profiling. Advertised for business plans
TOURISM DEVELOPMENT
MEFAKENG COMMUNITY TOURISM
Irish Aid funded the project. Three nodal areas have been identified in Muhlaba, Thabina and Nkowankowa. Products development is finalized in Muhlaba and Nkowankowa with Thabina awaiting appointment of the service provider.
TOURISM PROMOTION AND MARKETING
Greater Tzaneen Community Tourism association is established. Annual events/exhibitions are attended and hosted, Locally and Nationally. Tzaneen brochure has been developed. In the process of developing an article for 2010 event. 2010 activities are coordinated.
BUSINESS DIVERSIFICATION AND TRADE DEVELOPMENT
HAWKERS RESEARCH AND FESIBILITY STUDY
The project is funded by EU. The study is completed. In the process of starting with implementation on database and procedures for application.
SHOPPING CENTERS More shopping centers are constructed, Maake shopping center, Tzaneng Mall extension.
SMME SUPPORT Continuous workshops/seminars are coordinated with development agencies, SEDA, LIBSA, NDA. Community projects ae continuously supported by CDF‟s and the LED office.
GREATER TZANEEN ECONOMIC DEVELOMENT AGENCY
ESTABLISHMENT OF GREATER TZANEEN ECONOMIC DEVELOPMENT AGENCY
The Greater Tzaneen Economic Development has been established and is funded by IDC. It is now in the second phase of development where focus is on feasibility studies
10. INTEGRATED ORGANISATIONAL PERFORMANCE MANAGEMENT
SYSTEM
The Performance Management Guidelines to Municipalities (2001) clearly describes what a municipality needs to do to ensure that they develop and implement an Integrated Organisational Performance Management System (OPMS). According to the guidelines the following components should be part of the OPMS:
Planning Measurement
o Setting of Key Performance Indicators o Setting of Targets
Monitoring Review Assessment Reporting

234
Integrated Organisational Performance and Employee Performance Planning The Local Government Regulations1 on Planning and Performance Management (Chapter 2) provides the details as to what the content of the IDP should be and the development of this Integrated Development Plan of Greater Tzaneen Municipality has been developed in line with all these specifications in mind. The most critical step in the planning process is detailed in Chapter 2, (6) (b) which stipulates that the IDP must be used to prepare action plans for the implementation of strategies identified by the municipalities, and therefore it is evident that the IDP fulfils the planning stage of performance management and performance management fulfils the implementation, monitoring, review and reporting of the progress towards implementation. It is critical that there must be a link and integration between the planning process and the ability to manage and monitor implementation. Performance Measurement In order for the municipality to monitor progress towards improvement of service delivery and the attainment of targets, it i s essential that a proper set of Key Performance Indicators (KPI‟s) are developed that can be used to measure progress of the municipality. To ensure that the strategy of Greater Tzaneen Municipality becomes measurable specific outcome indicators have been developed per strategic objective as represented in the strategy map. The indicators can be attained through the implementation of specific strategic projects that will focus on addressing the bottlenecks and constraints within the municipality. The table below indicates the outcome indicators and strategic projects that the municipality developed and identified to ensure that the vision becomes attainable and also to measure progress towards implementation of strategies.
ECONOMIC GROWTH
Perspective Strategic Objective
Objective Outcome Outcome Indicator Strategic project
Community Satisfaction
Create community beneficiation and empowerment opportunities
Poverty reduction % reduction in unemployment Business Support Hub Poverty Eradication Strategy
Financial Create a stable economic environment by attracting suitable investors
Sustainable economic growth
% growth in GGP of municipal area
Incentive policy, Vision 2020, GTEDA Functionalisation
Institutional Processes
Integrated Developmental Planning
Integrated human settlement
% Credible IDP rating, % adherence to IDP Process Plan
Rural Development Strategy IDP/Budget/PMS Process Prioritisation model
Learning and Growth
Develop a high performance culture for a changed, diverse, efficient and effective local government
High performing organisation
% Institutional performance score
Instilling Values and Culture of Discipline Functional PMS
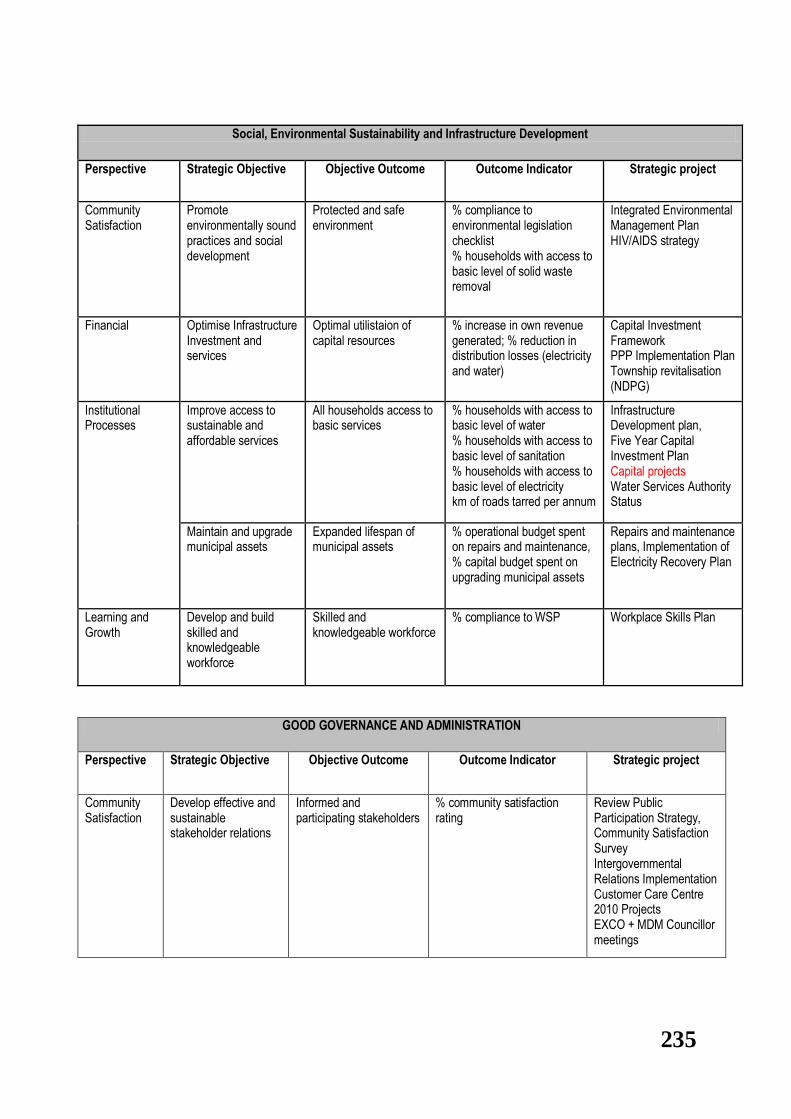
235
Social, Environmental Sustainability and Infrastructure Development
Perspective Strategic Objective Objective Outcome Outcome Indicator Strategic project
Community Satisfaction
Promote environmentally sound practices and social development
Protected and safe environment
% compliance to environmental legislation checklist % households with access to basic level of solid waste removal
Integrated Environmental Management Plan HIV/AIDS strategy
Financial Optimise Infrastructure Investment and services
Optimal utilistaion of capital resources
% increase in own revenue generated; % reduction in distribution losses (electricity and water)
Capital Investment Framework PPP Implementation Plan Township revitalisation (NDPG)
Institutional Processes
Improve access to sustainable and affordable services
All households access to basic services
% households with access to basic level of water % households with access to basic level of sanitation % households with access to basic level of electricity km of roads tarred per annum
Infrastructure Development plan, Five Year Capital Investment Plan Capital projects Water Services Authority Status
Maintain and upgrade municipal assets
Expanded lifespan of municipal assets
% operational budget spent on repairs and maintenance, % capital budget spent on upgrading municipal assets
Repairs and maintenance plans, Implementation of Electricity Recovery Plan
Learning and Growth
Develop and build skilled and knowledgeable workforce
Skilled and knowledgeable workforce
% compliance to WSP Workplace Skills Plan
GOOD GOVERNANCE AND ADMINISTRATION
Perspective Strategic Objective Objective Outcome Outcome Indicator Strategic project
Community Satisfaction
Develop effective and sustainable stakeholder relations
Informed and participating stakeholders
% community satisfaction rating
Review Public Participation Strategy, Community Satisfaction Survey Intergovernmental Relations Implementation Customer Care Centre 2010 Projects EXCO + MDM Councillor meetings

236
GOOD GOVERNANCE AND ADMINISTRATION
Perspective Strategic Objective Objective Outcome Outcome Indicator Strategic project
Financial Increase financial viability
Increased financial viability
% increase in cost coverage % Increase in debt coverage ratio % decrease in outstanding rates and service debtors
Five Year Financial Plan (Cost recovery+Revenue generation) Financial Recovery Plan - Management and implementation Zero Based Budgeting
Institutional Processes
Effective and efficient administration
Effective and efficient administrative system
% reports submitted within legislated timeframes
Institutional Development Plan MIS development, Risk Management, Thrust team meetings & Cluster Chair-management meetings Audited Performance Reports
Learning and Growth
Attract and retain best human capital to become employer of choice
Efficient workforce % staff turnover (Levels 1 - 6) Recruitment Strategy, Rewards and incentive policy, Retention strategy
Monitoring Municipalities are guided by the Regulations (Chapter 3, 13) as to what a monitoring framework entails):
“13. (1) A municipality must, after consultation with the local community, develop and implement mechanisms, systems and processes for the monitoring, measurement and review of performance in respect of the key performance indicators and performance targets set by it.
(2) The mechanisms, systems and processes for monitoring in terms of sub regulation (1) must- (a) Provide for reporting to the municipal council at least twice a year; (b) Be designed in a manner that enables the municipality to detect early indications of under-performance;
and (c) Provide for corrective measures where under-performance has been identified.”
A municipality must develop a monitoring framework that (Guidelines par.5.4): “ Identifies the roles of the different role-players in monitoring and measuring the municipality's performance Allocates specific tasks to the gathering of data and submission of reports Determines: d in a manner that enables the municipality to detect early indications of under-performance -performance has been identified baseline indicators”

237
Within the municipality the process of Performance monitoring is thus an ongoing process that runs parallel to the implementation of the agreed IDP as contained within the annual Service Delivery and Budget Implementation Plan (SDBIP). Performance Evaluation Performance Evaluation is a process whereby the value of the specific program, project or indicator / measurement is evaluated to determine whether it contributes to the value added by the municipality or even the strategic intent of the municipality. . An evaluation is conducted on a quarterly basis whereby the outcomes and achievements are analysed in terms of the progress made with the implementation of programmes, projects or initiatives. At least once a year, preferably after the annual review process the municipality must evaluate the entire performance management system to determine whether there is significant progress made towards the attainment of strategies and targets. These evaluations will result in an improvement plan for the PM system that will be taken into consideration and account once the process with development of the next cycle of performance management documentation gets underway. Performance Reviews The information obtained and assessed will now be reviewed with the aim of getting better results. According to the Guidelines2 (par 5.6): “Performance review is a process where the organisation, after measuring its own performance, assesses whether it is doing the right thing, doing it right and better, or not. There are number of ways to conduct performance reviews. The first is to look at whether the current level of performance is better than that of the previous year, using baseline indicators. This assessment is important because you can only know if your performance is improving by comparing with past performances. The second method is to look at the municipality‟s performance by comparison with other similar ones, other public sector agencies and/or private sector organisations. This is also important because you can only know that you are doing well relative to others similar to you. This may be done by way of a benchmarking exercise. The third method is to look at what the people of the municipality services think or what their perceptions are about the performance of the municipality across a range of services. Again this is crucial because you are only as good as the people you serve think you are. This may be done by way of customer surveys or other community feedback mechanisms. This review approach is consistent with the „best value‟ review framework of challenge, compare, consult and compete. The framework calls for the municipality to challenge the current level of performance, compare it to others, consult with customers or communities and find ways of competing with others to provide best value in service delivery.” Beyond looking at comparing oneself with other institutions one also needs to review the lines of accountability. These lines of accountabilities are provided by the Guidelines have been adopted by the Greater Tzaneen Municipality.
Performance Review: Lines of Accountability
Position Accountability
Supervisors
Review performance of individual or groups of employees reporting directly to them, depending on the type of employee performance management system that has been adopted
Line/ Functional Managers
Review performance of their respective areas regularly (monthly). The reviews should at least cover all the organisational priorities respective to these functions
Portfolio Committees / Study Groups
Manage performance of functions respective to their portfolios. They should at least review performance of organisational priorities that lie within their portfolio monthly, while maintaining a strategic role
Executive Management (Municipal Manager + his /
Review performance of the organisation monthly, prior to and more often than the Mayoral Committee:

238
Position Accountability
her Management Team) Review performance more often, such that they can intervene promptly on operational matters where poor performance or the risks thereof occur.
Review performance before reporting to politicians so that they can prepare, control the quality of performance reports submitted and ensure that adequate response strategies are proposed in cases of poor performance.
Review performance prior to review being conducted by standing, portfolio or executive Committees.
Executive Committee
Review performance of the administration – only at strategic level. It is proposed that review take place on a quarterly basis with the final quarterly review taking the form of an annual review. The content of the review should be confined to agreed/confirmed priority areas and objectives. The Municipal Manager should remain accountable for reporting on performance at this level.
Council
Review performance of the Municipal Council, its Committees and the administration on an annual basis, in the form of a tabled annual report at the end of the financial year
The Public
Review performance of the Municipality and public representatives (Councillors) in the period between elections. It is required legislatively that the public is involved in reviewing municipal performance at least annually.
A critical component within the performance review process lies with the verification of the outcomes of the review process. Internal auditing and the Performance Audit committee should play a critical role to ensure progress is monitored according to targets and that reports reflect the true status of progress. The performance of the Greater Tzaneen Municipality is monitored and reported on through its SDBIP on a quarterly basis. Performance Assessment Assessment is a process of measuring or quantifying the level of attainment or competence achieved with regards to a specified domain or targets developed. Therefore the municipality will embark on a structured process whereby progress with projects and targets are done on a quarterly basis and these assessment reports will be distributed to Council. These reports should feed the half yearly and annual assessment reports, where the greater Tzaneen Municipality can report on the attainment of the targets set for the municipality to achieve. During this process of assessment Scores (relevant to the rating scale proposed by DPLG of 1 to 5) are used to determine how well the municipality is performing in relation to the strategic theme, objective, programmes and projects. This process is referred to as the Institutional Assessment and will provide the platform whereby individual assessment will take place within the municipality.
Reporting On Performance
Reporting is the process whereby the data collected is collated and results provides the municipality with information and intelligence to make well informed decisions or take necessary action where identified. The Guidelines (par.5.8) advises under reporting:
“Reporting requires that we take the priorities of the organisation, its performance objectives, indicators, targets, measurements and analysis, and present this information in a simple and accessible format, relevant and useful to the specified target group, for review. Performance management in local government is a tool to ensure accountability of the: Municipality to Citizens and Communities Executive Committee to Council Administration to the Executive Committee or Executive Mayor Line/Functional/Sectoral Management to Executive Management and Portfolio and Standing Committees Employees to the organisation”

239
It is thus necessary that the reporting process follows the lines of accountability as is mentioned above. According to the Regulations quarterly performance reviews should be conducted. The review in January will coincide with the mid-year performance assessment as per section 72 of the MFMA. The said section determines that the accounting officer must by 25 January of each year assess the performance of the municipality and report to the Council on inter-alia its service delivery performance during the first half of the financial year and the service delivery targets and performance indicators as set out in the SDBIP. On an annual basis a comprehensive report on the performance of a municipality needs to be compiled and therefore an annual formal institutional assessment should be conducted and the outcome thereof reported to the Executive Committee. This report, after it has been audited by the Performance Audit Committee will be submitted to Council which will review the performance of the municipality. Organisational and Employee Performance A good PMS links the organisation‟s performance with the employee‟s performance and vice versa. The Guidelines (par.5.9) makes it clear:
“The performance of an organisation is integrally linked to that of staff. If employees do not perform an organisation will fail. It is therefore important to manage both at the same time. The relationship between organisational performance and employee performance starts from planning, implementation, monitoring and review.”
A process will be followed whereby the organisation‟s performance is determined and reported on after which the individual employees will be assessed according to the outcomes of the organisational performance and in addition to their individual indicators and targets specified within their performance agreements and individual performance plans. The Employee Performance Management Policy will guide and govern the implementation, management and integration of the Employee Performance Management System and the Organisation Performance Management System.
11. Greater Tzaneen Municipality IDP Housing Chapter
ANALYSIS
Background
The Greater Tzaneen Municipality (GTM) is situated within the central-eastern extents of the Limpopo Province, and is one
of five local municipalities located within the Mopani District Municipality (MDM) area. It borders the Greater Letaba Local
Municipality to the north, the Ba-Phalaborwa Local Municipality to the east, the Maruleng Local Municipality to the south-
east, and the Capricorn District Municipality‟s LMs of Lepele-Nkumpi, Polokwane and Molemole to the south, west and
north-west respectively (see Figure 1).
The Greater Tzaneen Municipality comprises a land area of approximately 3 240km² and extends from Haenertsburg in the
west, to Rubbervale in the east; and from south of Modjadjiskloof in the north, to Trichardtsdal in the south. The municipal
boundary forms an irregular T-shape, which presents a number of development challenges in respect of services provision
and distance to markets.

240
Population and Urbanisation Trends
The Municipality currently holds an estimated population of 349 085 people, which amounts to just less than 33% of the
District‟s total estimated population of 1 068 563 individuals. At 6,7%, the Municipality‟s contribution to the provincial
population is fairly small (Table 1). The 2007 Census (Community Survey) figures indicate that the Municipality experienced
a slight decline in its population between 2001 and 2007, at -1.2% per annum. However, the Community Survey is based on
a country-wide sample survey, and it is not certain whether much should be read into the reduced population figures
between 2001 and 2007.
Table 1: Estimated Population in Census 2001 vs. Community Survey 2007
POPULATION 2001
% of
District
% of
Province POPULATION 2007
% of
District
% of
Province
NP331: Greater Giyani 237,442 22.4 4.8 247,653 23.2 4.7
NP332: Greater Letaba 220,123 20.8 4.4 247,739 23.2 4.7
NP333: Greater Tzaneen 375,583 35.4 7.5 349,085 32.7 6.7
NP334: Ba-Phalaborwa 131,084 12.4 2.6 127,306 11.9 2.4
NP04A1: Maruleng 94,383 8.9 1.9 95,778 9.0 1.8
CBDMA4: Kruger Park 1,762 0.2 0.0 1,002 0.1 0.0
DC33: Mopani 1,060,377 100.0 21.2 1,068,563 100.0 20.4
Limpopo Province 4,996,247 5,238,265
LM Growth per annum (2001 - 2007) -1.2%
Source: STATS SA, Census 2001 and Community Survey 2007
According to the Department of Water Affairs and Forestry (DWAF) (2006), less than 18% of the LM‟s total population
currently reside within the proclaimed towns. Hence, more than 82% of the Municipality‟s total population reside within rural
villages and / or informal settlements. This situation poses huge challenges to the provision and eradication of housing and
infrastructure backlogs in a sustainable manner.
Consequently, housing is, and will become, an increasingly important issue for the Municipality to addresses. The current
and proposed housing projects, as indicated in the 2007/2011 Revised IDP, are incorporated and spatially referenced on the
relevant figures within this report.
Land Use and Spatial Characteristics
The Greater Tzaneen Municipality is predominantly rural in nature, with vast areas of land either util ised for extensive or
intensive agricultural activities (e.g. commercial timber, cash crops, tropical and citrus fruit production). Whilst the northern,
eastern and south-eastern extents of the Municipality are characterised by a gentle to even sloping topography, the north-
western extents are characterised by mountainous and generally inaccessible terrain.
The space-economy of the GTM is dominated by the five proclaimed towns which include Tzaneen Town(1), Nkowankowa(2) ,
Letsitele(3) , Lenyenye(4) and Haenertsburg(5) (see Figure 2). Business and industrial development is concentrated in
Tzaneen Town. In addition to the aforementioned towns, approximately 125 settlements of varying size are scattered
throughout the Greater Tzaneen municipal area, and falling under the traditional authority system. These are mainly

241
concentrated within the north-eastern and south-eastern extents of the Municipality, and generally coincide with the former
homeland areas of Gazankulu and Lebowa respectively (see Figure 2).
According to the Tzaneen SDF, the fact that settlements/towns were not allowed to develop naturally at nodes of economic
or social activity, resulted in almost all of the numerous small settlements having no, or a very limited economic base, which
renders the provision of social and physical infrastructure very costly and inefficient. Furthermore, given the dormitory nature
of these settlements, residents are forced to work elsewhere as migrant workers (primarily the metropolitan areas of
Gauteng Province).
Although the majority of the Municipality‟s rural settlements are only accessible via secondary gravel roads, the existing
transportation network does afford the main urban areas of the LM with good local and regional accessibility. The main
access route is the east-west running R71 (Phalaborwa Corridor SDI) which connects Tzaneen to Polokwane in the west
(via Haenertsburg and Sion Stad / Moria); and to Phalaborwa in the east via Letsitele and Gravelotte (a major link between
Gauteng and the Kruger National Park). The R528 which by-passes the Magoebaskloof Pass functions as an alternative link
between Tzaneen and Haenertsburg.
Similar to the R71, the R36 plays a very important role, and serves to link Tzaneen with Modjadjiskloof, Soekmekaar,
Polokwane and Louis Trichardt (Makhado) along a north-south axis. To the south the R36 links Tzaneen with the R529,
passing the vast number of rural settlements which formed as part of the former Lebowa homeland. The R529 functions as
the main northeast-south linkage, linking the municipality with the Hoedspruit area and beyond in the south, and Giyani in
the northeast (see Figure 2).
In summary, the main “man-made” spatial characteristics exhibited by the Greater Tzaneen municipal area include:
A fragmented formal urban component comprising Tzaneen, Nkowankowa and Lenyenye, which have developed
along a major arterial route (the R36) and two service nodes (Haenertsburg and Letsitele) at opposite ends of the
municipal area; and
Two significant clusters of rural villages, one in the northern, and the other in the southern quadrant of the municipal
area. The southern quadrant boasts the largest concentration of rural settlements, with 69% of the municipal
population residing on 67% of all residential stands within the LM. The northern quadrant hosts 27% of the municipal
population on 26,5% of all residential stands within the LM.
Nodal Development Area Proposals
According to the 2002 Limpopo Spatial Rationale, as well as the Municipality‟s existing Spatial Development Framework
(SDF) (2008), several nodal development areas have been identified throughout the municipal area (see Figure 2 and 3).
More specifically the SDF groups these into a number of functional settlement clusters as discussed below.
I. Tzaneen Town Area
Tzaneen Town Provincial Growth Point (PGP)(1)

242
Business and industrial development is concentrated in Tzaneen Town. According to the SDF, residential, formal
business, industrial, infrastructural, social and economic development should be encouraged in Tzaneen Town
through infill development see Figure 4).
In respect of bulk infrastructure, the insufficient water and electricity supply presents a serious threat to new
development(s).
II. Southern Settlement Area
Nkowankowa / Lenyenye District Growth Point (DGP)(2)(4)
The Nkowankowa / Lenyenye development area includes the settlement areas of Nkowankowa Town, Dan, Mokgolobotho, Mohlaba Headkraal, Petanenge, Lenyenye Town, Sasekani, Mohlaba and Moime (see Figure 5). Both Nkowankowa Town and Lenyenye Town feature Central Business Districts (CBDs). More specifically, Nkowankowa (see Figure 5a) is the largest proclaimed town within the municipal area, with the highest number of stands (5250). Contrastingly, Lenyenye (Figure 5b) is the smallest of the three major proclaimed town with 2519 stands (Tzaneen SDF).
According to the SDF this area should become the primary development area which attracts people from the
southern extents of the LM and beyond. Consequently, the first priority is to provide for, and encourage residential
and economic development. In attempting to facilitate urban consolidation, development should gravitate in a
south-westerly and north-easterly direction from the Nkowankowa and Lenyenye areas respectively.
In respect of bulk infrastructure, the water quota for Nkowankowa has reached full capacity and consumption
already exceeds the allocation. These constraints are having a detrimental impact on the development and
servicing of a number of Nkowankowa‟s extensions such as the Dan townships, Nkowankowa D
(Mbambamencisi), Nkomanini and Mokgolobotho. Furthermore, the water purification plant needs upgrading and
additional storage facilities are required. The Lenyenye plant also requires upgrading and capacity problems are
foreseen.
Apart from water related constraints, areas supplied by Eskom such as Nkowankowa, the Dan townships,
Mbambamencisi, Nkomanini and Mokgolobotho has insufficient capacity for new development(s).
Letsitele Municipal Growth Point (MGP)(3)
The Letsitele development area is situated to the east of Nkowankowa Town, and forms part of the larger
Nkowankowa / Lenyenye development area (see Figures 5 and 5a). The development area includes the
settlements of Letsitele and Mariveni. The Letsitele CBD is also well developed, and functions as a retail service
node to approximately 38 000 people who are mainly resident in the surrounding rural villages. A number of
service industries also occur in the centre of the town. In spite of featuring a relatively well developed CBD,
Letsitele is the smallest of the proclaimed towns with only 123 residential stands.
In respect of bulk infrastructure, the insufficient water and electricity supply presents a serious threat to new
development(s). Although Letsitele‟s septic tanks and French Drains are not without their problems, no major

243
capital expenditure or upgrading is required (except where environmentally sensitive areas are being affected) to
cope with the existing demand. However, new developments cannot be allowed on these old systems, and new
plants should be planned and constructed.
Burgersdorp Municipal Growth Point (MGP)(6)
The Burgersdorp development area lays to the southeast of Lenyenye Town, and forms part of the larger
Nkowankowa / Lenyenye development area (see Figure 5).
According to the SDF this area should be seen as a “second priority” area for residential, infrastructural, social and
economic development. In an attempt to prevent indiscriminate development, the SDF proposes that all new
residential and economic development should gravitate in a north-westerly direction towards the existing
settlements forming part of the Lenyenye development area.
The lower order settlements in the southern parts of the municipality include:
Mogoboya / Khujwana Population Concentration Point (PCP)(9)
Mogapeng Local Service Point (LSP)(11)
Rhulani / Senakwe Village Service Point (VSP)(14)
Mafarana Village Service Point (VSP)(15)
From Figure 5 it is evident that all these villages are located at the periphery of the Southern Settlement Area.
III. Northern Settlement Area
Moleketla / Mandlakazi Municipal Growth Point (MGP)(7)(8)
The Moleketla / Mandlakazi development area is situated to the northeast of Tzaneen Town, and includes the
settlements of Moleketla, Mopye, Motupa, Jokong, Thako, Moruji, Sethone, Relela, Bokuta, Fobeni, Lerejene,
Thapane, Mapitlula, Marinoni, Kobjana, Mandlakazi, Mbekwana, Nwamitwa, Fofoza, Lwandlamuni, Babanana and
Rwanda. According to the SDF this area should be seen as a “second priority” area for residential, infrastructural,
social and economic development. (see Figures 6 and 6a).
More specifically, the SDF proposes that all new residential and economic development should first and foremost
be accommodated via infill development on vacant parcels of land in, and around, the Moleketla and Mandlakazi
settlements.
The remaining settlements in the Northern Settlement Area are considered to be lower order, and comprise the
following clusters (as reflected on Figure 6):
Runnymede Population Concentration Point (PCP)(10)

244
GaMokgwathi / Miragoma Local Service Point (LSP)(12)
KaXihoko Local Service Point (LSP)(13)
Nkamboko Village Service Point (VSP)(16)
Senopela / Senakwe Village Service Point (VSP)(17)
IV. Haenertsburg Town Area
Haenertsburg Municipal Growth Point (MGP)(5)
The Haenertsburg development area is situated just to the southeast of the Ebenezerdam, at the junction of the
R71 and R528 leading to Tzaneen Town and Polokwane respectively (see Figure 3). The development area
consists of the small formal town of Haenertsburg and a number of agricultural holdings. It currently serves as a
service node to the surrounding rural area.
According to the SDF this area should be seen as a “third priority” area for residential, infrastructural, social and
economic development. The town does however boast tourism potential, and the surrounding grasslands should
be protected due to their ecological importance.
In respect of bulk infrastructure, the water and electricity supply presents a serious threat to new development(s).
Furthermore, new developments cannot be allowed on the old septic and French Drain systems – new plants need
to be planned and constructed.
Conclusive Summary: Purpose of the Primary Nodal Development Areas
According to the principles of the Tzaneen SDF, the Tzaneen(1), Nkowankowa/Lenyenye(2&4), Letsitele(3), Haenertsburg(5),
Burgersdorp(6), and Moleketla / Mandlakazi(7&8) growth points (see Figures 2 and 3) have been selected by the Municipality
as the primary nodal development areas within which to concentrate future growth and development. As such, these
areas will be the focus areas for the provision of bulk services and community facilities, in an attempt to attract business and
residential activities to these areas – i.e. consolidating the urban form. Any development outside of these will not be
allowed under normal circumstances, but may in very exceptional circumstances be considered.
Furthermore, the SDF provides the following guidelines in respect of residential development:
Residential development in PCPs should be limited to natural population growth rate;
Residential development in LSP and VSA should be discouraged;
Creation of agricultural stands in PCPs and LSPs to be considered on merit; and
Formalization of informal settlements will be directed towards, and priority be given to areas situated directly
adjacent to proclaimed towns.
It is envisaged that, in the long-term, the identified growth points have the potential to grow into one large city / metropolitan
area. Hence, according to the SDF, it is of paramount importance that land located within, and between the growth points,

245
and which is suitable for housing development purposes, be utilized first and foremost before allowing un-coordinated
development to take place in any other areas.
Critical Housing Related Issues
The following matters were highlighted by the Municipality as being the major housing related problems/concerns within the
municipality:
The “Housing Voice” within the municipality currently sits within the Department of Planning and Economic
Development as the Head of Division: Land, Property and Housing, but it requires technical, financial and
administrative support staff in order to properly perform the housing function.
The Tzaneen municipality will be the second in line in Limpopo Province (after Polokwane) to be evaluated and
granted accreditation status. In order to be successful in this regard, the municipality will have to acquire the
necessary housing related human resources.
The lack of well-located, developable land for housing in line with the priority areas identified in the municipal SDF.
Most of the land which is well-located and well-suited for housing purposes is not owned by the local authority. This
has the implication that land for development purposes must either be released by a State Department, traditional
authority, or purchased from private landowners.
The Limpopo Provincial Department has decided that they will support contractors without the Municipality‟s
approval, which is leading to a substandard product and unsatisfied communities.
Waiting lists are not in accordance to the National Criteria and the Housing Subsidy System (HSS) Software does
not make provision for registering low, middle and high income housing demand and/or need for rental stock. The
municipality wishes to expand the current waiting list to also capture rental and “Gap” market demand.
The constitutional change in 1994 brought about a process whereby households within the higher income groups
relocated to Tzaneen, Nkowankowa, Lenyenye and urban areas outside of the municipal area, whilst low-income
households informally settled on the fringes of Nkowankowa and Lenyenye next to job opportunities.
Only 12% of all households within the municipality have permanent title to their houses, and the advantages
commensurate with tenure.
A characteristic of the current residential development is that it is low density; the average density being 5 stands
per ha. This is conducive to urban sprawl.

246
Sustainable development is hampered by the scattered and unplanned establishment of business and residential
activities, since the allocation of land is mainly done by Traditional Authorities.
The predominantly rural nature of the GTM poses a problem in balancing backlogs versus spatial growth patterns in
accordance with the SDF Objectives through the provision of low cost housing.
Insufficient bulk water and electricity supply presents a serious threat to new development(s), especially in
the SDF primary focus areas of Tzaneen(1), Nkowankowa/Lenyenye(2), Burgersdorp(6), Letsitele(3),
Haenertsburg(5), and Moleketla / Mandlakazi(7&8).
The sustainable provision of bulk services and community facilities are hampered by the dispersed nature of the
large number of small settlements, hardly any of which generate a sufficient threshold value to justify the provision of
these.
The road network is severely neglected. The poor state of primary and secondary roads is having a detrimental
effect on the distribution of goods and services.
Estimated Housing Backlog
According to the 2007/2011 Final IDP Review of the Tzaneen municipality, the current housing need is estimated at
approximately 60 000 units. The specific origin of this very large backlog is not noted within the IDP itself.
However, during the interviews with the municipality, the information as reflected in Table 2 below was provided as part of
the questionnaire.
Table 2: Tzaneen Housing Demand Estimate
Housing Typology Number of Units
Informal 20 000
Backyard 5 000
Traditional/Rural 14 045
Farm Dwellings 500
Sub Total 35 045
Bonded (Gap, Middle and High) 5 000
Total 40 045
According to this information the housing backlog currently stands at about 40 045 units of which 35 045 units relate to the
subsidised market, and 5000 units to bonded housing.

247
The informal and backyard backlog as reflected in Table 2 is predominantly concentrated in the northern parts of the
Southern Settlement Area (see Figure 2) around Nkowankowa and Lenyenye, with an estimated 100 informal units also
located in Tzaneen Town.
As far as the traditional/rural backlog is concerned, Table 3 below illustrates the number of rural RDP Units built per ward
since 2006, as well as the current backlog for rural RDP housing per ward as recorded on the Municipal Housing Waiting
List. (Figure 2 illustrates the spatial distribution of the respective wards for ease of reference).
According to this information the total number of rural units allocated/built since 2006 totals about 9024 units, while
the total rural RDP backlog according to the waiting list currently stands at about 14 045 units.

248
W 21 W 17 W 24 W 32 W 29 W 25 W 18 W 9 W 6 W 11 W 20 W 34 W 22 W 2 W 12 W 27 W 26 W 30 W 7 W 1 W 3 W 10 W 33 W 8 W 4 W 31 W 5 W 28 W 23 W 13 W 16 W 19 W 14 W 15
Total Units Allocated 763 509 449 424 418 401 375 357 354 335 320 312 309 307 303 290 280 274 270 220 220 220 215 194 191 179 175 158 78 58 52 14 0 0
Backlog Waiting List 801 831 757 374 488 516 551 344 590 244 107 107 608 1154 169 247 597 292 475 669 637 403 184 187 518 21 76 413 133 767 255 477 53 0
0
200
400
600
800
1000
1200
No
of U
nits
TZANEEN LOCAL MUNICIPALITY: RDP HOUSING UNITS PER WARD, 2006 - 2008
Total units allocated = 9024
Backlog Waiting List = 14045
TABLE 3:

249
In terms of current Council policy, the annual Rural Housing allocation is split among the wards that have received the
smallest number of housing units to date, in accordance with the graph illustrated in Table 2.
The spatial distribution of the farm dwelling demand as reflected in Table 2 is not known at present, while the demand for
bonded housing (all income categories) is mostly concentrated around Tzaneen, but also the four other proclaimed towns in
the municipal area.
The existing Multi Year Housing Plan for Limpopo Province indicated a subsidised backlog figure of approximately 16 714
units (refer to Table 4 below) compared to the figure of the Municipality (35 045 units), with significantly lower number of
informal dwellings (2742 units vs 20 000).
Table 4: Multi-Year Housing Plan: Housing Need for the Period 2008-2012
TYPE 2007 2008 2009 2010 2011 2012
TRADITIONAL 12710 12869 13012 13145 13268 13383
INFORMAL 2708 2742 2773 2801 2827 2852
BACKYARD 1089 1103 1115 1127 1137 1147
TOTAL 16507 16714 16900 17073 17232 17382
2007 -2008 2008 - 2009 2009 - 2010 2010 - 2011 2011 - 2012 2007 - 2012
% growth per annum 1.3 1.1 1.0 0.9 0.9 1.0
Source: Limpopo Province Multi-year Housing Plan 2012, August 2007, Africon and Themba Maluleka Consortium
In comparison to the figures provided by the Municipality‟s Waiting List (14 045 units) and the existing Multi Year Housing
Plan for Limpopo Province (16 714 units), the Community Survey (2007) figures for the area is significantly lower at 10 924
units (Table 5).
Table 5: Greater Tzaneen: Type of Dwelling, 2001 and 2007
Year
House or
brick
structure
Traditional
dwelling
Flat in
block of
flats
Town/
cluster/
semi-
detached
house
House/
flat/ room
in back
yard
Informal
dwelling/
shack in
back yard
NEED
SUBTOTAL
Room/
flat let not
in back
yard but
on shared
property
Caravan
or tent
Private
ship/ boat
Workers hostel
(bed/
room)/Other Total
2001 56,388 23,174 640 473 975 992 27,628 689 150 21 85,989
2007 76,882 8,157 0 678 124 1,161 10,924 140 0 25 1182 89,831
housing strategy: Land Identified and Projects Underway
The section below reflects on the various areas earmarked for housing projects within the Greater Tzaneen Municipal area
to help accommodate the estimated housing backlog of 40 045 units as reflected in Table 2.

250
Tzaneen Town Provincial Growth Point (PGP)(1)
i) Social Housing/Community Residential Units (CRU‟s)
In respect of housing, the transfer of Portion 292 and 293 of the farm Pusele 555-LT(A) (see Figure 7) from Dept of
Public Works is a priority in order to provide for social housing and Community Residential Units (CRU‟s) in the
hostels. At present the hostel located on Portion 293 has been upgraded, but the units have not been transferred to
Council yet. This makes the administration of the units very difficult, as residents do not have title deeds for the
units, which hampers the billing system and collection of rates and taxes in the area.
Remainder 6 of the farm Puselela 555-LT is also located in this precinct and is earmarked to accommodate Social
and RDP units. The land belongs to the municipality.
ii) Breaking New Ground (BNG)
An integrated human settlement (BNG) project is underway on Adams Farm (Tzaneen Ext. 78(B)). The township
establishment process for this town is underway and 957 erven will soon be proclaimed. This will be followed by
Tzaneen X70 which is Adams Phase 2 comprising 293 erven. Surveying and compilation of the General Plan for this
area is underway.
iii) Inclusionary Housing
Other areas identified to first and foremost accommodate existing backlogs and future residential growth (mostly
bonded housing) includes a number of portions (266, 57, 58, and 59) of the Farm Pusela 555-LT(C) to the west of the
CBD; the areas to the north(D) of the CBD along the roads leading to Deerpark and Gravelotte, and to the south-
west(E) of the CBD along the R36 to Modjadjiskloof and Agatha, and along the R528 to Haenertsburg.
As most of these developments will be private sector driven, it is envisaged that these three areas will be the main
focus for future Inclusionary Housing Programmes which not only cater for middle and high income bonded housing,
but also entry level (Gap Market).
iv) Extended Discount Benefit Scheme
There are several government owned rental units in the municipality which belong to various government
departments. However, the rental administration of some of these facilities is severely neglected, and lead to
overcrowding and unhealthy social conditions.
The transfer of these rental units to the municipality needs to be speeded up in order for Council to be able to
possibly set up a Housing Utility which will then take over the administration of the units.

251
Rural Areas (General)
i) Rural Subsidies and Peoples Housing Process
These subsidies are distributed amongst the wards in accordance with the criteria as set out in section 1.4 of this
document. For the 2008/09 financial year the 200 Rural allocation will be equally divided between Wards 13 and 16
(100 each), and the 100 PHP units are allocated to Ward 5 (see Figure 2).
ii) Agri-Villages
The establishment of agri-villages to accommodate the farm dwellers (± 500) can be either done around
Haenertsburg, Letsitele and Tzaneen due to the availability of infrastructure, or it could be combined with successful
Land Restitution projects in the municipal area. A political directive should be provided in this regard.
Southern Settlement Area
Nkowankowa / Lenyenye District Growth Point (DGP)(2)(4)
In respect of housing, the formalization of informal settlements, and the prevention of urban sprawl is a priority in this area.
i) Project Linked Subsidies (RDP) and Social Housing
Areas identified in the SDF to accommodate existing backlogs and future residential and economic growth includes
(see Figures 8 and 9):
A portion of Mohlaba Location 567 LT (202ha)(H).
A portion of Ledzee 559 LT (398ha)(I).
A portion of Mohlaba‟s Location 567 LT (443ha)(J).
The Dan Township which is already surveyed, and which comprises about 970 residential erven of which 540
are for RDP housing, and several stands earmarked for Res 4 purposes and which could thus serve for Social
Housing.
ii) Hostels Upgrading
There is also a need to upgrade some hostels related to educational facilities in the municipal area, and specifically
at the Tivumbeni College and Bankuna High School in the Nkowankowa cluster to the south of Tzaneen Town.
Letsitele Municipal Growth Point (MGP)(3)
i) Project Linked Subsidies
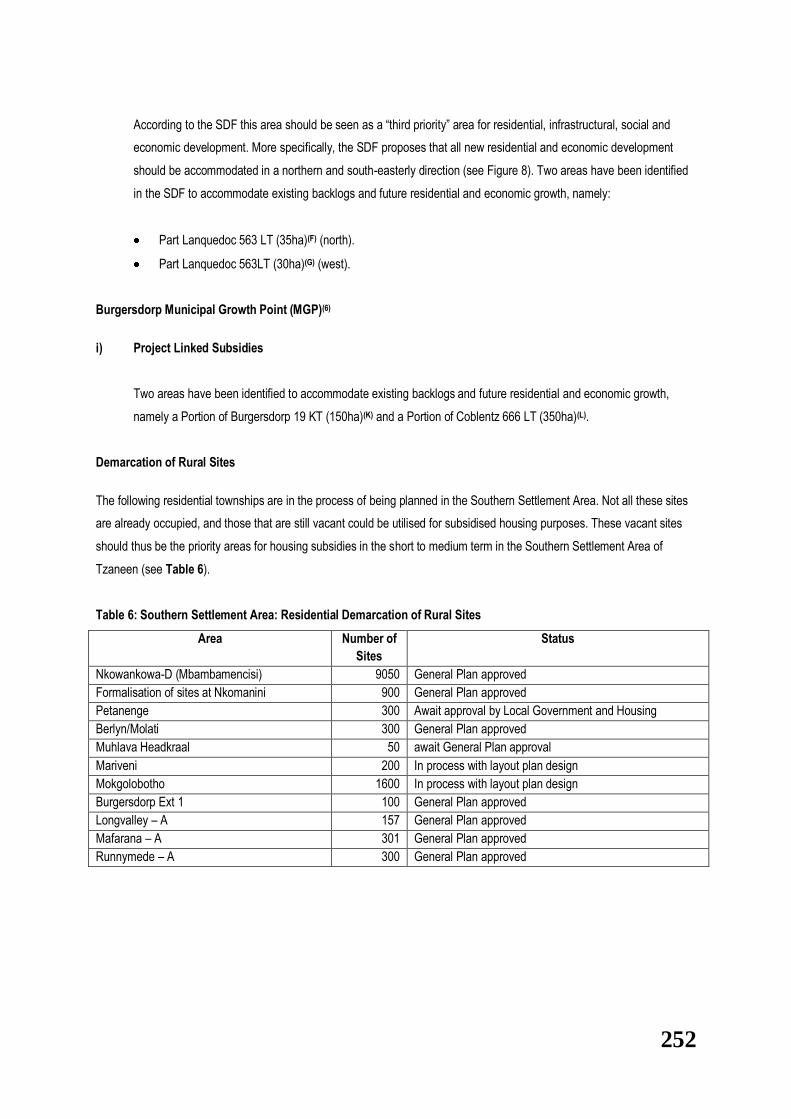
252
According to the SDF this area should be seen as a “third priority” area for residential, infrastructural, social and
economic development. More specifically, the SDF proposes that all new residential and economic development
should be accommodated in a northern and south-easterly direction (see Figure 8). Two areas have been identified
in the SDF to accommodate existing backlogs and future residential and economic growth, namely:
Part Lanquedoc 563 LT (35ha)(F) (north).
Part Lanquedoc 563LT (30ha)(G) (west).
Burgersdorp Municipal Growth Point (MGP)(6)
i) Project Linked Subsidies
Two areas have been identified to accommodate existing backlogs and future residential and economic growth,
namely a Portion of Burgersdorp 19 KT (150ha)(K) and a Portion of Coblentz 666 LT (350ha)(L).
Demarcation of Rural Sites
The following residential townships are in the process of being planned in the Southern Settlement Area. Not all these sites
are already occupied, and those that are still vacant could be utilised for subsidised housing purposes. These vacant sites
should thus be the priority areas for housing subsidies in the short to medium term in the Southern Settlement Area of
Tzaneen (see Table 6).
Table 6: Southern Settlement Area: Residential Demarcation of Rural Sites
Area Number of
Sites
Status
Nkowankowa-D (Mbambamencisi) 9050 General Plan approved
Formalisation of sites at Nkomanini 900 General Plan approved
Petanenge 300 Await approval by Local Government and Housing
Berlyn/Molati 300 General Plan approved
Muhlava Headkraal 50 await General Plan approval
Mariveni 200 In process with layout plan design
Mokgolobotho 1600 In process with layout plan design
Burgersdorp Ext 1 100 General Plan approved
Longvalley – A 157 General Plan approved
Mafarana – A 301 General Plan approved
Runnymede – A 300 General Plan approved
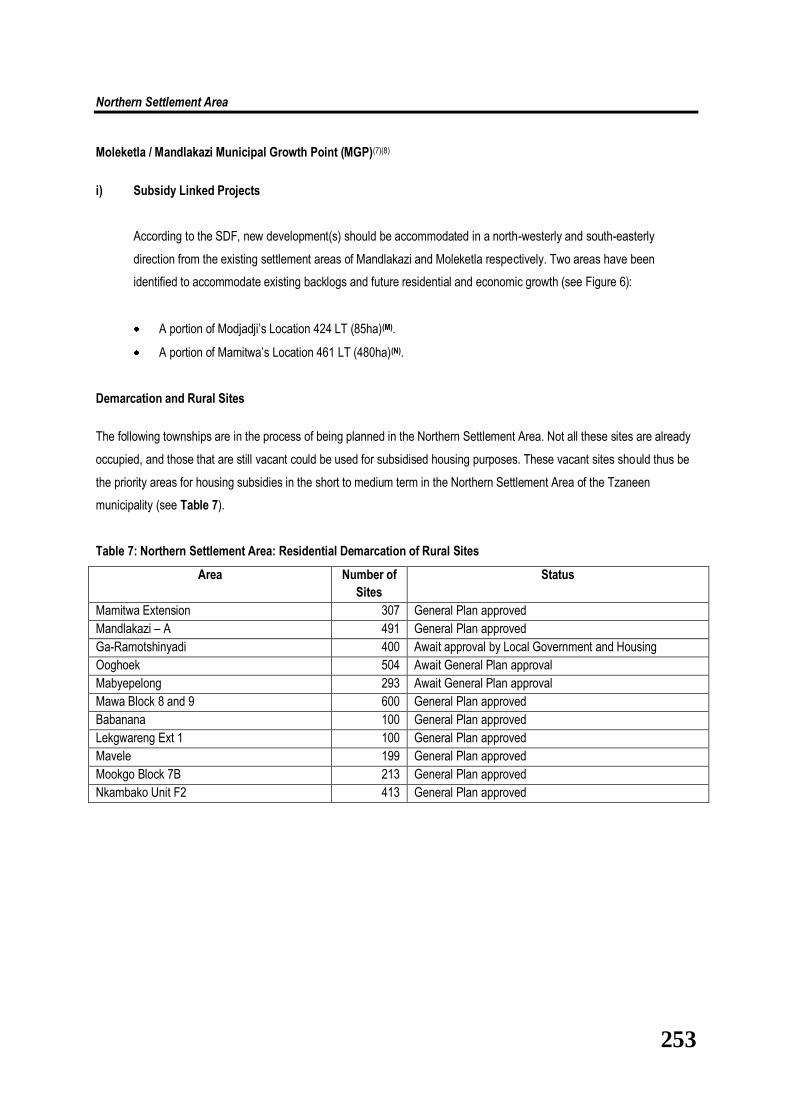
253
Northern Settlement Area
Moleketla / Mandlakazi Municipal Growth Point (MGP)(7)(8)
i) Subsidy Linked Projects
According to the SDF, new development(s) should be accommodated in a north-westerly and south-easterly
direction from the existing settlement areas of Mandlakazi and Moleketla respectively. Two areas have been
identified to accommodate existing backlogs and future residential and economic growth (see Figure 6):
A portion of Modjadji‟s Location 424 LT (85ha)(M).
A portion of Mamitwa‟s Location 461 LT (480ha)(N).
Demarcation and Rural Sites
The following townships are in the process of being planned in the Northern Settlement Area. Not all these sites are already
occupied, and those that are still vacant could be used for subsidised housing purposes. These vacant sites should thus be
the priority areas for housing subsidies in the short to medium term in the Northern Settlement Area of the Tzaneen
municipality (see Table 7).
Table 7: Northern Settlement Area: Residential Demarcation of Rural Sites
Area Number of
Sites
Status
Mamitwa Extension 307 General Plan approved
Mandlakazi – A 491 General Plan approved
Ga-Ramotshinyadi 400 Await approval by Local Government and Housing
Ooghoek 504 Await General Plan approval
Mabyepelong 293 Await General Plan approval
Mawa Block 8 and 9 600 General Plan approved
Babanana 100 General Plan approved
Lekgwareng Ext 1 100 General Plan approved
Mavele 199 General Plan approved
Mookgo Block 7B 213 General Plan approved
Nkambako Unit F2 413 General Plan approved

254
Haenertsburg Municipal Growth Point (MGP)(5)
i) Subsidy Linked Projects
According to the SDF, all new residential and economic development(s) should take place to the north (O), west(P) and
south-west(Q) of the existing town centre (see Figure 10).
Table 8 provides a summary of the various housing programmes proposed in the Tzaneen municipal area, and the
location of these. These represent the proposed Housing Strategy for the municipality.
CONCLUDING REMARKS
Apart from some prevalent institutional problems, the Greater Tzaneen Local Municipality does have a clear and well-
directed vision as to how it will meet the existing and projected future housing demand in its area of jurisdiction in a
sustainable manner. However, the spatial locations of the current and proposed housing projects are generally not
conducive to consolidating the dispersed spatial structure of the LM. Residential development should preferably be
concentrated within the primary focus areas(1-8) identified by the SDF, and in areas currently demarcated for rural erven.
Furthermore, since the allocation of land is mainly done by traditional authorities, there is an absence of a clear hierarchy of
settlements regarding Rural Housing with differentiated levels of services. Consequently, the Department of Housing has a
critical role to play in helping the Municipality to establish a sustainable and functional settlement hierarchy within the LM, by
providing / supporting housing developments / projects identified by the IDP which falls within areas identified as suitable for
housing by the SDF of the municipality.

255
Table 8: Tzaneen Housing Strategy Summary
Housing
Programme
Functional
Area B
on
ded
Ho
usi
ng
(In
clu
sio
nar
y)
BN
G H
ou
sin
g
Dis
cou
nt
Ben
efit
Sch
eme
So
cial
Ho
usi
ng
Co
mm
un
ity
Res
iden
tial
Un
its
Ho
stel
s U
pg
rad
ing
Pro
ject
Lin
ked
Su
bsi
die
s
(RD
P)
Ru
ral
Su
bsi
die
s
Peo
ple
s H
ou
sin
g P
roce
ss
Ag
ri-V
illag
e
Tzaneen Town
Portion 292 / 293 / RE6
Puselela 555 LT
X X
Adams Farm X
Various Areas X
Areas C, D, E (Figure 7) X
* Agri-Village
Southern Settlement Area
Tivumbeni College X
Bankuna High School X
Rural Townships (see
Table 6)
X X X
Dan Township (X1 and 2) X X X
Rural Areas (Various
Wards)
X X
* Agri-village X
Northern Settlement Area
Rural Townships (see
Table 7)
X X X
Rural Areas (Various
Wards)
X X
* Agri-village X
* Site to be determined – maybe on Land Claims areas, or at Tzaneen, Letsitele and Haenertsburg

256
6. PHASE 5- APPROVAL
The 2009/2010 Reviewed Integrated Development Plan was adopted by Council on the 29 th May 2009.