graphs made simple using sg procedures and gtl - iasct made simple using sg... · • programmer...
TRANSCRIPT

SCIENCE SIMPLIFIED. STRATEGY PERFECTED.
Graphs made simple using SG procedures and GTLTaking help from ODS Graphics Infrastructure
- Hari Vardhan J
YOU CAN LEARN A LOT BY JUST LOOKING

SCIENCE SIMPLIFIED. STRATEGY PERFECTED.
Clinical Trial Graphs:By their very nature, clinical trials generate a large amount of information, and a concise visual presentation of the results is essential.
Information about the patient population, drug dosages, clinical responses, and adverse events must be clear.
Clinical laboratory results need to be presented within the context of acceptable limits, and subtle changes over time must be highlighted.
What is a good graphic?
Why Do we need Data Visualization?
SAS/GRAPH

SCIENCE SIMPLIFIED. STRATEGY PERFECTED.
Presentation Topics Overview Abstract Introduction ODS Graphics Infrastructure SG procedures Examples Differences from Traditional SAS/GRAPH procedures GTL Conclusions References and Acknowledgement Q & A
SCIENCE SIMPLIFIED. STRATEGY PERFECTED.
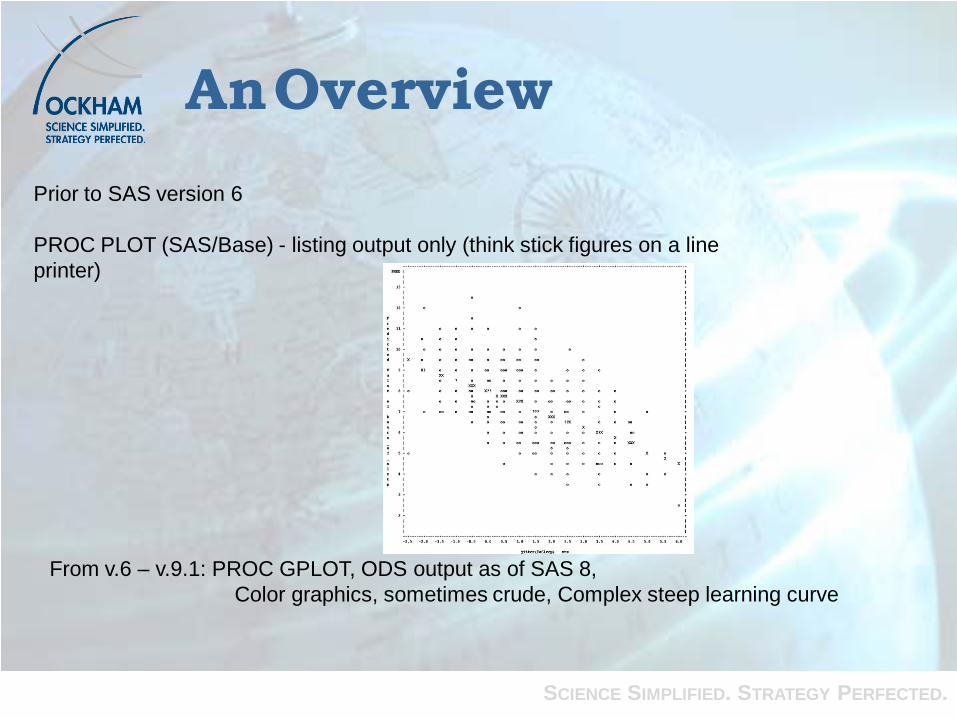
Prior to SAS version 6
PROC PLOT (SAS/Base) - listing output only (think stick figures on a line printer)
AnOverview
From v.6 – v.9.1: PROC GPLOT, ODS output as of SAS 8, Color graphics, sometimes crude, Complex steep learning curve
SCIENCE SIMPLIFIED. STRATEGY PERFECTED.
In SAS 9.2 SAS/GRAPH introduces the first installment of a new family of procedures designed to create statistical graphics to assist in general-purpose data analysis. These procedures enable you to create graphics ranging from simple scatter plots to paneled displays with classification, all with a syntax that is clear and concise.
The names of the new procedures all begin with “SG” to differentiate them from the “traditional” SAS/GRAPH procedures. These new procedures include the following
What’s New?
To create a graph that is beyond the capabilities of these procedures, you can define a graph template by using the Graph Template Language (GTL) and use PROC SGRENDER to create the graph.
•SGPLOT: To create individual plots and charts with overlay capabilities
•SGPANEL: To create paneled plots and charts driven by classification variables
•SGSCATTER: To create comparative scatter plot panels, with the capability to overlay fits and confidences

SCIENCE SIMPLIFIED. STRATEGY PERFECTED.
With ODS Graphics,• Programmer can use Base SAS procedures and new statistical
graphics (SG) procedures (in particular, SGPLOT and SGPANEL, SGSCATTER) in SAS/GRAPH to produce simple plots and bar charts.
• The SAS™ Statistical Graphics (SG) procedures: SGPLOT, SGPANEL, SGSCATTER, and SGRENDER are exciting additions in 9.2 and later that give easy access to some of the power of the Graphics Template Language (GTL) in much the same way that macros can give a beginner access to advanced Base SAS programming.
• These procedures are designed to create stand-alone displaysthat complement the more specialized graphs produced by the statistical procedures that use the ODS Statistical Graphicsinfrastructure
Introduction

SCIENCE SIMPLIFIED. STRATEGY PERFECTED.
ODS Statistical Graphics infrastructure
ODS Graphics always means modern and easy analytical graphs in SAS. The system has different components, each suitable for a different audience, as follows:
Create graphs automatically from SAS procedures. No additional knowledge of graph coding is required.
Create graphs using ODS Graphics Designer, an interactive application. Create graphs using Statistical Graphics (SG) Procedures. Create graphs using the Graph Template Language (GTL).
The SG procedures and GTL are part of the ODS Graphics System for creation of modern analytical graphs. GTL forms the basis of all graphs rendered using the ODS Graphics system.
Create graphs automatically from SAS procedures:ods graphics on;
proc freq data=demo; tables race/plots=freqplot; run;
ods graphics off;
SCIENCE SIMPLIFIED. STRATEGY PERFECTED.
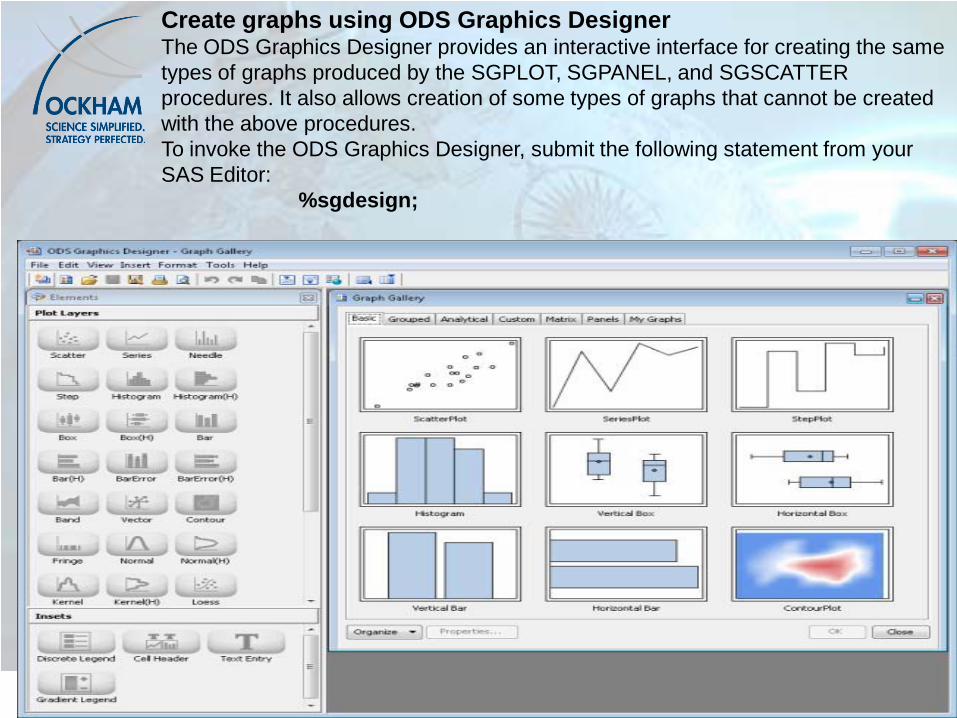
Create graphs using ODS Graphics DesignerThe ODS Graphics Designer provides an interactive interface for creating the same types of graphs produced by the SGPLOT, SGPANEL, and SGSCATTER procedures. It also allows creation of some types of graphs that cannot be created with the above procedures. To invoke the ODS Graphics Designer, submit the following statement from your SAS Editor:
%sgdesign;

SCIENCE SIMPLIFIED. STRATEGY PERFECTED.
SG ProceduresCreate graphs using Statistical Graphics (SG) Procedures. SG Procedures
The SGPLOT procedure creates single-cell plots and charts with overlay capabilities, e.g., scatter, series, step, band, needle, box blot, histogram, dot plots, bar charts, normal curve, loess, regression, etc.
The SGPANEL procedure creates paneled graphs driven by class variables; the plots contained within each panel are similar to the plots from the SGPLOT procedure.
The SGSCATTER procedure creates paneled scatter plots, with overlay fits and confidences.
The SGRENDER procedure creates customized plots by associating a user-defined template written in GTL with a dataset.

SCIENCE SIMPLIFIED. STRATEGY PERFECTED.
ADVANTAGES OF THESE PROCEDURESLESS CODING – AN ILLUSTRATION
Imagine you are having LAB data containing laboratory tests creatinine, platelet, red blood cell count, and white blood cell count were collected for analysis and you need to shows a highly significant relationship between laboratory test results at baseline and Post baseline at cycle 5 Using device-based graphicsin SAS 9.1.3, you could create a panel such as the one in Following Figure
In SAS 9.1.3, there are several steps involved in creating the panel in Figure :
1) Determine the appropriate styling for the fonts and plot primitives2) Generate each plot in the panel using PROC GPLOT3) Combine the plots into a panel using PROC GREPLAY
In SAS 9.2, you could create a panel like Figure with just three lines of code:
proc sgscatter data = labplot; plot creatinineC5*creatinine1 plateletc5*platelet1
red_blood_cellsc5*red_blood_cells1 white_blood_cellsc5*white_blood_cells1/reg; run;

SCIENCE SIMPLIFIED. STRATEGY PERFECTED.
SG PLOT
SG Plot Procedure is designed to create single-celled graphs. A wide variety of Plot and chart types are supported.There are four basic types of plots that you can create with the SGPLOT procedure:
•Basic plots –scatter, series, step, band, and needle plots
•Fit and confidence plots –loess, regression, and penalized B-spline curves, and ellipses
•Distribution plots –box plots, histograms, and normal and kernel density estimates
•Categorization plots –dot plots, bar charts(Simple and Stacked), and line charts
Hbar and Vbar –Produces horizontal and vertical bar charts.
Hbox and Vbox–Produces horizontal and vertical box plots.
Hline and Vline –Produces a plot with error bars and statistics (e.g. mean) connected by line.
Scatter–Produces a scatter plot.
Reg –Produces a scatter plot with a linear regression fit.
Series–Produces a plot where the datapoints are connected by a line.
Plot options in SGPLOT:
Inset –Inserts text into the plot.Keylegend –Formats the display of the legend.Refline –Adds a reference line to the plot.Xaxis and Yaxis –Controls axis scales, titles, ticks, etc.
SCIENCE SIMPLIFIED. STRATEGY PERFECTED.
Basic Scatterplot
proc sgplot data=demo;scatter x=weight y=height/group=sex;
run;
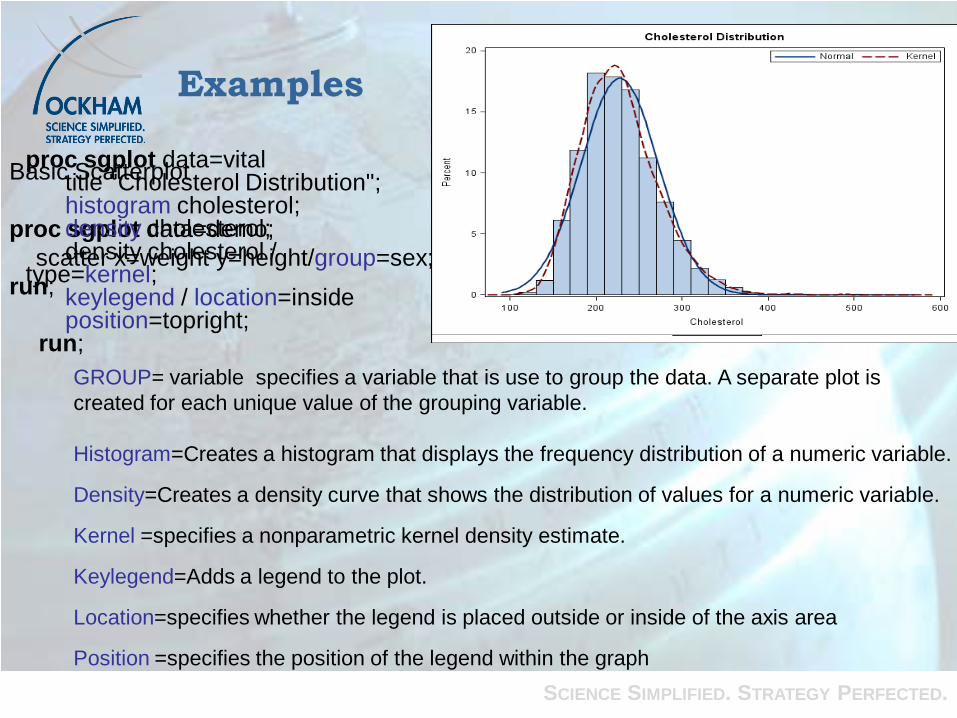
proc sgplot data=vitaltitle "Cholesterol Distribution";histogram cholesterol;density cholesterol;density cholesterol /
type=kernel;keylegend / location=inside position=topright;
run;
Examples
GROUP= variable specifies a variable that is use to group the data. A separate plot is created for each unique value of the grouping variable.
Histogram=Creates a histogram that displays the frequency distribution of a numeric variable.
Density=Creates a density curve that shows the distribution of values for a numeric variable.
Kernel =specifies a nonparametric kernel density estimate.
Keylegend=Adds a legend to the plot.
Location=specifies whether the legend is placed outside or inside of the axis area
Position =specifies the position of the legend within the graph
SCIENCE SIMPLIFIED. STRATEGY PERFECTED.
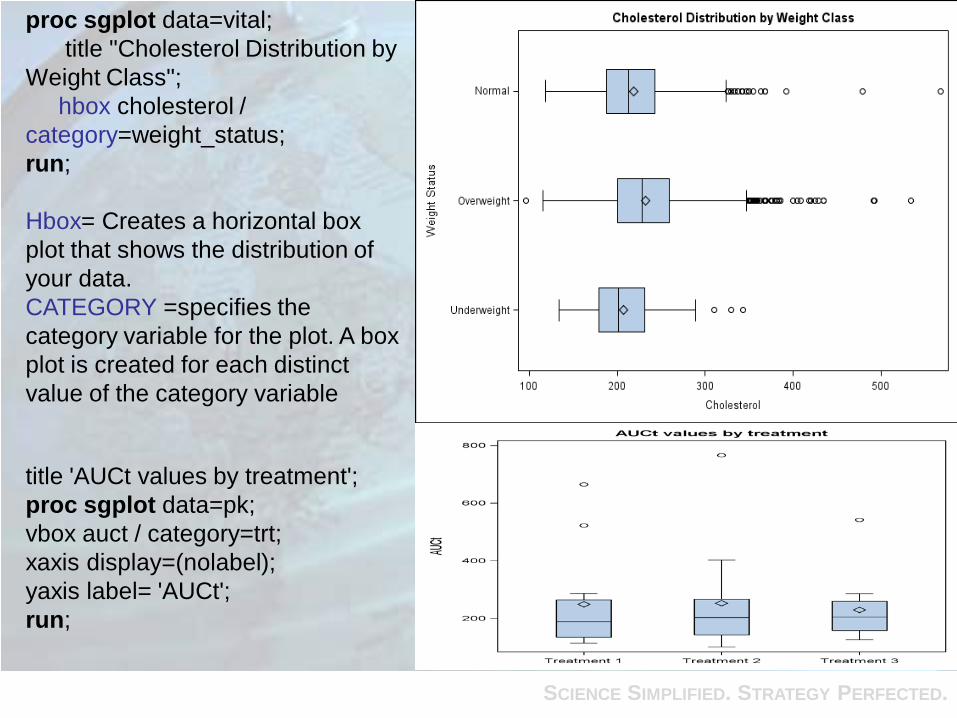
proc sgplot data=vital;title "Cholesterol Distribution by
Weight Class";hbox cholesterol /
category=weight_status;run;
Hbox= Creates a horizontal box plot that shows the distribution of your data. CATEGORY =specifies the category variable for the plot. A box plot is created for each distinct value of the category variable
title 'AUCt values by treatment';proc sgplot data=pk;vbox auct / category=trt;xaxis display=(nolabel);yaxis label= 'AUCt';run;

SCIENCE SIMPLIFIED. STRATEGY PERFECTED.
proc sgplot data=sashelp.iris;title "Iris Petal Dimensions";scatter x=petallength y=petalwidth;ellipse x=petallength y=petalwidth;keylegend / location=inside
position=bottomright;run;
Ellipse=Adds a confidence or prediction ellipse to another plot.
proc sgplot; data=demoreg x=height y=weight / CLM CLI;
run;
REG=Creates a fitted regression line or curve. CLM=creates confidence limits for the mean predicted values CLI=creates prediction limits for the individual predicted values

SCIENCE SIMPLIFIED. STRATEGY PERFECTED.
proc sgplotdata=tragfig.F_RPCFBFPITT;series x=visit1 y=mean / group=trtmarkers;
refline 'C5D01' / axis=x;keylegend / position=topright
across=1 location=inside;run;
Series=statement produces a grouped series plot with marker symbolsREFLINE= statement draws a reference line at C5D01 to indicate Cycle 5 day1 of treatment
SCIENCE SIMPLIFIED. STRATEGY PERFECTED.
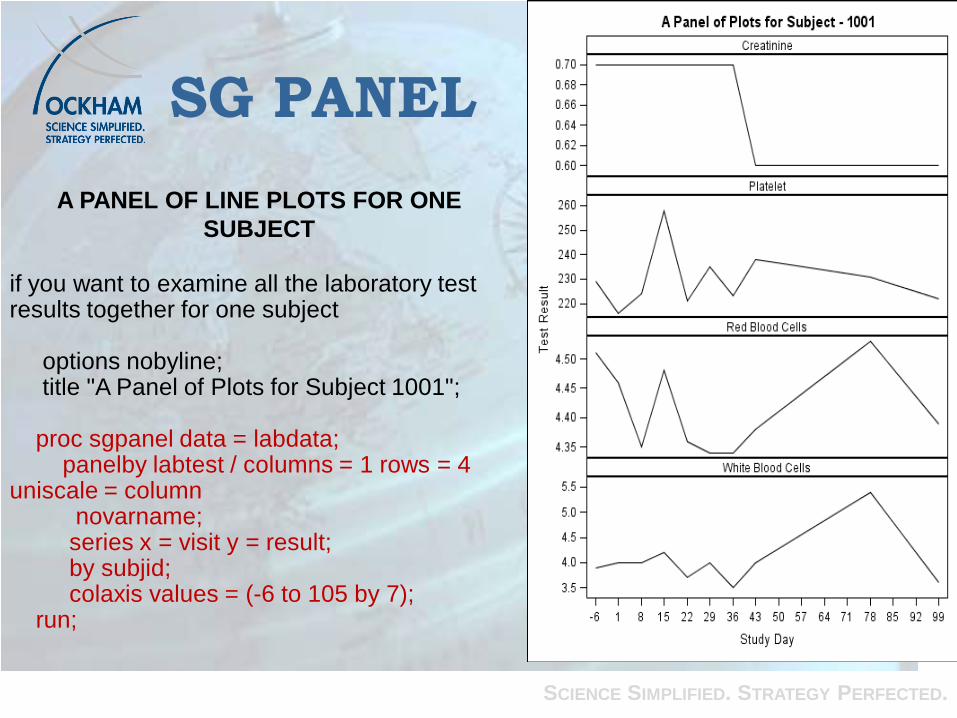
A PANEL OF LINE PLOTS FOR ONE SUBJECT
if you want to examine all the laboratory test results together for one subject
options nobyline; title "A Panel of Plots for Subject 1001";
proc sgpanel data = labdata; panelby labtest / columns = 1 rows = 4
uniscale = column novarname; series x = visit y = result; by subjid; colaxis values = (-6 to 105 by 7);
run;
SG PANEL

SCIENCE SIMPLIFIED. STRATEGY PERFECTED.
You can use the SGPANEL procedure to reduce clutter in a single-celled graph, which makes the data easier to compare and makes the graph more effective
What is Exactly a Panel?
The most basic is the cell(2). The cell is what has been traditionally called a graph such as created with PLOT(4), GPLOT or even SGPLOT.
The panel is the set of all cells that the procedure generates. Finally, the graph is one page of output. For example, when a panel is split across multiple pages, each page is a graph.
The SGPANEL procedure has a required PANELBY statement that is used to define the classifier variables for the panel. This statement must be specified before any plot, axis, or legend statement or else an error occurs.

SCIENCE SIMPLIFIED. STRATEGY PERFECTED.
proc sgplot data=adae; hbar aebodsys /group=trt
response=teae stat=sum; run;
proc sgpanel data=adae; panelby trt; hbar aebodsys / response=teae
stat=sum; run;
The SGPANEL and SGPLOT procedures contain the same statements except that there is a PANELBY statement in Proc SGPANEL and there are COLAXIS and ROWAXIS statements instead of XAXIS and YAXIS.

SCIENCE SIMPLIFIED. STRATEGY PERFECTED.
Layout= Panel title "Creatinine";
proc sgpanel data = lab1 ;panelby lbtest subjid / layout = panel
rows=3 columns=5 novarname;series x=visitnum y=lborresn;
where lbcat in("COAGULATION") and visitnum<60 and subjid in("101" "102" "103" "104" "105"); run;
PANEL – this has no limit to the number of categorical variables used and displays the values of each variable in each cell-plot

SCIENCE SIMPLIFIED. STRATEGY PERFECTED.
title "A Panel of Plots by Subject and Lab Test";
proc sgpanel data = lab1;panelby subjid lbtest / layout = lattice uniscale = column columns=5 rows=3 novarname;series x=visitnum y=lborresn;where lbcat in("COAGULATION")
and visitnum<60 and subjid in("101" "102" "103" "104" "105"); run;
LATTICE – this restricts the use of categorical variables to 2 and uses one in the row dimension and the other in the column dimension

SCIENCE SIMPLIFIED. STRATEGY PERFECTED.
Panel by Options:COLUMNS= N/ ROWS= NThese options control the number of columns and/or rows in the layout. You don’t have complete control with these options. The procedure will still make its own decisions about the layout if the settings don’t fit well into the page.
BORDER | NOBORDERThis option is pretty straightforward depending on the ODS style in use at the time. The typical styles (Analysis, Statistical, Listing, Journal, Journal2) all have borders by default. BORDER adds borders around each cell in the panel and NOBORDER removes them. Note that this is around each cell and not around the graph as a whole.
COLHEADERPOS= TOP | BOTTOM | BOTHROWHEADERPOS= RIGHT | LEFT | BOTHThese options, which (obviously) control the position of the column and row headings, can be used with the LATTICE layout. For the PANEL layout, the headings are always across the top. The default positions (TOP and RIGHT) are the most useful, because the axes can “interfere” with the BOTTOM and LEFT positions. BOTTOM and LEFT can be useful with small multiples if the axes are not displayed

SCIENCE SIMPLIFIED. STRATEGY PERFECTED.
NOVARNAMEThe NOVARNAME option is used in
almost every graph that we create, because it removes the variable name and the “=” symbol from the cell headings. This style provides clean heading labels by avoiding the redundant information. If there are two PANELBY variables that have the same levels, however, then the variable name may be necessary.
SPACING= NThis option controls the number of
pixels between the cells.

SCIENCE SIMPLIFIED. STRATEGY PERFECTED.
The SGSCATTER procedure is designed to create panels of scatter plots and scatter plot matrices. Although this procedure is capable of producing a single-celled scatter plot, that plot is best produced using the SGPLOT procedure, which has more features and appearance options.Unlike the large number statements in the SGPLOT and SGPANEL procedures, the
SGSCATTER functionality is contained within three statements:· The PLOT statement, which creates a panel of independent
scatter plots, and has options for fits and computed ellipses· The COMPARE statement, which creates a shared axis panel of
scatter plots, and has options for fits and computed ellipses· The MATRIX statement, which creates a scatter plot matrix,
and has options for computed ellipses and diagonal plots
Syntax:
PROC SGSCATTER < options>; COMPARE X= variable | (variable-1 ... variable-n)
Y= variable | (variable-1 ... variable-n)</options>;
MATRIX variable-1 variable-2 < ...variable-n > /options>; PLOT plot-request(s) </options>;
SG SCATTER

SCIENCE SIMPLIFIED. STRATEGY PERFECTED.
proc sgscatter data=heart (where=(Diastolic>120));
plot cholesterol*weight Diastolic*AgeCHDdiag / group=sex ellipse;run;
proc sgscatter data=tst.vital;compare y=vshr x=(vsdia vssys)/
reg=(cli clm) ;run;

SCIENCE SIMPLIFIED. STRATEGY PERFECTED.
proc sgscatter data=raw.vs; matrix vshr vsdia vssys /
ellipse=(type=predicted); run;
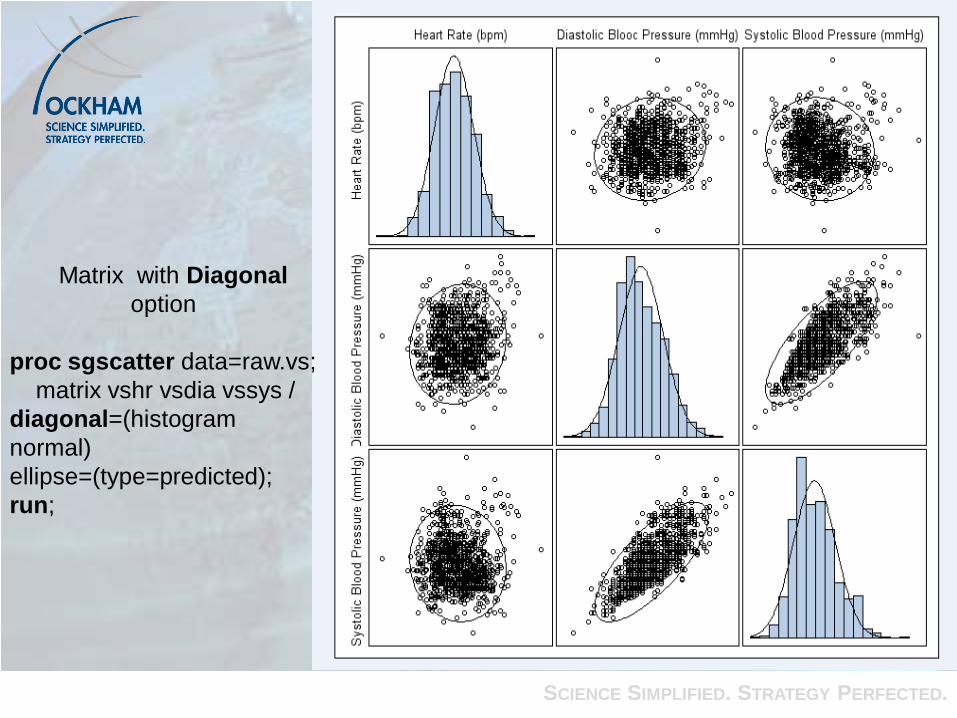
As we mentioned earlier, the MATRIX statement enables you to put plots in the diagonal to view the distribution of your matrix variables while viewing the pattern of your scatter points. You can overlay different combinations of histograms, normal curves, and kernel density estimates.
SCIENCE SIMPLIFIED. STRATEGY PERFECTED.
Matrix with Diagonal option
proc sgscatter data=raw.vs; matrix vshr vsdia vssys /
diagonal=(histogram normal) ellipse=(type=predicted); run;

SCIENCE SIMPLIFIED. STRATEGY PERFECTED.
DIFFERENCES FROM TRADITIONAL SAS/GRAPH PROCEDURES.Regardless of your level of proficiency with SAS, you can use ODS Graphics software to develop a wide variety of graphs ranging from simple plots to complex multi-cell layouts.
When using the SG procedures, please remember the following:
An ODS GRAPHICS statement is not required, but can be used to specify some options.
The GOPTIONS statement is not used.
Symbols and patterns are specified in the procedure, rather than with SYMBOL and PATTERN statements.
Titles and footnotes work as in "classic" SAS/GRAPH.
Produces graphs in standard image file formats such as PNG and JPEG and No catalog entries created
Graphs are viewed in standard viewers such as a web browser for HTML output or ODS document only
No GREPLAY procedure
The QUIT statement is not used as a step boundary.

SCIENCE SIMPLIFIED. STRATEGY PERFECTED.
Creating a graph using GTL is a two-step process:1. Use PROC TEMPLATE to define a STATGRAPH template with GTL syntax. Compile and
save this template. 2. Create the graph by running the SGRENDER procedure to associate the appropriate data
with the template.
GTL supports a structured syntax that provides a building-block approach to designing yourgraphs. The syntax elements of GTL fall into four main categories. These are:
Layouts: Overlay, OverlayEquated, Gridded, Lattice, DataLattice, DataPanel, and Region Plots: Scatter, Series, Step, Histogram, Density, BoxPlots, BarChars, Fit plots, and more More Plots: BlockPlot, Ellipse, LineParm, Reference and Drop Lines, HighLow, Bubble, Pie, etc Other: EntryTitle, EntryFootnote, Entry, DiscreteLegend, ContinuousLegend, and so on Features: Functions, conditionals, dynamics, and macro variables.
GTL

SCIENCE SIMPLIFIED. STRATEGY PERFECTED.
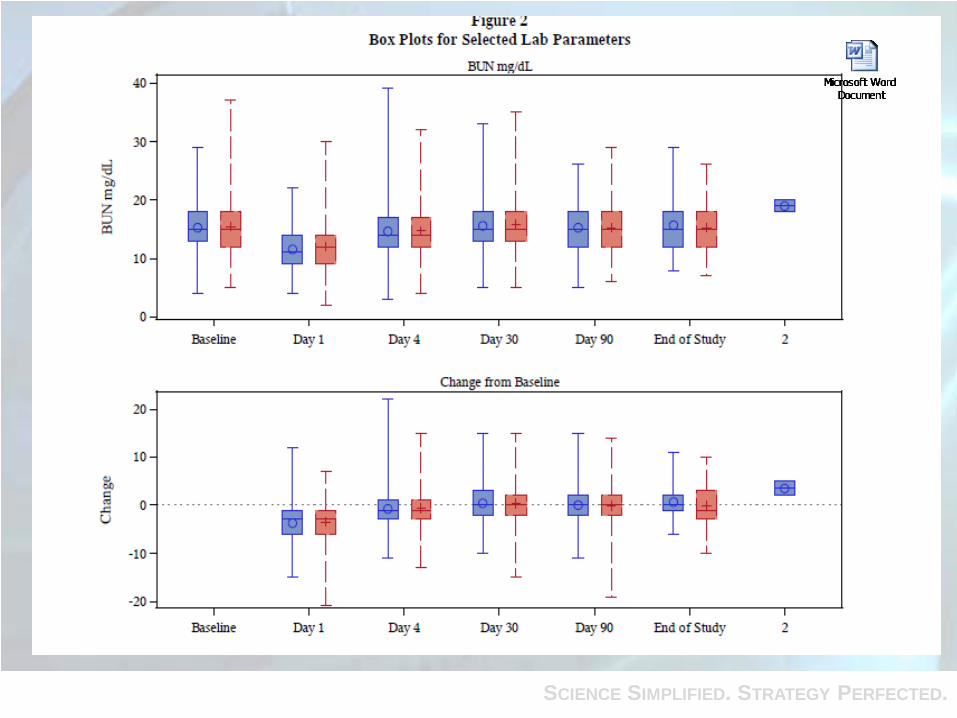
Lab parameters presented in Box plots: serum creatinine, creatinine clearance, BUN, venous lactate, serum electrolytes (Na+, HCO3, K+, CI-).
SCIENCE SIMPLIFIED. STRATEGY PERFECTED.

1 2 3
4
1- Define Block 2- Graph Block3- Layout Block 4- Graph Content
5
5- Cell Header 6- Titles7- Reference Line 8- Legend
6
7
8
9- Dynamic (analogous to macro)
9

SCIENCE SIMPLIFIED. STRATEGY PERFECTED.
Not to be Worried about the code
To avoid writing GTL codes from scratch, Two practical approaches are combine the SG procedures with GTL for a desired graph:
1. Use SG procedure to sketch out the plot, output the underlying GTL syntax into a graph template using TMPLOUT
2. Customize the graph template to the desired layout;
3. Use Proc SGRENDER to associate the template with a dataset for graph creation.
Other approach is:The ODS Graphics Designer generates
SAS/GRAPH code that can be saved and reused. The generated code is written using Graphics Template Language (GTL) and PROC SGRENDER, and is more complex than the SG procedure code shown above. However, generating the GTL code and reviewing it is a good way to learn GTL! To view the generated code, click View Code.

SCIENCE SIMPLIFIED. STRATEGY PERFECTED.
Now You have your template ready what next?
Compilation-Submit proc template if no syntax errors template created and stored physically in the SASUSER.TEMPLAT item store by default SASUSER.TEMPLAT- does not produce graph
How to View my complied template: To verify that the template was created, you can issue the ODSTEMPLATE command (ODST, for short). This opens the Templates window where you view all item stores and their contents. All STATGRAPH templates can be identified by the common icon You can also browse the source for any compiled template by double-clicking on its name.
How to Executing the Template to Produce the GraphTo produce a graph, use the SGRENDER procedure
proc sgrender data=sxxxx template=test; run;
The SGRENDER procedure takes two required arguments: DATA= for the input data set and TEMPLATE= for the STATGRAPH template to be used.

SCIENCE SIMPLIFIED. STRATEGY PERFECTED.
Directing Output to ODS Destinations ods listing close;
ods pdf file=“H:\myfiles\”xxxxx.pdf" ; proc sgrender data=sashelp.class template=modelfit; run; ods pdf close; ods listing; /* reopen the listing destination for subsequent output */
CONTROLLING OUTPUTODS GRAPHICS ON < / RESET
IMAGEFMT= STATIC | GIF | PNG | JPEG | other-typesIMAGENAME= 'path-and-name'HEIGHT= size WIDTH= size /* default:
HEIGHT=480px WIDTH=640px */SCALE= ON | OFFBORDER= ON | OFFANTIALIASING = ON | OFFIMAGEMAP = ON | OFF /* produces tooltips for HTML destination only */more-options
>;procedures or data steps
ODS GRAPHICS OFF;

SCIENCE SIMPLIFIED. STRATEGY PERFECTED.
Prior to SAS 9.3 to use ODS Graphics you must have SAS/GRAPH software which is licensed separately from Base SAS.
But With SAS 9.3, ODS Graphics is included with Base SAS and does not require a SAS/GRAPH license
ODS Graphics SG procedures and GTL produces many types of graphs that “Traditional SAS/Graph” procedures either can not produce or need ANNOTATE or GREPLAY or extensive programming to produce. These include concept of the panel graphs or “small multiples”, and graphs with inset boxes. In addition ODS Graphics can produce overlay plots, panel graphs, and plot matrices much more easily than classic SAS/GRAPH procedures. So Custom features such as insets , Keylegend, ODS styles and classification panels are now simple operations.
Using GTL language and SGRENDER procedure can create customized graphics or layouts
Conclusion

SCIENCE SIMPLIFIED. STRATEGY PERFECTED.
Q & A & Contact details
I welcome and appreciate your comments and questions.
Contact Details:Hari Vardhan J Ockham Development Group,110, Mahatma Gandhi Road, Prakash Presidium, Nungambakkam, Chennai, IndiaPhone: +91 442 825 3938 Email: [email protected]
SAS and all other SAS Institute Inc. product or service names are registered trademarks or trademarks of SAS Institute Inc. in the USA and other countries. ® indicates USA registration.
SCIENCE SIMPLIFIED. STRATEGY PERFECTED.
References and Acknowledgements1.SAS/GRAPH 9.2: Statistical Graphics Procedures Guide.2. SAS/GRAPH® 9.2 Graph Template Language User’s Guide Second Edition2. Susan J. Slaughter, Lora D. Delwiche (2010), “Using PROC SGPLOT for QuickHigh Quality Graphs,” Proceedings of the 2010 -SAS Global Forum, April 20103. Heath, Dan. 2009. “Secrets of the SG Procedures.” Proceedings of the SAS Global Forum 2009 Conference. Cary, Proceedings of the 2008 SAS Global Forum, April, 20084. Kuhfeld, W. F. (2010), Statistical Graphics in SAS—An Introduction to the Graph Template Language and the Statistical Graphics Procedures, SAS Institute Inc.5. Matange, Sanjay. 2008. “Introduction to Graph Template Language.” Proceedings of the SAS Global Forum 2008Conference.
ACKNOWLEDGMENTS I want to thank Shridhar Patel, Sudhakar, Satheesh valuable input. Special thanks to Paul Ragland for reviewing my presentation.