granite disposal of u.s. high-level radioactive...
TRANSCRIPT

SANDIA REPORT SAND2011-6203 Unlimited Release August 2011
Granite Disposal of U.S. High-Level Radioactive Waste
Paul E. Mariner, Joon H. Lee, Ernest L. Hardin, Frank. D. Hansen, Geoff A. Freeze, Anna S. Lord, Barry Goldstein, and Ron H. Price
Prepared by Sandia National Laboratories Albuquerque, New Mexico 87185 and Livermore, California 94550
Sandia National Laboratories is a multi-program laboratory managed and operated by Sandia Corporation, a wholly owned subsidiary of Lockheed Martin Corporation, for the U.S. Department of Energy’s National Nuclear Security Administration under Contract DE-AC04-94AL85000.
Approved for public release; further dissemination unlimited.

Issued by Sandia National Laboratories, operated for the United States Department of Energy
by Sandia Corporation.
NOTICE: This report was prepared as an account of work sponsored by an agency of the
United States Government. Neither the United States Government, nor any agency thereof, nor
any of their employees, nor any of their contractors, subcontractors, or their employees, make
any warranty, express or implied, or assume any legal liability or responsibility for the
accuracy, completeness, or usefulness of any information, apparatus, product, or process
disclosed, or represent that its use would not infringe privately owned rights. Reference herein
to any specific commercial product, process, or service by trade name, trademark,
manufacturer, or otherwise, does not necessarily constitute or imply its endorsement,
recommendation, or favoring by the United States Government, any agency thereof, or any of
their contractors or subcontractors. The views and opinions expressed herein do not
necessarily state or reflect those of the United States Government, any agency thereof, or any
of their contractors.
Printed in the United States of America. This report has been reproduced directly from the best
available copy.
Available to DOE and DOE contractors from
U.S. Department of Energy
Office of Scientific and Technical Information
P.O. Box 62
Oak Ridge, TN 37831
Telephone: (865) 576-8401
Facsimile: (865) 576-5728
E-Mail: [email protected]
Online ordering: http://www.osti.gov/bridge
Available to the public from
U.S. Department of Commerce
National Technical Information Service
5285 Port Royal Rd.
Springfield, VA 22161
Telephone: (800) 553-6847
Facsimile: (703) 605-6900
E-Mail: [email protected]
Online order: http://www.ntis.gov/help/ordermethods.asp?loc=7-4-0#online

3
SAND2011-6203
Unlimited Release
Printed August 2011
Granite Disposal of U.S. High-Level Radioactive Waste
Paul E. Mariner, Joon H. Lee, Ernest L. Hardin, Frank. D. Hansen, Geoff A. Freeze,
Anna S. Lord, Barry Goldstein, and Ron H. Price
Sandia National Laboratories
P.O. Box 5800
Albuquerque, New Mexico 87185-MS1370
Abstract
This report evaluates the feasibility of disposing U.S. high-level radioactive waste in granite
several hundred meters below the surface of the earth. The U.S. has many granite formations
with positive attributes for permanent disposal. Similar crystalline formations have been
extensively studied by international programs, two of which, in Sweden and Finland, are the
host rocks of submitted or imminent repository license applications. This report is enabled by
the advanced work of the international community to establish functional and operational
requirements for disposal of a range of waste forms in granite media. In this report we
develop scoping performance analyses, based on the applicable features, events, and
processes (FEPs) identified by international investigators, to support generic conclusions
regarding post-closure safety.
Unlike the safety analyses for disposal in salt, shale/clay, or deep boreholes, the safety
analysis for a mined granite repository depends largely on waste package preservation. In
crystalline rock, waste packages are preserved by the high mechanical stability of the
excavations, the diffusive barrier of the buffer, and favorable chemical conditions. The buffer
is preserved by low groundwater fluxes, favorable chemical conditions, backfill, and the rigid
confines of the host rock. An added advantage of a mined granite repository is that waste
packages would be fairly easy to retrieve, should retrievability be an important objective.
The results of the safety analyses performed in this study are consistent with the results of
comprehensive safety assessments performed for sites in Sweden, Finland, and Canada. They
indicate that a granite repository would satisfy established safety criteria and suggest that a
small number of FEPs would largely control the release and transport of radionuclides. In the
event the U.S. decides to pursue a potential repository in granite, a detailed evaluation of
these FEPs would be needed to inform site selection and safety assessment.

4

5
ACKNOWLEDGEMENTS
This work was supported in part by the Laboratory Directed Research and Development
program at Sandia National Laboratories. Additional support was provided by the U.S.
Department of Energy, Office of Basic Energy Sciences, as part of the Center for Frontiers of
Subsurface Energy Security, Grant No. DE-SC0001114. Sandia National Laboratories is a
multi-program laboratory operated by Sandia Corporation, a wholly owned subsidiary of
Lockheed Martin Corporation, for the U.S. Department of Energy’s National Nuclear
Security Administration under contract DE-AC04-94AL85000.

6

7
CONTENTS
Page
Abstract ........................................................................................................................................... 3
Acknowledgements ......................................................................................................................... 5
Contents .......................................................................................................................................... 7
Figures............................................................................................................................................. 9
Tables ............................................................................................................................................ 11
Acronyms ...................................................................................................................................... 13
1. Introduction ............................................................................................................................... 15
1.1. Brief History of Granite Repository Research .............................................................. 16
1.2. Legal and Regulatory Framework ................................................................................ 17
1.3. Granites in the United States......................................................................................... 18
2. Technical Basis and Characterization ....................................................................................... 22
2.1. U.S. Nuclear Waste Inventory ...................................................................................... 24
2.2. Geologic Setting............................................................................................................ 26
2.2.1. Siting ............................................................................................................... 26
2.2.2. Chemical Environment ................................................................................... 28
2.3. Granite Repository Design ............................................................................................ 29
2.4. Engineered Barrier System ........................................................................................... 31
2.4.1. Functional Description of EBS ....................................................................... 34
2.4.2. EBS Performance ............................................................................................ 35
2.4.3. Events That Impact EBS Performance ........................................................... 38
2.5. Flow and Transport ....................................................................................................... 39
2.5.1. Groundwater Flow .......................................................................................... 40
2.5.2. Radionuclide Transport ................................................................................... 40
2.5.3. Radionuclide Adsorption ................................................................................ 42
2.5.4. Radionuclide Dispersion ................................................................................. 44
2.5.5. Radionuclide Solubility .................................................................................. 45
2.6. Chronology of Repository Conditions and Events ....................................................... 47
2.6.1. 0 to 100 Years ................................................................................................. 47
2.6.2. 100 to 1,000 Years .......................................................................................... 48
2.6.3. 1,000 to 10,000 Years ..................................................................................... 49
2.6.4. 10,000 to 100,000 Years ................................................................................. 49
2.6.5. 100,000 to 1,000,000 Years ............................................................................ 50
3. Scenarios ................................................................................................................................... 52
3.1. Identification of Relevant FEPs .................................................................................... 52
3.2. Scenario Selection ......................................................................................................... 53
4. Performance Analysis ............................................................................................................... 56
4.1. Model Design ................................................................................................................ 56
4.2. Model Results ............................................................................................................... 64
4.2.1. Defective Waste Package Scenario ................................................................. 64
4.2.2. Buffer Failure Scenario ................................................................................... 68

8
4.3. Relative Importance of Modeled FEPs ......................................................................... 72
4.4. Comparison of Results to Other Safety Assessments ................................................... 75
5. Summary and Conclusions ....................................................................................................... 78
5.1. Summary of Findings .................................................................................................... 78
5.2. Recommendations ......................................................................................................... 79
6. References ................................................................................................................................. 81
Appendix A: U.S. Nuclear Waste Inventory ............................................................................. A-1
A.1 Commercial Used Nuclear Fuel Inventory ................................................................. A-1
A.2 DOE High-Level Radioactive Waste .......................................................................... A-1
A.3 Reprocessing High-Level Radioactive Waste ............................................................ A-2
A.4 References ................................................................................................................... A-2
Appendix B: Features, Events, and Processes ........................................................................... B-1
B.1 FEPs and Likely Screening Decisions ........................................................................ B-1
B.2 References ................................................................................................................. B-17

9
FIGURES Page
Figure 1-1. Waste Disposal Demonstration in Granite at the Nevada Test Site (Patrick
1986). ..................................................................................................................16
Figure 1-2. Granite Outcrops in the United States (Bush 1976). ............................................20
Figure 2-1. Calculated Radionuclide Activity in a Single UNF Waste Package. ...................25
Figure 2-2. Calculated Radionuclide Activity in a Single DOE HLW Waste Package. ........25
Figure 2-3. Calculated Radionuclide Activity in a Single Reprocessing HLW Waste
Package. ..............................................................................................................26
Figure 2-4. The KBS-3V (left) and KBS-3H (right) Alternatives of the KBS-3 Spent
Fuel Disposal Method (from Posiva (2010), Figure 4-1). ..................................30
Figure 2-5. Schematic of KBS-3 Vertical Emplacement Concept (from SKB (2006d),
Figure 4-4). .........................................................................................................32
Figure 2-6. Schematic of Copper Canister and Cast-Iron Insert, as Intended for Boiling
Water Reactor (BWR) Used Fuel in the KBS-3 Concept (from SKB
(2006d), Figure 4-5). ..........................................................................................33
Figure 4-1. Conceptual Model of the Nominal Radionuclide Pathway. .................................56
Figure 4-2. Flow Paths and Dimensions. ................................................................................60
Figure 4-3. Simulated Near Field Barriers and Flow Paths. ...................................................60
Figure 4-4. Simplified Conceptual Model Layout of 30 Fracture Zone Conduits
Capturing Flow from the Boreholes of 3,000 Waste Packages. .........................62
Figure 4-5. Radionuclide Mass Flux from the Breached Waste Package in the Defective
Waste Package Scenario. ....................................................................................65
Figure 4-6. Radionuclide Mass Flux from the Buffer of the Breached Waste Package in
the Defective Waste Package Scenario. .............................................................65
Figure 4-7. Radionuclide Mass Flux from the Near-Field Fracture in the Defective Waste
Package Scenario. ...............................................................................................66
Figure 4-8. Radionuclide Mass Flux from the Near-Field Fracture in the Defective Waste
Package Scenario (linear scale for mass flux). ...................................................67
Figure 4-9. Radionuclide Mass Flux from the Far-Field Fracture Zone in the Defective
Waste Package Scenario. ....................................................................................67

10
Figure 4-10. Radionuclide Dose Rate at the Hypothetical Accessible Environment for the
Defective Waste Package Scenario. ...................................................................68
Figure 4-11. Mean Radionuclide Mass Flux from Waste Packages in the Buffer Failure
Scenario. .............................................................................................................69
Figure 4-12. Mean Radionuclide Mass Flux from Near-Field Fractures in the Buffer
Failure Scenario. .................................................................................................70
Figure 4-13. Mean Radionuclide Mass Flux from Far-Field Fracture Conduits in the
Buffer Failure Scenario. .....................................................................................71
Figure 4-14. Mean Annual Radionuclide Dose at the Hypothetical Accessible
Environment for the Buffer Failure Scenario. ....................................................72
Figure 4-15. Important Model Features and Processes. ..........................................................73

11
TABLES Page
Table 1-1. Granite HLW Repository Programs around the World (Hansen et al. 2011). ......15
Table 1-2. Granite Bodies in the United States. ......................................................................19
Table 1-3. Properties of Well-Characterized Granite Formations. .........................................21
Table 2-1. Sample Groundwater Compositions in Granite at Depths from 360 to 708 m. ....29
Table 2-2. Selected Bentonite kd Values for the Chemical Conditions of a Generic
Granite Repository. ............................................................................................43
Table 2-3. Granite Matrix kd Values Used in Posiva (2010, Table 6-9) for
Dilute/Brackish Groundwater. ...........................................................................44
Table 2-4. Diffusivity Values for Free Aqueous Solution and Saturated Bentonite. .............45
Table 2-5. Radionuclide Solubilities Calculated at T = 25°C, pH 7.5. ...................................47
Table 4-1. Near Field Model Parameters and Parameter Values. ...........................................58
Table 4-2. Far Field Model Parameters and Parameter Values. .............................................63
Table A-1. Isotope Inventory for Commercial UNF Used for Source-Term Model
Analysis. .......................................................................................................... A-3
Table A-2. Isotope Inventory for DOE HLW Used for Source-Term Model Analysis. ..... A-4
Table A-3. Isotope Inventory for Reprocessing HLW Used for Source-Term Model
Analysis. .......................................................................................................... A-5
Table B-1. Likely UFD FEPs Screening Decisions for a Mined Repository in Granite. .....B-1

12

13
ACRONYMS
BWR Boiling water reactor
DOE U.S. Department of Energy
EBS Engineered barrier system
EDZ Excavation damage zone
EPA U.S. Environmental Protection Agency
ERB1B Example Reference Biosphere 1B
FEPs Features, events, and processes
HLW High-level radioactive waste
IAEA International Atomic Energy Agency
ICRP International Commission on Radiation Protection
MOX Mixed oxide (fuel)
NM New Mexico
NRC U.S. Nuclear Regulatory Commission
NTS Nevada Test Site
NWPA Nuclear Waste Policy Act (1984)
PA Performance assessment
PWR Pressurized water reactor
RMEI Reasonably maximally exposed individual
RW Radioactive waste
SKB Svensk Kärnbränslehantering AB
SNF Spent nuclear fuel
TRU Transuranic (waste)
UNF Used nuclear fuel
UOX Uranium oxide (fuel)
URL Underground research laboratory
WP Waste package
WIPP Waste Isolation Pilot Plant

14

15
1. INTRODUCTION
This report analyzes the potential technical features and projected safety performance of a
repository for high-level radioactive waste (HLW) in suitable granite formations in the United
States. HLW includes commercial used nuclear fuel (UNF) (also called spent nuclear fuel or
SNF), existing HLW of the U.S. Department of Energy (DOE), and HLW from the reprocessing
of commercial UNF. Because U.S. efforts have focused on the volcanic tuff site at Yucca
Mountain, radioactive waste disposal in U.S. granite formations has not been considered for
many years. However, several countries have actively studied nuclear waste disposal in granite
media for decades. The analysis reported here, although generic, draws heavily on extensive
information from international repository programs that have continued to advance repository
concepts in granite (Table 1-1).
Table 1-1. Granite HLW Repository Programs around the World (Hansen et al. 2011).
Country Comments
Canada Restarting the repository siting program; hosted multi-national research on granite in the 1980s and 1990s in the now closed Pinawa Underground Research Laboratory (URL).
Finland Scheduled to open the nation’s first HLW repository in granite in 2020 in the voluntary host municipality of Eurajoki. Opened the nearby Onkalo URL in granite in 2010.
Japan Pursuing voluntary candidate repository sites with an expressed interest in granite. Operates URLs in clay and granite.
Sweden Scheduled to open the nation’s first repository for HLW in granite at Forsmark in the voluntary host community of Oesthammar in 2025. Operates a multi-national URL in granite at Äspö.
United States of America
Has operated URLs in basalt, granite, salt, and tuff.
Various references to lithology and types of geologic formations are used in this report.
Potentially suitable crystalline rock formations share many characteristics favorable to repository
development and waste isolation. The lithologies encompass a broad range of material
properties. For this report we use the term “granite” broadly to represent the full range of
potentially suitable crystalline rock formations as opposed to the strict geologic definition of the
lithology.
The remainder of this introductory section briefly reviews the history of granite repository
research in the U.S. and around the world (Section 1.1), the U.S. legal and regulatory framework
(Section 1.2), and available U.S. granite formations (Section 1.3). The other major sections of
this report describe the generic technical and performance analyses for disposal of U.S. HLW
and spent nuclear fuel (SNF) in granite media. Section 2 outlines the technical basis for disposal
in granite, including descriptions of mature granite repository concepts and expected evolution of

16
the repository and host rock over time. Section 3 considers potential release scenarios and the
framework for a performance assessment (PA) for a granite repository. Section 4 describes the
generic performance analysis developed in this report. Section 5 concludes with a summary and
recommendations for future work.
1.1. Brief History of Granite Repository Research
Research in underground disposal of radioactive waste in the U.S. began in earnest in the 1950s.
The National Academy of Sciences released a report in 1957 concluding that disposal of
radioactive waste in salt beds or salt domes may offer “the most practical immediate solution of
the problem” (Hess et al. 1957). This seminal report prompted U.S. research to focus largely on
salt formations in the early years. At the same time, countries without salt formations focused on
repository concepts in other media such as granite.
By the late 1970s and early 1980s, U.S. repository research in granite formations had broadened
considerably. The U.S. developed a URL at a depth of 420 m in the Climax monzonite stock, a
granitic body at the Nevada Test Site (NTS) (Figure 1-1). Work at this URL demonstrated the
feasibility and safety of spent fuel storage and retrieval from an underground facility in granite
(Patrick 1986).
Figure 1-1. Waste Disposal Demonstration in Granite at the Nevada Test Site (Patrick 1986).

17
The Nuclear Waste Policy Act (NWPA) of 1982 required the federal government to take
responsibility for the disposal of civilian SNF and HLW. As part of this process, the NWPA
directed the government to identify three potential repository sites and established a timetable
leading to the opening of the first repository. In succeeding years a screening process was
conducted to identify potentially viable sites. Granitic sites were considered initially, but were
not carried forward into the screening process.
U.S. research on disposal in crystalline rock ended soon after the Nuclear Waste Policy
Amendments Act of 1987 was enacted. This act directed the Secretary of Energy to characterize
only the Yucca Mountain site and to phase out funding for all research programs designed to
evaluate the suitability of crystalline rock as a potential repository host medium.
Although crystalline rock was no longer considered to be a potential repository host rock, limited
work on crystalline concepts continued in the U.S. as part of other research. In the early 1990s,
Sandia National Laboratories developed a probability-based PA model for disposal of SNF in
granite to compare to a similar model for salt. Multiple codes and algorithms, simulating
processes ranging from corrosion to the flow and transport of fluids, energy, and radionuclides
through the repository and fractured granite, were linked and executed in a set of Monte Carlo
simulations. The results indicated that, with adequate treatment and packaging, all the waste
forms considered could be isolated from the environment with acceptable performance for
10,000 years (SNL 1993). For that study, the waste package outer layer was assumed to be
Inconel 625 (69% Ni, 22% Cr, 9% Mo) rather than copper, the preferred material in current
granite repository concepts in Sweden, Finland, and Canada (SKB 2011; Posiva 2010; Garisto et
al. 2010).
In 2008, the U.S. DOE submitted a license application to the U.S. Nuclear Regulatory
Commission (NRC) for a proposed repository at Yucca Mountain, Nevada. Two years later, at
the direction of the Obama administration, the U.S. DOE filed a motion to withdraw the
application. As a result, other disposal environments in the U.S. are once again being
investigated, including disposal in granite.
Granitic repository programs in Europe, North America, and Asia, which have matured over the
past three decades and have generated large sets of data from laboratory experiments and in situ
tests performed in URLs, provide a valuable resource for this effort. These programs have
produced corresponding refinements to repository design concepts and medium-specific
performance analyses. Two of these programs have either entered the license application phase
(Sweden) or are very close to doing so (Finland). For the generic evaluation presented in this
report, design and operational concepts from these international programs are used as the
technical basis. This use of existing work permits a credible analysis that applies to the many
granite formations in the U.S. that have the potential to host a high level radioactive waste
repository.
1.2. Legal and Regulatory Framework
The 1987 Amendments to the NWPA restrict the pursuit of geologic repositories in the U.S. to a
single site in volcanic tuff at Yucca Mountain in Nevada. Hence, at a minimum, pursuit of a
HLW/UNF repository in other formations would require changes to the NWPA.

18
In principle, the existing U.S. Environmental Protection Agency (EPA) HLW/UNF radiation
protection standards and the NRC HLW/UNF regulatory framework originally promulgated in
the 1980s (40 CFR 191 and 10 CFR 60, respectively), which predate the selection of Yucca
Mountain, could apply to a repository in another geologic medium. Indeed, a specific derivative
(40 CFR Part 194) of the EPA standard, 40 CFR 191, currently applies to the Waste Isolation
Pilot Plant (WIPP), a repository located in New Mexico and situated in bedded salt for disposal
of transuranic (TRU) waste from defense activities. In 40 CFR 191, the primary indicator of risk
to human health is the cumulative release of radionuclides. Its measure is the complementary
cumulative distribution function of the cumulative mass release of radionuclides that cross a
boundary 5 km from the site 104 years after disposal, normalized by (a) EPA-derived limits for
specified radionuclides and (b) the mass of radionuclides placed in the repository. However, in
1995 the National Research Council of the National Academies of Science and Engineering
recommended using dose as the primary indicator of risk to human health for a Yucca Mountain
repository. The International Commission on Radiation Protection (ICRP) made a similar
recommendation in 1997 (ICRP 1997), and the International Atomic Energy Agency (IAEA)
model standard, issued in 2006, uses a dose indicator for deep geologic disposal of radioactive
waste (IAEA 2006). Because of these changes, this analysis assumes dose is the primary hazard
indicator for radioactive waste disposal in granite.
The EPA standard, 40 CFR 197, specifically written for a repository at Yucca Mountain,
specifies the hazard indicator measure as the expected (mean) peak dose to a reasonably
maximally exposed individual (RMEI) living along the predominant groundwater flow path 18
km from the site. The standard set a limit on expected peak dose rate of 0.15 mSV yr-1
(15 mrem
yr-1
) before 104 years and 1 mSv yr
-1 (100 mrem yr
-1) between 10
4 and 10
6 years. The latter limit
is consistent with the ICRP and IAEA recommendations. The characteristics of the
hypothetically exposed individual are those of the RMEI defined in 40 CFR 197. These
characteristics are appropriate for humans living in arid regions similar to Yucca Mountain but
may need to be reconsidered for granite disposal sites in less arid regions. For the performance
analysis presented in Section 4, the same dose limits were applied but the distance from the
repository to the RMEI was shortened to 500 m to be consistent with the pre-existing flow model
adopted for the analysis. The EPA and NRC regulations pertaining to HLW disposal place
specific requirements on PA models that are intended to demonstrate compliance with regulatory
performance objectives. The generic performance analysis presented in Section 4 of this report
represents what are likely to be the major features of a compliant PA, but the analysis itself does
not meet all the regulatory requirements for a PA.
Other details of the regulatory framework, including screening criteria for potentially relevant
FEPs and guidance on inadvertent human intrusion, are assumed to be unchanged from those
stated in 40 CFR 197.
1.3. Granites in the United States
As a class of rocks, granite is a crystalline igneous rock that encompasses a variety of specific
lithologies. Formed from magma that intrudes other rocks deep within the continental crust, it
predominantly consists of quartz and feldspar. Major granite formations in the U.S. are
summarized in Table 1-2. Granite outcrops are mapped in Figure 1-2.

19
Table 1-2. Granite Bodies in the United States.
Location Units Attributes Comments
Pacific Border Region
Triassic, Jurassic, and Cretaceous granites, California, Oregon, and Washington
Very high hydraulic gradient. Large vertical movement along the Sierra Nevada and Cascade Range. Large horizontal movement along the coast range. High seismic and volcanic activity. Regions of large expanses of granite.
Basin and Range Region
Precambrian granites, Arizona, Jurassic and Triassic granites east of Sierra Nevada. Cretaceous granites in Nevada, California, and Arizona.
High hydraulic gradient. Large vertical movement. Many active faults, Major mining for mineral deposits. High heat flow region.
Some granitic areas in Arizona and Nevada have a relatively low incidence of seismicity, when compared to the California granites.
Rocky Mountain Region
Archean granite, Wyoming, and southern Montana. Precambrian granites, Front Range, Colorado. Mesozoic granite, Idaho batholiths, and Montana.
High hydraulic gradient. Large vertical movement. Moderate seismic activity. Large faults bound uplifted blocks. Major mineral deposits. Occurrence of large homogeneous masses of granite.
Lake Superior Region
Precambrian granites, Minnesota, Wisconsin, and Michigan.
Low hydraulic gradient. Little vertical relief. Small number of faults. Very low seismic activity. No volcanic activity.
The most stable region of granite outcrops in the U.S. – part of the N. American Continent stable craton
Northern Appalachian and Adirondack Region
Precambrian crystalline rocks, New England and the Adirondacks.
Moderate to low hydraulic gradients. Moderate vertical uplift. No modern fault movement. Low seismic activity. No volcanic activity
Southern Appalachian Region
Precambrian granite, Blue Ridge and Piedmont provinces.
High hydraulic gradient in the Blue Ridge. Intermediate to low hydraulic gradient in the Piedmont. Moderate vertical movement. Very few recent faults. Low seismicity. No volcanic activity. Large masses of granite.
* Smedes (1983)

20
Figure 1-2. Granite Outcrops in the United States (Bush 1976).
The variation in constituents and emplacement histories of granitic-type rocks can result in
significant differences in the rock characteristics. Table 1-3 summarizes some of the most
pertinent properties for well-characterized granite formations. These data show that rock strength
is high and porosity is generally less than 1%. The wide range of hydraulic conductivity
observed is highly correlated with the number, aperture, and connectivity of fractures. Granite
bodies are intersected by fracture zones of varying hydraulically conductivity; thus, the higher
measurements reflect the effects of fracture zones. The decrease in hydraulic conductivity with
depth is consistent with observations of fewer open, interconnected fractures at depth.

21
Table 1-3. Properties of Well-Characterized Granite Formations.
Location Reference Lithologic
Classification Porosity
(%)
Bulk Hydraulic Conductivity
(m s-1
)
Young’s Modulus
(GPa)
Poisson’s Ratio
Compressive Strength
(MPa)
Barre Granite, Vermont Krech et al. (1974) Granodiorite 0.51 < 10-10
46 0.23 197
St. Cloud Granodiorite, Minnesota
Krech et al. (1974) Granodiorite 0.08 < 10-10
71 0.25 282
Westerly Granite, Rhode Island
Krech et al. (1974) Granodiorite 0.35 < 10-10
50 0.21 233
Sherman Granite, Wyoming
Touloukian et al. (1981)
Granite 0.002 9.8 × 10⁻¹³
Granite, Wyoming Touloukian et al. (1981)
Granite 142, 129
Fremont Canyon Touloukian et al. (1981)
Granite 45 0.10
California Touloukian et al. (1981)
Granodiorite 116
Stone Mountain Granite, Georgia
Touloukian et al. (1981); Hoek & Brown (1980)
Granite 0.3 116
Hardhat Granite Touloukian et al. (1981)
Granite 4 × 10-14
Atikokan, Ontario Gascoyne et al. (1987)
Granite 10
-12 – 10
-5 (<400 m)
10-13
– 10-10
(>400 m)
Olkiluoto, Finland Posiva (2010)a
Pegmatitic granite
0.01 – 0.2 10
-7 (near surface)
10-11
(at depth) 65 0.29 108
Laxemar, Sweden SKB (2006b), Table A-42; SKB (2006d)
Granite to Granodiorite
0.14 10
-10 – 10
-5 (<200 m)
10-11
– 10-6
(>200 m) 165-210
Forsmark, Sweden SKB (2006b), Table A-42
Granite to Granodiorite
0.09 76 0.24
a Approximate range of flow porosities, which are 1/10
th the approximate diffusion porosities (Tables C-3, C-4, and C-5, Posiva (2010)).
Hydraulic conductivity values are from p. 249.

22
2. TECHNICAL BASIS AND CHARACTERIZATION
Disposal of HLW in a repository deep in a granite formation is expected to provide effective
long-term (>106 years) isolation of radionuclides from the biosphere because of mechanical,
hydrologic, and chemical conditions favorable to waste form containment. A repository in a
granite formation would likely be resistant to inadvertent human intrusion, and the wide
distribution of suitable bedrock in the U.S. would increase the chances for a successful repository
siting process. More specifically, the attributes of a granite repository include:
Minimal rock pressures – It is expected that excavations in suitable granite formations
would be stable and long-lasting (Smedes 1983). Mechanical stability would contribute to
worker safety during the pre-closure and operational periods. Waste packages and other
engineered barriers would be protected from shear stresses and rockfall during both the
operational and post-closure periods. Favorable mechanical characteristics would readily
allow waste retrieval should governing regulations so require. There is considerable
worldwide experience in the excavation and construction of self-supporting underground
openings in crystalline and other hard rocks at the depths considered suitable for a
repository. This experience provides confidence that timely, efficient, and cost-effective
repository mining can be performed. Specific attention would be needed to avoid major
subvertical fracture zones. Moreover, if sited correctly, there would be a low probability
of seismicity that could damage the engineered barriers. By protecting the waste
packages from rock pressures over long periods of time, the geomechanical properties of
granite would strongly contribute to the long term isolation of radionuclides from the
biosphere.
Low permeability – It is also expected that a repository excavated in a suitable granite
formation would have low rock permeability, which limits groundwater flow. Low
interconnected porosity, in combination with much lower kinematic (flow) porosity,
limits groundwater flow in granite (Section 2.5.1). Advective flow of groundwater can
lead to the enhanced migration of radionuclides away from the repository and towards the
biosphere. In granite plutons, lighter freshwater is found near the surface and heavier
saline water is found at depth, which is a stable arrangement that tends to reduce vertical
groundwater flow. Chemical age dating indicates that groundwater at the depths of
granite repository sites is very old, which supports the hypothesis that saline water at
depth does not mix readily with surface waters (Section 2.2.2). Hence, any radionuclides
migrating from the repository would not necessarily be destined for the biosphere or
would reach the biosphere slowly.
Favorable chemical environment – It is expected that a repository excavated in granite
formations would have a reducing environment (Section 2.2.2) that would limit corrosion
of the waste canisters (Section 2.4.2), contributing to their long term ability to isolate
waste. A reducing environment would also limit solubility and/or increase the adsorption
of some radionuclides, further delaying the migration of these radionuclides to the
biosphere.
Low probability of accidental human intrusion – It is expected that a repository
excavated in a granite formation would have a low probability of human intrusion. The

23
depth of the repository would restrict or prevent access into the closed repository. The
site location would likely be chosen such that there are no known significant natural
resources or geothermal heat sources nearby that might encourage exploratory drilling.
For example, the groundwater at repository depth would likely be of limited use (too
salty) or too uneconomical to exploit. Moreover, the repository would be positioned
within a region of rock with low permeability, which would be inconsistent with
groundwater resource use. For these reasons, it is unlikely that wells would be drilled into
the repository in search of potable water or other resources. The depth of the repository
would require specialized drilling equipment and, therefore, any drilling would likely be
part of a carefully monitored and controlled exploration performed by technologically
advanced people (Garisto et al. 2009, Section 5.5). Presumably, such people would be
aware of the dangers of radioactive waste and would not heedlessly drill into the
repository.
Wide availability of potential sites – Another favorable characteristic of granite is that
suitable bedrock for a granite repository can be found in many parts of the country
(Section 1.3).
The granite repository concept is developed in this study in view of conceptual designs advanced
by Sweden, Finland, and Canada. To establish the boundary conditions for analysis we specify:
Waste inventory and description – The inventory described in Appendix A is placed in
the repository for permanent disposal. We recognize the tenets of retrievability inasmuch
as they have been incorporated into international repository programs. However, the
primary goal of geologic disposal is to permanently isolate waste material from the
biosphere. Therefore, although retrievability is facilitated in a granite repository by the
long-term stability of granite, for the purpose of this study, retrievability is not a design
priority.
Geologic setting – The repository is deep enough below the present land surface to
ensure that the waste is not exposed to the biosphere through erosion or shallow
groundwater circulation during its period of isolation (e.g., one million years). By siting
the repository at least 300 m beneath the present land surface in granite where fractures
are sparse and hydraulic conductivity is low, erosion and shallow groundwater circulation
will not threaten repository performance.
Concept of operations – Based on disposal concepts in Sweden and Finland, the
repository is conceptualized as a network of tunnels in which waste contained in copper
canisters are emplaced in boreholes drilled in the tunnel floor. The diameter and length of
the emplacement borehole are larger than the waste package to accommodate a clay
buffer that surrounds the waste package in the borehole. After emplacement, the
emplacement tunnels are backfilled with a mixture of crushed rock and clay.
This study primarily utilizes data and designs advanced by international repository programs.
There is a vast amount of descriptive information available. From international experience,
emplacement layout and host rock properties are some of the basic parametric selections. Given

24
a selection of host rock characteristics, waste inventory, and concept of operations, the
appropriate FEPs are identified in Section 3 for the generic safety analysis.
As discussed in Section 1.2, we expect that the overall repository waste isolation performance
measure of interest would be mean annual dose to a hypothetical individual, with limits set at
0.15 mSv (15 mrem) for 104 years following disposal, and 1 mSv (100 mrem) for the period
between 104 years and 10
6 years. Other details of the regulatory framework, including screening
criteria for potentially relevant FEPs, are assumed to be unchanged from those stated in 40 CFR
Part 197 and 10 CFR Part 63.
The following subsections examine the major FEPs involved in the performance of a granite
repository. They include the U.S. nuclear waste inventory (Section 2.1), geologic setting (Section
2.2), general repository design (Section 2.3), design and function of engineered barriers (Section
2.4), groundwater flow and transport (Section 2.5), and expected evolution of the repository over
time (Section 2.6).
2.1. U.S. Nuclear Waste Inventory
The U.S. nuclear waste inventory depends on the future use and potential reprocessing of UNF.
With reprocessing, the inventory would consist largely of three types of waste: UNF, existing
DOE HLW, and reprocessing HLW. Based on the specific set of assumptions and calculations
presented in Appendix A, the total number of waste packages needed to contain these wastes is
estimated to be 32,154 for UNF, 5,003 for DOE HLW, and 4,055 for reprocessing HLW.
Appendix A includes tables of waste package radionuclide inventories for each waste package
type and the half-lives of the radionuclides.
Decay and ingrowth cause the radionuclide inventories to change over time. GoldSim version
10.5 was used to calculate these changes for each waste package type. The resulting calculations
are shown in Figure 2-1 (UNF), Figure 2-2 (DOE HLW), and Figure 2-3 (reprocessing HLW).
The thermal power of each waste package is a function of the radioactivity. The thermal power is
important to the design of a granite repository because temperatures in the repository should be
limited. For example, high temperatures may cause buffer alteration or cementation (Section
2.4.2) (SKB 2011, Section S3.6). To prevent temperatures from exceeding specified limits in
granite repository designs, a thermal analyses is needed to determine the necessary waste
package spacing (e.g., SKB 2011, Section 5.2.2).

25
Figure 2-1. Calculated Radionuclide Activity in a Single UNF Waste Package.
Figure 2-2. Calculated Radionuclide Activity in a Single DOE HLW Waste Package.
1.E-06
1.E-05
1.E-04
1.E-03
1.E-02
1.E-01
1.E+00
1.E+01
1.E+02
1.E+03
1.E+04
1.E+05
1.E+06
1.E+07
1.E+01 1.E+02 1.E+03 1.E+04 1.E+05 1.E+06
Acti
vit
y (
Ci)
Time (years)
Radionuclide Activity in a Single UNF Waste Package
Ac-227 Am-241 Am-243 C-14 Cl-36 Cm-245 Cs-135 Cs-137 I-129
Nb-93 Np-237 Pa-231 Pb-210 Pd-107 Pu-238 Pu-239 Pu-240 Pu-241
Pu-242 Ra-226 Ra-228 Sb-126 Se-79 Sn-126 Sr-90 Tc-99 Th-229
Th-230 Th-232 U-232 U-233 U-234 U-235 U-236 U-238 Zr-93
1.E-06
1.E-05
1.E-04
1.E-03
1.E-02
1.E-01
1.E+00
1.E+01
1.E+02
1.E+03
1.E+04
1.E+05
1.E+06
1.E+07
1.E+01 1.E+02 1.E+03 1.E+04 1.E+05 1.E+06
Acti
vit
y (
Ci)
Time (years)
Radionuclide Activity in a Single DOE HLW Waste Package
Ac-227 Am-241 Am-243 C-14 Cl-36 Cm-245 Cs-135 Cs-137 I-129
Nb-93 Np-237 Pa-231 Pb-210 Pd-107 Pu-238 Pu-239 Pu-240 Pu-241
Pu-242 Ra-226 Ra-228 Sb-126 Se-79 Sn-126 Sr-90 Tc-99 Th-229
Th-230 Th-232 U-232 U-233 U-234 U-235 U-236 U-238 Zr-93

26
Figure 2-3. Calculated Radionuclide Activity in a Single Reprocessing HLW Waste Package.
2.2. Geologic Setting
The geologic setting is important to repository siting, design, and performance. Knowledge of
the physical and chemical characteristics of the granite and groundwater are needed to select an
adequate location, design the layout of the repository, select materials used for engineered
barriers, and conduct the post-closure performance assessment.
2.2.1. Siting
The properties of granite formations vary broadly across the U.S. (Section 1.3) and may also
vary broadly across granite provinces. Drawing from McKinley et al. (2007), key characteristics
to consider in siting a mined geologic repository in granite include:
Depth – The specific isolation zone should be determined based on site specific
conditions. Geologic isolation is attained by ensuring significant separation between the
repository and the biosphere, which would provide extensive sub-zones for robust seal
systems. Rock strength and in situ stress characteristics would also determine a practical
and functional mining depth.
Thickness – Maximal thickness of the isolation medium is desired to ensure radionuclide
migration does not exceed regulatory criteria or boundaries. Various “minimal”
thicknesses have been proposed, generally on the order of 100 m. However, the thickness
of the formation is less important than its uniformity and structure.
1.E-06
1.E-05
1.E-04
1.E-03
1.E-02
1.E-01
1.E+00
1.E+01
1.E+02
1.E+03
1.E+04
1.E+05
1.E+06
1.E+07
1.E+01 1.E+02 1.E+03 1.E+04 1.E+05 1.E+06
Acti
vit
y (
Ci)
Time (years)
Radionuclide Activity in a Single Reprocessing HLW Waste Package
Ac-227 Am-241 Am-243 C-14 Cl-36 Cm-245 Cs-135 Cs-137 I-129
Nb-93 Np-237 Pa-231 Pb-210 Pd-107 Pu-238 Pu-239 Pu-240 Pu-241
Pu-242 Ra-226 Ra-228 Sb-126 Se-79 Sn-126 Sr-90 Tc-99 Th-229
Th-230 Th-232 U-232 U-233 U-234 U-235 U-236 U-238 Zr-93

27
Uniformity and Structure – The potential repository interval and surrounding rock
should be reasonably homogeneous both vertically and horizontally. The related benefits
are simpler and more transparent safety and PAs, as well as safer repository mining and
operations. Conversely, extensive faulting complicates the characterization, design and
analysis, and also increases the uncertainty in safety and PAs.
Seismicity – Repository design and operational issues favor a relatively seismically
quiescent region. These areas would also greatly reduce the risks for seismically induced
damage to the engineered barrier system (EBS) and the seismic consequences for long
term performance.
Hydrogeology and Hydrogeochemistry – Fractures in the vicinity of the repository
should be small and sparse, and the bulk hydraulic conductivity of the granite should be
low (approximately 10–10
m s-1
or lower). For the KBS-3 disposal concept considered in
this report (Section 2.3), the granite should be saturated and the chemical environment
should be reducing. Reducing chemical conditions would minimize the corrosion of
engineered barriers and waste forms, reduce most radionuclide solubilities, and improve
adsorption.
The physical characteristics of granite bodies generally meet these criteria in the following ways
(Smedes 1983):
Crystalline rocks exhibit great strength, mechanical stability, and rock homogeneity, all
of which enhance excavation stability. Many mined tunnels/caverns in granitic rocks
have remained intact for centuries without additional support.
Granite is composed largely of silicate minerals, which crystallize at high temperatures.
Therefore, it is unlikely that the silicates would be significantly affected by the heat
generated from radioactive waste.
Crystalline rocks are known for their low permeability, with groundwater flow occurring
only through fractures. Rock fractures are known to dissipate in number with depth and
may be insignificant at repository depths.
Large quantities of homogeneous granites are found in regions of low seismic activity
and are known to have been stable for millions of years.
The chemical environment within granite bodies is also conducive to waste isolation. The effects
of reducing conditions on canister corrosion rates, radionuclide adsorption, and radionuclide
solubility are addressed in Sections 2.4.2, 2.5.3, and 2.5.5. In addition, the high salinity of
groundwater typically observed in deep granitic rocks (next section) would inhibit radiocolloid
transport (Section 2.5.2) and could present some resistance to upward flow due to its likely
higher density than overlying waters.

28
2.2.2. Chemical Environment
At the depth of a potential repository in granite (approximately 500 m), brackish groundwater
typically saturates the fractures and interconnected pores. Table 2-1 gives examples of the
compositions of such groundwater at sites in Sweden, Finland, and Canada. Na-Ca-Cl solutions
predominate at this depth with total dissolved solids in the range of 1 to 10 g L-1
or higher.
Granitic waters at these depths are typically not modern. Isotope data at Forsmark, for example,
indicate that water of meteoric origin does not occur below about 200 m (SKB 2006d, p. 109). At
Olkiluoto, mixing models indicate that water at a depth of 500 m is approximately 50%
formation water, 10% melt water from the Weichselian glaciation (the most recent glacial period
from approximately 110,000 to 10,000 years ago), and 40% water from pre-Weichselian
Quaternary glacial cycles (Posiva 2010, Figure 6-11). The maximum fraction of Weichselian
melt water at Olkiluoto (~50%) is observed at a depth of approximately 150 m. These data
indicate that water at repository depths in granite is not well connected to the biosphere.
The redox conditions at the depth of a potential repository in granite are reducing. There are two
primary reasons for this. First, as indicated by the analysis at Olkiluoto, there is little mixing of
infiltrating waters to depths of 400 to 500 m, except perhaps over periods of hundreds of
thousands of years. Second, there is an abundance of oxygen-consuming reactants below the
surface. At shallow depths, oxygen is typically consumed by microbial degradation of organic
carbon. At Olkiluoto, iron oxyhydroxides are observed in fractures only in the top few meters
(Posiva 2010, Section 6.2.5). Below this depth, pyrite and other mineral sulfides are present and
react with oxygen, producing sulfate. At approximately 300 m at Olkiluoto a spike in the
hydrogen sulfide concentrations indicates reducing conditions are strong enough to reduce
sulfate to sulfide. Below 300 m, aqueous concentrations of both sulfate and sulfide drop and the
concentration of methane rises. Methane is another strong buffer against the downward transport
of oxygen because methanotrophs will use available oxygen to oxidize methane.
Studies in Sweden and Canada also indicate reducing conditions in granite formations. All
groundwater samples from Äspö and Stripa were shown to contain dissolved Fe(II) despite
prolonged periods of oxygen inflow into the tunnels (SKB 2006d, Section 9.2.5). Microbial
respiration was shown at Äspö to consume infiltrating dissolved oxygen in the first 70 m of a
major fracture zone even after construction of a tunnel through the fracture zone at that depth
caused a 20-fold reduction in the mean residence time (Banwart et al. 1999). In Canada, all Eh
measurements from groundwater samples from four research areas in the Canadian Shield
indicate redox potentials at or below the Fe(II)/Fe(III) boundary (Gascoyne et al. 1987, Table 3).
Reducing conditions are important to repository performance because they prevent rapid
oxidation of waste canisters, decrease aqueous solubilities of many redox sensitive radionuclides,
and can limit waste form degradation rates.

29
Table 2-1. Sample Groundwater Compositions in Granite at Depths from 360 to 708 m.
Parameter Olkiluoto, Finland
Olkiluoto, Finland
Olkiluoto, Finland
Laxemar, Sweden
Forsmark, Sweden
Pinawa, Canada
East Bull Lake, Canada
Borehole OL-KR20 OL-KR10 OL-KR12 KLX03 KFM02A WN-4 EBL-2
Depth (m) 360 487 708 380 512 513 538
TDS (g L-1
) 10.5 22.1 49.5 2.8 9.3 7.5 2.3
Ionic strength (eq L
-1) 0.22 0.48 1.18 0.05 0.19 0.16 0.05
pH 7.4 8.0 8.2 7.9 7.2 8.1 7.4
Na (mol L-1
) 0.11 0.21 0.36 0.03 0.09 0.07 0.03
Ca (mol L-1
) 0.03 0.09 0.25 0.01 0.02 0.03 0.01
K (mol L-1
) 2.8 × 10⁻⁴
3.6 × 10⁻⁴
4.9 × 10⁻⁴
1.4 × 10⁻⁴
9.0 × 10⁻⁴
5.3 × 10⁻⁴
5.4 × 10⁻⁵
Mg (mol L-1
) 2.6 × 10⁻³
1.6 × 10⁻³
1.5 × 10⁻³
4.4 × 10⁻⁴
9.3 × 10⁻³
1.1 × 10⁻³
7.0 × 10⁻⁵
Sr (mol L-1
) 1.6 × 10⁻⁴
3.7 × 10⁻⁴
1.1 × 10⁻³
nr nr nr 3.3 × 10⁻⁵
Mn (mol L-1
) 5.8 × 10⁻⁶
7.3 × 10⁻⁶
9.3 × 10⁻⁶
nr nr nr nr
Cl (mol L-1
) 0.18 0.38 0.86 0.04 0.15 0.11 0.04
SO4 (mol L-1
) 2.1 × 10⁻⁴
1.0 × 10⁻⁵
5.0 × 10⁻⁵
1.3 × 10⁻³
5.2 × 10⁻³
6.6 × 10⁻³
1.4 × 10⁻⁴
CO3 (mol L-1
) 5.5 × 10⁻⁴
1.1 × 10⁻⁴
4.0 × 10⁻⁵
3.1 × 10⁻³
2.2 × 10⁻³
3.5 × 10⁻³
5.0 × 10⁻⁴
SiO2 (mol L-1
) 3.6 × 10⁻⁴
2.8 × 10⁻⁴
2.1 × 10⁻⁴
nr nr nr 5.4 × 10⁻⁵
Fe (mol L-1
) 2.5 × 10⁻⁶
2.0 × 10⁻⁶
3.8 × 10⁻⁷
8.0 × 10⁻⁶
3.3 × 10⁻⁵
nr nr
S(-II) (mol L-1
) 5.6 × 10⁻⁶
<3.1 × 10⁻⁷
1.3 × 10⁻⁶
3.0 × 10⁻⁷
0.0E+00 nr nr
Reference Posiva (2010),
Table 6-6
Posiva (2010),
Table 6-6
Posiva (2010),
Table 6-6
SKB (2006d), p.
382
SKB (2006d), p.
382
Gascoyne et al.
(1987), Table 3
Gascoyne et al. (1987),
Table 3
nr = not reported
2.3. Granite Repository Design
After waste inventory (Section 2.1) and geologic setting (Section 2.2), the third boundary
condition governing repository design is concept of operations. Section 2.3 broadly summarizes
the concept of operations adopted for this report. A more detailed discussion of EBS features and
their functions is provided in Section 2.4.
Because Sweden, Finland, and Canada have advanced concepts for a repository in granite, their
experience is used to inform our generic repository design. The conceptual granite repositories
for these countries are at depths of 420 m (Finland) and 500 m (Sweden and Canada) (SKB
2006d; Posiva 2010; Garisto et al. 2009).

30
The reference layout and arrangement of waste packages are also similar among the three
countries. Sweden and Finland are studying waste package emplacement in vertical boreholes
drilled into the floor in horizontal emplacement tunnels but are also considering emplacement in
horizontal boreholes drilled in the tunnel walls (Figure 2-4). Canada is considering these two
options in addition to in-room horizontal emplacement (Gierszewski et al. 2004). Each of these
concepts includes a clay buffer surrounding waste packages, a mixture of clay and crushed rock
to be used as backfill, and various grouting and sealing processes.
Figure 2-4. The KBS-3V (left) and KBS-3H (right) Alternatives of the KBS-3 Spent Fuel Disposal Method (from Posiva (2010), Figure 4-1).
A requirement in repository programs is to provide a suitable distance between the emplaced
waste and major fractures. Large fractures can provide channels for major water flow and can
present rock stability problems. Although major fractures can be avoided in the repository
excavation, smaller fractures cannot be. For fractures that intersect the excavations and could
contribute significant water inflow, grouting and cementing, anchor bolts, and other supporting
measures would be used during repository construction to limit groundwater flow and to ensure
operational safety. Waste packages would not be emplaced near any such zones.
During the first few thousand years, the temperature in the repository would be elevated. Waste
package thermal loads and spacing within the repositories at the time of emplacement would be

31
designed to prevent temperatures at the waste package surface from exceeding 100°C. This limit
is primarily imposed by the international programs to prevent damage to the buffer (SKB 2011,
Section S3.6). To satisfy this requirement in the Forsmark repository design, the emplacement
tunnels are spaced about 40 m apart and have vertical disposal boreholes about 6 m apart (SKB
2006d, Table 9-4). For the 6,000 waste packages in the design, this spacing covers an area of
approximately one square kilometer. The conceived repository layout splits this area into to
several smaller deposition areas connected by transport tunnels (SKB 2011, Figure 5-3).
2.4. Engineered Barrier System
Engineered barriers have an important role for waste isolation in fractured, crystalline rock.
Whereas the natural setting may attenuate sorptive or redox-sensitive waste species that are
released from the repository, the more mobile species (e.g., 129
I) may be transported rapidly by
fracture flow. The KBS-3 disposal concept (SKB 2006d), shown in Figure 2-4, is currently
accepted worldwide as a reference for disposal in crystalline rock. The Swedish program for
used fuel disposal is one of the most advanced internationally, considering investigations in all
geologic media, and our current understanding of the likely performance of a U.S. repository in
crystalline rock is attributable to the published efforts of Svensk Kärnbränslehantering AB
(SKB) and its collaborators from Canada, Finland, France, Spain, Switzerland, and other
countries.
The KBS-3 concept calls for disposal of used uranium-oxide fuel in sealed copper canisters
(1.05-m diameter) that are emplaced in large-diameter (1.75 m) deposition boreholes drilled into
the floor in access tunnels (5.5-m diameter) approximately 500 m below the surface (Figure 2-5).
Fuel assemblies are positioned inside a canister insert made of cast iron (Figure 2-6). The space
between the canister and borehole walls is filled with a low-permeability buffer material
containing bentonite or other swelling clay emplaced initially in its dry, compacted form. In the
original KBS-3 concept the boreholes are vertical and extend approximately 7.8 m into the floor
of the access tunnel (Figure 2-5). As an alternative, the Finnish and Swedish programs are also
considering a design (KBS-3H) in which multiple waste canisters are emplaced with buffer
material in horizontal boreholes drilled into tunnel walls; however, further research is needed to
fully resolve critical technological issues (SKB 2011, Section 1.1.1; Posiva 2010).
The KBS-3 concept has been further developed and refined since originally proposed, and key
aspects have been tested in the laboratory and in situ at scales up to full scale. As currently
described (SKB 2006d, Section 4.1.1), the EBS includes the waste form, insert and canister,
buffer, bottom plates in deposition holes, access tunnel and its backfill, other openings with
backfill, and repository plugs and seals.

32
Figure 2-5. Schematic of KBS-3 Vertical Emplacement Concept (from SKB (2006d), Figure 4-4).
The relative performance of the EBS in a repository in crystalline rock depends on the geologic
setting. The KBS-3 concept is being developed for Scandinavian sites where the geologic
settings involve sub-sea hydrologic conditions, host rock formations containing chemically
reducing mineralization, and a set of future events and processes particular to the setting. Note
also that Sweden has deployed interim storage at a centralized used-fuel storage facility, which
limits waste heat output at the time of disposal in the repository and is a basic component of the
management system.

33
Figure 2-6. Schematic of Copper Canister and Cast-Iron Insert, as Intended for Boiling Water Reactor (BWR) Used Fuel in the KBS-3 Concept (from SKB (2006d), Figure 4-5).
As discussed below, a general concept of operations has been proposed that uses clay buffer
material as a principal element of the EBS and that could be combined with natural barrier
performance in a range of geologic settings. Thus, the KBS-3 concept may be appropriate for
direct application to a repository in the U.S., or it may be modified to reflect local site conditions
and particular future events and processes.
A variant of the KBS-3 concept was proposed by McKinley, Apted, and others as a practical
method to achieve optimal waste isolation in fractured, hydraulically saturated, geologic media
(McKinley 1997; Apted 1998; McKinley et al. 2000). The prefabricated EBS modular (PEM)
concept relies on radial layers of pure bentonite and sand-bentonite buffer materials surrounding
a HLW package. The components are assembled and sealed in a thin-walled metal envelope for
handling, transport to the repository, and direct emplacement in underground drifts. Swelling of
the clay buffer follows failure of the metal envelope, generally from corrosion. Considerable cost
savings are possible using a simple design with common materials and prefabrication.
Development of the concept continues to the present (McKinley et al. 2006). The concept is
applicable to waste disposal in various media in the U.S. including crystalline rock.

34
The following discussion focuses on the Swedish KBS-3 vertical emplacement concept because
of the extensive analysis and literature available.
2.4.1. Functional Description of EBS The following description was provided for the SR-Can preliminary safety assessment (SKB
2006d; SKB 2006a) unless otherwise noted. The EBS components described include the waste
form, canister and insert, buffer, bottom plates in deposition holes, access tunnel and its backfill,
other openings with backfill, and repository plugs and seals.
Waste Form – Uranium oxide (UOX) or mixed-oxide (MOX) fuels are metal-clad
ceramic materials providing mechanical integrity and limited rates of waste form
degradation. UOX and MOX fuels retain uranium and other actinides in reduced valence,
which limits metal solubility within the EBS while redox potential is low and in reducing
groundwater.
Canister/Insert – The canister and insert facilitate handling of used fuel in the repository
(Figure 2-6). They provide part of the radiation shielding needed to protect personnel
during repository operations, and they dissipate waste heat. Copper and cast iron
materials are chemically compatible with the waste form, buffer, and other EBS
materials, and they exhibit simple and readily predictable corrosion modes and rates.
Both corrode slowly under reducing conditions.
Buffer – The principal buffer function is to limit the transport of aqueous solutes between
the waste package and the geosphere. Molecular diffusion is the dominant transport
process. For many radionuclides and other solutes, transport through the buffer is further
limited by adsorption. The buffer material contains expansive clay as a major constituent
and is emplaced in the compacted, dry state. Buffer swelling and transport performance
are only slightly or moderately sensitive to temperature and saline solutions (i.e.,
seawater). Buffer performance is insensitive to the presence of microbes or to microbial
activity. Once hydrated the buffer not only limits outward transport but also limits the
rates of inward transport of dissolved reactants that control degradation of the canister
and its contents (Section 2.4.2).
Bottom Plates – The bottom of each deposition hole is leveled using cast-in-place
concrete (low pH cement). The plates provide structural support and centering for
installation of the buffer and canisters and a sump for collecting and removing water. The
plates can be isolated from much of the buffer by a thin sheet of inert material such as
copper.
Access Tunnel Backfill – Backfill in the access tunnels serves two major functions:
mechanical constraint of the swelling buffer in deposition boreholes and limited aqueous
transport of radionuclides. Mechanical constraint is provided by controlling backfill
composition and compaction at installation. Limited aqueous transport is provided by
controlling backfill transmissivity so that it is similar to the host rock. Also, the backfill is
intended to swell to fill any voids present at its installation and to apply pressure to the
disturbed rock zone around the tunnel opening to limit permeability to fracture flow.

35
Other Openings, Backfill, and Seals – Backfill and seals in other parts of the repository
limit aqueous transport of radionuclides by controlling both inflow and outflow. Seals
and plugs control hydraulics at key interfaces or intersections in the facility while
limiting permeability of the disturbed rock zone and providing structural support to the
access tunnel backfill. The design approach for shaft and drift seals would be similar to
that used for the WIPP (Hansen and Knowles 2000).
2.4.2. EBS Performance
This discussion focuses on the processes that both support and degrade the EBS functions
described above. Much of the information for clay buffer processes is from the SR-Can
assessment (SKB 2006d; SKB 2006a) unless noted otherwise. This description supports the
discussion of FEPs in Section 3.
Buffer Swelling and Mass Distribution – The processes that control buffer swelling and mass
distribution are fundamental to EBS performance. During initial hydration there is a strong water
potential gradient between liquid groundwater and the buffer in its initial state. Before hydration
the buffer is unsaturated and has high bulk permeability. The buffer hydrates non-uniformly
along joints between the blocks of compacted clay and thus is likely to retain trapped air. Over
time the buffer achieves a more uniform state of hydration, in part because swelling pressure
displaces clay and water into less hydrated parts. Trapped air eventually dissolves in the buffer
pore fluid at the hydrostatic groundwater pressure associated with repository depth.
Buffer material could exhibit, or has been described as exhibiting, stages of deformation as it
hydrates and adjusts to in situ mechanical and hydrologic conditions: primary (pore pressure
controlled), secondary (volumetric creep of the clay framework), and tertiary deformation in
which the clay softens in response to deviatoric stress. The buffer can deform to adjust to small
movements of the waste package or of the host rock.
Mechanical pressure effects during buffer hydration and swelling may contribute to formation of
voids (piping) and may also displace waste canisters in addition to loading them by external
pressure. Upward displacement of clay buffer material may occur within the annulus around the
canister and into the overlying access tunnel backfill. Buffer material may also extrude into
fractures, possibly contributing to erosion if the extruded material is exposed to flowing
groundwater. Pressure in the buffer may displace rock wedges bounded by the borehole wall and
natural fractures into the overlying tunnel backfill. Thermal excursions of buffer material pore
pressure are potentially significant when the buffer is fully saturated if drainage from the buffer
is impeded (which is unlikely in fractured rock with direct communication to the overlying
access tunnel backfill). Each of these effects from swelling has been evaluated by simulation or
empirical testing and is accommodated in the design, typically by ensuring that the buffer has
sufficient saturated density. Swelling pressure has no significant effect on the waste canisters.
Apparent buoyancy of canisters may be caused by higher buffer density and swelling pressure
below the canister than above (even though the canister has greater bulk density than the
hydrated buffer). Because volumetric creep is likely to be maximal under the canisters and its
potential rate is considered to be no greater than deviatoric creep observed in laboratory tests, the

36
corresponding displacement of the canister throughout the period of repository performance is
anticipated to be insignificant to waste isolation.
Eventually the canisters will fail due to corrosion after hundreds of thousands or millions of
years (SKB 2006d, Section 9.4.9), and buffer material could extrude directly into the failed
canisters. The impact on buffer performance is considered insignificant due to limited internal
canister void volume and because of the increased volume occupied by corrosion products from
the cast iron insert. Corrosion products from degradation of the canister, insert, or waste will
expand against the buffer, increasing the effective swelling pressure.
The foregoing discussion is equally applicable when the buffer is hydrated or otherwise exposed
to fresh groundwater, seawater, or high-Ca water (such as could be leached from cement). High
salinity or high-Ca pore water can reduce swelling pressure and increase hydraulic conductivity,
but this is significant to buffer performance only for saturated density less than approximately
1,800 kg m-3
.
The current understanding of clay buffer phenomenology is based on extensive laboratory and in
situ testing (Stripa Buffer Mass Test, Aspö tests, FEBEX test in Switzerland). Long-term, full-
scale tests are presently underway to challenge and confirm the current understanding of clay
buffer evolution.
Piping and Erosion – The possibility that voids in the buffer may form and connect (i.e., piping)
during initial hydration is controlled by competition among the rates for contributing processes:
buffer swelling, development of groundwater pressure, and erosion of the buffer material by
flow. Analysis has shown that for the likely range of water inflow rates, the rate of swelling is
sufficient to prevent piping.
Piping eventually terminates from swelling pressure, but erosion may be continuous. Erosion of
smectite at the buffer-groundwater interface may be possible if the concentration of divalent
cations is less than 1 mM (See discussion of glaciations, Section 2.4.3.). The performance impact
of erosion has been evaluated using the metric of buffer mass removed, and up to 100 kg may be
lost per canister without degrading buffer performance. Even if more were lost, advective
transport conditions would not necessarily prevail in the buffer (SKB 2006d, Section 9.3.9).
Piping and erosion are currently under investigation in the Prototype Repository long-term test
(Sweden).
Gas Generation and Escape – Corrosion of the canister and insert could potentially produce
enough hydrogen and other gases to create a reservoir of gas at sufficient pressure to penetrate
the buffer episodically. The process for associated aqueous release of radionuclides involves
failure of the bottom of the canister, gas pressure build-up within the canister due to corrosion of
the cast-iron insert, and expulsion of collected liquid from the bottom when the gas pressure
exceeds the buffer swelling pressure. Such pressure release is phenomenologically complex and
is understood mainly from small-scale lab investigations. Analysis shows that such events would
be episodic with little water released, and re-sealing of the buffer would occur between events.
Increased gas pressure is most likely to occur from corrosion of the cast iron insert and would be
expressed on both the inside and outside of affected canisters. Yet to be evaluated is the use of

37
more corrosion resistant materials (e.g., stainless steels) for the canister or its internals to slow
the rate of gas production to that which could diffuse through the buffer.
Canister and Insert Corrosion – The copper canister can corrode from exposure to oxygen
initially present in the buffer or in groundwater, from radiolytic acid species, and from hydrogen
sulfide formed from the dissolution of pyrite in the buffer or host rock. Potential corrosion
damage from these effects has been evaluated, mainly from mass balance and buffer transport
considerations, and found to be minor (SKB 2006d, Section 10.6). Canister corrosion could
proceed most rapidly in the unlikely condition that buffer failure exposes the canister directly to
oxygenated or sulfide-containing groundwater. Even under such conditions, corrosion would be
slow and canister penetration would not be significant for at least 100,000 years (SKB 2006d,
Section 9.4.9). The insert would corrode once the canister wall is penetrated and would limit the
availability of oxidizing species that contribute to radionuclide solubility and mobility
Radionuclide and Colloid Transport – Advective aqueous transport of radionuclides in the
clay buffer is negligible for hydraulic conductivity less than 10–12
m s-1
. For this condition
transport is dominated by diffusion with a margin on the order of two orders of magnitude.
Diffusive transport is readily represented using known ranges for species-specific diffusion
coefficients (Section 2.5.4). Ion exchange for cations (interlayer sites) and surface complexation
(edge sites, oxyanions, etc.) are the predominant mechanisms for adsorption. Radionuclide
adsorption in the clay buffer can be represented using system-relevant, species-specific
distribution coefficients (Section 2.5.3).
Buffer swelling reduces pore size and homogenizes the pore size distribution (for volumetrically
constrained swelling). This reduces colloid mobility to the point where a saturated density
criterion (1,650 kg m-3
; SKB (2006a, Section 1.7)) substantially eliminates potential colloid
transport.
The composition of water that initially permeates the buffer affects the composition of buffer
pore water and the chemical conditions for transport. Thus, speciation and solubility for
radionuclides in the buffer are affected by the initial clay composition and the composition of
groundwater that causes initial hydration.
Surface diffusion (enhanced relative to calculated apparent bulk diffusion using system-relevant
adsorption data) is observed for some cations. The concept is that increased cation concentrations
in the surface layer allow increased concentration gradients. Also, if adsorption decreases due to
reduced availability of adsorption sites, a similar result to enhanced diffusion could be observed.
Surface diffusion is converse behavior to anion exclusion whereby anion concentrations are
decreased in the double layer so that anion concentration gradients are also decreased. Anion
exclusion is potentially important to waste isolation performance for non-sorbed anionic species
(iodide, selenium oxyanions, etc.). Anion exclusion has been associated with dry bentonite
density in the range 1,200 to 1,500 kg m-3
or greater. At higher ionic strength it is less important
because the controlling dimension of the electrical double layer is decreased.
Alteration of Buffer Clay – Illitization may be important if there is sufficient K+ introduced
during hydration along with environmental conditions (e.g., temperature) favoring reaction. In

38
general, illitization has been found to be an insignificant prospect because of the limited
availability of K+ and the limited temperature (<150C) and duration of the thermal period.
Alteration of Buffer Accessory Phases – Other materials or minerals present in the clay buffer
in potentially significant amounts include carbonate, pyrite, and organic matter. Carbonate
controls the pH, while pyrite and organic matter, if present, control redox potential. Buffered
(near-neutral) pH and reducing conditions favor slow canister corrosion and decreased
radionuclide mobility.
The presence of silica and its dissolution and precipitation may be important to buffer
performance because cementation can result. Cementation decreases swelling pressure and
increases rigidity, which may promote formation of voids or fractures. Source minerals for silica
include feldspar and quartz. The existence of natural clays for millions of years in situ without
cementation or other degradation indicates that buffer cementation will not be important at least
for ambient temperature conditions. During the thermal period, prograde silica solubility and
faster dissolution of source minerals may increase cementation in colder regions. However, the
limited duration of elevated temperature and the availability of water for reaction and transport
probably limit the importance of thermally driven silica cementation. Cementation in the buffer
is an important uncertainty associated with EBS performance.
Backfill Characteristics – Backfill may be composed of a mixture of crushed rock and clay
material with as little as 30% clay. The thermal, hydrologic, and rheological properties of such a
mixture differ from the clay buffer. Swelling response is less than a pure clay because the
achievable density of the clay fraction is less and the backfill contains larger particles and thus
larger pores. The sensitivity of clay properties (and thus bulk properties) to the effects of salinity,
inhomogeneity, etc., is greater. Similar observations are likely if the backfill is selected to be an
unmixed, clay-rich geologic material. The SR-Can assessment assumes that backfill will have
hydraulic conductivity no greater than that of the host rock, or <10–10
m s-1
. Because this value is
larger than the threshold of 10–12
m s-1
for diffusion-dominated transport in the buffer,
radionuclide transport in the backfill may occur by advection as well as diffusion.
Piping and erosion of the backfill during initial saturation affect flow properties locally because
of the amount of water involved to resaturate the entire drift from a few points of water entry.
However, these channels are expected to heal when full saturation is reached. Depending on the
backfill material selected, the maximum swelling pressure may be less than the hydraulic
pressure driving water inflow, especially during early stages of saturation, and piping may result.
Backfill homogeneity is an objective in drift construction and sealing but difficult to control in
practice due to variations in settlement and compaction that can lead to flow channeling.
2.4.3. Events That Impact EBS Performance Application of the KBS-3 disposal concept in northern latitudes where Pleistocene glaciation
occurred, presents the likelihood that a glacial climate will return during the repository
performance period. Return of continental glaciers is part of the expected future in the SR-Can
assessment (SKB 2006d, Section 9.4). The associated and potential impacts on the EBS include
decreased temperature and the possibility of freezing;

39
larger hydraulic gradient, increased flow velocity, and increased hydrostatic pressure on
the canisters due to surface relief;
deep penetration of melt water;
erosion of the clay gel by low-salinity groundwater (fresher than seawater, and in
particular, less concentrated in divalent cations) and transport of clay away from the
buffer; and
faulting and fracturing caused by the increase in groundwater pore pressure and the
isostatic response of the lithosphere to glacial loading.
Freezing of pore water in clay will not occur at temperatures above approximately -5C because
of the reduced activity of water in the electrical double layers adjacent to clay crystal sheets
(SKB 2006d, Sections 9.4.3 through 9.4.8). The possibility that this temperature limit would be
reached is insignificant because of the repository depth.
The hydraulic effects from a kilometer or more of glacial surface relief would affect flow
conditions and the chemistry of groundwater; however, the residual effects on the hydraulic
structure and mineralization of the aquifers would be limited to present-day conditions (which
have resulted from more than two million years of Pleistocene exposure). The effects would be at
maximum during glacial advance or retreat when the ice margin is in the repository vicinity. The
potential for buffer failure due to erosion by low-salinity groundwater and mobilization of
radionuclides in a relatively oxidizing environment are evaluated in detail in the SR-Can
assessment (SKB 2006d, Sections 9.4.6 through 9.4.8).
Faulting will likely occur along existing discontinuities, especially those which responded to
previous glacial loading and unloading. These discontinuities would be mapped and avoided
during repository development. Some new faulting would be expected in response to glaciation;
however, the displacements likely to occur on new faults would likely be much smaller than on
existing faults. A similar finding was reached for displacements on “unknown” faults in the
Yucca Mountain repository block (Gross 2007, Section 6.11). Given the buffer thickness (0.35 m
on the radius; Figure 2-5) displacements of less than 10 cm are not expected to cause canister
failure nor significantly disrupt buffer function. The likelihood of new faults with greater than 10
cm displacement, intersecting vertically emplaced waste packages, would likely be insignificant
(SKB 2006d, Sections 9.4.5). Probabilistic treatment of existing fracture zones in the Forsmark
region yields estimates in the range of 0.001 to 0.04 for the mean number of canisters damaged
during the initial 120,000 year glacial cycle in a worst case seismic event in which all 6,000
waste canisters are unsuitably positioned.
2.5. Flow and Transport
The flow of groundwater affects the performance of engineered barriers and the transport of
released radionuclides. Should a waste package fail, radionuclides would be released to the
groundwater, the primary medium for radionuclide transport from the repository to the
biosphere. This section focuses on groundwater flow and the processes related to radionuclide
transport.

40
2.5.1. Groundwater Flow
The major parameters affecting groundwater flow are captured in Darcy’s Law,
(Eq. 2-1)
where is the specific flux (m s-1
), is the hydraulic conductivity (m s-1
), and is the
hydraulic gradient. Specific flux is the volumetric flux (m3 s
-1) divided by the bulk cross-
sectional area (m2). Hydraulic conductivity is a lumped parameter related to the permeability of
the porous medium, fluid density, and fluid dynamic viscosity (Freeze and Cherry 1979, p. 27).
For a saturated clay buffer, is less than 10–12
m s-1
(Section 2.4.2). The low hydraulic
conductivity is primarily due to the small pore size distribution and high tortuosity of the flow
path. The porosity of the clay buffer (0.4 to 0.5) implies that the mean pore velocity is limited to
approximately twice the value of the specific flux, which is a key reason that diffusion controls
solute transport through the clay.
For granite at depths of at least 400 m, is commonly in the range of 10–10
to 10–13
m s-1
(Table
1-3). Sparsely fractured granite at this depth can have flow (kinematic) porosities on the order of
10–4
and diffusion porosities on the order of 10–3
(Posiva 2008a; SKB 2006b). The flow porosity
is the volume through which water flows relative to the bulk volume of rock. For granite,
essentially all flow occurs through interconnected fractures. The much larger diffusion porosity
in granite consists of both matrix and dead-end fracture porosity connected to the flow porosity.
The extremely low flow porosity of deep granite causes the velocity of water in the
interconnected fractures to be orders of magnitude higher than the specific flux. Consequently,
advection may dominate solute transport in the flow porosity while diffusion dominates transport
in the diffusion porosity (Section 2.5.2).
Based on the low hydraulic conductivity of granite host rock and the likely low hydraulic
gradient in the vicinity of a well-sited repository, groundwater flow at repository depth would be
quite limited. Transmissive fractures at this depth may have an average spacing of more than 100
m as found at Forsmark (SKB 2011, Section S2.2). As a result, complete resaturation of the
backfill and buffer after repository closure may not occur for hundreds or thousands of years
(SKB 2011, Section S4.1). Although capillary and osmotic processes would help to saturate the
clay buffer, the low hydraulic conductivity of the buffer would inhibit the flow of water
contacting the waste packages.
2.5.2. Radionuclide Transport
One-dimensional radionuclide transport through porous media with sorption and decay is
described by the following equation (de Marsily 1986, Equation 10.3.3; Schwartz and Zhang
2003, Equation 23.27)
(Eq. 2-2)

41
where
= aqueous radionuclide concentration (mg L-1
)
= average groundwater velocity (m yr-1
)
= coefficient of hydrodynamic dispersion (m2 yr
-1)
= retardation factor
= radioactive decay constant (yr-1
).
The retardation factor incorporates adsorption effects, and the coefficient of hydrodynamic
dispersion incorporates mixing and diffusion. These coefficients are addressed in Sections 2.5.3
and 2.5.4.
Eq. 2-2 describes solute transport through a porous medium represented as a single continuum.
To model transport in a dual porosity medium, such as fractured granite, a dual porosity
approach is typically taken. Transport through interconnected fractures is generally dominated by
advection while transport into the connected diffusion porosity is dominated by diffusion. In
each domain, the same equation (Eq. 2-2) applies, but the values of the parameters may differ
widely. In particular, the value of within the diffusion porosity is zero, and the value of is
reduced to the molecular diffusion component (Section 2.5.4).
In fractured granite, the diffusion porosity acts to retard solutes relative to solute velocities
within the flow porosity. This diffusion-related retardation effect applies to the transport of both
sorbing and non-sorbing solutes. Thus, for a fractured granite with a flow porosity of 10–4
and a
diffusion porosity of 10–3
(as assumed for the sparsely fractured granite in the safety analysis
presented in Section 4), solutes would spend an average of ten times as much time within the
stagnant domain of the diffusion porosity than within the flow porosity (assuming the solutes are
non-sorbing or equally retarded by adsorption within each domain).
Radionuclides associated with colloids add further complexity to the set of transport equations.
The transport of colloids differs from the transport of aqueous species because it is affected by
additional processes associated with pore-size exclusion, filtration, straining, and colloid
stability. The effects of these processes can facilitate or retard overall radionuclide transport. For
this report, colloidal transport is not simulated. The saturation density of the clay buffer is
expected to prevent colloid transport through the buffer (Section 2.4.2), and the high salinity of
the groundwater is expected to significantly limit colloid stability in the granite host rock (Buck
and Sassani 2007, Section 6.3.9). However, because dilute groundwater could potentially
penetrate to repository depths (for example, under the extreme conditions potentially imposed by
the retreat of an ice sheet), and because the stability, behavior, and generation of potential
colloids are highly dependent on local conditions, colloidal transport would need to be
considered thoroughly in a site-specific performance assessment.

42
2.5.3. Radionuclide Adsorption
The retardation factor is the ratio of the average velocity of water relative to the average
velocity of the solute. If the extent of sorption is independent of solute concentration (i.e., linear
sorption), the retardation factor may be described by
(Eq. 2-3)
where is a conditional distribution coefficient describing the extent of adsorption and and
are the dry bulk density and connected volumetric water content of the porous medium,
respectively. The distribution coefficient is conditional because its value is affected by the type
of immobile solid sorbent, sorbent specific surface area, temperature, pH, redox conditions, ionic
strength, and concentrations of other solutes.
Adsorption of radionuclides to corrosion products, buffer materials, granite surfaces, and
secondary fracture minerals has the potential to significantly retard the transport of radionuclides
relative to water. For many radionuclides, adsorption would be enhanced by the prevailing
reducing conditions.
Table 2-2 lists a set of distribution coefficients for radioelement adsorption onto bentonite under
reducing conditions in the presence of groundwater similar to the compositions in Table 2-1. In
addition to redox conditions, the adsorption of many of these radionuclides onto bentonite or
montmorillonite depends heavily on ionic strength and/or pH. The values in this table indicate
that many radionuclides would be strongly retarded by the buffer. For bentonite having a dry
bulk density of 1,600 kg m-3
and porosity of 0.44, a solute with a value of 1.0 m3 kg
-1, such as
Pu, would have a retardation factor of 3,600. Although transport through the bentonite would be
dominated by diffusion rather than advection, this calculation implies that approximately
1/3,600th
of the Pu in the bentonite would be aqueous and able to diffuse at any given moment.
Based on the values in Table 2-2, adsorption to the bentonite buffer would significantly delay
the release of many radionuclides from the EBS.
Adsorption in near-field and far-field granite occurs on fracture walls, fracture minerals, and in
the granite matrix. Table 2-3 lists distribution coefficients adopted by the Finnish repository
program for modeling adsorption in the far-field granite at Olkiluoto. These values are based on
laboratory measurements and consider the site-specific rock types, fracture minerals, and
estimated dilute/brackish groundwater composition in the geosphere. Values for Sb and Pb
shown in Table 2-3 were not included in the Finnish study but were obtained from the granite
adsorption experiments of Ikeda and Amaya (1998) taking into account similar chemical
conditions.

43
Table 2-2. Selected Bentonite kd Values for the Chemical Conditions of a Generic Granite Repository.
Element kd (m3 kg
-1) Source/Notes
Ac a 10 Baston et al. (1999), see Am
Am 10 Ikeda and Amaya (1998) (high μ,b pH 5-10, Eh -220 mV)
C, Cl 0 Adsorption low, assumed non-sorbing
Cm 10 Baston et al. (1999)
Cs 0.1 Mucciardi et al. (1979) (montmorillonite, high μ, high Ca, pH 7-9.3)
I 0 Mucciardi et al. (1979) (montmorillonite, high μ, high Ca, pH 7.4-8.4)
Nb 3 Ikeda and Amaya (1998); Erdal (1977); Taki and Hata (1991)
Np, Pa a 0.1
Kitamura et al. (2002); Ashida et al. (1999) (pH 8-9, Eh -550 to -400 mV, μ =1M)
Pb 10 Ulrich and Degueldre (1993); Ikeda and Amaya (1998) (high μ, pH 5-8.5)
Pd 3 Tachi et al. (1999b)
Pu 1 Mucciardi et al. (1979); Ames et al. (1981) (high μ, pH 7-9)
Ra 1 Tachi and Shibutani (1999) for solution/solid ratio > 100; Ames et al. (1983)
Sb 0.1 Ikeda and Amaya (1998) (low Eh, high μ, bentonite)
Se 0.03 Tachi et al. (1999a)
Sn 30 Oda et al. (1999) (depends on pH)
Sr 0.01 Mucciardi et al. (1979) (bentonite, high μ, high Ca)
Tc 10 Baston et al. (1999) (high μ, high Na, high Ca, Eh ~ -400 mV, pH 8-10)
Th 3 Baston et al. (1991); Ueta (1998) (high μ)
U 10 Baston et al. (1999) (high μ, high Na, high Ca, Eh ~ -400 mV, pH 8-10)
Zr 30 Rancon and Rochon (1979) (depends on pH)
a kd values for Ac are set equal to those of chemically similar Am. kd values for Pa are set equal to those of chemically similar Np.
b ionic strength

44
Table 2-3. Granite Matrix kd Values Used in Posiva (2010, Table 6-9) for Dilute/Brackish Groundwater.
Element kd (m3 kg
-1)
C, Cl, I 0
Se 0.0005
Pd, Sn 0.001
Sr 0.005
Nb 0.02
Am, Cm, Ac a 0.04
Pa, Tc, Cs 0.05
Sb 0.1 b
U 0.1
Np, Th, Ra, Zr 0.2
Pu
0.5
Pb 1 b
a kd values for Ac are set equal to those of chemically similar Am.
b Ikeda and Amaya (1998)
2.5.4. Radionuclide Dispersion
The coefficient of hydrodynamic dispersion captures the effects of mechanical mixing and
molecular diffusion and is calculated from the equation
(Eq. 2-4)
where is the longitudinal dispersivity (m) and is the pore diffusivity (m2 yr
-1), which is
also known as the bulk diffusion coefficient. The first term in Eq. 2-4 is the mechanical
component and the second term is the molecular diffusion component. is a function of the
solute diffusivity in aqueous solution (m2 yr
-1) and the geometry of the pores. The
relationship used in this study is
(Eq. 2-5)

45
where is constrictivity and is tortuosity (Ochs et al. 1998).1 Like , does not include the
effects of adsorption. For experimental measurements of diffusivity in porous media, is
determined from the relationship
(Eq. 2-6)
where is the measured apparent diffusion coefficient, which includes the effects of
adsorption. Values of and reported or used by the Swedish repository program for
bentonite are given in Table 2-4.
Table 2-4. Diffusivity Values for Free Aqueous Solution and Saturated Bentonite.
Element Dw × 108 (m
2 s
-1) a Da × 10
12 (m
2 s
-1)
Bentonite b
C 1.2
Cl 2
Cs 2.1 2 – 5 1.4
c
I 0.83 86 – 87
Ra 0.89
Sr 0.79 10.5 – 14
Th 0.15
All other radionuclides 1
a SKB (2006b, Table A-40)
b SKB (2003a, Section 6.3)
c Ochs et al. (1998, Figure 1a)
2.5.5. Radionuclide Solubility
An important control for the release and transport of radionuclides is aqueous solubility.
PHREEQC version 2.14.2 and the thermo.com.V8.R6.230 database from Lawrence Livermore
National Laboratories were used to estimate radionuclide solubility for Am, Np, Pu, Ra, Sb, Se,
Sn, Tc, Th, and U for the general chemical conditions in granite at depth.
1 Other common formulations of this equation have a single variable or ω in place of the ratio
.

46
Based on the concentrations of Na, Ca, and Cl in the groundwater samples in Table 2-1, a
brackish Na-Ca-Cl groundwater with a general recipe of 0.3 M NaCl, 0.05 M CaCl2, and 0.001
M Na2SO4 was assumed in the calculations. Interaction with bentonite is not expected to alter
this composition significantly except for some depletion of Ca due to ion exchange with Na
(Posiva 2007, Section 3.2.2). Reducing conditions in this generic groundwater were defined
based on the relative concentrations of sulfate and sulfide anticipated at the repository level. By
fixing the hydrogen partial pressure at 10–7
atm (implying an equilibrium oxygen partial pressure
of essentially zero [10–69
atm at 25°C]), aqueous sulfate and sulfide concentrations were
calculated within the ranges of data presented in Table 2-1. This constraint sets the Eh in the
calculations to approximately -240 mV at pH 7.5 versus the standard hydrogen electrode.
Because failure of the waste canister is generally expected to occur long after the thermal period,
the temperature of the generic groundwater was set at 25°C. Ambient temperatures at repository
depths at Olkiluoto, Forsmark, and Laxemar are between 10 and 15°C (Posiva 2010, Section 4.3;
SKB 2006d, Table 9-4).
For radioelements whose solubility is likely limited by hydrolysis products, less soluble oxide
phases were generally avoided in favor of more soluble hydroxide or hydrated phases. For
uranium, uraninite (UO2) was assumed to be the solubility-controlling phase because of its
presence in the waste form. This treatment is consistent with a natural analogue study of uranium
fixation in a Tertiary argillite (Havlova et al. 2006).
The pH of waters in granite systems tends to be neutral to slightly alkaline (Table 2-1). A
bentonite buffer material surrounding the waste packages is not expected to significantly change
the pH in the vicinity of the waste package. Bentonite contains calcite and a high density of
surface exchange sites, each of which act to buffer pH in the slightly alkaline range (Posiva
2007, Section 3.2.2).
Results of the solubility calculations are shown in Table 2-5. These calculations assume a pH of
7.5. Higher pH values up to at least 8.5 reduce calculated solubilities or have no effect. The
calculations at pH 7.5 are within a factor of 10, or greater than a factor of 10, of the values
adopted in Posiva (2010, Table 1-9) (Sb was not evaluated in that report.). For the transport
modeling in Section 4, Ac and Cm were assumed analogous to Am, and Pa was assumed
analogous to Np. Solubility values for Nb, Pd, and Zr are from Posiva (2010, Table 1-9).
Because uraninite is the stable uranium phase in the waste form, and the solubility of uraninite
under reducing conditions is low (4 10−10
M in this case), waste form degradation rates are also
low under reducing conditions (on the order of 10–7
yr-1
; Posiva (2010, Section 1.4.6)). This
implies that the release of actinides and fission products from the waste form may be so low that
their aqueous concentrations may never be limited by solubility.
No limiting concentrations are presented in Table 2-5 for C, Cs, I, Sr, and Pb. The concentrations
of these radioelements are expected to be controlled by their inventories, instant release
fractions, and/or the slow dissolution rates of the waste forms (Section 4). Actual solubilities of
these elements are moderate to high in this chemical environment.

47
Table 2-5. Radionuclide Solubilities Calculated at T = 25°C, pH 7.5.
Radioelement Solubility-Limiting
Phase
Dissolved Concentration
a
(mol L-1
) Notes
Am (Ac, Cm) Am(OH)3 6 10−6
Ac and Cm are assumed analogous to Am
Np (Pa) Np(OH)4 1 10−9
Pa is assumed analogous to Np
Nb Nb(OH)5 4 10−5
Posiva (2010, Table 1-9)
Pd Pd(OH)2 3 10−6
Posiva (2010, Table 1-9)
Pu Pu(OH)4 2 10−7
Ra RaSO4 1 10−6
(SO42-
) fixed at 10–3
mol L-1
Sb Sb(OH)3 1 10−7
Se FeSe2
4 10−8
Sn SnO2 3 10−8
Tc TcO2:2H2O(am) 3 10−8
Th Th(OH)4 4 10−7
U UO2 4 10−10
Zr Zr(OH)4 2 10−8
Posiva (2010, Table 1-9)
a Calculated using the PHREEQC code version 2.14.2 and the thermo.com.V8.R6.230 database from Lawrence Livermore National Laboratories, except where noted. The solution assumed 0.3 M NaCl, 0.05 M CaCl2, 10–3
m Na2SO4, and 10–7 atm H2 (g).
2.6. Chronology of Repository Conditions and Events
This section summarizes the expected evolution of the repository over one million years. The
general framework of this section, and many of the noted events and expected behaviors, are
taken from Gierszewski et al. (2004, Section 6.3). Their summary is taken from the description
of the Base Scenario provided in McMurry et al. (2003), which includes justification, references
and discussion of uncertainties. Additional information in the sections below originate from
calculations specific to this report and from reports issued by the Swedish and Finnish programs.
2.6.1. 0 to 100 Years
Repository tunnels, rooms, and/or emplacement boreholes would be excavated during a period of
approximately 30 years. An excavation damage zone (EDZ) would form within a few tens of
centimeters of these excavations but would not form a continuous pathway for water movement
(SKB 2006d, Section 9.2.2). Waste packages would be emplaced and surrounded by clay buffer.
Emplacement tunnels or rooms would be backfilled and sealed, but access tunnels would remain

48
open. Monitoring would continue until repository closure at 100 years or beyond. During the
period of operations and monitoring:
Total radioactivity in individual waste packages would decrease as indicated in Figure
2-1 (UNF), Figure 2-2 (DOE HLW), and Figure 2-3 (reprocessing HLW). Waste package
thermal power would decrease commensurate with decreases in radioactivity.
Temperatures within the repository would peak (less than 100°C by design) and begin to
decline (SKB 2006d, Section 9.3.4; Posiva 2006, Section 6.1.1).
The initially low hydraulic pressures in the tunnels and clay buffer would induce water
migration toward the waste packages. The clay buffer would swell as it hydrates.
Minor corrosion of the copper canisters would occur due to the presence of oxygen. After
backfilling, the oxygen would be limited; thus, copper corrosion by direct reaction with
oxygen would be limited to a few tens of micrometers (SKB 2006d, Section 9.2.5; Posiva
2006, Section 6.4).
Heat from the waste packages would warm the compacted clay buffer from the inside
out. Any water vapor produced by evaporation near the waste package would condense
further away where temperatures would be cooler. Hydration would thereby proceed
inward.
A small increase in alkalinity could result from groundwater interaction with cements and
concrete, but the effects would be negligible (SKB 2006d, Section 9.2.7).
Microbes would consume any stray organic materials, either aerobically in the presence
of oxygen or perhaps by sulfate reduction (SKB 2006d, Section 9.2.7). Microbial activity
would be inhibited within the hydrated clay buffer by lack of nutrients, swelling pressure,
and the attendant small pore size.
2.6.2. 100 to 1,000 Years
At approximately 100 years, the repository would likely be closed and all access tunnels and
shafts would be backfilled and sealed. Large thermal, hydraulic, chemical, and mechanical
gradients would slowly dissipate as heat, water, and solutes disperse and swelling of the buffer
helps to redistribute rock stresses.
Temperatures in the repository would decline but remain elevated (SKB 2006d, Section
9.3.4).
Air in the repository would be replaced by water.
Oxygen in the pore space would be consumed by organic and inorganic processes.
Reducing conditions would be established throughout the repository.

49
Buffer material surrounding the waste packages and mixed into the backfill would swell
as it hydrates, distributing loads across repository components and preventing spalling.
Loads from the surrounding rock would be transmitted through the backfill and buffer
onto the container. These loads would be high enough to compress the copper canister
onto the steel inner vessel but too low to deform the inner vessel. They would also be
high enough to eliminate microbes and prevent canister sinking (SKB 2006d, Section
9.3.9; Posiva 2006, Section 6.1.2).
Reducing conditions would significantly limit corrosion rates.
2.6.3. 1,000 to 10,000 Years
The large gradients of the first one thousand years would continue to dissipate but more slowly
as the geosphere absorbs and disperses the effects of the repository.
Temperatures in the repository would slowly decline and level off at near ambient values
near the end of this period (SKB 2006d, Section 9.3.4; Posiva 2006, Section 6.4).
Cementitious seals and plugs would degrade allowing new flow pathways to develop
(Posiva 2006, Section 6.4).
The hydrated buffer material surrounding the waste packages would prevent significant
advection of water, dissolved solutes, and colloids through the buffer.
Corrosion of the copper canister would be limited by lack of oxygen and a very low flux
of other reactants, most notably hydrogen sulfide, through the hydrated buffer to the
waste package surface (SKB 2006d, Section 9.3.12).
Reaction of groundwater with grout in fractures would raise the pH in these fractures to
approximately 9 (SKB 2006d, Section 9.3.7).
2.6.4. 10,000 to 100,000 Years
From 10,000 to 100,000 years, the thermal pulse would be dispersed and temperatures within the
repository (and within the waste packages) would nearly equal the temperature of the original
host rock (SKB 2006d, Section 9.3.4). By the end of this time interval, the earth could be in the
middle of the next glacial period. Depending on the latitude of the repository, permafrost
followed by an ice sheet or glaciers could advance over the ground surface above the repository.
Some replacement of sodium in the buffer material by calcium from groundwater and by
dissolution of gypsum in the buffer would occur, but the extent would be limited and
would not significantly affect buffer performance.

50
Although permafrost could develop near the surface as the mean surface temperature
decreases, freezing temperatures would not likely reach the repository (SKB 2006d,
Section 9.4.3).
Additional rock stresses, creep deformation, and fracturing around the repository due to
the increased load of a potential glacier or ice sheet would not likely significantly affect
waste package integrity or repository performance (SKB 2006d, Section 9.4.4).
Corrosion of the copper outer barrier would continue to be limited and would not threaten
containment as long as the buffer surrounding the waste package remained intact (SKB
2006d, Section 9.3.13).
If the repository were located in the northern U.S. latitudes, groundwater flow rates at the
repository level would decrease with the onset of permafrost at the ground surface due to
decreasing infiltration. This effect could be counteracted by the presence of glaciers or a
possible ice sheet. If the repository were located in the southern U.S., increased rainfall
could increase the circulation of deep groundwaters.
2.6.5. 100,000 to 1,000,000 Years
Glacial periods could occur on a regular basis during this time interval. Based on ice core data, a
glacial phase has occurred on average every 120,000 years over the past 650,000 years.
However, major changes in ocean circulation, atmospheric composition, or the earth’s crust
could potentially disrupt the glacial cycle.
Waste package thermal power would be insignificant in comparison to the geothermal
flux.
Retreating ice, which could occur multiple times during glacial periods, would enhance
deep circulation of groundwater and could potentially cause the erosion of buffer
materials surrounding waste packages.
Large vertical movements in the host rock could occur as a result of ice loads,
earthquakes, and slow crustal movements. The effects on rock mechanics would occur
mostly at shallow depths, but glacial stresses would be lower than the stresses caused by
excavation. Shear movements along existing fractures intersecting the repository could
cause a small number of canister failures. The probability of such failures is expected to
be low partly due to active avoidance of significant fractures during waste emplacement
(Posiva 2006, Section 8.3.2).
Erosion of buffer during periods of deep groundwater circulation could expose a small
fraction of the waste packages to advective groundwater flow (SKB estimates this
fraction to be 0.004 within the reference evolution of its license application (SKB 2011,
Section 12.2)). This exposure would enhance corrosion rates by allowing a larger influx
of corrosive reactants like hydrogen sulfide. In addition, erosion of the buffer would

51
allow sulfate-reducing bacteria to live near the waste package and generate hydrogen
sulfide from an advective influx of sulfate.
A small number of copper canisters exposed to advective flow (due to buffer erosion)
could fail within one million years. Degradation of the canister insert and the waste form
would begin soon thereafter, and radionuclides would be released from these waste
packages.

52
3. SCENARIOS
A scenario in a repository safety analysis is a hypothetical combination of features, events, and
processes (FEPs) acting upon the facility and its surroundings over time. A PA requires
evaluation of a full set of reasonable scenarios to demonstrate the likely range of repository
performance. Scenarios are developed by reviewing complete lists of FEPs and determining
which FEPs could affect repository performance.
As described in Section 3.1, a FEP screening approach similar to that taken for both the Yucca
Mountain repository and the WIPP is needed to identify potentially important FEPs to be
included in a full PA. The current report does not provide a full PA, but it does discuss scenarios
developed in international programs. Section 3.2 describes the scenarios included in the safety
analysis in Section 4 and how the FEPs were used to define the scenarios.
3.1. Identification of Relevant FEPs
Developing relevant scenarios for a PA involves five basic steps (DOE 2008; DOE 1996): (1)
identification of a list of FEPs potentially relevant to long-term performance of the disposal
system; (2) evaluation of FEPs from this list to determine which to include in the PA and those to
omit; (3) construction of scenarios from included FEPs for further screening or analysis; (4)
selection of scenarios to include in the PA; and (5) implementation and analysis of the scenarios
in the PA. Consistent with the approach taken in 40 CFR 197, it is assumed that the mean annual
dose from a repository in granite will include probability-weighted consequences of releases due
to all significant FEPs and will account for uncertainty associated with those FEPs.
Various programs in the United States and other nations have compiled exhaustive lists of FEPs
for mined geologic disposal of radioactive wastes. For this analysis, the FEP list developed for
the DOE Used Fuel Disposition Campaign (Freeze et al. 2010) was used. This list, developed
from international FEP lists, currently includes 208 FEPs potentially relevant to a wide range of
disposal system alternatives.
Each FEP is evaluated against screening criteria provided in U.S. regulations. Specifically, EPA
standard 40 CFR 197 states that FEPs that have a probability of occurrence lower than 1 in
10,000 over 10,000 years (or an annual probability of occurrence less than one in 108 during the
first 10,000 years after closure) may be excluded from the analysis. FEPs that have higher
probabilities, but do not significantly change the results of long-term PAs, may also be omitted
(40 CFR 197.36(a)(1)). In addition, some potentially relevant FEPs are screened from further
consideration because they are inconsistent with specific aspects of the regulatory requirements.
For example, existing regulations for the WIPP and the Yucca Mountain repository indicate that
PAs should not include consequences of deliberate human acts of sabotage or disruption in the
far future.
Analyses developed for granite repository programs are useful when deciding whether to include
or exclude a FEP. Exclusion of criticality FEPs, for example, is consistent with conclusions
drawn by SKB (2006d, Section 10.3). In addition, analyses developed for other types of
repositories may be useful, as is the case with arguments presented in Brady et al. (2009, Section
4.3.1) justifying the exclusion of criticality FEPs for deep borehole disposal.

53
Each of the 208 FEPs developed in the DOE Used Fuel Disposition Campaign has been
considered (screened) for potential relevance to disposal in granite formations. Table B-1 in
Appendix B summarizes the likely screening decisions for each FEP (whether a FEP is likely to
be included in, or excluded from, a full PA for a granite repository).
3.2. Scenario Selection
Scenarios evaluated in international granite repository PAs typically include a main scenario,
less probable scenarios, and variants of these scenarios. In the main scenario of a recent case
study of the Canadian safety assessment, there are no waste package failures during the
performance period because the canisters and repository perform as designed (Gierszewski et al.
2004, Section 6). In the main scenario of the Swedish PA, waste packages only become breached
when the buffer fails to prevent advective conditions between the waste package and host rock
(SKB 2006d, Section 12.2.2). In these cases, the buffer erodes for a small fraction of waste
packages (< 0.1) due to deep penetration of dilute glacial groundwater (SKB 2006d, Section
12.3.1). Less probable scenarios considered and simulated in Finnish, Swedish, and Canadian
programs include
defective waste package,
canister failure due to shear movement,
buffer emplacement mishaps,
human intrusion, and
gas transport of radionuclides.
Scenarios ruled to be of low consequence or to have negligible probability based on logical
arguments and independent analyses in the Finnish, Swedish, and Canadian programs include
canister failure due to isostatic load from independent or combined forces, including
buffer swelling and glacial overburden (SKB 2006d, Section 12.8.5),
buffer freezing, and
oxygen penetration to the waste package (SKB 2006d, Section 12.11.1).
In a full PA, many processes that might otherwise constitute a scenario are either implicitly
included in the dose calculations or explicitly excluded. For example, flow along the EDZ or
through sealed shafts and backfilled tunnels (e.g., FEPs 2.1.08.03, 2.1.09.51, and 2.2.08.06 in
Appendix B) may not be specified as scenarios in a full PA because two- and three-dimensional
models that include the properties of the EDZ, shafts, and tunnels will include these processes
and show whether flow along these pathways is significant. Alternatively, independent
calculations may show that these FEPs can be excluded from the model if the calculations
indicate they have negligible effects.
Climate scenarios are typically superimposed on the various scenarios modeled. In the Finnish
models, for example, glacial periods are defined and estimates of anthropogenic greenhouse
gases are considered (Posiva 2010, Section 3.1). These scenarios have the potential to lead to

54
changes in groundwater circulation, flow rates, and composition and are included in the model
calculations to ensure that potential climate changes are considered in the safety analysis.
For the purposes of the safety analysis in this study, the following assumptions are made
regarding the repository environment and potential exposure pathway:
The repository is placed in granite where there is a low hydraulic gradient.
The repository is located deep in the saturated zone where reducing conditions persist
even during periods of deep penetration of glacial melt water.
A future groundwater well is constructed at a distance of 500 m down-gradient of the
repository.
Migration of radionuclides along the EDZ and through tunnels and shafts is assumed to
be insignificant due to effective backfilling and sealing. The EDZ is not expected to form
a continuous conductive flow path (SKB 2006d, Section 9.3.14) and backfill is expected
to have lower hydraulic conductivity than the surrounding rock (Section 2.4.2).
Though a release scenario from a human intrusion disruptive event is discussed below, it
is not considered in the safety analysis in Section 4.
Based on the FEP screening in Appendix B, the scenarios of interest in international programs,
and the assumptions above, five scenarios are identified and examined in more detail. Each is
addressed in the following paragraphs. Two of these scenarios, the defective waste package
scenario and the buffer failure scenario, are simulated in Section 4.
Nominal Scenario: The waste packages and EBS perform as designed. No releases occur
because the waste form remains contained within the waste package during the entire
performance period. This scenario maintains that the EBS will protect the waste packages from
significant damage during the performance period, preventing canister failure and radionuclide
release. This scenario is consistent with the base scenario of the third case study for the Canadian
concept (Gierszewski et al. 2004) and the expected performance of the Swedish repository,
barring an unexpectedly large earthquake or significant buffer erosion (SKB 2006d, Section
9.5.1).
Defective Waste Package Scenario: A major defect in a waste package allows early
radionuclide release. A waste package is assumed to have a major defect at the time of
emplacement. This scenario assumes that one waste package in the capture zone of the future
groundwater well has a major defect. One waste package is selected instead of multiple waste
packages based on estimates of undetected defect rates and the number of waste packages in the
capture zone (Section 4.1). The defect is simulated by assuming the waste package provides no
barrier performance. Exposing the full inventory of a defective waste package is a pessimistic
assumption because undetected defects would likely be small and the waste package would still
provide some performance. In addition, for UNF, early and complete failure of all cladding in the
defective waste package is extremely unlikely. Nevertheless, at the time of repository closure it
is assumed that the entire waste form is exposed to water and begins to degrade. At this early
time, radiolytic phenomena may increase waste form degradation rates above solubility limited
rates; however, this increase is assumed to be captured by the conservative treatment of waste

55
form exposure. The buffer, backfill, and seals perform as designed, causing the primary pathway
to be through the geosphere. Released radionuclides diffuse through the bentonite buffer and
migrate to the well via a near-field fracture and a far-field fracture zone.
Buffer Failure Scenario: Deep circulation of glacial melt waters causes buffer erosion.
Corrosion of a number of waste canisters is enhanced by the erosion of buffer materials caused
by hydrologic changes brought on by the next glacial cycle. This scenario assumes that the
earth’s glacial cycle continues such that an ice sheet or glacier advances over the top of the
repository site and then, at approximately 100,000 years in the future, retreats during a
subsequent warming period. The warming period is assumed to cause deep penetration of melt
waters at the repository site as the ice retreats. Similar to the probability distributions presented
by SKB (2006d, Figure 9-99), the increased flow conditions at depth are assumed to last
approximately 25,000 years and to sufficiently erode the buffer to expose one quarter of the
waste packages to advective groundwater flow. The increased corrosion rate due to flowing
groundwater causes a small fraction of these waste packages to fail within one million years.
Internal waste package components, such as the insert and fuel cladding, are pessimistically
assumed to fail when the canister fails, initiating degradation of all waste in the failed packages.
The backfill and seals may be affected but are assumed to perform as intended. However, for
emplacement boreholes containing failed waste packages, the buffer is assumed to be completely
gone. Thus, radionuclides released from breached waste packages are assumed to migrate
directly to the host rock.
Shear Movement Scenario. An earthquake causes a displacement that ruptures waste
packages. This scenario is not simulated in the generic safety assessment because it is assumed
that the repository will be located in granite that has a low probability of significant earthquakes
and of major glacially induced faulting. Site-specific calculations would be needed to confirm
exclusion of this scenario. Calculations at Forsmark and Laxemar that combine the effects of
isostatic pressure from the ice load of a glacial period and the probabilities for canisters being
damaged within one million years by earthquakes give a mean canister failure rate of less than 2
× 10–5
, which is less than one in 50,000 canisters (SKB 2006d, Section 9.5.1).
Disruptive, Human Intrusion Scenario. A borehole is drilled through the repository and later
abandoned; a vertical hydrologic gradient transports radionuclides to a shallow aquifer from
which they are pumped to the biosphere. This is a stylized calculation specified by 40 CFR 197.
Implementation for a granite repository would be inherently similar to the human intrusion
scenario in the PA for the WIPP (DOE 2009) but would not be as likely to happen in granite and
is therefore not analyzed in this report.

56
4. PERFORMANCE ANALYSIS
Generic performance analyses were performed for the defective waste package and buffer failure
scenarios described in Section 3.2. The conceptual model for each of these scenarios assumes
that released radionuclides migrate through the granite to a domestic groundwater supply well, as
illustrated in Figure 4-1.
Figure 4-1. Conceptual Model of the Nominal Radionuclide Pathway.
4.1. Model Design
The model boundary conditions and assumptions include the following:
The repository is located at a depth of 500 m in sparsely fractured granite. The layout
chosen for these calculations is the vertical emplacement design shown on the left side of
Figure 2-4. The emplacement spacing is that of the Forsmark design. In that design,
emplacement tunnels are 40 m apart and the spacing between emplacement boreholes is 6
m. Because prevention of temperatures (>100°C) that could damage the buffer is a top
priority in the design of the repository, waste package spacing at a selected location
would depend largely on the heat output of the waste packages and the heat conductivity
of the host rock.
The total inventory, assuming UNF is reprocessed, consists of 32,154 waste packages for
UNF, 5,003 waste packages for HLW glass, and 4,055 waste packages for RW
(Appendix A). However, only UNF waste packages are considered in the safety analysis
and only 3,000 of them are assumed to be emplaced within the capture zone of the well

57
(This assumption is discussed in Section 4.3.). Each waste package has a copper canister
with 50-mm wall thickness. The initial radionuclide inventory is consistent with
Appendix A. Decay and in-growth are included in the calculations.
Corrosion rates for the copper canisters in the buffer failure scenario are sampled from a
cumulative probability distribution applicable to advective conditions (Table 4-1).
Corrosion rates for canisters with intact buffer are too low to cause canister failure within
one million years. In the defective waste package and buffer erosion scenarios the
canister contents, such as the cladding surrounding the UNF, provide no further
performance upon canister containment failure and are effectively treated thereafter as
nonexistent.
Once the canister is breached, the release of radionuclides from each waste package is
limited by
waste form degradation rates that initiate upon waste canister breach, except for
instant release fractions (Table 4-1);
radionuclide solubility (Table 2-5); and
radionuclide diffusion into the buffer surrounding the waste packages when the
bentonite buffer is intact; otherwise (in the buffer failure scenario), release is
limited by the flux of water flowing through fractures intersecting the waste
package borehole.
Radionuclide source term concentrations are further limited by the isotope mole fraction
for radioactive elements that have more than one isotope present in the waste form.
Assuming congruent release of the isotopes, the maximum aqueous concentration for
each isotope is limited to the elemental solubility limit multiplied by the mole fraction of
that isotope.
Diffusion is modeled through 0.35 m of bentonite buffer. Diffusion is limited by
adsorption and pore geometry (Section 2.5.4). In the buffer failure scenario, diffusion
through the buffer and adsorption to the buffer are not modeled because the buffer is
assumed to have eroded away.
Flow through 100 m of near-field sparsely fractured granite is represented by a dual
porosity fracture flow model where advection occurs in the fractures and diffusion and
adsorption occur in the diffusion porosity (Section 2.5). Flow through the near field is
modeled as flow through a block of sparsely fractured granite with general dimensions as
shown in Figure 4-2. The model does not require the near-field fracture to be planar or to
intersect the borehole at a specific angle. Figure 4-3 illustrates the advective flow
modeled through a near-field fracture and EDZ and around intact buffer materials.

58
Table 4-1. Near Field Model Parameters and Parameter Values.
Near Field Parameter Value Supporting Information
Number of UNF waste packages (WPs) 3,000
Approximately 9% of UNF inventory (Appendix A), consistent with simulated capture zone of assumed water supply well (Section 4.3)
WP length (m) 5 Figure 2-6; Posiva (2010, Section 4.5.1)
WP diameter (m) 1 Figure 2-6; Posiva (2010, Section 4.5.1)
WP copper canister wall thickness (m) 0.05 Figure 2-6; Posiva (2010, Section 4.5.1)
WP interior void fraction 0.4 Approximated for a degraded WP
WP undetected defect rate for copper canister
2 × 10⁻⁴
Gierszewski et al. (2004, p. 39)
WP copper corrosion rate under diffusion conditions (mm yr
-1)
5 × 10⁻⁶
Posiva (2010, Section 2.3.1)
WP copper corrosion rate under advective conditions, i.e., after glacial melt waters erode buffer around WP (mm yr
-1)
1 × 10⁻⁶
(0.80) 3 × 10
-6 (0.90)
1 × 10⁻⁵
(0.95) 5 × 10
-5 (0.99)
7 × 10⁻⁵
(0.9938) 1 × 10
-4 (0.996)
2.5 × 10⁻⁴
(0.9991) 3.5 × 10
-4 (0.9997)
5 × 10⁻⁴
(1.00)
Cumulative probability distribution based on copper corrosion rates estimated for Laxemar for advective conditions (SKB 2006d, Figure 9-102) (Note that corrosion rates greater than 5 × 10
-5
mm yr-1
are needed to penetrate the 50 mm copper shell within one million years.)
Instant release fractions for UNF
0.0001 (Sn) 0.001 (Se) 0.01 (Sr, Tc, Pd) 0.05 (Cs, I) 0.1 (C, Cl)
Posiva (2010, Table 1-5)
Fractional UNF degradation rate (yr-1
) 1 × 10
-8 (min)
1 × 10⁻⁷
(mode)
1 × 10⁻⁶
(max)
SKB (2006d, Table 10-3)
Log-uniform distribution used in buffer failure scenario; mode used in defective waste package scenario
WP radionuclide inventory tabulated Appendix A
Radionuclide solubility in EBS tabulated Table 2-5
Bentonite buffer thickness around WPs (m) 0.35 Posiva (2010, Figure 4-9); SKB (2006d, Figure 4-4)
Bentonite porosity 0.44 Posiva (2010, Section 3.2.3)
Bentonite dry bulk density (kg m-3
) 1600 Posiva (2010, Section 3.2.4)
Bentonite tortuosity () (Eq. 2-5) 4 Ochs et al. (1998, Table 3)
Bentonite constrictivity (Eq. 2-5) 1 Assumed, as in Ochs et al. (1998)
Bentonite adsorption distribution coefficients tabulated Table 2-2

59
Table 4-1. Near Field Model Parameters and Parameter Values. (Continued)
Near Field Parameter Value Supporting Information
Diffusivity in aqueous solution tabulated Table 2-4
Near field granite path length (m) 100 Assumption based on avoidance of waste emplacement near fracture zone
Near field granite flow porosity 0.0001 SKB (2006b, p. 159); Posiva (2008a, pp. 17-18); Five times higher than Posiva (2009, Table 3-3)
Near field granite diffusion porosity 0.001 10 times lower than that used by Posiva (2009, p. 29), in the sparsely fractured granite; Posiva (2008a, p. 19)
Near field granite dry bulk density (kg m-3
) 2,650 Carmichael (1982); Lama and Vutkuri (1978)
Near field granite matrix tortuosity () (Eq. 2-5)
3.2 Approximated from = (porosity)1/3
Near field granite pore velocity (m yr-1
) 0.01 Implies Darcy velocity of 3 × 10
-13 m s
-1, which is
in the middle of the range of Posiva (2009, p. 80) at repository level
Near field granite fracture velocity (m yr-1
) 0.1 Ratio of flow porosity to diffusion porosity
Near field granite conduit bulk cross-sectional area (m
2)
10 2 m × 5 m
Near field granite mean fracture aperture (m)
5 × 10⁻⁴
Posiva (2010, p. 279)
Near field granite length between fractures (m)
5 Ratio of fracture aperture to flow porosity
Near field granite longitudinal dispersivity (m)
10 Assumed 10% of path length
Near field granite matrix adsorption distribution coefficients
tabulated Table 2-3

60
Figure 4-2. Flow Paths and Dimensions.
Figure 4-3. Simulated Near Field Barriers and Flow Paths.

61
Flow through 500 m to 1,700 m of a hydraulically conductive fracture zone in the granite
(Figure 4-2) is represented by a dual porosity fracture flow model where advection occurs
in the fractures, and diffusion and adsorption occur in the diffusion porosity. Flow
through the fracture zone is modeled as flow through a block of highly fractured granite.
This block is divided into conduits, each of which captures flow from 100 waste
packages.
The receptor well is assumed to capture flow from fractures intersecting the emplacement
boreholes of 3,000 waste packages (i.e., 30 fracture zone conduits). Based on the spacing
of the waste packages and emplacement drifts, 3,000 waste packages would cover an area
of at least 0.72 km2. A highly simplified model representation of the 3,000 waste
packages within the capture zone of the well is shown in Figure 4-4. The decision to limit
the number of waste packages within the capture zone to 3,000 is discussed in Section
4.3.
Flow velocities, flow porosities, diffusion porosities, fracture spacing, and fracture
apertures in the near field granite and fracture zones are largely borrowed from data and
modeling results from international programs (Table 4-1 and Table 4-2).
Colloids are not modeled in the calculations. A clay buffer will physically prevent colloid
migration, and the high ionic strength of groundwater at repository depth will chemically
limit colloid stability (Buck and Sassani 2007). In the buffer failure scenario, deep
circulation of dilute glacial melt water at 100,000 years is assumed to stabilize colloids
for a period of approximately 25,000 years and cause the buffer around many waste
packages to erode away. Waste packages with eroded buffer are nevertheless expected to
remain intact long after ionic strength is assumed to return to levels that inhibit colloid
stability. Although deep penetration of glacial melt waters may be insignificant or
unlikely, based on the isotope data at Forsmark and Olkiluoto (Section 2.2.2), a rigorous
site-specific PA should include a careful evaluation of the potential for significant
colloidal processes.
The receptor is assumed to be a self-sufficient farming family that uses water from a well
drilled into the granite within 500 m of the repository. The well pumps at a rate of 738 m3
yr-1
, which is on par with the average water use of a family of six (Van der Leeden et al.
1990). The implications of the selection of the well discharge rate and the number of
people exposed are discussed in Section 4.3.
The IAEA BIOMASS Example Reference Biosphere 1B (ERB1B) dose model is used to
calculate the annual dose based on well water consumption (IAEA 2003). In the analysis,
the well is assumed to capture all flow from the simulated fractures down-gradient of the
3,000 waste packages.

62
Figure 4-4. Simplified Conceptual Model Layout of 30 Fracture Zone Conduits Capturing Flow from the Boreholes of 3,000 Waste Packages.
For the buffer failure scenario
25% of the waste packages up gradient of the well are assumed to become
exposed to advective groundwater flow at 100,000 years (This fraction is within
the range estimated by SKB (2006d, Figure 9-99) assuming spalling but is far
above the estimated range assuming no spalling (< 3%));
a probability distribution of higher copper canister corrosion rates is used for
waste canisters exposed to advective groundwater flow (Table 4-1); and
canister contents including fuel cladding are assumed to provide no barrier
capability after failure of the canister.
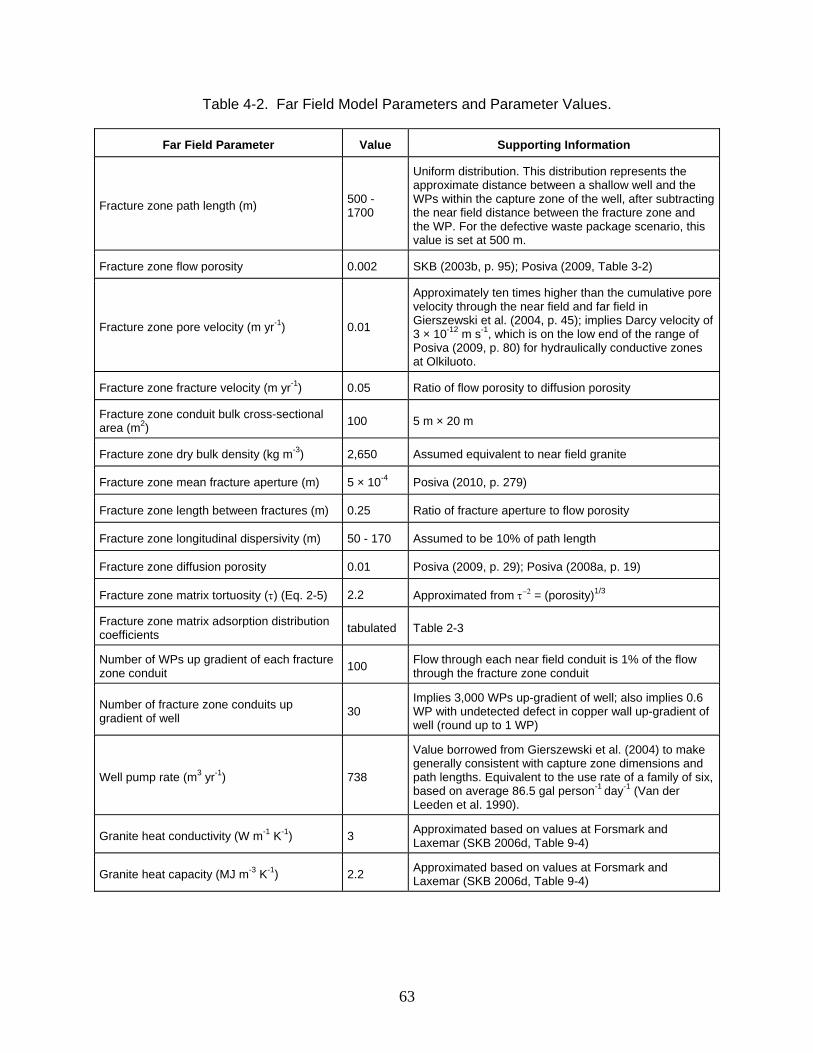
63
Table 4-2. Far Field Model Parameters and Parameter Values.
Far Field Parameter Value Supporting Information
Fracture zone path length (m) 500 - 1700
Uniform distribution. This distribution represents the approximate distance between a shallow well and the WPs within the capture zone of the well, after subtracting the near field distance between the fracture zone and the WP. For the defective waste package scenario, this value is set at 500 m.
Fracture zone flow porosity 0.002 SKB (2003b, p. 95); Posiva (2009, Table 3-2)
Fracture zone pore velocity (m yr-1
) 0.01
Approximately ten times higher than the cumulative pore velocity through the near field and far field in Gierszewski et al. (2004, p. 45); implies Darcy velocity of 3 × 10
-12 m s
-1, which is on the low end of the range of
Posiva (2009, p. 80) for hydraulically conductive zones at Olkiluoto.
Fracture zone fracture velocity (m yr-1
) 0.05 Ratio of flow porosity to diffusion porosity
Fracture zone conduit bulk cross-sectional area (m
2)
100 5 m × 20 m
Fracture zone dry bulk density (kg m-3
) 2,650 Assumed equivalent to near field granite
Fracture zone mean fracture aperture (m) 5 × 10⁻⁴
Posiva (2010, p. 279)
Fracture zone length between fractures (m) 0.25 Ratio of fracture aperture to flow porosity
Fracture zone longitudinal dispersivity (m) 50 - 170 Assumed to be 10% of path length
Fracture zone diffusion porosity 0.01 Posiva (2009, p. 29); Posiva (2008a, p. 19)
Fracture zone matrix tortuosity () (Eq. 2-5) 2.2 Approximated from = (porosity)1/3
Fracture zone matrix adsorption distribution coefficients
tabulated Table 2-3
Number of WPs up gradient of each fracture zone conduit
100 Flow through each near field conduit is 1% of the flow through the fracture zone conduit
Number of fracture zone conduits up gradient of well
30 Implies 3,000 WPs up-gradient of well; also implies 0.6 WP with undetected defect in copper wall up-gradient of well (round up to 1 WP)
Well pump rate (m3 yr
-1) 738
Value borrowed from Gierszewski et al. (2004) to make generally consistent with capture zone dimensions and path lengths. Equivalent to the use rate of a family of six, based on average 86.5 gal person
-1 day
-1 (Van der
Leeden et al. 1990).
Granite heat conductivity (W m-1
K-1
) 3 Approximated based on values at Forsmark and Laxemar (SKB 2006d, Table 9-4)
Granite heat capacity (MJ m-3
K-1
) 2.2 Approximated based on values at Forsmark and Laxemar (SKB 2006d, Table 9-4)

64
4.2. Model Results
Performance analysis of a generic granite repository was conducted for two scenarios, a
defective waste package scenario and a buffer failure scenario. The defective waste package
scenario analysis was deterministic and the buffer failure scenario analysis was probabilistic.
Each simulation was performed using GoldSim version 10.5.
4.2.1. Defective Waste Package Scenario
As discussed previously, this scenario assumes that one waste package has undetected major
defects and fails at the time of repository closure, exposing the full radionuclide inventory of the
waste package. The waste package is assumed to contain commercial UNF, and the potential
performance of the fuel cladding is not considered. For this scenario we assume that the
bentonite buffer, backfill, and seals perform as designed and the primary transport pathway for
released radionuclides is through the geosphere. Released radionuclides diffuse through the
bentonite buffer and migrate to the well via a near-field fracture and a far-field fracture zone.
Figure 4-5 shows the mass flux of radionuclides from the failed waste package to the buffer.
Because potential performance of the failed waste package as a barrier to radionuclide transport
is not considered, radionuclides released from the UNF are assumed to directly contact the entire
inner surface of the buffer layer (35 cm thick) and are modeled to migrate through the buffer
layer by radial diffusion. The initial high release rates of 129
I and 107
Pd within the first 30 years
are due in part to initial instantaneous release from the waste form (Table 4-1). Much of the
instantly released 107
Pd precipitates within the waste package, limiting release to the buffer to a
rate of 0.6 g yr-1
for 20 years while the precipitated mass fully dissolves. Other radioelements
precipitating in the waste package include uranium, technetium (fully dissolved at 13,700 years),
neptunium, and zirconium (after 100,000 years). Between 100 and 10,000 years, the
radionuclides with high release rates are 239
Pu, 99
Tc, 240
Pu, 135
Cs, 93
Zr, and 241
Am. At one million
years, the dominant release rates are for 93
Nb, 229
Th, 232
Th, 93
Zr, and 135
Cs. Note that the
radionuclide release rates, especially for radionuclides with long half-lives, show persistent,
relatively steady release behaviors until their decay effect becomes dominant. This behavior is
largely due to a low fractional waste form degradation rate of 10–7
yr-1
, which is equivalent to a
half-life of approximately seven million years. After release of the instantly-released
radionuclides, the 10–7
yr-1
rate implies that the mass flux from the waste form (g yr-1
) decreases
only by 1% over 100,000 years and by 10% over one million years.
The radionuclide mass flux from the bentonite buffer is shown in Figure 4-6. It is assumed that
the buffer layer maintains its physical configuration and integrity for the entire simulation period.
Cesium, strontium, and iodine are the first radioelements to break through at high rates due to
their instantaneous release fractions (Table 4-1) and low adsorption (Table 2-2). A comparison of
Figure 4-6 and Figure 4-5 shows that the breakthrough curves of radioelements that adsorb
strongly to the buffer are considerably delayed. (Based on these figures, the peak release rate of 135
Cs from the buffer appears to be higher than any release rates from the waste package. This is
not the case. The peaks from the waste package involving instantaneously-released radionuclides
break through largely or entirely within the first 10 years. For example, at approximately 0.2 yr,
the peak waste package release rate of 135
Cs exceeds 200 g yr-1
.)

65
Figure 4-5. Radionuclide Mass Flux from the Breached Waste Package in the Defective Waste Package Scenario.
Figure 4-6. Radionuclide Mass Flux from the Buffer of the Breached Waste Package in the Defective Waste Package Scenario.
1.0E-10
1.0E-09
1.0E-08
1.0E-07
1.0E-06
1.0E-05
1.0E-04
1.0E-03
1.0E-02
1.0E-01
1.0E+00
1.0E+01
1.0E+02
1.0E+01 1.0E+02 1.0E+03 1.0E+04 1.0E+05 1.0E+06
Ma
ss F
lux
(g/y
r)
Time (years)
Mass Flux from Failed Waste Package
Ac-227 Am-241 Am-243 C-14 Cl-36 Cm-245 Cs-135 Cs-137 I-129
Nb-93 Np-237 Pa-231 Pb-210 Pd-107 Pu-238 Pu-239 Pu-240 Pu-241
Pu-242 Ra-226 Ra-228 Sb-126 Se-79 Sn-126 Sr-90 Tc-99 Th-229
Th-230 Th-232 U-232 U-233 U-234 U-235 U-236 U-238 Zr-93
1.0E-10
1.0E-09
1.0E-08
1.0E-07
1.0E-06
1.0E-05
1.0E-04
1.0E-03
1.0E-02
1.0E-01
1.0E+00
1.0E+01
1.0E+02
1.0E+01 1.0E+02 1.0E+03 1.0E+04 1.0E+05 1.0E+06
Ma
ss F
lux
(g/y
r)
Time (years)
Mass Flux from Clay Buffer of Failed Waste Package
Ac-227 Am-241 Am-243 C-14 Cl-36 Cm-245 Cs-135 Cs-137 I-129
Nb-93 Np-237 Pa-231 Pb-210 Pd-107 Pu-238 Pu-239 Pu-240 Pu-241
Pu-242 Ra-226 Ra-228 Sb-126 Se-79 Sn-126 Sr-90 Tc-99 Th-229
Th-230 Th-232 U-232 U-233 U-234 U-235 U-236 U-238 Zr-93

66
Figure 4-7 shows the mass flux of radionuclides from the near-field fracture in the defective
waste package scenario. As shown in the figure, only three radionuclides, which are
characterized as mobile, non-sorbing, and highly soluble (129
I, 36
Cl and 14
C), are released from
the near-field fracture at appreciable rates. All other radionuclides are amply retarded by
adsorption. The 129
I peak release rate is about 7.4 × 10⁻⁴
g yr-1
at 23,000 years and is about two
orders of magnitude greater than the next dominant radionuclide peak release (36
Cl peak flux of
2.1 × 10⁻⁶
g yr-1
at 21,000 years). A pulse of 129
I released from the near-field fracture is shown
using a linear scale in Figure 4-8. The release rates of these radionuclides following their peaks
steadily decrease for the rest of the analysis period due largely to radioactive decay.
Figure 4-7. Radionuclide Mass Flux from the Near-Field Fracture in the Defective Waste Package Scenario.
Radionuclide release rates from the far-field fracture zone are shown in Figure 4-9. 129
I is the
dominant released radionuclide. The peak release rate (4.4 × 10⁻⁴
g yr-1
) is about a factor of two
lower than the near-field peak release rate, and the time for the peak is delayed to about 180,000
years (vs. 23,000 years for the near-field release peak). Similar effects are calculated for 36
Cl
(peak release rate of 7.9 × 10⁻⁷
g yr-1
at 145,000 years compared to 2.1 × 10⁻⁶
g yr-1
at 21,000
years for the near-field release). The far-field release rate for 14
C is negligibly small.
Figure 4-10 shows the radionuclide dose rate at the hypothetical accessible environment. 129
I is
the dominant radionuclide for dose, and the peak dose rate is calculated to be about 4.8 × 10⁻²
mrem yr-1
at 180,000 years. The dose rates from 36
Cl and 14
C are much smaller.
1.0E-10
1.0E-09
1.0E-08
1.0E-07
1.0E-06
1.0E-05
1.0E-04
1.0E-03
1.0E-02
1.0E-01
1.0E+00
1.0E+01 1.0E+02 1.0E+03 1.0E+04 1.0E+05 1.0E+06
Ma
ss F
lux
(g/y
r)
Time (years)
Mass Flux from Near-Field Fracture Zone
I-129
Cl-36
C-14

67
Figure 4-8. Radionuclide Mass Flux from the Near-Field Fracture in the Defective Waste Package Scenario (linear scale for mass flux).
Figure 4-9. Radionuclide Mass Flux from the Far-Field Fracture Zone in the Defective Waste Package Scenario.
0.0E+00
1.0E-04
2.0E-04
3.0E-04
4.0E-04
5.0E-04
6.0E-04
7.0E-04
8.0E-04
1.0E+01 1.0E+02 1.0E+03 1.0E+04 1.0E+05 1.0E+06
Ma
ss F
lux
(g/y
r)
Time (years)
Mass Flux from Near-Field Fracture Zone
I-129
Cl-36
C-14
1.0E-10
1.0E-09
1.0E-08
1.0E-07
1.0E-06
1.0E-05
1.0E-04
1.0E-03
1.0E-02
1.0E-01
1.0E+00
1.0E+01 1.0E+02 1.0E+03 1.0E+04 1.0E+05 1.0E+06
Ma
ss F
lux
(g/y
r)
Time (years)
Mass Flux from Far-Field Fracture Zone
I-129
Cl-36

68
Figure 4-10. Radionuclide Dose Rate at the Hypothetical Accessible Environment for the Defective Waste Package Scenario.
4.2.2. Buffer Failure Scenario
The model for the buffer failure scenario assumes a total of 3,000 waste packages in the capture
zone and 30 fracture zone conduits down gradient of these waste packages (Figure 4-2 and
Figure 4-4). The analysis for this scenario was conducted probabilistically with a total of 1,000
realizations. Three model parameters were sampled randomly: 1) the waste canister corrosion
rate corresponding to the eroded buffer condition (the cumulative distribution function listed in
Table 4-1 for advective conditions), 2) commercial UNF fractional degradation rate (log-uniform
distribution between 10–8
yr-1
and 10–6
yr-1
), and 3) the far-field fracture zone length (uniform
distribution between 500 and 1,700 m). The distribution of the three parameters were treated as
epistemic uncertainty, and, for a given realization, a single value was sampled for each of the
parameters. No correlation between sampled parameters was assumed.
As discussed in Section 4.1, erosion of the buffer is assumed to occur at 100,000 years, exposing
25 percent of the 3,000 waste packages in the capture zone to advective conditions. Only nine of
the 1,000 realizations (0.9%) had sampled waste canister corrosion rates that were high enough
to cause canister failures prior to one million years. Within each of the nine realizations, 750
waste packages (25 percent of the 3,000 waste packages in the capture zone) fail at the time
calculated by the sampled corrosion rate. Averaging over all realizations, the mean number of
failed waste packages within one million years for this scenario is 6.75 (750 waste packages ×
0.9%). For simplification, all waste packages that fail are assumed to contain UNF.
Figure 4-11 shows the mean radionuclide mass release rate from the waste packages over time.
The bumps in the curves correspond to each realization of waste package failure time (i.e.,
initiation of radionuclide release from 750 waste packages). Realization 216 has the earliest
waste package failure time at about 209,000 years. Failure time for realization 888 occurs at
about 306,000 years; that for realization 367 occurs at about 409,000 years, and so forth, with the
1.0E-10
1.0E-09
1.0E-08
1.0E-07
1.0E-06
1.0E-05
1.0E-04
1.0E-03
1.0E-02
1.0E-01
1.0E+00
1.0E+01 1.0E+02 1.0E+03 1.0E+04 1.0E+05 1.0E+06
Do
se (m
rem
/yr)
Time (years)
Dose at Hypothetical Acessible Environment
I-129
Cl-36
C-14

69
latest failure time occurring at 974,000 years for realization 127. The two radionuclides with the
top mean release rates are 135
Cs and 129
I, which have unlimited solubilities and long half-lives
(2.3×10⁶ yr and 1.7×10
7 yr, respectively). The radionuclides with the third and fourth highest
mean release rates are 93
Nb and 107
Pd. Release rates generally increase with time as additional
realizations with waste package failures are included with time. In general, radionuclides with
long half-lives are released from the waste packages at appreciable rates; those with shorter half-
lives decay markedly prior to waste package failure and are released at much lower rates. For
example, for relatively short-lived 14
C, the peak of the mean waste package release rate is
approximately 10–19
g yr-1
at 210,000 years.
Figure 4-11. Mean Radionuclide Mass Flux from Waste Packages in the Buffer Failure Scenario.
The mean mass fluxes released from the near-field fractures are shown in Figure 4-12. Only 129
I
and 36
Cl are released at appreciable rates. Other radionuclides that enter the near-field fractures
at appreciable rates are amply retarded by adsorption. After an initial sharp increase to about 8 ×
10–5
g yr-1
following the waste package failure of the realization with the earliest waste package
failure time, the 129
I mean release rate generally increases for the rest of the analysis period to
about 1.0 × 10⁻³
g yr-1
at one million years. For 36
Cl, the mean release rate increases rapidly to a
peak of 1.5×10⁻⁷
g yr-1
at about 232,000 years and remains relatively steady for the rest of the
analysis period.
1.0E-10
1.0E-09
1.0E-08
1.0E-07
1.0E-06
1.0E-05
1.0E-04
1.0E-03
1.0E-02
1.0E+05 1.0E+06
Ma
ss F
lux
(g
/y
r)
Time (years)
Mean Mass Flux from All Failed Waste Package Groups
Ac-227 Am-241 Am-243 C-14 Cl-36 Cm-245 Cs-135 Cs-137 I-129
Nb-93 Np-237 Pa-231 Pb-210 Pd-107 Pu-238 Pu-239 Pu-240 Pu-241
Pu-242 Ra-226 Ra-228 Sb-126 Se-79 Sn-126 Sr-90 Tc-99 Th-229
Th-230 Th-232 U-232 U-233 U-234 U-235 U-236 U-238 Zr-93

70
Figure 4-12. Mean Radionuclide Mass Flux from Near-Field Fractures in the Buffer Failure Scenario.
Mean releases of 129
I and 36
Cl from the far-field fracture zone (Figure 4-13) are similar to mean
releases from the near-field fractures. The 129
I mean release rate increases rapidly initially and
then continues to increase for the rest of the analysis period. The peak mean mass flux of 129
I is
about 9.0 × 10⁻⁴
g yr-1
at one million years. As in the near-field granite release, following an
initial rapid increase to a peak of about 1.5 × 10⁻⁷
g yr-1
at 440,000 years, the mean mass flux of 36
Cl from the far-field fracture zone remains relatively steady, and the initial peak is delayed
about 210,000 years compared to the release from the near-field granite.
1.0E-10
1.0E-09
1.0E-08
1.0E-07
1.0E-06
1.0E-05
1.0E-04
1.0E-03
1.0E-02
1.0E+05 1.0E+06
Ma
ss F
lux
(g
/y
r)
Time (years)
Mean Mass Flux from All Near-Field Fracture Zones
I-129
Cl-36

71
Figure 4-13. Mean Radionuclide Mass Flux from Far-Field Fracture Conduits in the Buffer Failure Scenario.
Figure 4-14 shows the mean annual dose at the hypothetical accessible environment. 129
I is the
dominant dose contributor, and its contribution continues to increase over the entire analysis
period. The peak dose rate from 129
I is about 0.093 mrem yr-1
at one million years. This dose rate
is a factor of 3.4 higher than the dose rate from the defective waste package scenario at one
million years (0.027 mrem yr-1
). The higher dose rate is mainly due to the higher mean number
of failed waste packages at one million years (6.75). A greater relative dose rate difference that
approximates the difference in the mean number of failed waste packages is not observed in the
buffer failure scenario for two main reasons. First, the travel distance in the fracture zone
increases from 500 m in the defective waste package scenario to a sampled value in the range of
500 m to 1,700 m. This increase causes the expected fracture zone residence time to more than
double. Second, considering the longer expected residence time, a significant fraction of the
waste package failures in the buffer failure scenario occur too late to have significant effects on
dose at one million years. Also complicating the comparison is the switch from a fixed fractional
waste form degradation rate to a sampled rate.
1.0E-10
1.0E-09
1.0E-08
1.0E-07
1.0E-06
1.0E-05
1.0E-04
1.0E-03
1.0E-02
1.0E+05 1.0E+06
Ma
ss F
lux
(g
/y
r)
Time (years)
Mean Mass Flux from All far-Field Fracture Zones
I-129
Cl-36

72
Figure 4-14. Mean Annual Radionuclide Dose at the Hypothetical Accessible Environment for the Buffer Failure Scenario.
4.3. Relative Importance of Modeled FEPs
The conceptual model for the generic safety analysis presented in Section 4.1 can be considered
a collection of FEPs that defines the release and transport of radionuclides from the repository to
a logical human receptor. This collection may not include all potentially important FEPs and
transport pathways for a given site nor may it by itself identify which of the included FEPs are of
primary importance. However, by defining a simple conceptual model and numerically
simulating it, we can evaluate which FEPs within the chosen set are most important.
The model developed for this report represents a single generalized conceptualization of a
hypothetical repository, geosphere, and route of exposure. Because this model is not
representative of the range of granite repository environments, EBS features, and exposure
routes, a quantitative evaluation of importance was not performed. Instead, a qualitative
evaluation was performed by visually comparing calculated radionuclide masses within the
waste package, buffer, near field, and far field domains over time and releases from these
domains over time.
The FEPs of primary and secondary importance, based on the qualitative evaluations, are
summarized in Figure 4-15. The darker blue boxes indicate highly important features and
processes, and the lighter boxes indicate features and processes of intermediate importance. The
most important simulated processes for preventing release of radionuclides from the repository
are canister corrosion, waste form degradation, and radionuclide precipitation. These processes,
in turn, depend highly on reducing conditions and the presence and properties of the canister and
buffer. The buffer, in addition to delaying waste package failure, presents a diffusive and
sorptive barrier to radionuclide transport; however, the results suggest that the buffer’s role in
limiting canister corrosion rates is more important to the release of radionuclides to the
1.0E-10
1.0E-09
1.0E-08
1.0E-07
1.0E-06
1.0E-05
1.0E-04
1.0E-03
1.0E-02
1.0E-01
1.0E+00
1.0E+05 1.0E+06
Do
se
(m
rem
/y
r)
Time (years)
Mean Dose at Hypothetical Accessible Environment
I-129
Cl-36

73
geosphere. Once the radionuclides enter the geosphere, fracture flow velocities, matrix diffusion,
adsorption, and radioactive decay are of the highest importance to the dose rate at the receptor
well.
Figure 4-15. Important Model Features and Processes.
The importance of radioactive decay is magnified by the long residence times in the repository
and geosphere compared to the relatively short half-lives of many of the radionuclides. The long
residence time in the waste package is due to slow canister corrosion rates, slow waste form
degradation rates, and, for a few radioelements (e.g., uranium), solubility limits. Except in the
defective waste package scenario, waste packages do not fail for more than 100,000 years. This
delay in itself ensures that the initially high activities of 90
Sr and 137
Cs (Figure 2-1) decay to
negligible quantities prior to waste package release. Because the waste form has a half-life of
approximately seven million years (Section 4.2.1), the stability of the waste form contributes
greatly to the repository residence time.
The model residence times of non-sorbing radionuclides in the near-field granite and far-field
fracture zone are on the order of 104 and 10
5 years, respectively. These residence times are
evident in Figure 4-7 and Figure 4-9 and are consistent with the pore velocities and path lengths
of the modeled near-field and far-field conduits (Table 4-1 and Table 4-2). Because 14
C and 36
Cl
have half-lives of 5,730 years and 301,000 years, respectively, significant fractions decay by the
time the plumes of these radionuclides reach the well. In the buffer failure scenario, the
additional residence time in the waste package is enough to prevent any appreciable
breakthrough of 14
C at the well (Figure 4-14). Little decay occurs within one million years for 129
I, which has a half life of 1.7 × 10⁷ years. Thus, the dose rate over time at the receptor well for
both scenarios is essentially entirely due to 129
I.
While processes and rates in the EBS and geosphere are uncertain in many respects, they are
arguably not as uncertain as the future timing and placement of potential receptors in the

74
biosphere. Future human intrusion, placement of future wells, and the size and proximity of
future human settlements near the repository are highly uncertain. Nevertheless, receptors have
to be defined in order to estimate dose rates over time. For the Yucca Mountain repository, 40
CFR 197 specifies a RMEI living along the predominant groundwater flow path 18 km from the
Yucca Mountain site. For the current analysis, the receptor is located at a distance of 500 m.
The choice of 500 m is somewhat arbitrary because an actual site has not been identified and
specific regulations for a repository in granite have not been developed. Locating the receptor
within 500 m of the repository is conservative in that it reduces the residence time in the
geosphere; however, it is not the only choice that must be made regarding the receptor. Other
choices include well discharge rate, use of well water, receptor diet and lifestyle, and fraction of
the repository within the capture zone of the well.
For the scenarios simulated here, the receptor well is assumed to serve a single self-sufficient
farming family and pump at a rate of 738 m3 yr
-1. The well is assumed to capture flow from
3,000 emplacement boreholes spread out over approximately 0.7 km2. These assumptions are
largely consistent with the flow model developed by Gierzewski et al. (2004). Most of the
pumpage is expected to originate from shallower depths where the water is fresh. The total water
flux into the well originating from the fracture zone conduits down-gradient of the 3,000
emplacement boreholes is simulated to be 0.3 m3 yr
-1, which is 0.04% of the well discharge rate.
This low percentage is reasonable if the vast majority of the discharge is from fresh water
sources, such as shallow recharge. In this case, the fresh water would dilute the saline water from
the repository zone (and its radionuclide content) by a factor of 2,460.
The dilution of the captured fracture zone water at the well does not include the dilution caused
by the mixing of water in the fracture zone down-gradient of the 3,000 emplacement boreholes.
In the model, radionuclides released from a waste package emanate from a single fracture
intersecting the emplacement borehole. The flow rate for this fracture is 0.0001 m3 yr
-1. Thus,
neglecting dispersion and the additional dilution that occurs in the emplacement borehole, the
overall dilution factor at the well for radionuclides released from a single waste package is
7,380,000.
In the unlikely case that the well captures flow from 30,000 emplacement boreholes (i.e., nearly
the entire UNF inventory), the well would need to pump at a much greater discharge rate.
Increasing the discharge rate to capture flow from 30,000 emplacement boreholes would increase
the radionuclide mass flux by a similar factor. However, the concentrations at the well would be
less affected because the greater radionuclide mass flux would be largely offset by the greater
discharge rate. This relationship between capture zone size and well discharge rate implies that
the dilution factor and dose rate are not highly sensitive to capture zone size. An additional factor
that would contribute to low dose rates over time for a larger capture zone would be the
expanded range of radionuclide travel distances.
In addition to the important features and processes of the model shown in Figure 4-15, there are
several important simplifying assumptions. When assumptions were made, the goal was to make
them reasonable and realistic. However, conservative assumptions were adopted in some
instances for simplicity and to accommodate uncertainty in a generic assessment. The more
conservative assumptions in the analyses include:

75
Complete disappearance of the copper canister, insert, and fuel cladding once the copper
canister is breached. This assumption is especially conservative in the defective waste
package scenario because it implies immediate release of radionuclides even though
corrosion of the insert and fuel cladding would delay releases. For example, data indicate
that Zircaloy cladding may have a lifetime of at least 100,000 years (SKB 2006c, Section
2.5.4).
Corrosion products from the canister and its contents do not retard radionuclide release.
The release of many radionuclides from the waste package is likely to be retarded due to
strong adsorption to corrosion products.
No lateral dispersion. All radionuclides remain within the confines of the modeled
conduits and migrate toward the receptor well.
In the buffer failure scenario, complete removal of the buffer for one fourth of the waste
packages after the first glacial period. This fraction was based on the probability
distributions presented by SKB (2006d, Figure 9-99) assuming spalling. The safety
assessment in SKB’s license application submitted in March 2011 estimates a much
lower fraction in the reference evolution consistent with limited or no spalling. Within
one million years, the SKB PA estimates that approximately 0.4% of deposition
boreholes become exposed to advective conditions in the reference evolution. In the most
unfavorable cases simulated, this percentage increases but remains below 10% (SKB
2011, Section 12.2).
These assumptions increase the likelihood and magnitude of calculated dose rates, either by
accelerating the release of radionuclides, accelerating the migration of radionuclides toward the
receptor well, or limiting attenuation of radionuclides along the flow paths. The model would be
improved by incorporating realistic representations and associated uncertainty in place of these
assumptions because doing so would provide a more realistic sense of overall performance.
However, despite the conservative assumptions, dose rates projected in these scenarios are well
within acceptable limits. The calculated dose rates shown in Figure 4-10 and Figure 4-14 are less
than 0.2% of current regulatory limits (Section 1.2).
4.4. Comparison of Results to Other Safety Assessments
Generic safety assessments have been performed for other deep disposal concepts including deep
borehole, mined salt, and mined clay/shale (Hansen et al. 2010; Brady et al. 2009; Hansen and
Leigh 2011). In addition, in-depth site-specific assessments for repositories in granite have been
performed (Gierszewski et al. 2004; SKB 2011; Posiva 2008b). These studies are compared with
the current study to assess differences and similarities of model concepts and calculations.
A primary difference between the safety assessment presented here and in generic assessments
for deep borehole and non-granite repositories is the role of the waste package and waste form.
In the deep borehole concept, waste packages are emplaced in granite bedrock at depths of 3 to 5
km. Because the permeability at this depth is extremely low (~10–20
m2), the generic model does
not include the performance of the waste package or the waste form (Brady et al. 2009). Despite
these simplifications, the calculated dose rates from a 1 km deep well located above the disposal

76
zone remains approximately 10 orders of magnitude below current criteria. As in the results of
the granite model in this study (Figure 4-10 and Figure 4-14), 129
I is the only significant
contributor to the dose rate.
The generic clay/shale disposal model of Hansen et al. (2010) also assumes immediate
degradation and exposure of the waste form and relies heavily on the low permeability (~10–19
m2) of the host rock. An inventory of 200,000 waste packages is assumed to be emplaced 150 m
deep in the clay/shale host rock, 450 m below land surface. Radionuclides slowly diffuse through
the host rock into an overlying aquifer where they are captured by a domestic well pumping at a
rate of 3,000 acre-feet yr-1
. The timing and magnitude of the peak annual dose are similar to
those calculated in the defective waste package scenario of the current study (Figure 4-10). In
both calculations, the dose rate within this time frame is essentially entirely due to 129
I. However,
unlike the results of the granite model, the annual dose declines rapidly at approximately 300,000
years, whereupon other radionuclides become major contributors. Much of this difference is
likely due to the assumption of instantaneous waste form degradation in the clay/shale model. In
the granite model, the waste form has a half-life of approximately seven million years, so
radionuclides continue to be released over time.
Salt as a repository host rock has advantages similar in several ways to clay/shale. Its
permeability is extremely low and would strongly inhibit radionuclide transport. Low
permeability in these formations is enhanced by deformation properties that promote closure of
large voids and fracture healing. Hansen and Leigh (2011) present a detailed technical basis for a
salt repository. Their report does not offer a quantitative generic safety assessment. Instead, it
identifies specific areas where further research and model development are needed to inform
quantitative simulations.
The results of the defective canister scenario of the granite repository safety assessment
performed by Gierszewski et al. (2004, Figure 7.7) are quite similar to those of the current study
(Figure 4-10). This is not surprising because the pore velocities, travel distances, well discharge
rate, and approximate repository capture zone of the well in the generic model are based on the
results of their reference flow model. The peak dose rates for their reference case and high
permeability geosphere case are ~0.01 mrem yr-1
at ~400,000 years and ~0.03 mrem yr-1
at
~100,000 years, respectively. There is also good agreement on the radionuclide contributions to
dose: 129
I is the primary contributor and 36
Cl is a distant second.
Groundwater residence time in granite host rock has a broad range in PAs. The FRAC3DVS
flow model of Gierszewski et al. (2004) assumed a permeability of 7 × 10–19
m2 at repository
depth in the reference case and resulted in a groundwater velocity at that depth of approximately
0.001 m yr-1
. Much higher pore velocities and much shorter residence times in the geosphere are
simulated in the safety assessment of the SKB license application for a granite repository in
Forsmark. In the central corrosion case of that assessment, 226
Ra, a radionuclide that adsorbs
appreciably but not strongly to buffer and granite, is a primary contributor to dose at the receptor
well (SKB 2011, Section 13.5). 226
Ra has a half-life of 1,600 years and can only be important to
dose if it reaches the well within several half-lives. In-growth of 226
Ra cannot explain its high
activity at the receptor because its parent, 230
Th, is much less mobile in the geosphere. Thus,
water travel time from the repository to the biosphere in the SKB model appears to be

77
approximately two orders of magnitude (or more) lower than the generic granite model of the
current report.
The other radionuclides with significant contributions to dose in the central corrosion case of the
SKB license application include 129
I, 237
Np, 79
Se, and 59
Ni. The first three originate from the
waste form. Neptunium and selenium mildly adsorb along the flow path, but their low retardation
combined with the relatively short water travel time allows them to reach the biosphere in less
than 100,000 years. 59
Ni is produced by the neutron activation of stable 58
Ni in various metal
parts in the waste package (SKB 2006b, Section 3.2). Because the entire inventory of 59
Ni is
assumed to be released upon canister failure, spikes of 59
Ni are observed in the far field soon
after canisters fail (SKB 2011, Section 13.5). The release of radionuclides from metal parts is not
simulated in the generic safety assessment of the current report.
The far-field mean annual effective dose as a function of time in the central corrosion case of the
SKB analysis is similar to that of 129
I in Figure 4-14. The dose rate increases rapidly after initial
breakthrough between 100,000 and 200,000 years and then more slowly as the number of failed
canisters increases with time. At one million years, the mean dose rate for the SKB case is 0.02
mrem yr-1
(SKB 2011, Figure 13-19), one fourth of the rate in Figure 4-14 at the same point in
time.
A much lower peak dose rate is calculated for the defective canister scenario of a PA for a
repository at Olkiluoto, Finland (Posiva 2008b, Section 7.2). In that assessment, a 1-mm hole in
the canister leads to a total dose rate that peaks near 10–5
mrem yr-1
at approximately 7,000 years
and then again at one million years. 129
I is the primary contributor to the annual dose except for a
short time period around the 7,000-year peak when the dose rate from 14
C reaches its maximum.
The early breakthrough is a result of combining early waste package failure with relatively high
groundwater velocities.
Overall, the effective dose rate comparisons show strong agreement and build confidence in the
ability of the generic granite model to simulate major FEPs related to deep disposal of
radioactive waste in granite. With a working model, uncertainty and sensitivity analyses can be
performed to evaluate the relative importance of the included FEPs and to identify parameters
that propagate significant uncertainty to model results. Such analyses are not included in the
current report.

78
5. SUMMARY AND CONCLUSIONS
Granite is common across the U.S. at depths suitable for a mined repository for nuclear waste. A
repository in granite that incorporates the KBS-3 concept is anticipated to satisfy performance
objectives, including retrievability if deemed important. Chemically reducing conditions, buffer-
limited advection of groundwater, and long-term stability of excavations would provide a
physical and chemical environment that would likely preserve copper waste canisters for
millions of years. Because of this ability of a granite repository to preserve waste canisters,
canister failure in less than one million years would have a low probability, affecting a small
fraction of the waste packages. For those that fail, slow waste form degradation, low solubility,
and adsorption to buffer materials would substantially delay release of much of the radionuclide
inventory from the repository and allow for significant radioactive decay. Beyond the repository,
the low permeability of the granite host rock would strongly inhibit radionuclide transport to the
biosphere.
5.1. Summary of Findings
Boreholes and mined excavations in granite within the U.S. and around the world indicate that
granite often exists with few fractures and low permeability at depths below 300 m. Because
large bodies of granite are found across the U.S., there are likely numerous granite sites in the
U.S. with favorable characteristics for a mined repository.
A repository in granite has a strong technical basis. Unlike disposal concepts for salt, shale/clay,
or deep boreholes, the technical basis for granite is rooted in the ability of the granite repository
to preserve waste packages. Preservation of waste packages depends on the mechanical stability
of granite excavations, performance of the buffer and canister, and favorable chemical conditions
at repository depths. The KBS-3 design, proposed for the Swedish repository and included in
Finnish and Canadian concepts, calls for waste to be encased in copper canisters and for a
densely-packed clay buffer to surround the canisters. The diffusive barrier presented by the
buffer is anticipated to prevent corrosive reactants, such as hydrogen sulfide, from reaching the
canisters at rates needed to cause canister failure within one million years. The buffer is
anticipated to be preserved by low groundwater fluxes, favorable chemical conditions, backfill,
and the rigid confines of the host rock. An added potential advantage of disposal in mined
granite is that waste packages would be retrievable far into the future, should such an objective
be specified.
The results of the generic safety assessment developed in this report indicate that a granite
repository would satisfy established safety criteria. They also suggest that a small number of
FEPs would largely control the release and transport of radionuclides. Canister degradation,
waste form degradation, chemical environment, buffer performance, radionuclide solubility,
radionuclide adsorption, and radionuclide decay are all highly important to radionuclide release
from a granite repository. In the geosphere, the important features and processes include fracture
flow rates, matrix diffusion, and adsorption. The results imply that these FEPs should be well
understood when selecting a site for a repository and developing a site-specific PA model.
A proposed site for a granite repository would require a specific design concept, reliable data,
and a detailed PA. Important hydrogeologic data would include spatially distributed

79
permeability, flow porosity, diffusion porosity, groundwater composition, and the locations of
major fractures. These data would be used in a regional hydrologic model to predict groundwater
velocities and travel times for current and potential future climates. Important repository data
would include waste package inventories, canister corrosion rates, waste form degradation rates,
and buffer properties (e.g., permeability, adsorption of radionuclides, and properties related to
resilience when subjected to potential environmental conditions). These and other data related to
processes identified by FEP screening would be incorporated in a total system PA model to
determine whether overall performance criteria can be met.
Safety assessments have been performed for specific sites in Sweden, Finland, and Canada (SKB
2011; Posiva 2008b; Gierszewski et al. 2004). The Swedish safety assessment supports the
world’s first license application for a granite repository, submitted in March of 2011(SKB 2011).
A license application for a granite repository in Finland is anticipated in 2012. Each of these
safety assessments conclude that a granite repository using the KBS-3 or similar design concept
would perform adequately. These conclusions are consistent with the preliminary conclusions of
the generic safety analysis presented in this report.
Due to the favorable results from safety assessment models as well as the widespread availability
of suitable granite bodies across the U.S., disposal of HLW in a mined granite repository is a
feasible option for the U.S. Much experimental work has been performed, mostly by
international programs and commonly in underground laboratories built in crystalline rock. This
research is extensive and contributes greatly to our understanding of important FEPs in the
repository and granite host rock. These studies are publicly available and would provide a
valuable resource should a repository in granite be reconsidered in the U.S.
5.2. Recommendations
Calibration and validation of models used in the design, operation, and performance of an
underground repository require data obtained from underground studies. In the 1980s,
experimental work at the underground research facility constructed in the quartz monzonite at
the Nevada Test Site produced valuable data related to the performance of crystalline rock as a
host rock for a HLW repository (e.g., Patrick 1986). Should the U.S. decide to pursue granite as
a potential repository host rock, an underground research laboratory located in the U.S. would be
highly beneficial. In addition, U.S. repository programs could learn much from the operations
and experimental work conducted at existing underground laboratories in other countries and
could pursue additional research at these facilities.
The selection of a site (or sites) for an underground laboratory in the U.S. should place a high
priority on locations that are both politically and technically viable. To help identify repository
options for willing communities and states, geographic data across the U.S. should be collected
on key characteristics of crystalline rock at disposal depth. Key characteristics include
permeability, diffusion porosity, fracturing and fracture zone characteristics, vertical and lateral
extent of the granite, mineral composition, mechanical and thermal properties, groundwater
composition, groundwater age, redox conditions, and in situ stress.
Engineered barriers have important roles in the total system performance of a mined granite
repository. Therefore, the long-term performance of the waste canister, fuel cladding, waste

80
form, and buffer under potential repository conditions should be well understood. Continued
research in the degradation of these barriers and the range of possible repository conditions is
needed to ensure accurate simulation of engineered barrier performance. In addition, advanced
engineered designs, such as the prefabrication design suggested by McKinley et al. (2000),
should be evaluated for potential improvement to the KBS-3 design.

81
6. REFERENCES
Ames, L. L., J. E. McGarrah, and B. A. Walker 1981. Basalt-radionuclide reactions: FY-1981.
Annual report. PNL-3992. Pacific Northwest Laboratories, Richland, Washington.
Ames, L. L., J. E. McGarrah, and B. A. Walker 1983. "Sorption of trace constituents from
aqueous-solutions onto secondary minerals 2. Radium." Clays and Clay Minerals.
31(5):335-342.
Apted, M. 1998. "A modest proposal: A robust, cost-effective design for high-level waste
packages." Mat. Res. Soc. Symp. Proc. 506:589-596.
Ashida, T., T. Shibutani, H. Sato, Y. Tachi, A. Kitamura, and K. Kawamura 1999. "Nuclide
Migration Study in the QUALITY-Data Acquisitions for the Second Progress Report."
JAEA Sorption Database System, Version 3. Japan Atomic Energy Agency. Retrieved
Sept. 2010 from http://migrationdb.jaea.go.jp/english.html.
Banwart, S. A., E. Gustafsson, and M. Laaksharju 1999. "Hydrological and reactive processes
during rapid recharge to fracture zones - The Aspo large scale redox experiment."
Applied Geochemistry. 14(7):873-892.
Baston, G. M. N., J. A. Berry, K. A. Bond, M. Brownsword, and C. M. Linklater 1991. "Studies
of the Effects of Organic Materials on the Sorption of Uranium(IV) and Thorium(IV) on
London Clay and Caithness Flagstones." U. Nirex. JAEA Sorption Database System,
Version 3. Japan Atomic Energy Agency. Retrieved Sept. 2010 from
http://migrationdb.jaea.go.jp/english.html.
Baston, G. M. N., J. A. Berry, M. Brownsword, T. G. Heath, D. J. Ilett, R. McCrohon, C. J.
Tweed, and M. Yui 1999. "The sorption of polonium, actinium and protactinium onto
geological materials." Scientific Basis for Nuclear Waste Management Xxii. D. J.
Wronkiewicz and J. H. Lee (eds.). Materials Research Society, Warrendale. 556:1107-
1114.
Brady, P. V., B. W. Arnold, G. A. Freeze, P. N. Swift, S. J. Bauer, J. L. Kanney, R. P. Rechard,
and J. S. Stein 2009. Deep borehole disposal of high-level radioactive waste.
SAND2009-4401. Sandia National Laboratories, Albuquerque, New Mexico.
Buck, E., and D. C. Sassani 2007. Waste Form and In-Drift Colloids-Associated Radionuclide
Concentrations: Abstraction and Summary. MDL-EBS-PA-000004 REV 03. Sandia
National Laboratories, Albuquerque, New Mexico.
Bush, J. B. 1976. Economic and Technical Feasibility Study of Compressed Air Storage. ERDA
76-76. General Electric Company, Schenectady, New York.
Carmichael, R. S., ed. 1982. Handbook of Physical Properties of Rocks, Volume II. CRC Press,
Boca Raton, Florida.

82
Carter, J. T., and A. J. Luptak 2010. Fuel Cycle Potential Waste Inventory for Disposition.
Report FCRR&D-USED-2010-000031. U.S. DOE.
de Marsily, G. 1986. Quantitative Hydrogeology: Groundwater Hydrology for Engineers.
Academic Press, San Diego, California.
DOE 1996. Title 40 CFR Part 191. DOE/CAO-1996-2184. U.S. Department of Energy,
Carlsbad, New Mexico.
DOE 2008. Yucca Mountain Repository Safety Analysis Report. DOE/RW-0573. Office of
Civilian Radioactive Waste Management, U.S. Department of Energy, Las Vegas,
Nevada.
Erdal, B. R., K. Wolfsberg, R. Vidale, C. Duffy, and D. C. Hoffman 1977. "Laboratory
Measurements of Radionuclide Distribution between Selected Ground Waters and
Geologic Media." P. N. Laboratory. JAEA Sorption Database System, Version 3. Japan
Atomic Energy Agency. Retrieved Sept. 2010 from
http://migrationdb.jaea.go.jp/english.html.
Freeze, G. A., P. E. Mariner, J. E. Houseworth, and J. C. Cunnane 2010. Used Fuel Disposition
Campaign Features, Events, and Processes (FEPs): FY10 Progress Report. SAND2010-
5902. Sandia National Laboratories, Albuquerque, New Mexico.
Freeze, R. A., and J. A. Cherry 1979. Groundwater. Prentice-Hall, Inc., Englewood Cliffs, New
Jersey.
Garisto, F., J. Avis, T. Chshyolkova, P. Gierszewski, M. Gobien, C. Kitson, T. Melnyk, J. Miller,
R. Walsh, and L. Wojciechowski 2010. Glaciation Scenario: Safety Assessment for a
Deep Geological Repository for Used Fuel. Nuclear Waste Management Organization,
Toronto, Ontario.
Garisto, F., T. Kempe, and P. Gierszewski 2009. Technical Summary of the Safety Aspects of the
Deep Geological Repository Concept for Used Nuclear Fuel. NWMO TR-2009-12.
Nuclear Waste Management Organization, Toronto, Ontario.
Gascoyne, M., C. C. Davison, J. D. Ross, and R. Pearson 1987. "Saline groundwaters and brines
in plutons in the Canadian Shield." Saline Water and Gases in Crystalline Rocks. P. Fritz
and S. K. Frape (eds.). Geological Association of Canada, Waterloo, Ontario. Special
Paper 33:53-68.
Gierszewski, P., J. Avis, N. Calder, A. D'Andrea, F. Garisto, C. Kitson, T. Melnyk, K. Wei, and
L. Wojciechowski 2004. Third Case Study - Postclosure Safety Assessment. Report No:
06819-REP-01200-10109-R00. Ontario Power Generation, Toronto, Ontario.

83
Gross, M. B. 2007. Seismic Consequence Abstraction. MDL-WIS-PA-000003 Rev. 3. Sandia
National Laboratories, Las Vegas, Nevada.
Hansen, F. D., E. L. Hardin, and A. Orrell 2011. "Geologic Disposal Options in the USA."
International High-Level Radioactive Waste Conference 2011, Albuquerque, NM,
American Nuclear Society. 13:934-940.
Hansen, F. D., E. L. Hardin, R. P. Rechard, G. A. Freeze, D. C. Sassani, P. V. Brady, C. M.
Stone, M. J. Martinez, J. F. Holland, T. Dewers, K. N. Gaither, S. R. Sobolik, and R. T.
Cygan 2010. Shale Disposal of U.S. High-Level Radioactive Waste. SAND2010-2843.
Sandia National Laboratories, Albuquerque, New Mexico.
Hansen, F. D., and M. K. Knowles 2000. "Design and analysis of a shaft seal system for the
Waste Isolation Pilot Plant." Reliability Engineering and System Safety. 69:87-98.
Hansen, F. D., and C. D. Leigh 2011. Salt Disposal of Heat-Generating Nuclear Waste.
SAND2011-0161. Sandia National Laboratories, Albuquerque, New Mexico.
Havlova, V., A. Laciok, D. Vopalka, and M. Andrlik 2006. "Geochemical study of uranium
mobility in tertiary argillaceous system at Ruprechtov site, Czech Republic."
Czechoslovak Journal of Physics. 56:D81-D86.
Hess, H. H., J. N. Adkins, W. B. Heroy, W. E. Benson, M. K. Hubbert, J. C. Frye, R. J. Russell,
and C. V. Theis 1957. The Disposal of Radioactive Waste on Land. Publication 519.
National Academy of Sciences, Washington, D.C.
Hoek, E., and E. T. Brown 1980. Underground Excavations in Rock. The Institution of Mining
and Metallurgy, London.
IAEA 2003. "Reference Biospheres" for Solid Radioactive Waste Disposal. IAEA-BIOMASS-6.
International Atomic Energy Agency, Vienna, Austria.
IAEA 2006. Geological Disposal of Radioactive Waste. Safety Requirements No. WS-R-4.
International Atomic Energy Agency, Vienna, Austria.
ICRP 1997. "ICRP Publication 77: Radiological Protection Policy for the Disposal of
Radioactive Waste." Annals of the ICRP. 27(Supplement).
Ikeda, T., and T. Amaya 1998. "Model Development of Chemical Evolution in Repository Vol.II
Acquisition of Nuclide Migration Data in Near-Field." JAEA Sorption Database System,
Version 3. Japan Atomic Energy Agency. Retrieved Sept. 2010 from
http://migrationdb.jaea.go.jp/english.html.
Kitamura, A., T. Tomura, and T. Shibutani 2002. "Sorption Behavior of Neptunium onto
Smectite under Reducing Conditions in Carbonate Media." JAEA Sorption Database

84
System, Version 3. Japan Atomic Energy Agency. Retrieved Sept. 2010 from
http://migrationdb.jaea.go.jp/english.html.
Krech, W. W., F. A. Henderson, and K. D. Hjelmstad 1974. A Standard Rock Suite for Rapid
Excavation Research. BM-RI-7865. U.S. Bureau of Mines Report of Investigations.
Lama, R. D., and V. S. Vutukuri 1978. Handbook on Mechanical Properties of Rocks, Volume II
Testing Techniques and Results. Trans Tech Publications, Bay Village, Ohio.
McKinley, I. G. 1997. "Engineering for robustness: An approach to optimising HLW disposal
concepts." Waste Management. 17(1):1-8.
McKinley, I. G., W. R. Alexander, and P. C. Blaser 2007. "Development of Geological Disposal
Concepts." Radioactivity in the Environment. W. R. Alexander and I. G. McKinley (eds.).
Elsevier, Amsterdam. 9:41-76.
McKinley, I. G., H. Kawamura, and H. Tsuchi 2000. "Moving HLW-EBS concepts into the 21st
century." Scientific Basis for Nuclear Waste Management Xxiv. 663:723-729.
McKinley, I. G., F. B. Neall, H. Kawamura, and H. Umeki 2006. "Geochemical optimization of
a disposal system for high-level radioactive waste." Journal of Geochemical Exploration.
90:1-8.
McMurry, J., D. A. Dixon, J. D. Garroni, B. M. Ikeda, S. Stroes-Gascoyne, P. Baumgartner, and
T. W. Melnyk 2003. Evolution of a Canadian deep geologic repository: Base scenario.
Nuclear Waste Management Division Report 06819-REP-01200-10092-R00. Ontario
Power Generation, Toronto, Canada.
Mucciardi, A. N., T. C. Johnson, and J. Saunier 1979. "Statistical Investigation of the Mechanics
Controlling Radionuclide Sorption." B. N. Laboratory. JAEA Sorption Database System,
Version 3. Japan Atomic Energy Agency. Retrieved Sept. 2010 from
http://migrationdb.jaea.go.jp/english.html.
Ochs, M., M. Boonekamp, H. Wanner, H. Sato, and M. Yui 1998. "A quantitative model for ion
diffusion in compacted bentonite." Radiochimica Acta. 82:437-443.
Oda, C., T. Ikeda, and M. Shibata 1999. "Experimental Studies for Sorption Behavior of Tin on
Bentonite and Rocks and Diffusion Behavior of Tin in Compacted Bentonite." JAEA
Sorption Database System, Version 3. Japan Atomic Energy Agency. Retrieved Sept.
2010 from http://migrationdb.jaea.go.jp/english.html.
Patrick, W. C. 1986. Spent-Fuel Test - Climax: An Evaluation of the Technical Feasibility of
Geologic Storage of Spent Nuclear Fuel in Granite. UCRL-53762. Lawrence Livermore
National Laboratory, Livermore, California.

85
Posiva 2006. Expected Evolution of a Spent Nuclear Fuel Repository at Olkiluoto. B. Pastina and
P. Hellä (eds.). POSIVA 2006-05. Posiva Oy, Olkiluoto, Finland.
Posiva 2007. Impact of Corrosion-Derived Iron on the Bentonite Buffer Within the KBS-3H
Disposal Concept – the Olkiluoto Site as Case Study. POSIVA 2007-11. Posiva Oy,
Olkiluoto, Finland.
Posiva 2008a. Groundwater Flow and Transport Simulations in Support of RNT-2008 Analysis.
Working Report 2008-52. Posiva Oy, Olkiluoto, Finland.
Posiva 2008b. Radionuclide Release and Transport – RNT-2008. POSIVA 2008-06. Posiva Oy,
Olkiluoto, Finland.
Posiva 2009. Modelling of Groundwater Flow and Solute Transport in Olkiluoto – Update 2008.
Working Report 2009-78. Posiva Oy, Olkiluoto, Finland.
Posiva 2010. Models and Data Report 2010. POSIVA 2010-01. Posiva Oy, Olkiluoto, Finland.
Rancon, D., and J. Rochon 1979. "Retention of long-lived radionuclides in different neutral
materials." B. International Atomic Energy Agency. JAEA Sorption Database System,
Version 3. Japan Atomic Energy Agency. Retrieved Sept. 2010 from
http://migrationdb.jaea.go.jp/english.html.
Schwartz, F., and H. Zhang 2003. Fundamentals of Groundwater. John Wiley and Sons, New
York.
SKB 2003a. The Buffer and Backfill Handbook. SKB TR-03-07. Svensk Kärnbränslehantering
AB, Stockholm, Sweden.
SKB 2003b. Task force on modelling of groundwater flow and transport of solutes. SKB TR-03-
07. Svensk Kärnbränslehantering AB, Stockholm, Sweden.
SKB 2006a. Buffer and backfill process report for the safety assessment SR-Can. SKB TR-06-
18. Svensk Kärnbränslehantering AB, Stockholm, Sweden.
SKB 2006b. Data report for the safety assessment SR-Can. SKB TR-06-25. Svensk
Kärnbränslehantering AB, Stockholm, Sweden.
SKB 2006c. Fuel and canister process report for the safety assessment SR-Can. SKB TR-06-22.
Svensk Kärnbränslehantering AB, Stockholm, Sweden.
SKB 2006d. Long-term safety for KBS-3 repositories at Forsmark and Laxemar – a first
evaluation. SKB TR-06-09. Svensk Kärnbränslehantering AB, Stockholm, Sweden.
SKB 2011. Long-term safety for the final repository for spent nuclear fuel at Forsmark. TR-11-
01. Svensk Kärnbränslehantering AB, Stockolm, Sweden.

86
Smedes, H. W. 1983. A National Survey of Crystalline Rocks and Recommendations of Regions
to be Explored for High-Level Radioactive Waste Repository Sites. Technical Report
OCRD-1. Battelle Memorial Institute, Columbus, Ohio.
SNL 1993. Initial Performance Assessment of the Disposal of Spent Nuclear Fuel and High-
Level Waste Stored at Idaho National Engineering Laboratory. R. P. Rechard (ed.).
SAND93-2330. Sandia National Laboratories, Albuquerque, New Mexico.
Tachi, Y., and T. Shibutani 1999. "Sorption and Diffusion Behavior of Radium on Bentonite and
Rocks." JAEA Sorption Database System, Version 3. Japan Atomic Energy Agency.
Retrieved Sept. 2010 from http://migrationdb.jaea.go.jp/english.html.
Tachi, Y., T. Shibutani, Y. Nishikawa, and T. Shinozaki 1999a. "Sorption Behavior of Selenium
on Bentonite and Granodiorite under Reducing Conditions." JAEA Sorption Database
System, Version 3. Japan Atomic Energy Agency. Retrieved Sept. 2010 from
http://migrationdb.jaea.go.jp/english.html.
Tachi, Y., T. Shibutani, H. Sato, and M. Shibata 1999b. "Sorption and Diffusion Behavior of
Palladium in Bentonite, Granodiorite and Tuff." JAEA Sorption Database System,
Version 3. Japan Atomic Energy Agency. Retrieved Sept. 2010 from
http://migrationdb.jaea.go.jp/english.html.
Taki, H., and K. Hata 1991. "Measurement Study on Distribution Coefficient and Effective
Diffusion Coefficient for Some Rocks and Bentonite." JAEA Sorption Database System,
Version 3. Japan Atomic Energy Agency. Retrieved Sept. 2010 from
http://migrationdb.jaea.go.jp/english.html.
Touloukian, Y. S., W. R. Judd, and R. F. Roy 1981. Physical Properties of Rocks and Minerals,
Volume II-2. McGraw-Hill, New York.
Ueta, S. 1998. "Development of Database System for Performance Assessment(III)." JAEA
Sorption Database System, Version 3. Japan Atomic Energy Agency. Retrieved Sept.
2010 from http://migrationdb.jaea.go.jp/english.html.
Ulrich, H. J., and C. Degueldre 1993. "The sorption of Pb-210, Bi-210 and Po-210 on
montmorillonite - A study with emphasis on reversibility aspects and on the effect of the
radioactive decay of adsorbed nuclides." Radiochimica Acta. 62(1-2):81-90.
Van der Leeden, F., F. L. Troise, and D. K. Todd 1990. The Water Encyclopedia. 2nd ed. Lewis
Publishers, Chelsea, Michigan.

A-1
APPENDIX A: U.S. NUCLEAR WASTE INVENTORY
Three different types of HLW were considered in the source-term model: commercial UNF,
existing DOE HLW, and reprocessing HLW of the commercial UNF. The radionuclide inventory
presented in this appendix is based on the detailed fuel cycle waste inventory analysis data
presented in Carter and Luptak (2010). The inventory consists of actinide elements in several
radionuclide decay chains along with a number of fission products.
A.1 Commercial Used Nuclear Fuel Inventory
The once-through fuel cycle waste inventory analysis considered four scenarios to evaluate the
projected increases in the commercial light water reactor (LWR) UNF inventory. The scenarios
were considered to provide a wide range of LWR fuel inventory for use in future analysis (Carter
and Luptak 2010, Section 3.2). The inventory analysis used Scenario 1, which assumes no
replacement of existing nuclear generation reactors. Selection of this particular scenario for the
inventory analysis is arbitrary, and it may be revised in future analysis. For this scenario, a total
of 140,000 metric tons uranium (MTU) used fuel is estimated to be discharged from reactors by
the year 2055 (Carter and Luptak 2010, Table 3-5). Out of the total inventory, 91,000 MTU is for
the pressurized water reactors (PWRs) used fuels with an estimated total of 209,000 assemblies.
This is equivalent to 0.435 MTU per PWR assembly.
For simplification of the source-term inventory analysis, the total inventory was converted to the
equivalent PWR inventory, resulting in a total of 321,540 PWR assemblies. The source-term
model assumes that a waste package (WP) contains 10 PWR assemblies, and a total of 32,154
waste packages are needed to dispose of the commercial UNF.
The isotope inventory of the UNF is assumed to be represented by the PWR fuel with a burn-up
of 60 GWd/MTIHM and 4.73% enrichment and aged 30 years after discharge from reactor
(Carter and Luptak 2010, Table C-1). The isotope inventory for the radionuclides of the
commercial UNF included in the source-term model is shown in Table A-1.
A.2 DOE High-Level Radioactive Waste
All existing DOE HLW is assumed to be immobilized in the borosilicate glass logs. The source-
term inventory analysis used the best-estimate projected total number of DOE HLW canisters
documented in the fuel cycle inventory analysis report (Carter and Luptak 2010, Table 2-2); the
best estimate projection is 25,016 canisters. The source-term model assumes that each waste
package contains 5 HLW canisters, and a total of 5,003 waste packages are needed to dispose of
the DOE HLW.
The isotope inventory of the DOE HLW is given for each radionuclide in terms of the total
radioactivity ( ) in the fuel cycle inventory analysis report (Carter and Luptak 2010, Table F-1).
The radioactivity was converted to the equivalent mass ( ) for each radionuclide as follows:
( )
, (A-1)

A-2
where is the radioactivity of radionuclide i, is the half-life of radionuclide i, is the
molecular weight of radionuclide i, and is the Avogadro constant (6.023 × 10²³
). The total
mass of radionuclides of the existing DOE HLW is estimated to be 1,759 MT. This results in
0.07 MT of radionuclides per HLW canister, and 0.35 MT of radionuclides per waste package.
The isotope inventory per HLW canister and per waste package for the radionuclides included in
the source-term model is given in Table A-2.
A.3 Reprocessing High-Level Radioactive Waste
The fuel cycle inventory analysis report discusses several candidate reprocessing methods for
commercial UNF and their potential waste streams (Carter and Luptak 2010, Section 4). For
simplification of the source-term model analysis, the following assumptions were made for
“hypothetical” reprocessing of commercial UNF:
Ninety nine percent (99%) of uranium and plutonium are recovered. All others including
transuranic elements and fission products of the commercial UNF inventory (140,000
MTU) remain in the waste streams.
Reprocessing HLW is immobilized in borosilicate glass as for the DOE HLW.
Reprocessing HLW is encapsulated at the same radionuclide mass loading as for the
DOE HLW (i.e., 0.07 MT radionuclide mass per canister).
Note that the above assumptions result in higher concentrations of fission products in the
hypothetical reprocessing waste streams and glass waste form than the DOE HLW.
The total radionuclide mass of the hypothetical reprocessing HLW is estimated to be 1,426 MT
(after removing 99% of uranium and plutonium). With a radionuclide mass loading of 0.07 MT
per canister, this is equivalent to a total of 20,276 canisters. The source-term model assumes that
each waste package contains five reprocessing HLW canisters, and a total of 4,055 waste
packages are needed for disposal. The isotope inventory per reprocessing HLW canister and per
waste package for the radionuclides included in the source-term model is given in Table A-3.
A.4 References
Carter, J. T., and A. J. Luptak 2010. Fuel Cycle Potential Waste Inventory for Disposition.
Report FCRR&D-USED-2010-000031. U.S. DOE.

A-3
Table A-1. Isotope Inventory for Commercial UNF Used for Source-Term Model Analysis.
Isotope Half Life (years)
Fractional Mass Inventory
Isotope mass per WP (g)
Ac-227 2.18E+01 2.7469E-13 1.1960E-06
Am-241 4.32E+02 8.7003E-04 3.7882E+03
Am-243 7.37E+03 1.8796E-04 8.1841E+02
C-14 5.71E+03 3.1524E-07 1.3726E+00
Cl-36 3.01E+05 3.4808E-07 1.5156E+00
Cm-245 8.50E+03 6.6221E-06 2.8833E+01
Cs-135 2.30E+06 5.3570E-04 2.3325E+03
Cs-137 3.01E+01 7.2561E-04 3.1593E+03
I-129 1.70E+07 2.1754E-04 9.4720E+02
Nb-93 1.36E+01 4.9591E-04 2.1592E+03
Np-237 2.14E+06 8.5892E-04 3.7398E+03
Pa-231 3.25E+04 7.1103E-10 3.0959E-03
Pb-210 2.26E+01 7.8324E-15 3.4103E-08
Pd-107 6.50E+06 2.8663E-04 1.2480E+03
Pu-238 8.77E+01 3.4170E-04 1.4878E+03
Pu-239 2.41E+04 5.1487E-03 2.2418E+04
Pu-240 6.54E+03 2.8427E-03 1.2377E+04
Pu-241 1.44E+01 2.6198E-04 1.1407E+03
Pu-242 3.76E+05 5.6750E-04 2.4709E+03
Ra-226 1.60E+03 2.2081E-12 9.6141E-06
Ra-228 6.70E+00 1.4339E-18 6.2431E-12
Sb-126 3.61E-05 1.6470E-12 7.1713E-06
Se-79 2.95E+05 7.2769E-06 3.1684E+01
Sn-126 1.00E+05 3.4663E-05 1.5092E+02
Sr-90 2.91E+01 3.0809E-04 1.3414E+03
Tc-99 2.13E+05 8.8739E-04 3.8638E+03
Th-229 7.90E+03 4.4252E-12 1.9267E-05
Th-230 7.54E+03 1.5838E-08 6.8961E-02
Th-232 1.41E+10 4.2412E-09 1.8466E-02
U-232 6.89E+01 3.1642E-09 1.3777E-02
U-233 1.59E+05 9.7002E-09 4.2235E-02

A-4
Isotope Half Life (years)
Fractional Mass Inventory
Isotope mass per WP (g)
U-234 2.45E+05 2.1220E-04 9.2392E+02
U-235 7.04E+08 3.7329E-03 1.6253E+04
U-236 2.34E+07 4.3349E-03 1.8874E+04
U-238 4.46E+09 6.3215E-01 2.7524E+06
Zr-93 1.53E+06 1.0193E-03 4.4382E+03
Table A-2. Isotope Inventory for DOE HLW Used for Source-Term Model Analysis.
Isotope Half Life (years)
Fractional Mass Inventory
Isotope mass per canister (g)
Isotope mass per WP (g)
Ac-227 2.18E+01 1.139E-09 8.010E-05 4.005E-04
Am-241 4.32E+02 4.022E-04 2.829E+01 1.414E+02
Am-243 7.37E+03 2.732E-05 1.922E+00 9.608E+00
C-14 5.71E+03 1.747E-08 1.228E-03 6.142E-03
Cl-36 3.01E+05 0.000E+00 0.000E+00 0.000E+00
Cm-245 8.50E+03 5.428E-07 3.817E-02 1.909E-01
Cs-135 2.30E+06 1.759E-03 1.237E+02 6.184E+02
Cs-137 3.01E+01 2.219E-03 1.561E+02 7.804E+02
I-129 1.70E+07 1.802E-04 1.268E+01 6.338E+01
Nb-93 1.36E+01 0.000E+00 0.000E+00 0.000E+00
Np-237 2.14E+06 3.004E-04 2.113E+01 1.056E+02
Pa-231 3.25E+04 3.452E-06 2.427E-01 1.214E+00
Pb-210 2.26E+01 1.317E-13 9.264E-09 4.632E-08
Pd-107 6.50E+06 2.188E-05 1.539E+00 7.696E+00
Pu-238 8.77E+01 2.070E-04 1.456E+01 7.279E+01
Pu-239 2.41E+04 1.749E-03 1.230E+02 6.151E+02
Pu-240 6.54E+03 1.865E-04 1.312E+01 6.559E+01
Pu-241 1.44E+01 2.468E-06 1.736E-01 8.678E-01
Pu-242 3.76E+05 2.154E-05 1.515E+00 7.573E+00
Ra-226 1.60E+03 5.747E-11 4.042E-06 2.021E-05
Ra-228 6.70E+00 4.563E-11 3.209E-06 1.604E-05
Sb-126 3.61E-05 5.728E-12 4.029E-07 2.014E-06
Se-79 2.95E+05 3.085E-04 2.169E+01 1.085E+02
Sn-126 1.00E+05 1.215E-04 8.548E+00 4.274E+01

A-5
Isotope Half Life (years)
Fractional Mass Inventory
Isotope mass per canister (g)
Isotope mass per WP (g)
Sr-90 2.91E+01 9.262E-04 6.514E+01 3.257E+02
Tc-99 2.13E+05 3.212E-03 2.259E+02 1.129E+03
Th-229 7.90E+03 9.980E-09 7.019E-04 3.509E-03
Th-230 7.54E+03 4.546E-09 3.197E-04 1.599E-03
Th-232 1.41E+10 9.894E-02 6.958E+03 3.479E+04
U-232 6.89E+01 1.141E-09 8.022E-05 4.011E-04
U-233 1.59E+05 5.300E-05 3.727E+00 1.864E+01
U-234 2.45E+05 7.431E-05 5.226E+00 2.613E+01
U-235 7.04E+08 3.732E-03 2.625E+02 1.312E+03
U-236 2.34E+07 2.863E-04 2.014E+01 1.007E+02
U-238 4.46E+09 8.821E-01 6.204E+04 3.102E+05
Zr-93 1.53E+06 1.739E-03 1.223E+02 6.115E+02
Table A-3. Isotope Inventory for Reprocessing HLW Used for Source-Term Model Analysis.
Isotope Half Life (years)
Fractional Mass Inventory
Isotope mass per canister (g)
Isotope mass per WP (g)
Ac-227 2.18E+01 2.6969E-11 1.8967E-06 9.4833E-06
Am-241 4.32E+02 8.5419E-02 6.0073E+03 3.0037E+04
Am-243 7.37E+03 1.8454E-02 1.2978E+03 6.4892E+03
C-14 5.71E+03 3.0950E-05 2.1766E+00 1.0883E+01
Cl-36 3.01E+05 0.0000E+00 0.0000E+00 0.0000E+00
Cm-245 8.50E+03 6.5015E-04 4.5724E+01 2.2862E+02
Cs-135 2.30E+06 5.2594E-02 3.6989E+03 1.8494E+04
Cs-137 3.01E+01 7.1239E-02 5.0101E+03 2.5051E+04
I-129 1.70E+07 2.1358E-02 1.5021E+03 7.5104E+03
Nb-93 1.36E+01 6.8717E-07 4.8327E-02 2.4164E-01
Np-237 2.14E+06 8.4328E-02 5.9306E+03 2.9653E+04
Pa-231 3.25E+04 6.9808E-08 4.9094E-03 2.4547E-02
Pb-210 2.26E+01 7.6897E-13 5.4080E-08 2.7040E-07
Pd-107 6.50E+06 2.8141E-02 1.9791E+03 9.8956E+03
Pu-238 8.77E+01 3.3547E-05 2.3593E+00 1.1797E+01
Pu-239 2.41E+04 5.0549E-04 3.5550E+01 1.7775E+02
Pu-240 6.54E+03 2.7909E-04 1.9628E+01 9.8141E+01

A-6
Isotope Half Life (years)
Fractional Mass Inventory
Isotope mass per canister (g)
Isotope mass per WP (g)
Pu-241 1.44E+01 2.5721E-05 1.8089E+00 9.0446E+00
Pu-242 3.76E+05 5.5717E-05 3.9184E+00 1.9592E+01
Ra-226 1.60E+03 2.1679E-10 1.5246E-05 7.6230E-05
Ra-228 6.70E+00 1.4077E-16 9.9004E-12 4.9502E-11
Sb-126 3.61E-05 1.6170E-10 1.1372E-05 5.6861E-05
Se-79 2.95E+05 7.1444E-04 5.0245E+01 2.5122E+02
Sn-126 1.00E+05 3.4031E-03 2.3933E+02 1.1967E+03
Sr-90 2.91E+01 3.0248E-02 2.1273E+03 1.0636E+04
Tc-99 2.13E+05 8.7123E-02 6.1272E+03 3.0636E+04
Th-229 7.90E+03 4.3446E-10 3.0554E-05 1.5277E-04
Th-230 7.54E+03 1.5550E-06 1.0936E-01 5.4680E-01
Th-232 1.41E+10 4.1639E-07 2.9284E-02 1.4642E-01
U-232 6.89E+01 3.1066E-10 2.1848E-05 1.0924E-04
U-233 1.59E+05 9.5236E-10 6.6977E-05 3.3489E-04
U-234 2.45E+05 2.0833E-05 1.4652E+00 7.3258E+00
U-235 7.04E+08 3.6649E-04 2.5775E+01 1.2887E+02
U-236 2.34E+07 4.2559E-04 2.9931E+01 1.4966E+02
U-238 4.46E+09 6.2063E-02 4.3648E+03 2.1824E+04
Zr-93 1.53E+06 1.0008E-01 7.0381E+03 3.5191E+04

B-1
APPENDIX B: FEATURES, EVENTS, AND PROCESSES
B.1 FEPs and Likely Screening Decisions
The working FEPs list (Freeze et al. 2010) of the U.S. DOE Used Fuel Disposition (UFD) Campaign is
shown in Table B-1. Likely screening decisions are presented for a generic repository in granite.
Table B-1. Likely UFD FEPs Screening Decisions for a Mined Repository in Granite.
Likely UFD FEP Screening Number Description Associated Processes Decision Comment
0.1.02.01 Timescales of Concern (unspecified) Include
0.1.03.01 Spatial Domain of Concern (unspecified) Include
0.1.09.01 Regulatory Requirements and (unspecified) Include U.S. regulations Exclusions will need to be revised
0.1.10.01 Model Issues - Conceptual model Include - Mathematical implementation - Geometry and dimensionality - Process coupling - Boundary and initial conditions
0.1.10.02 Data Issues - Parameterization and values Include - Correlations - Uncertainty
1.1.01.01 Open Boreholes - Site investigation boreholes (open, improperly sealed) Exclude - Preclosure and postclosure monitoring boreholes - Enhanced flow pathways from EBS
1.1.02.01 Chemical Effects from Preclosure - Water contaminants (explosives residue, diesel, Exclude Operations (EBS, EDZ, Host organics, etc.) Rock) - Water chemistry different than host rock (e.g., oxiding) - Undesirable materials left - Accidents and unplanned events
1.1.02.02 Mechanical Effects from - Creation of excavation-disturbed zone (EDZ) Exclude Preclosure Operations (EBS, EDZ, - Stress relief Host Rock) - Boring and blasting effects - Rock reinforcement effects (drillholes) - Accidents and unplanned events - Enhanced flow pathways
1.1.02.03 Thermal-Hydrologic Effects from - Site flooding Exclude Preclosure Operations (EBS, EDZ, - Preclosure ventilation Host Rock) - Accidents and unplanned events
1.1.08.01 Deviations from Design and - Error in waste emplacement (waste forms, waste Exclude Inadequate Quality Control packages, waste package support materials) - Error in EBS component emplacement - Inadequate excavation / construction (planning, schedule, implementation) - Aborted / incomplete closure of repository - Material and/or component defects

B-2
Likely UFD FEP Screening Number Description Associated Processes Decision Comment
1.1.10.01 Control of Repository Site - Active controls (controlled area) Exclude - Retention of records - Passive controls (markers)
1.1.13.01 Retrievability (unspecified) Include However, the U.S. may reconsider current policy
1.2.01.01 Tectonic Activity – Large Scale - Uplift Exclude - Folding
1.2.02.01 Subsidence (unspecified) Exclude
1.2.03.01 Seismic Activity Impacts EBS - Mechanical damage to EBS (from ground motion, Exclude and/or EBS Components rockfall, drift collapse, fault displacement)
1.2.03.02 Seismic Activity Impacts - Altered flow pathways and properties Exclude Geosphere (Host Rock, Other - Altered stress regimes (faults, fractures) Geologic Units)
1.2.03.03 Seismic Activity Impacts - Altered surface characteristics Exclude Biosphere (Surface Environment, - Altered surface transport pathways Human Behavior) - Altered recharge
1.2.04.01 Igneous Activity Impacts EBS - Mechanical damage to EBS (from igneous intrusion) Exclude and/or EBS Components - Chemical interaction with magmatic volatiles - Transport of radionuclides (in magma, pyroclasts, vents)
1.2.04.02 Igneous Activity Impacts - Altered flow pathways and properties Exclude Geosphere (Host Rock, Other - Altered stress regimes (faults, fractures) Geologic Units) - Igneous intrusions - Altered thermal and chemical conditions
1.2.04.03 Igneous Activity Impacts - Altered surface characteristics Exclude Biosphere (Surface Environment, - Altered surface transport pathways Human Behavior) - Altered recharge - Ashfall and ash redistribution
1.2.05.01 Metamorphism - Structural changes due to natural heating and/or Exclude pressure
1.2.08.01 Diagenesis - Mineral alteration due to natural processes Exclude
1.2.09.01 Diapirism - Plastic flow of rocks under lithostatic loading Exclude - Salt / evaporates - Clay
1.2.09.02 Large-Scale Dissolution (unspecified) Exclude
1.3.01.01 Climate Change (Natural and - Variations in precipitation and temperature Include Anthropogenic) - Long-term global - Short-term regional and local
1.3.04.01 Periglacial Effects - Permafrost Include? Decision would - Seasonal freeze/thaw depend upon site latitude

B-3
Likely UFD FEP Screening Number Description Associated Processes Decision Comment
1.3.05.01 Glacial and Ice Sheet Effects - Glaciation Include? Decision would - Isostatic depression depend upon - Melt water site latitude
1.4.01.01 Human Influences on Climate - Variations in precipitation and temperature Exclude (Intentional and Accidental) - Global, regional, and/or local - Greenhouse gases, ozone layer failure
1.4.02.01 Human Intrusion (Deliberate and - Drilling (resource exploration, …) Include Need regulatory Inadvertent) - Mining / tunneling clarification; 40 - Unintrusive site investigation (airborne, surface- CFR 191 and 40 based, …) CFR 197 include it but differently
1.4.11.01 Explosions and Crashes from - War Exclude Human Activities - Sabotage - Testing - Resource exploration / exploitation - Aircraft
1.5.01.01 Meteorite Impact - Cratering, host rock removal Exclude - Exhumation of waste - Alteration of flow pathways
1.5.01.02 Extraterrestrial Events - Solar systems (supernova) Exclude - Celestial activity (sun - solar flares, gamma-ray bursters; moon – earth tides) - Alien life forms
1.5.03.01 Earth Planetary Changes - Changes in earth’s magnetic field Exclude - Changes in earth’s gravitational field (tides)
2.1.01.01 Waste Inventory (Radionuclides - Composition Include and Non-Radionuclides) - Enrichment / Burn-up
2.1.01.02 Radioactive Decay and Ingrowth (unspecified) Include
2.1.01.03 Heterogeneity of Waste - Composition Include Inventory (Waste Package Scale - Enrichment / Burn-up and Repository Scale) - Damaged Area
2.1.01.04 Interactions between Co-Located (unspecified) Include Waste
2.1.02.01 SNF (Commercial, DOE) Degradation is dependent on: Include Degradation (Alteration/Phase - Composition Separation, - Geometry / structure Dissolution/Leaching, - Enrichment / burn-up Radionuclide Release) - Surface area - Gap and grain fraction - Damaged area - THC conditions

B-4
Likely UFD FEP Screening Number Description Associated Processes Decision Comment
2.1.02.02 HLW (Glass, Ceramic, Metal) Degradation is dependent on: Include Degradation (Alteration/Phase - Composition Separation, - Geometry / structure Dissolution/Leaching, Cracking, - Surface area Radionuclide Release) - Damaged / cracked area - Mechanical impact - THC conditions
2.1.02.03 Degradation of (unspecified) Exclude Organic/Cellulosic Materials in Waste
2.1.02.04 HLW (Glass, Ceramic, Metal) (unspecified) Exclude Recrystallization
2.1.02.05 Pyrophoricity or Flammable Gas (unspecified) Exclude from SNF or HLW
2.1.02.06 SNF Cladding Degradation and - Initial damage Include Failure - General corrosion - Microbially influenced corrosion - Localized corrosion - Enhanced corrosion (silica, fluoride) - Stress corrosion cracking - Hydride cracking - Unzipping - Creep - Internal pressure - Mechanical impact
2.1.03.01 Early Failure of Waste Packages - Manufacturing defects Include - Improper sealing
2.1.03.02 General Corrosion of Waste - Dry-air oxidation Include Packages - Humid-air corrosion - Aqueous phase corrosion - Passive film formation and stability
2.1.03.03 Stress Corrosion Cracking (SCC) - Crack initiation, growth and propagation Include of Waste Packages - Stress distribution around cracks
2.1.03.04 Localized Corrosion of Waste - Pitting Include Packages - Crevice corrosion - Salt deliquescence
2.1.03.05 Hydride Cracking of Waste - Hydrogen diffusion through metal matrix Exclude? Packages - Crack initiation and growth in metal hydride phases
2.1.03.06 Microbially Influenced Corrosion (unspecified) Exclude (MIC) of Waste Packages
2.1.03.07 Internal Corrosion of Waste (unspecified) Exclude Packages Prior to Breach
2.1.03.08 Evolution of Flow Pathways in - Evolution of physical form of waste package Exclude Waste Packages - Plugging of cracks in waste packages

B-5
Likely UFD FEP Screening Number Description Associated Processes Decision Comment
2.1.04.01 Evolution and Degradation of - Alteration Include Backfill - Thermal expansion / degradation - Swelling / compaction - Erosion / dissolution - Evolution of backfill flow pathways
2.1.05.01 Degradation of Seals - Alteration / degradation / cracking Include - Erosion / dissolution
2.1.06.01 Degradation of Liner / Rock - Alteration / degradation / cracking Include Reinforcement Materials in EBS - Corrosion - Erosion / dissolution / spalling
2.1.07.01 Rockfall - Dynamic loading (block size and velocity) Exclude
2.1.07.02 Drift Collapse - Static loading (rubble volume) Exclude - Alteration of seepage - Alteration of EBS flow pathways - Alteration of EBS thermal environment
2.1.07.03 Mechanical Effects of Backfill - Protection of other EBS components from rockfall / Exclude drift collapse
2.1.07.04 Mechanical Impact on Backfill - Rockfall / drift collapse Exclude - Hydrostatic pressure - Internal gas pressure
2.1.07.05 Mechanical Impact on Waste - Rockfall / drift collapse Exclude The waste Packages - Waste package movement package canister - Hydrostatic pressure is expected to - Internal gas pressure withstand the - Swelling corrosion products mechanical pressures in the repository
2.1.07.06 Mechanical Impact on SNF - Drift collapse Exclude Waste Form - Swelling corrosion products
2.1.07.07 Mechanical Impact on HLW - Drift collapse Exclude Waste Form - Swelling corrosion products
2.1.07.08 Mechanical Impact on Other EBS - Rockfall / drift collapse Exclude Components (Seals, Liner / Rock - Movement Reinforcement Materials, Waste - Hydrostatic pressure Package Support Materials) - Swelling corrosion products
2.1.07.09 Mechanical Effects at EBS - Component-to-component contact (static or dynamic) Exclude Component Interfaces
2.1.07.10 Mechanical Degradation of EBS - Floor buckling Exclude - Fault displacement - Initial damage from excavation / construction - Consolidation of EBS components - Degradation of waste package support structure - Alteration of EBS flow pathways

B-6
Likely UFD FEP Screening Number Description Associated Processes Decision Comment
2.1.08.01 Flow through the EBS - Saturated/unsaturated flow Include - Preferential flow pathways - Density effects on flow - Initial hydrologic conditions - Flow pathways out of EBS
2.1.08.02 Flow in and through Waste - Saturated/unsaturated flow Include Packages - Movement as thin films or droplets
2.1.08.03 Flow in Backfill - Fracture/matrix flow Include
2.1.08.04 Flow through Seals (unspecified) Include
2.1.08.05 Flow through Liner / Rock (unspecified) Include Reinforcement Materials in EBS
2.1.08.06 Alteration and Evolution of EBS - Drift collapse Include Flow Pathways - Degradation/consolidation of EBS components - Plugging of flow pathways - Formation of corrosion products - Water ponding
2.1.08.07 Condensation Forms in - Drift collapse Exclude Repository (on Tunnel - Degradation/consolidation of EBS components Roof/Walls, on EBS Components)
2.1.08.08 Capillary Effects in EBS - Wicking Include Resaturation of excavation
2.1.08.09 Influx/Seepage into the EBS - Water influx rate (spatial and temporal distribution) Include
2.1.09.01 Chemistry of Water Flowing into - Chemical characteristics of influent water (spatial and Include the Repository temporal distribution)
2.1.09.02 Chemical Characteristics of - Water composition (radionuclides, dissolved species, Include Water in Waste Packages …) - Initial void chemistry (air / gas) - Water chemistry (pH, ionic strength, pCO2, .. ) - Reduction-oxidation potential - Reaction kinetics - Influent chemistry (from tunnels and/or backfill) - Evolution of water chemistry / interaction with waste packages
2.1.09.03 Chemical Characteristics of - Water composition (radionuclides, dissolved species, Include Water in Backfill …) - Water chemistry (pH, ionic strength, pCO2, ..) - Reduction-oxidation potential - Reaction kinetics - Influent chemistry (from tunnels and/or waste package) - Evolution of water chemistry / interaction with backfill

B-7
Likely UFD FEP Screening Number Description Associated Processes Decision Comment
2.1.09.04 Chemical Characteristics of - Water composition (radionuclides, dissolved species, Include Water in Tunnels …) - Water chemistry (pH, ionic strength, pCO2, ..) - Reduction-oxidation potential - Reaction kinetics - Influent chemistry (from near-field host rock) - Initial chemistry (from construction / emplacement) - Evolution of water chemistry / interaction with seals, liner/rock reinforcement materials, waste package support materials - Reduction-oxidation potential
2.1.09.05 Chemical Interaction of Water - Corrosion product formation and composition (waste Include with Corrosion Products (in form, waste package internals, waste package) Waste Packages, in Backfill, in - Evolution of water chemistry in waste packages, in Tunnels) backfill, and in tunnels
2.1.09.06 Chemical Interaction of Water - Backfill composition and evolution (bentonite, Include with Backfill (on Waste Packages, crushed rock, ...) in Backfill, in Tunnels) - Evolution of water chemistry in backfill, and in tunnels - Enhanced degradation of waste packages (crevice formation)
2.1.09.07 Chemical Interaction of Water - Liner composition and evolution (concrete, metal, ...) Include with Liner / Rock Reinforcement - Rock reinforcement material composition and and Cementitious Materials in evolution (grout, rock bolts, mesh, ...) EBS (in Backfill, in Tunnels) - Other cementitious materials composition and evolution - Evolution of water chemistry in backfill, and in tunnels
2.1.09.08 Chemical Interaction of Water - Seals composition and evolution Include? with Other EBS Components (in - Waste package support composition and evolution Waste Packages, in Tunnels) (concrete, metal, …) - Other EBS components (other metals (copper), …) - Evolution of water chemistry in backfill, and in tunnels
2.1.09.09 Chemical Effects at EBS - Component-to-component contact (chemical Exclude Component Interfaces reactions) - Consolidation of EBS components
2.1.09.10 Chemical Effects of Waste-Rock - Waste-to-host rock contact (chemical reactions) Exclude Contact - Component-to-host rock contact (chemical reactions)
2.1.09.11 Electrochemical Effects in EBS - Enhanced metal corrosion Exclude
2.1.09.12 Chemical Effects of Drift Collapse - Evolution of water chemistry in backfill and in tunnels Exclude (from altered seepage, from altered thermal-hydrology)
2.1.09.13 Radionuclide Speciation and - Dissolved concentration limits Include Solubility in EBS (in Waste Form, - Limited dissolution due to inclusion in secondary in Waste Package, in Backfill, in phase Tunnel) - Enhanced dissolution due to alpha recoil

B-8
Likely UFD FEP Screening Number Description Associated Processes Decision Comment
2.1.09.51 Advection of Dissolved - Flow pathways and velocity Include Radionuclides in EBS (in Waste - Advective properties (porosity, tortuosity) Form, in Waste Package, in - Dispersion Backfill, in Tunnel) - Saturation
2.1.09.52 Diffusion of Dissolved - Gradients (concentration, chemical potential) Include Radionuclides in EBS (in Waste - Diffusive properties (diffusion coefficients) Form, in Waste Package, in - Flow pathways and velocity Backfill, in Tunnel) - Saturation
2.1.09.53 Sorption of Dissolved - Surface complexation properties Include Radionuclides in EBS (in Waste Form, in Waste Package, in Backfill, in Tunnel)
2.1.09.54 Complexation in EBS - Formation of organic complexants (humates, fulvates, Include? organic waste) - Enhanced transport of radionuclides associated with organic complexants
2.1.09.55 Formation of Colloids in EBS (in - Formation of intrinsic colloids Exclude Salinity and Waste Form, in Waste Package, - Formation of pseudo colloids (host rock fragments, buffer will limit in Backfill, in Tunnel) waste form fragments, corrosion products, microbes) colloidal stability - Formation of co-precipitated colloids and mobility in - Sorption/attachment of radionuclides to colloids EBS. However, (clay, silica, waste form, FeOx, microbes) deep penetration of glacial melt waters is a scenario that could stabilize colloids and erode buffer.
2.1.09.56 Stability of Colloids in EBS (in - Aqueous stability (dependent on water chemistry) Exclude Waste Form, in Waste Package, - Mechanical stability of colloid (dependent on colloid in Backfill, in Tunnel) size, gravitational settling)
2.1.09.57 Advection of Colloids in EBS (in - Flow pathways and velocity Exclude Waste Form, in Waste Package, - Advective properties (porosity, tortuosity) in Backfill, in Tunnel) - Dispersion - Saturation - Colloid concentration
2.1.09.58 Diffusion of Colloids in EBS (in - Gradients (concentration, chemical potential) Exclude Waste Form, in Waste Package, - Diffusive properties (diffusion coefficients) in Backfill, in Tunnel) - Flow pathways and velocity - Saturation - Colloid concentration
2.1.09.59 Sorption of Colloids in EBS (in - Sorption of radionuclides to colloids Exclude Waste Form, in Waste Package, - Surface complexation properties in Backfill, in Tunnel) - Sorption of colloids to immobile surfaces
2.1.09.60 Sorption of Colloids at Air-Water (unspecified) Exclude Interface in EBS

B-9
Likely UFD FEP Screening Number Description Associated Processes Decision Comment
2.1.09.61 Filtration of Colloids in EBS - Physical filtration (dependent on flow pathways, Exclude colloid size)
2.1.09.62 Radionuclide Transport through - Advection Include Liners and Seals - Dispersion - Diffusion - Sorption
2.1.09.63 Radionuclide Release from the - Spatial and temporal distribution of releases to the Include EBS (Dissolved, Colloidal, and host rock (due to varying flow pathways and velocities, Gas Phase) varying component degradation rates, varying transport properties)
2.1.10.01 Microbial Activity in EBS (Natural - Effects on corrosion Exclude and Anthropogenic) - Formation of complexants - Formation of microbial colloids - Formation of biofilms - Biodegradation - Biomass production - Bioaccumulation
2.1.11.01 Heat Generation in EBS - Heat transfer (spatial and temporal distribution of Include temperature and relative humidity)
2.1.11.02 Exothermic Reactions in EBS - Oxidation of SNF Exclude - Hydration of concrete
2.1.11.03 Effects of Backfill on EBS Thermal - Thermal blanket Include Environment - Condensation
2.1.11.04 Effects of Drift Collapse on EBS - Thermal blanket Exclude Thermal Environment - Condensation
2.1.11.05 Effects of Influx (Seepage) on - Temperature and relative humidity (spatial and Exclude Thermal Environment temporal distribution)
2.1.11.06 Thermal-Mechanical Effects on - Alteration Exclude Waste Form and In-Package EBS - Cracking Components - Thermal expansion / stress
2.1.11.07 Thermal-Mechanical Effects on - Thermal sensitization / phase changes Exclude Waste Packages - Cracking - Thermal expansion / stress / creep
2.1.11.08 Thermal-Mechanical Effects on - Alteration Exclude Backfill - Cracking - Thermal expansion / stress
2.1.11.09 Thermal-Mechanical Effects on - Alteration Exclude Other EBS Components (Seals, - Cracking Liner / Rock Reinforcement - Thermal expansion / stress Materials, Waste Package Support Structure)
2.1.11.10 Thermal Effects on Flow in EBS - Altered influx/seepage Include - Altered saturation / relative humidity (dry-out, resaturation) - Condensation

B-10
Likely UFD FEP Screening Number Description Associated Processes Decision Comment
2.1.11.11 Thermally-Driven Flow - Convection Include (Convection) in EBS
2.1.11.12 Thermally-Driven Buoyant Flow / - Vapor flow Include Heat Pipes in EBS
2.1.11.13 Thermal Effects on Chemistry (unspecified) Include and Microbial Activity in EBS
2.1.11.14 Thermal Effects on Transport in - Thermal diffusion (Soret effect) Exclude EBS - Thermal osmosis
2.1.12.01 Gas Generation in EBS - Repository pressurization Include - Mechanical damage to EBS components - He generation from waste from alpha decay - H2 generation from waste package corrosion - CO2, CH4, and H2S generation from microbial degradation
2.1.12.02 Effects of Gas on Flow through - Two-phase flow Include the EBS - Gas bubbles
2.1.12.03 Gas Transport in EBS - Gas phase transport Include - Gas phase release from EBS
2.1.12.04 Gas Explosions in EBS (unspecified) Exclude
2.1.13.01 Radiolysis (in Waste Package, in - Gas generation Exclude Backfill, and in Tunnel) - Altered water chemistry
2.1.13.02 Radiation Damage to EBS - Enhanced waste form degradation Exclude Components (in Waste Form, in - Enhanced waste package degradation Waste Package, in Backfill, in - Enhanced backfill degradation Other EBS Components) - Enhanced degradation of other EBS components (liner/rock reinforcement materials, seals, waste support structure)
2.1.13.03 Radiological Mutation of (unspecified) Exclude Microbes
2.1.14.01 Criticality In-Package - Formation of critical configuration Exclude
2.1.14.02 Criticality in EBS or Near-Field - Formation of critical configuration Exclude
2.2.01.01 Evolution of EDZ - Lateral extent, heterogeneities Include - Physical properties - Flow pathways - Chemical characteristics of groundwater in EDZ - Radionuclide speciation and solubility in EDZ - Thermal-mechanical effects - Thermal-chemical alteration
2.2.02.01 Stratigraphy and Properties of - Rock units Include Host Rock - Thickness, lateral extent, heterogeneities, discontinuities, contacts - Physical properties - Flow pathways

B-11
Likely UFD FEP Screening Number Description Associated Processes Decision Comment
2.2.03.01 Stratigraphy and Properties of - Rock units Include Other Geologic Units (Non- - Thickness, lateral extent, heterogeneities, Host-Rock) (Confining Units and discontinuities, contacts Aquifers) - Physical properties - Flow pathways
2.2.05.01 Fractures (Host Rock, and Other - Rock properties Include Geologic Units)
2.2.05.02 Faults (Host Rock, and Other - Rock properties Include Geologic Units)
2.2.05.03 Alteration and Evolution of NBS - Changes in rock properties Exclude Flow Pathways (Host Rock and - Changes in faults Other Geologic Units) - Changes in fractures - Plugging of flow pathways - Changes in saturation
2.2.07.01 Mechanical Effects on Host Rock - From subsidence Exclude - From salt creep - From clay deformation - From granite deformation (rockfall / drift collapse into tunnels) - Chemical precipitation / dissolution
2.2.07.02 Mechanical Effects on Other - From subsidence Exclude Geologic Units - Chemical precipitation / dissolution
2.2.08.01 Flow through the Host Rock - Saturated flow Include - Fracture flow / matrix imbibition - Unsaturated flow (fingering, capillarity, episodicity, perched water) - Preferential flow pathways - Density effects on flow - Flow pathways out of host rock
2.2.08.02 Flow through the Other Geologic - Saturated flow Include Units (Confining Units and - Fracture flow / matrix imbibition Aquifers) - Unsaturated flow (fingering, capillarity, episodicity, perched water) - Preferential flow pathways - Flow pathways out of other geologic units
2.2.08.03 Effects of Recharge on NBS Flow - Infiltration rate Include (Host Rock and Other Geologic - Water table rise/decline Units)
2.2.08.04 Effects of Repository Excavation - Saturated flow (flow sink) Include on Flow through the Host Rock - Unsaturated flow (capillary diversion, drift shadow) - Influx/Seepage into EBS (film flow, enhanced seepage)
2.2.08.05 Condensation Forms in Host - Condensation cap Exclude Rock - Shedding
2.2.08.06 Flow through EDZ - Saturated / unsaturated flow Include - Fracture / matrix flow

B-12
Likely UFD FEP Screening Number Description Associated Processes Decision Comment
2.2.08.07 Mineralogic Dehydration - Dehydration reactions release water and may lead to Exclude volume changes
2.2.08.08 Groundwater Discharge to - Surface discharge (water table, capillary rise, surface Include Biosphere Boundary water) - Flow across regulatory boundary
2.2.08.09 Groundwater Discharge to Well - Human use (drinking water, bathing water, industrial) Include - Agricultural use (irrigation, animal watering)
2.2.09.01 Chemical Characteristics of - Water composition (radionuclides, dissolved species, Include Groundwater in Host Rock …) - Water chemistry (temperature, pH, Eh, ionic strength …) - Reduction-oxidation potential - Reaction kinetics - Interaction with EBS - Interaction with host rock
2.2.09.02 Chemical Characteristics of - Water composition (radionuclides, dissolved species, Include Groundwater in Other Geologic …) Units (Non-Host-Rock) - Water chemistry (temperature, pH, Eh, ionic strength (Confining Units and Aquifers) …) - Reduction-oxidation potential - Reaction kinetics - Interaction with other geologic units
2.2.09.03 Chemical Interactions and - Host rock composition and evolution (granite, clay, Include Evolution of Groundwater in salt ...) Host Rock - Evolution of water chemistry in host rock - Chemical effects on density - Interaction with EBS - Reaction kinetics - Mineral dissolution/precipitation - Redissolution of precipitates after dry-out
2.2.09.04 Chemical Interactions and - Host rock composition and evolution (granite, clay, Include Evolution of Groundwater in salt ...) Other Geologic Units (Non- - Evolution of water chemistry in host rock Host-Rock) (Confining Units and - Chemical effects on density Aquifers) - Reaction kinetics - Mineral dissolution/precipitation - Recharge chemistry
2.2.09.05 Radionuclide Speciation and - Dissolved concentration limits Include Solubility in Host Rock
2.2.09.06 Radionuclide Speciation and - Dissolved concentration limits Include Solubility in Other Geologic Units (Non-Host-Rock) (Confining Units and Aquifers)
2.2.09.51 Advection of Dissolved - Flow pathways and velocity Include Radionuclides in Host Rock - Advective properties (porosity, tortuosity) - Dispersion - Matrix diffusion - Saturation

B-13
Likely UFD FEP Screening Number Description Associated Processes Decision Comment
2.2.09.52 Advection of Dissolved - Flow pathways and velocity Include Radionuclides in Other Geologic - Advective properties (porosity, tortuosity) Units (Non-Host-Rock) - Dispersion (Confining Units and Aquifers) - Matrix diffusion - Saturation
2.2.09.53 Diffusion of Dissolved - Gradients (concentration, chemical potential) Include Radionuclides in Host Rock - Diffusive properties (diffusion coefficients) - Flow pathways and velocity - Saturation
2.2.09.54 Diffusion of Dissolved - Gradients (concentration, chemical potential) Include Radionuclides in Other Geologic - Diffusive properties (diffusion coefficients) Units (Non-Host-Rock) - Flow pathways and velocity (Confining Units and Aquifers) - Saturation
2.2.09.55 Sorption of Dissolved - Surface complexation properties Include Radionuclides in Host Rock - Flow pathways and velocity - Saturation
2.2.09.56 Sorption of Dissolved - Surface complexation properties Include Radionuclides in Other Geologic - Flow pathways and velocity Units (Non-Host-Rock) - Saturation (Confining Units and Aquifers)
2.2.09.57 Complexation in Host Rock - Presence of organic complexants (humates, fulvates, Include carbonates, …) - Enhanced transport of radionuclides associated with organic complexants
2.2.09.58 Complexation in Other Geologic - Presence of organic complexants (humates, fulvates, Include Units (Non-Host-Rock) carbonates, …) (Confining Units and Aquifers) - Enhanced transport of radionuclides associated with organic complexants
2.2.09.59 Colloidal Transport in Host Rock - Flow pathways and velocity Include Although salinity - Saturation will likely limit - Advection colloid stability, - Dispersion deep penetration - Diffusion of glacial melt - Sorption waters could - Colloid concentration stabilize colloids.
2.2.09.60 Colloidal Transport in Other - Flow pathways and velocity Include Geologic Units (Non-Host-Rock) - Saturation (Confining Units and Aquifers) - Advection - Dispersion - Diffusion - Sorption - Colloid concentration

B-14
Likely UFD FEP Screening Number Description Associated Processes Decision Comment
2.2.09.61 Radionuclide Transport through - Advection Include EDZ - Dispersion - Diffusion - Sorption
2.2.09.62 Dilution of Radionuclides in - Mixing with uncontaminated groundwater Include Groundwater (Host Rock and - Mixing at withdrawal well Other Geologic Units)
2.2.09.63 Dilution of Radionuclides with - Mixing with stable and/or naturally occurring isotopes Include Could be Stable Isotopes (Host Rock and of the same element important for Other Geologic Units) radioisotopes such as I-129
2.2.09.64 Radionuclide Release from Host - Spatial and temporal distribution of releases to the Include Rock (Dissolved, Colloidal, and other geologic units (due to varying flow pathways and Gas Phase) velocities, varying transport properties)
2.2.09.65 Radionuclide Release from Other - Spatial and temporal distribution of releases to the Include Geologic Units (Dissolved, biosphere (due to varying flow pathways and velocities, Colloidal, Gas Phase) varying transport properties)
2.2.10.01 Microbial Activity in Host Rock - Formation of complexants Exclude - Formation and stability of microbial colloids - Biodegradation - Bioaccumulation
2.2.10.02 Microbial Activity in Other - Formation of complexants Exclude Geologic Units (Non-Host-Rock) - Formation and stability of microbial colloids (Confining Units and Aquifers) - Biodegradation - Bioaccumulation
2.2.11.01 Thermal Effects on Flow in NBS - Altered saturation / relative humidity (dry-out, Include (Repository-Induced and Natural resaturation) Geothermal) - Altered gradients, density, and/or flow pathways - Vapor flow - Condensation
2.2.11.02 Thermally-Driven Flow - Convection Include (Convection) in NBS
2.2.11.03 Thermally-Driven Buoyant Flow / - Vapor flow Include Heat Pipes in NBS
2.2.11.04 Thermal Effects on Chemistry - Mineral precipitation / dissolution Include and Microbial Activity in NBS - Altered solubility
2.2.11.05 Thermal Effects on Transport in - Thermal diffusion (Soret effect) Exclude NBS - Thermal osmosis
2.2.11.06 Thermal-Mechanical Effects on - Thermal expansion / compression Exclude NBS - Altered properties of fractures, faults, rock matrix
2.2.11.07 Thermal-Chemical Alteration of - Mineral precipitation / dissolution Include NBS - Altered properties of fractures, faults, rock matrix - Alteration of minerals / volume changes - Formation of near-field chemically altered zone (rind)

B-15
Likely UFD FEP Screening Number Description Associated Processes Decision Comment
2.2.12.01 Gas Generation in NBS - Degassing (clathrates, deep gases) Exclude - Microbial degradation of organics
2.2.12.02 Effects of Gas on Flow through - Altered gradients and/or flow pathways Include the NBS - Vapor/air flow - Two-phase flow - Gas bubbles
2.2.12.03 Gas Transport in NBS - Gas phase transport Include - Gas phase release from geosphere
2.2.14.01 Criticality in Far-Field - Formation of critical configuration Exclude
2.3.01.01 Topography and Surface - Recharge and discharge areas Include Morphology
2.3.02.01 Surficial Soil Type - Physical and chemical attributes Include
2.3.04.01 Surface Water - Lakes, rivers, springs Exclude - Dams, reservoirs, canals, pipelines - Coastal and marine features - Water management activities
2.3.05.01 Biosphere Characteristics - Climate Include - Soils - Flora and fauna - Microbes - Evolution of biosphere (natural, anthropogenic – e.g., acid rain)
2.3.07.01 Erosion - Weathering Exclude - Denudation - Subsidence
2.3.07.02 Deposition - Weathering Exclude
2.3.07.03 Animal Intrusion into Repository (unspecified) Exclude
2.3.08.01 Precipitation - Spatial and temporal distribution Include
2.3.08.02 Surface Runoff and - Runoff, impoundments, flooding, increased recharge Include Evapotranspiration - Evaporation - Transpiration (root uptake)
2.3.08.03 Infiltration and Recharge - Spatial and temporal distribution Include - Effect on hydraulic gradient - Effect on water table elevation
2.3.09.01 Chemical Characteristics of Soil - Altered recharge chemistry (natural) Exclude and Surface Water - Altered recharge chemistry (anthropogenic – e.g., acid rain)
2.3.09.02 Radionuclide Speciation and - Dissolved concentration limits Exclude Solubility in Biosphere
2.3.09.03 Radionuclide Alteration in - Altered physical and chemical properties Exclude Biosphere - Isotopic dilution

B-16
Likely UFD FEP Screening Number Description Associated Processes Decision Comment
2.3.09.51 Atmospheric Transport through - Radionuclide transport in air, gas, vapor, particulates, Include Biosphere aerosols - Processes include: wind, plowing, irrigation, degassing, saltation, precipitation
2.3.09.52 Surface Water Transport through - Radionuclide transport and mixing in surface water Exclude Biosphere - Processes include: lake mixing, river flow, spring discharge, aeration, sedimentation, dilution
2.3.09.53 Soil and Sediment Transport - Radionuclide transport in on soil and sediments Include through Biosphere - Processes include: fluvial (runoff, river flow), eolian (wind), glaciation, bioturbation (animals)
2.3.09.54 Radionuclide Accumulation in - Leaching/evaporation from discharge (well, Include Soils groundwater upwelling) - Deposition from atmosphere or water (irrigation, runoff)
2.3.09.55 Recycling of Accumulated (unspecified) Include Radionuclides from Soils to Groundwater
2.3.10.01 Microbial Activity in Biosphere - Effect on biosphere characteristics Exclude - Effect on transport through biosphere
2.3.11.01 Effects of Repository Heat on (unspecified) Exclude Biosphere
2.4.01.01 Human Characteristics - Physiology Include - Metabolism - Adults, children
2.4.01.02 Human Evolution - Changing human characteristics Exclude - Sensitization to radiation - Changing lifestyle
2.4.04.01 Human Lifestyle - Diet and fluid intake (food, water, tobacco/drugs, etc.) Include - Dwellings - Household activities - Leisure activities
2.4.08.01 Land and Water Use - Agricultural (irrigation, plowing, fertilization, crop Include storage, greenhouses, hydroponics) - Farms and Fisheries (feed, water, soil) - Urban / industrial (development, energy production, earthworks, population density) - Natural / wild (grasslands, forests, bush, surface water)
2.4.08.02 Evolution of Land and Water Use - New practices (agricultural, farming, fisheries) Exclude - Technological developments - Social developments (new/expanded communities)

B-17
Likely UFD FEP Screening Number Description Associated Processes Decision Comment
3.3.01.01 Radionuclides in Biosphere - Soil Include Media - Surface water - Air - Plant uptake - Animal (livestock, fish) uptake
3.3.01.02 Radionuclides in Food Products - Diet and fluid sources (location, degree of Include contamination, dilution with uncontaminated sources) - Foodstuff and fluid processing and preparation (water filtration, cooking techniques)
3.3.01.03 Radionuclides in Non-Food - Dwellings (location, building materials and sources, Exclude Products fuel sources) - Household products (clothing and sources, furniture and sources, tobacco, pets) - Biosphere media
3.3.04.01 Ingestion - Food products Include - Soil, surface water
3.3.04.02 Inhalation - Gases and vapors Include - Suspended particulates (dust, smoke, pollen)
3.3.04.03 External Exposure - Non-food products Include - Soil, surface water
3.3.06.01 Radiation Doses - Exposure rates (ingestion, inhalation, external Include exposure) - Dose conversion factors - Gases and vapors - Suspended particulates (dust, smoke, pollen)
3.3.06.02 Radiological Toxicity and Effects - Human health effects from radiation doses Include
3.3.06.03 Non-Radiological Toxicity and - Human health effects from non-radiological toxicity Exclude Effects
B.2 References
Freeze, G. A., P. E. Mariner, J. E. Houseworth, and J. C. Cunnane 2010. Used Fuel Disposition
Campaign Features, Events, and Processes (FEPs): FY10 Progress Report. SAND2010-5902.
Sandia National Laboratories, Albuquerque, New Mexico.

110
DISTRIBUTION
Federal Agencies:
2 Office of Fuel Cycle Research and
Development
Attn: Monica Regalbuto
Jeffrey R. Williams
NE-52/Forrestal Building
1000 Independence Ave. SW
Washington, DC 20585
2 Office of Systems Engineering and
Integration
Attn: Robert R. Price
NE-51/GTN Building
19901 Germantown Road
Germantown, MD 20874
4 U.S. Department of Energy
Attn: William Boyle
DOE-NE
232 Energy Way
North Las Vegas, NV 89030
Laboratories/Corporations/ Universities:
2 Argonne National Laboratory
Attn: Mark Nutt
9700 S. Cass Avenue
Argonne, IL 60439
1 Lawrence Berkeley National Laboratory
Attn: Prof. Chin-Fu Tsang
Earth Sciences Division
One Cyclotron Road
Berkeley, CA 94720
2 Los Alamos National Laboratory
Attn: Frank V. Perry
Shaoping Chu
EES-16, MS T003
Environmental Sciences Division
Los Alamos, NM 87545
1 Oak Ridge National Laboratory
Attn: Robert Howard
P.O. Box 2008 MS6170
Oak Ridge, TN 37831-6170
1 Thomas A. Cotton
Complex Systems Group
4429 Butterworth Place NW
Washington, DC 20016
1 Jason S. Dean
Fidelis Policy Group, LLC
121 Hallmark Pl
Madison, MS 39110
1 Leif G. Eriksson
535 N. Interlachen Avenue Unit 303
Winter Park, FL 32789-3252
1 Eric Knox
URS Corp.
Operations Manager
Global Management and Operations
Services
2345 Crystal Drive, Suite 708
Arlington, VA 22202
1 Chandrika Manepally
Center for Nuclear Waste Regulatory
Analyses
Geosciences and Engineering Division
Southwest Research Institute
6220 Culebra Road
San Antonio, TX 78238
1 Paul Meacham
Raytheon Ktech
1300 Eubank Blvd. SE
Albuquerque, NM 87123
1 Prof. Joonhong Ahn
University of California
Department of Nuclear Engineering
4157 Etcheverry Hall
Berkeley, CA 94720-1730
1 Dr. Yongsoo Hwang
Visiting Fellow
Center for Strategic and International
Studies
Proliferation Prevention Program
1800 K Street NW
Washington, DC 20006

111
Foreign Distribution:
1 DBE Technology GmbH
Attn: Dr. Enrique Biurrun
Eschenstrasse 55
DE – 31224 Peine
Germany
1 Forschungszentrum Karlsruhe (FZK)
GmbH
(PTKA-WTE)
Attn: Dr. Walter Steininger
Postfach 3640
DE – 76344 Eggenstein-Leopoldshafen
Germany
1 Nuclear Waste Management Organization
Attn: F. Garisto
22 St. Clair Ave. East, 6th Floor
Toronto, Canada M4T 2S3
4 Seoul National University Library
Gwannakro 599
Gwanak-gu
Seoul, 151-749, Republic of Korea
4 HanYang University Library
222 Wangsimni-ro
Seoungdong-gu
Seoul, 133-791, Republic of Korea
4 KAIST Library
291 Daehak-ro Yuseong-gu
Daejeon, 305-701, Republic of Korea
4 Kyung Hee University Central Library
130-701, 1, Hoegi-dong
Dongdaemun-gu,
Seoul, Republic of Korea
4 Chosun University Library
375 SeoSeok-dong,
Dong-gu
GwangJu, 501-759, Republic of Korea
4 Jeju National University Central Library
66 Jejudaehak-ro
Jeju-si, Jeju-do, 690-756, Republic of
Korea
4 Dongguk University Library
26, Pil-dong 3-ga
Jung-gu, Seoul, Republic of Korea, 100-
715
4 MyongJi University Library
San 38-2, Namdong
Cheoin-gu, Yongin,
Gyeonggido, 449-728, Republic of Korea
4 Korea Atomic Energy Research Institute
DaeDeok-Daero 989-111
Yuseong-gu, Daejeon, Republic of Korea
4 Korea Institute of Nuclear Safety
34 Gwahak-ro
Yoseong-gu
Daejeon, 305-338, Republic of Korea
4 Korea Hydro & Nuclear Power Co. Ltd.
411 Yeong dongdae-ro,
Gangnam-gu
Seoul, 135-791, Republic of Korea
4 Korea Radioactive Waste Management
Corporation
89 Buksung-ro
Gyeongju
Gyeongsangbuk-do, 780-050, Republic of
Korea
4 Korea Radioactive Waste Management
Corporation
150-1 Duckjin-dong
Yuseong-gu,
Daejeon, Republic of Korea
4 The National Assembly Library of the
Republic of Korea
1 Uisadangro
Yeongdeungpo-gu
Seoul, 150-703, Republic of Korea
4 The National Library of Korea
139 Seonsa-ro
Government Complex Daejeon
Seo-gu, Daejeon, Republic of Korea

112
4 National Archives of Korea
139 Seonsa-ro
Government Complex Daejeon
Seo-gu, Daejeon, Republic of Korea
4 Korea Scientific & Technological
Information Center
245 Daehangno
Yuseong-gu,
Daejeon, 305-806, Republic of Korea
4 Korea Institute of Energy Research
152 Gajeong-ro
Yuseoung-gu
Daejeon, 305-343, Republic of Korea
1 Korea Radioactive Waste Management
Corporation
Attn: Dr. Jin Beak Park
Radwaste Technology Development
Center
150-1 Duckjin-dong, Yusong-gu
Daejeon, 305-353, Republic of Korea
2 Korea Atomic Energy Research Institute
Attn: Dr. Seong Won Park
Dr. Jong Won Choi
1045 Daedeok-daero, Yuseong-gu
Daejeon, 305-353, Republic of Korea
Internal Distribution: 1 MS0372 J. G. Arguello 1525
1 MS0372 J. M. Redmond 1525
1 MS0701 M. C. Walck 6900
1 MS0706 A. C. Snider Lord 6912
1 MS0724 J. M. Hruby 6000
1 MS0734 P. N. Swift 6224
1 MS0735 J. A. Merson 6910
1 MS0736 D. Sassani 6225
1 MS0736 E. L. Hardin 6224
1 MS0736 E. J. Bonano 6220
1 MS0747 K. B. Sorenson 6223
2 MS0751 F. D. Hansen 6914
1 MS0751 T. W. Pfeifle 6914
1 MS0754 P. V. Brady 6910
1 MS0771 J. B. Tillman 6200
10 MS0771 S. A. Orrell 6200
1 MS0779 C. F. Jove-Colon 6222
1 MS0779 K. A. McMahon 6222
1 MS0779 Y. Wang 6222
1 MS1370 B. Goldstein 6224
1 MS1370 B. W. Arnold 6225
1 MS1370 C. R. Bryan 6225
1 MS1370 G. A. Freeze 6224
5 MS1370 J. Lee 6224
1 MS1370 P. Vaughn 6225
5 MS1370 P. E. Mariner 6224
1 MS1370 R. J. MacKinnon 6224
1 MS1370 R. P. Rechard 6224
1 MS1370 T. Hadgu 6225
1 MS1395 C. D. Leigh 6212
1 MS1395 C. G. Herrick 6211
1 MS1395 M. Y. Lee 6211
1 MS0899 Technical Library 9536
(electronic copy)

113
