grandview elementary
DESCRIPTION
Grandview Elementary. CIAC February 9, 2012. Reading. 2011 Target 87.8% 2012 Target 91.9%. Grandview Elementary Reading % of Students Meeting Standard. Not Reported on AYP. 30 students. 42 students. 35 students. 37 students. 10 students. 12 students. - PowerPoint PPT PresentationTRANSCRIPT

GRANDVIEW ELEMENTARY
CIACFebruary 9, 2012

READING

GRANDVIEW ELEMENTARY READING
% OF STUDENTS MEETING STANDARD
All Low SES SPED ELL African American
Hispanic White Multi Ethnic
0
10
20
30
40
50
60
70
80
90
10090
86.5
75
100
83.390
93.787.5
2007 2008 2009 2010 2011
2011 Target 87.8%2012 Target 91.9%
2007 2008 2009 2010 20110
10
20
30
40
50
60
70
80
90
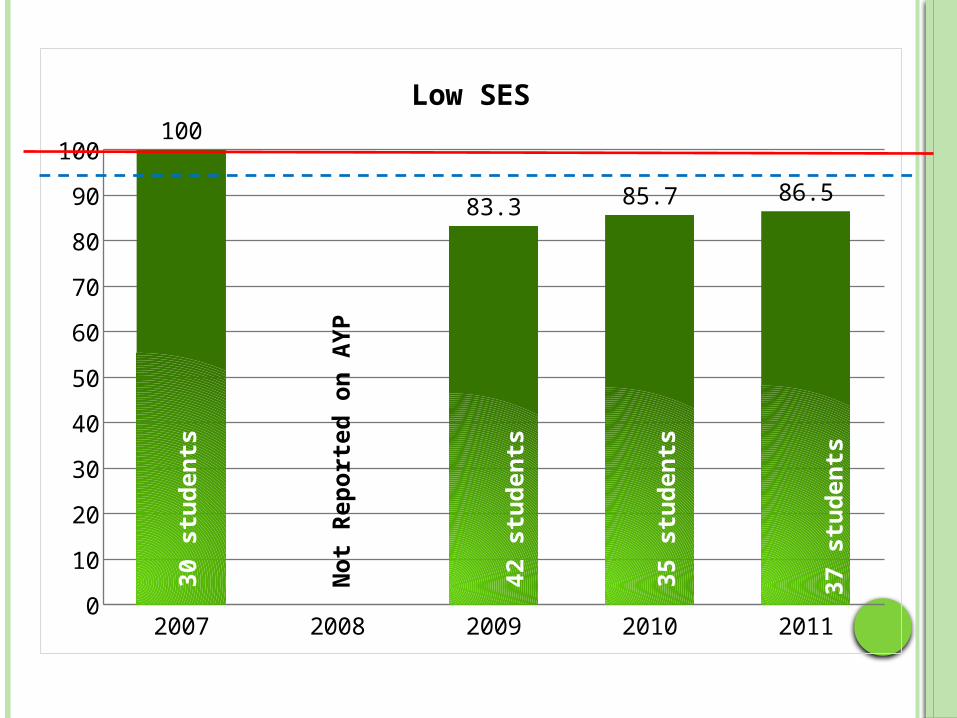
100100
83.3 85.7 86.5
Low SES
Not
Rep
ort
ed
on
AY
P
30 s
tud
en
ts
42 s
tud
en
ts
35 s
tud
en
ts
37 s
tud
en
ts
2007 2008 2009 2010 20110
10
20
30
40
50
60
70
80
90
10090
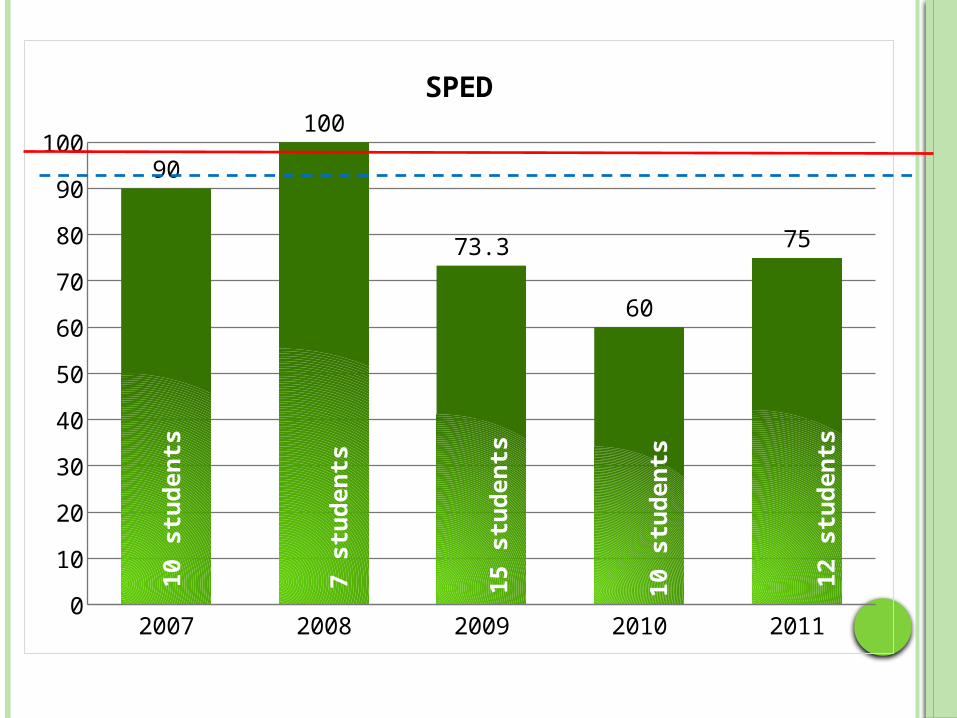
100
73.3
60
75
SPED
7 s
tud
en
ts
10 s
tud
en
ts
15 s
tud
en
ts
10 s
tud
en
ts
12 s
tud
en
ts

2007 2008 2009 2010 20110
10
20
30
40
50
60
70
80
90
100100 100 100 100 100
ELL
5 s
tud
en
ts
5 s
tud
en
ts
9 s
tud
en
ts
4 s
tud
en
ts
2 s
tud
en
ts

2007 2008 2009 2010 20110
10
20
30
40
50
60
70
80
90
100
0
100
70
100
83.3
African American
Column1
7 s
tud
en
ts
10 s
tud
en
ts
6 s
tud
en
ts
6 s
tud
en
ts
1 s
tud
en
t

2007 2008 2009 2010 20110
10
20
30
40
50
60
70
80
90
100100 100 100
84.690
Hispanic
Series 1
3 s
tud
en
ts
4 s
tud
en
ts
13 s
tud
en
ts
20 s
tud
en
ts
1 s
tud
en
t

2007 2008 2009 2010 20110
10
20
30
40
50
60
70
80
90
100 96.1100
94.788.2
93.7
White
14 s
tud
en
ts
16 s
tud
en
ts
19 s
tud
en
ts
17 s
tud
en
ts
26 s
tud
en
ts

2007 2008 2009 2010 20110
10
20
30
40
50
60
70
80
90
100100
93.3
76.2
83.387.5
Multi-Ethnic
15 s
tud
en
ts
8 s
tud
en
ts
21 s
tud
en
ts
6 s
tud
en
ts
16
stu
den
ts

LONGITUDINAL DATA
2009 3rd Graders 2010 4th Graders 2011 5th Graders0
1
2
3
4
5
6
7
6 6 6
4
5
4
2
1
2
Total # of Students # of Students Meeting Standard# of Students Below Standard

2009 3rd Graders 2010 4th Graders 2011 5th Graders
Shai'Anne 3 approaching Shai'Anne 4 meets Shai'Anne 5 approaching
Andrew 3 exceeds Andrew 4 exceeds Andrew 5 meets
Carmela 3 warning Carmela 4 approaching Carmela 5 approaching
Ashley 3 exemplary Ashley 4 exemplary Ashley 5 exemplary
Charles 3 exceeds Charles 4 exceeds Charles 5 exemplary
DeJohnpaulhezues 3 exceeds DeJohnpaulhezues 4 meets DeJohnpaulhezues 5 meets
Longitudinal DataReading
= increase in performance category
=decrease in performance category
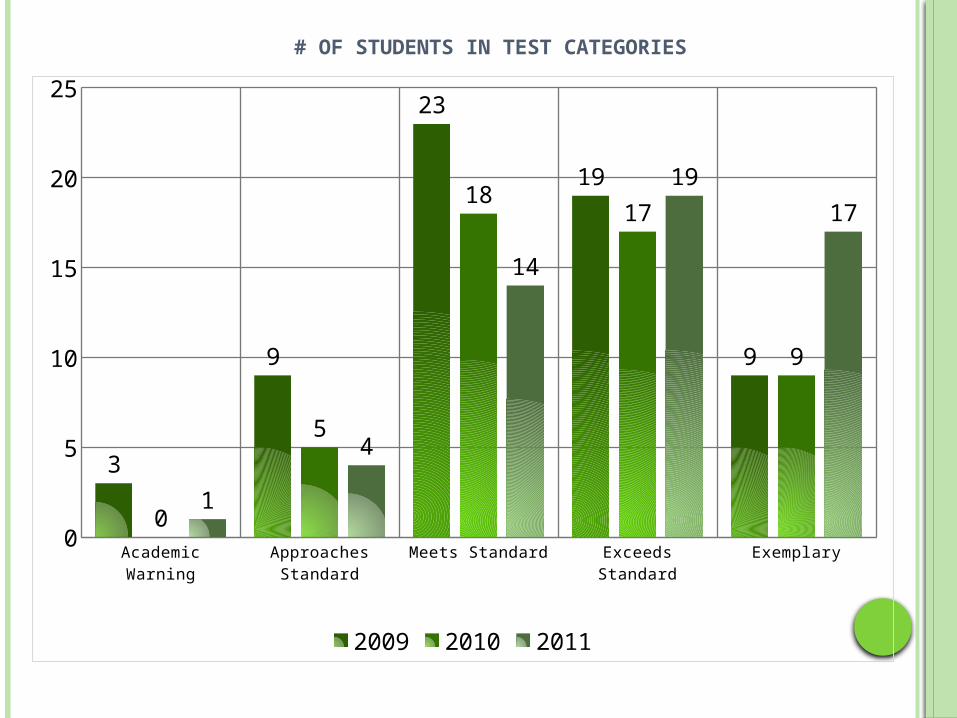
# OF STUDENTS IN TEST CATEGORIES
Academic Warning Approaches Standard
Meets Standard Exceeds Standard Exemplary0
5
10
15
20
25
3
9
23
19
9
0
5
1817
9
1
4
14
19
17
2009 2010 2011
MULTIPLE MEASURES DATA
Spreadsheet for reading mastery

SAMPLE CLASS DEMOGRAPHICS
4
12
Gender
MaleFemale
8
3
5
EthnicityWhite
His-panic
Multi-racial
Enrolled0
2
4
6
8
6
2
7
1
K123
SES0
2
4
6
8
10
9
4 3
FreeRe-ducedFull

DISAGGREGATED DATA BY INDICATOR
Student NameRhym
e
Reco
gnit
ion
Rhym
e
Prod
ucti
on
Sylla
ble
s
Ini
tial
Sou
nd
End
ing
Sou
nd
Sou
nd
Ble
ndin
g
Lett
er
Sou
nds
# o
f so
unds
indent
ified
Wri
tes
Sou
nds
# o
f so
unds
wri
tten
Sto
ry
Com
p.
Tot
al
Perc
ent
age
Grade Card Score 4 4 4 4 4 4 4 4 4 36
Manuel Olea 1 1 3 2 3 1 2 20 4 26 1 18 50%
Angelina Rivera 3 1 3 4 4 4 3 25 2 24 3 27 75%
Daniel Lagos 3 2 3 4 3 3 3 25 3 25 3 27 75%
Mechele Stringer 3 4 4 4 1 1 3 25 3 25 4 27 75%
Pablo Gaytan 2 1 4 4 3 4 4 26 4 26 2 28 78%
Giovani Ortega 3 4 4 4 3 2 2 23 2 24 4 28 78%
Leon Leadabrand 4 3 4 4 2 4 1 18 2 20 4 28 78%
Kaeden Kleikamp 2 3 4 4 4 4 3 25 3 25 2 29 81%
Zachary Peirano 4 4 4 4 4 4 4 26 2 24 1 31 86%
J 'Mere Hatcher 4 4 4 4 3 3 4 26 2 23 3 31 86%
Michael Luna 4 4 3 4 4 4 4 26 4 31 86%
Haylee Sites 4 4 4 4 4 4 1 19 2 23 4 31 86%
Honesty Perkins 4 4 4 4 4 4 4 26 3 25 1 32 89%
Tyler Sturgeon 4 4 4 4 4 3 3 25 4 26 3 33 92%
Ryan Noles 4 4 4 4 4 4 4 26 4 26 2 34 94%
Anthony Smith 4 4 4 4 4 4 4 26 3 25 3 34 94%
Brooklin Burris 4 4 4 4 4 4 4 26 2 24 4 34 94%
Xavier Carpenter 4 4 4 4 4 4 4 26 2 24 4 34 94%
Braylon Garnett 4 4 4 4 4 3 4 26 4 26 3 34 94%
J adelynn Gavin 4 4 4 4 4 4 4 26 4 26 2 34 94%
J asmine J ackson 4 4 4 4 4 4 4 26 4 26 2 34 94%
Charlotte Musil 4 4 4 4 4 3 4 26 4 26 4 35 97%
Hannah Strauss 4 4 4 4 4 4 4 26 3 24 4 35 97%
I an Quigley 4 4 4 4 4 4 4 26 4 26 4 36 100%
Parker Collins 4 4 4 4 4 4 4 26 4 26 4 36 100% 0-57%
Harley Herbert 4 4 4 4 4 4 4 26 4 26 4 36 100% 58-69%
Kyleigh Hoff man 4 4 4 4 4 4 4 26 4 26 4 36 100% 70-84%
Marie Whittaker 4 4 4 4 4 4 4 26 4 26 4 36 100% 85-92%
Average 3.6 3.5 3.9 3.9 3.4 24.9 3.2 25.0 32 88% 93-100%Exemplary
Quarter 2 Reading Checklist 2011- 2012
Academic Warning
Approaches Standard
Meets Standard
Exceeds Standard

FORMATIVE DATA
Baseline 1 2 Change 3 change 4 Change Baseline 1 2 Change 3 Change 4 Change Baseline 1 2 3 4
Ariyana 79 86 82 -4 76 73 93 20 0.775 79.7 88%
J avon 79 100 91 -9 47 93 40 -53 0.63 97 66%
Marques 58 57 36 -21 41 60 53 -7 0.495 58.5 45%
Abigail 65 86 82 -4 47 87 87 0 0.56 86.3 85%
Abigayle 58 93 91 -2 76 100 87 -13 0.67 97 89%
Allana 63 86 91 5 71 87 80 -7 0.67 86 86%
J anessa 63 71 -71 65 73 -73 0.64 72 0%
Elizabeth 79 86 91 5 65 87 60 -27 0.72 86 76%
Auriana 90 100 91 -9 77 100 87 -13 0.835 100 89%
J acqueline 21 71 73 2 47 60 93 33 0.34 66 83%
Lily 63 79 100 21 53 80 73 -7 0.58 80 87%
Donelle 58 86 64 -22 82 93 53 -40 0.7 88 59%
Logan 84 93 91 -2 76 87 87 0 0.8 90 89%
Robby 53 64 64 0 53 73 53 -20 0.53 69 59%
Connie 79 71 91 20 71 87 87 0 0.75 79 89%
Unique 89 86 91 5 82 73 93 20 0.855 80 92%
Taeghan 84 86 82 -4 94 80 87 7 0.89 83 85%
Amanda 45 45 60 47 -13 66 46%68.529 82.4 81.94 -3 #### ###### #### #DIV/0! 66.0588 80.7 75.8 -16 #### ###### #### ###### 0.6729 77.1 79% #### #DIV/0!
Expository Narrative Overall Score

STANDARD FORMATIVE DATA
Baseline First Quarter Second Quarter Third Quarter Fourth QuarterR.3.1.3.2 Context clues 80 86 903.1.3.5 Word Structure 60 81 793.1.4.2 Text Features 79 67 823.1.4.5 Infer/DC 67 78 593.1.4.8 Compare/Contrast 65 70 763.1.4.9 Cause and Effect 63 83 803.1.4.10 Retell 60 39 383.1.4.11 Main Idea 72 94 793.2.1.1 Character 94 89 853.2.1.2 Plot 46 97 91

MATHEMATICS

GRANDVIEW ELEMENTARY MATH% OF STUDENTS MEETING STANDARD
ENROLLED BY 9/20
0102030405060708090
100 94 91.983.3
100 100 10093.8
75
2007 2008 2009 2010 2011
2010 Target 86.7%2011 Target 91.9%

2007 2008 2009 2010 20110
10
20
30
40
50
60
70
80
90
100
Low SES
Series 1
30 s
tud
en
ts
39 s
tud
en
ts
Not
Rep
ort
ed
on
AY
P
35 s
tud
en
ts
37 s
tud
en
ts

2007 2008 2009 2010 20110
10
20
30
40
50
60
70
80
90
100
80
100
78.6
9083.3
SPED
Series 1
10 s
tud
en
ts
7 s
tud
en
ts
15 s
tud
en
ts
10 s
tud
en
ts
12 s
tud
en
ts

2007 2008 2009 2010 20110
10
20
30
40
50
60
70
80
90
100100 100 100 100 100
ELL
2 s
tud
en
ts
5 s
tud
en
ts
5 s
tud
en
ts
9 s
tud
en
ts
4 s
tud
en
ts

2007 2008 2009 2010 20110
10
20
30
40
50
60
70
80
90
100100 100
90
100 100African American
1 s
tud
en
t
7 s
tud
en
ts
10 s
tud
en
ts
6 s
tud
en
ts
6 s
tud
en
ts

2007 2008 2009 2010 20110
10
20
30
40
50
60
70
80
90
100100 100 100
84.6
100Hispanic
1 s
tud
en
t
3 s
tud
en
ts
4 s
tud
en
ts
13 s
tud
en
ts
20 s
tud
en
ts

2007 2008 2009 2010 20110
10
20
30
40
50
60
70
80
90
100
88.592.9
82.4
10093.8
White
26 s
tud
en
ts
14 s
tud
en
ts
17 s
tud
en
ts
17 s
tud
en
ts
16 s
tud
en
ts

2007 2008 2009 2010 20110
10
20
30
40
50
60
70
80
90
100100 100
89.5
100
75
Multi-Ethnic
16 s
tud
en
ts
15 s
tud
en
ts
19 s
tud
en
ts
6 s
tud
en
ts
8 s
tud
en
ts

2009 3rd Graders 2010 4th Graders 2011 5th Graders
Shai'Anne 3 meets Shai'Anne 4 approaching Shai'Anne 5 meets
Andrew 3 exceeds Andrew 4 meets Andrew 5 exceeds
Carmela 3 approaching Carmela 4 approaching Carmela 5 exceeds
Ashley 3 exemplary Ashley 4 exemplary Ashley 5 exemplary
Charles 3 meets Charles 4 exceeds Charles 5 meets
DeJohnpaulhezues 3 exceeds DeJohnpaulhezues 4 exceeds DeJohnpaulhezues 5 exceeds
= increase in performance category
=decrease in performance category
PERFORMANCE OVER TIME

2009 3rd Graders 2010 4th Graders 2011 5th Graders0
1
2
3
4
5
6
7
6 6 6
5
4
6
1
2
0
Longitudinal Data
Total # of Students # of Student Meeting Standard# of Students Below Standard

Academic Warning
Approaches Standard
Meets Standard
Exceeds Standard
Exemplary0
5
10
15
20
25
3
5
23
17
11
0
3
10
19
17
0
3
14
17
21
# of Students in Test Categories
2009 2010 2011
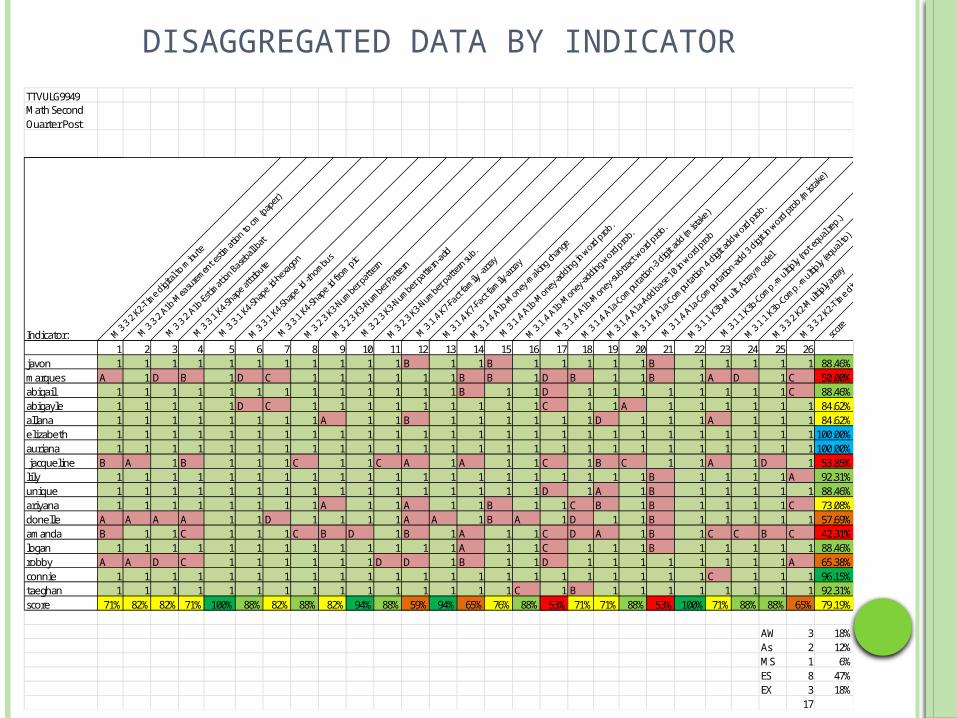
DISAGGREGATED DATA BY INDICATORTTVULG9949Math Second Quarter Post
Indicator: M.3.3.2.K2-Tim
e digital
to m
inute
M.3.3.2.A1b
-Mea
suremen
t esti
mation to
cm (p
aper)
M.3.3.2.A1b
-Estimati
on Baseb
all bat
M.3.3.1.K4-S
hape att
ribute
M.3.3.1.K4-S
hape id
-hexago
n
M.3.3.1.K4-Shap
e id -r
hombus
M.3.3.1.K4-S
hape id
from pic
M.3.2.3.K3-Number
pattern
M.3.2.3.K3-Number
Pattern
M.3.2.3.K3-N
umber pa
ttern-add
M.3.2.3.K3-Number
pattern
sub.
M.3.1.4.K7-F
act family
-arra
y
M.3.1.4.K7-Fact
family-ar
ray
M.3.1.4.A1b-M
oney-m
aking ch
ange
M.3.1.4.A1b
-Money
-adding i
n word prob.
M.3.1.4.A1b-M
oney-ad
ding word
prob.
M.3.1.4.A1b
-Money
-subtra
ct word prob
.
M.3.1.4.A1a-Compu
tation-3
digit a
dd (mist
ake)
M.3.1.4.A1a-A
dd base 10 i
n word
prob
M.3.1.4.A1a-Compu
tation 4
digit a
dd word prob.
M.3.1.4.A1a
-Computati
on-add 3
digit in
word
prob.(m
istak
e)
M.3.1.1.K3b-M
ult. Arra
y model
M.3.1.1.K3b
-Comp.-multiply
(not e
qual rep.)
M.3.1.1.K3b-Comp.-m
ultiply (eq
ual to)
M.3.3.2.K2-Multi
ply arra
y
M.3.3.2.K2-Tim
e digital
-word
s
score
1 2 3 4 5 6 7 8 9 10 11 12 13 14 15 16 17 18 19 20 21 22 23 24 25 26javon 1 1 1 1 1 1 1 1 1 1 1 B 1 1 B 1 1 1 1 1 B 1 1 1 1 1 88.46%marques A 1 D B 1 D C 1 1 1 1 1 1 B B 1 D B 1 1 B 1 A D 1 C 50.00%abigail 1 1 1 1 1 1 1 1 1 1 1 1 1 B 1 1 D 1 1 1 1 1 1 1 1 C 88.46%abigayle 1 1 1 1 1 D C 1 1 1 1 1 1 1 1 1 C 1 1 A 1 1 1 1 1 1 84.62%allana 1 1 1 1 1 1 1 1 A 1 1 B 1 1 1 1 1 1 D 1 1 1 A 1 1 1 84.62%elizabeth 1 1 1 1 1 1 1 1 1 1 1 1 1 1 1 1 1 1 1 1 1 1 1 1 1 1 100.00%auriana 1 1 1 1 1 1 1 1 1 1 1 1 1 1 1 1 1 1 1 1 1 1 1 1 1 1 100.00% jacqueline B A 1 B 1 1 1 C 1 1 C A 1 A 1 1 C 1 B C 1 1 A 1 D 1 53.85%lily 1 1 1 1 1 1 1 1 1 1 1 1 1 1 1 1 1 1 1 1 B 1 1 1 1 A 92.31%unique 1 1 1 1 1 1 1 1 1 1 1 1 1 1 1 1 D 1 A 1 B 1 1 1 1 1 88.46%ariyana 1 1 1 1 1 1 1 1 A 1 1 A 1 1 B 1 1 C B 1 B 1 1 1 1 C 73.08%donelle A A A A 1 1 D 1 1 1 1 A A 1 B A 1 D 1 1 B 1 1 1 1 1 57.69%amanda B 1 1 C 1 1 1 C B D 1 B 1 A 1 1 C D A 1 B 1 C C B C 42.31%logan 1 1 1 1 1 1 1 1 1 1 1 1 1 A 1 1 C 1 1 1 B 1 1 1 1 1 88.46%robby A A D C 1 1 1 1 1 1 D D 1 B 1 1 D 1 1 1 1 1 1 1 1 A 65.38%connie 1 1 1 1 1 1 1 1 1 1 1 1 1 1 1 1 1 1 1 1 1 1 C 1 1 1 96.15%taeghan 1 1 1 1 1 1 1 1 1 1 1 1 1 1 1 C 1 B 1 1 1 1 1 1 1 1 92.31%score 71% 82% 82% 71% 100% 88% 82% 88% 82% 94% 88% 59% 94% 65% 76% 88% 53% 71% 71% 88% 53% 100% 71% 88% 88% 65% 79.19%
AW 3 18%As 2 12%MS 1 6%ES 8 47%EX 3 18%
17
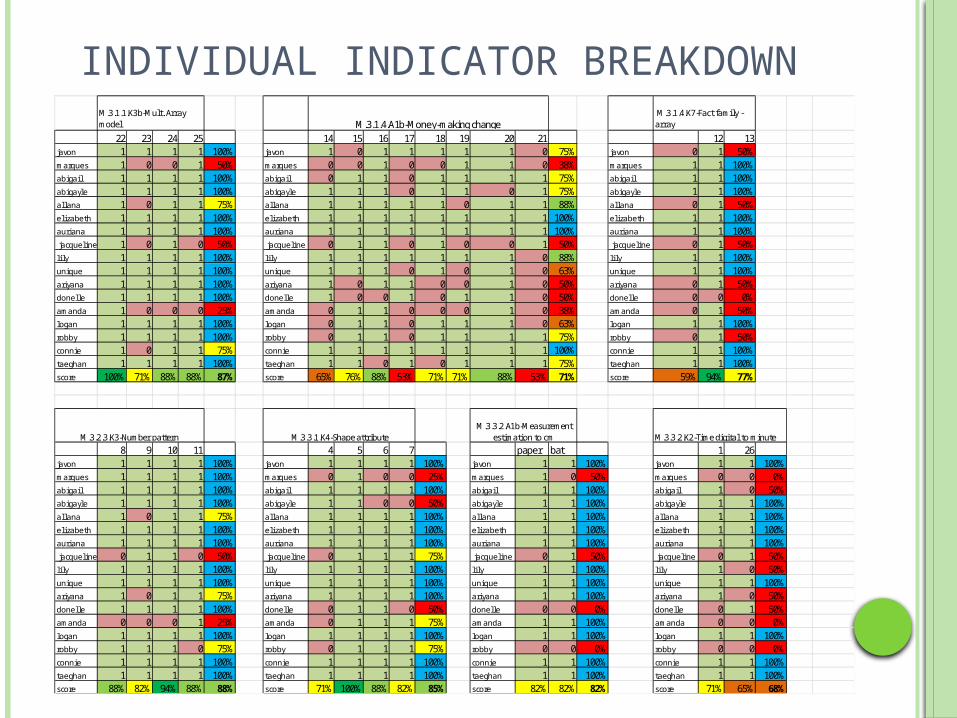
INDIVIDUAL INDICATOR BREAKDOWN
22 23 24 25 14 15 16 17 18 19 20 21 12 13javon 1 1 1 1 100% javon 1 0 1 1 1 1 1 0 75% javon 0 1 50%marques 1 0 0 1 50% marques 0 0 1 0 0 1 1 0 38% marques 1 1 100%abiga i l 1 1 1 1 100% abiga i l 0 1 1 0 1 1 1 1 75% abiga i l 1 1 100%abigayle 1 1 1 1 100% abigayle 1 1 1 0 1 1 0 1 75% abigayle 1 1 100%al lana 1 0 1 1 75% al lana 1 1 1 1 1 0 1 1 88% al lana 0 1 50%el izabeth 1 1 1 1 100% el izabeth 1 1 1 1 1 1 1 1 100% el izabeth 1 1 100%auriana 1 1 1 1 100% auriana 1 1 1 1 1 1 1 1 100% auriana 1 1 100% jacquel ine 1 0 1 0 50% jacquel ine 0 1 1 0 1 0 0 1 50% jacquel ine 0 1 50%l i ly 1 1 1 1 100% l i ly 1 1 1 1 1 1 1 0 88% l i ly 1 1 100%unique 1 1 1 1 100% unique 1 1 1 0 1 0 1 0 63% unique 1 1 100%ariyana 1 1 1 1 100% ariyana 1 0 1 1 0 0 1 0 50% ariyana 0 1 50%donel le 1 1 1 1 100% donel le 1 0 0 1 0 1 1 0 50% donel le 0 0 0%amanda 1 0 0 0 25% amanda 0 1 1 0 0 0 1 0 38% amanda 0 1 50%logan 1 1 1 1 100% logan 0 1 1 0 1 1 1 0 63% logan 1 1 100%robby 1 1 1 1 100% robby 0 1 1 0 1 1 1 1 75% robby 0 1 50%connie 1 0 1 1 75% connie 1 1 1 1 1 1 1 1 100% connie 1 1 100%taeghan 1 1 1 1 100% taeghan 1 1 0 1 0 1 1 1 75% taeghan 1 1 100%score 100% 71% 88% 88% 87% score 65% 76% 88% 53% 71% 71% 88% 53% 71% score 59% 94% 77%
8 9 10 11 4 5 6 7 paper bat 1 26javon 1 1 1 1 100% javon 1 1 1 1 100% javon 1 1 100% javon 1 1 100%marques 1 1 1 1 100% marques 0 1 0 0 25% marques 1 0 50% marques 0 0 0%abiga i l 1 1 1 1 100% abiga i l 1 1 1 1 100% abiga i l 1 1 100% abiga i l 1 0 50%abigayle 1 1 1 1 100% abigayle 1 1 0 0 50% abigayle 1 1 100% abigayle 1 1 100%al lana 1 0 1 1 75% al lana 1 1 1 1 100% al lana 1 1 100% al lana 1 1 100%el izabeth 1 1 1 1 100% el izabeth 1 1 1 1 100% el izabeth 1 1 100% el izabeth 1 1 100%auriana 1 1 1 1 100% auriana 1 1 1 1 100% auriana 1 1 100% auriana 1 1 100% jacquel ine 0 1 1 0 50% jacquel ine 0 1 1 1 75% jacquel ine 0 1 50% jacquel ine 0 1 50%l i ly 1 1 1 1 100% l i ly 1 1 1 1 100% l i ly 1 1 100% l i ly 1 0 50%unique 1 1 1 1 100% unique 1 1 1 1 100% unique 1 1 100% unique 1 1 100%ariyana 1 0 1 1 75% ariyana 1 1 1 1 100% ariyana 1 1 100% ariyana 1 0 50%donel le 1 1 1 1 100% donel le 0 1 1 0 50% donel le 0 0 0% donel le 0 1 50%amanda 0 0 0 1 25% amanda 0 1 1 1 75% amanda 1 1 100% amanda 0 0 0%logan 1 1 1 1 100% logan 1 1 1 1 100% logan 1 1 100% logan 1 1 100%robby 1 1 1 0 75% robby 0 1 1 1 75% robby 0 0 0% robby 0 0 0%connie 1 1 1 1 100% connie 1 1 1 1 100% connie 1 1 100% connie 1 1 100%taeghan 1 1 1 1 100% taeghan 1 1 1 1 100% taeghan 1 1 100% taeghan 1 1 100%score 88% 82% 94% 88% 88% score 71% 100% 88% 82% 85% score 82% 82% 82% score 71% 65% 68%
M.3.1.4.K7-Fact family -array
M.3.2.3.K3-Number pattern M.3.3.1.K4-Shape attribute
M.3.1.1.K3b-Mult. Array model M.3.1.4.A1b-Money-making change
M.3.3.2.A1b-Measurement estimation to cm M.3.3.2.K2-Time digital to minute

STUDENT SUCCESS PLAN
Strategies to implement for student success

WAYS TO IMPROVE STUDENT ACHIEVEMENT
I will continue to do morning school and Book Chat. I will also address these needs during MTSS.
Provide Tutor time and Smartboard lessons with Ms. Mackey.
Use BAIP lessons to provide additional instruction on specific indicators.
Use comprehension passages to work on specific indicators such as retell and drawing conclusions.
Individual Whole Class

CURRENT PLANS IN PLACE Homework Lunch Bunch
Students who did not complete their homework or need extra practice are given the opportunity to work during lunch.
Before and After School Tutoring by Certified Staff
Title One classified tutoring during the school day
Book Clubs Cooperative Learning MTSS
Certified teachers working with neediest Support staff facilitating peer tutoring to increase
both reading and math fluency

USE OF STAFF
100% of classroom teachers and ESS teacher tutoring
Title One funding for classified tutors 1 full-time 3-5 tutor 1 part-time k-2 tutor
Exceptional Student Service Staff facilitating peer modeling
Part-Time Librarian teaching a reading group Certified Classroom Aide teaching a reading
group TA used for academic reinforcement/enrichment Academic coach and teachers conducting book
clubs

SCHEDULING
Before school tutoring- 7:30-8:15 MTSS- 12:00-12:30 Book Clubs-before/after school or during lunch
(by student choice) After school tutoring- 3:30-4:15 Title One tutoring- 7:45-4:15
throughout the day scheduled by academic coach in response to the data and teacher input
Focus Meetings during common plan time when allowed by scheduling
Schedules built around sharing staff Music/PE with 2 other buildings Librarian with 1 other building

FORMS:COMMUNICATION AND DATA COLLECTION

FORMS USED
District SIT Paperwork- All Students Data Collection Sheet (Form..) Student Profile Record (Form..)
Formative Data Record Sheet Students use this form to track their growth and
progress Differentiation Instruction Form
Teachers use this form to track students performance on each indicator
Tutor Form (Also used for MTSS) Goal Setting Forms- All Students
See sample forms
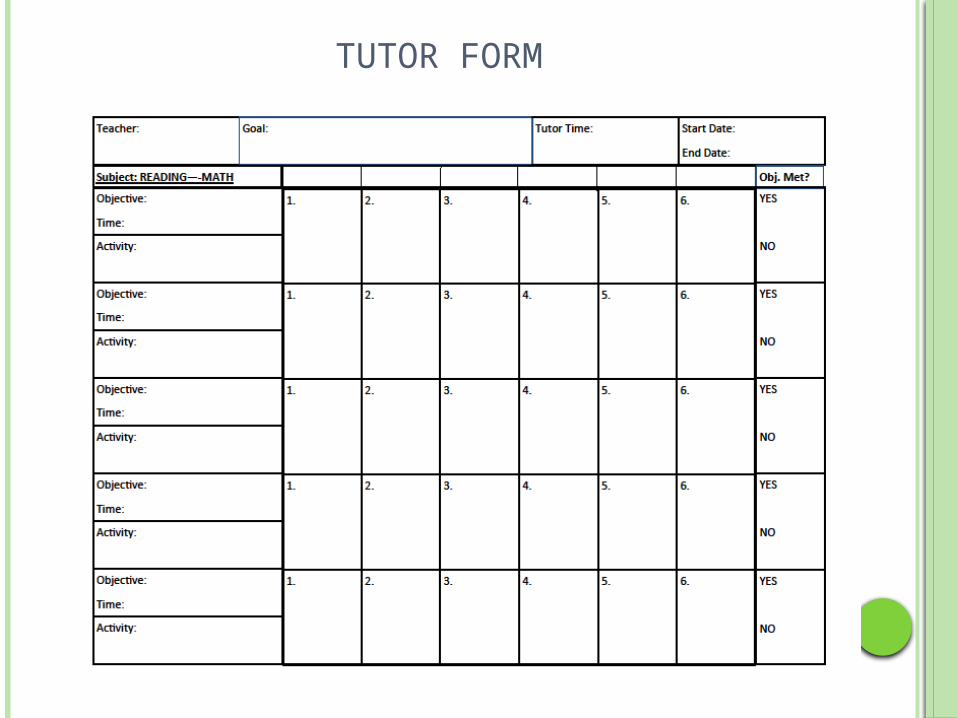
TUTOR FORM

GOAL SETTING FORM
My Goals For the Quarter
By: _____________________________________________
Reading Goal:
I will be able to ______________________________________________________________________
___________________________________________________________________________________.
Actions to Complete the Goal:
1.___________________________________________________________________________________.
2.___________________________________________________________________________________.
My Current Scores:
Lexile:______ IRL:___________ N. Formative:________ E. Formative:_________
SFA Comprehension Score:____________ SFA Vocabulary:________ WPM:_________
Math Goal:
I will be able to ________________________________________________________________________
____________________________________________________________________________________.
Actions to Complete the Goal:
1.___________________________________________________________________________________.
2.___________________________________________________________________________________.
Current Formative Score:___________________(2nd Q.)
Pre-Test Score:______________________
Additional Goal:

FORMATIVE DATA RECORD SHEET
Date #
Date Score Change
Date Text Type Score
Date Text Type Score
WPM
Assessment Score Card
Reading Comprehensive
SRIUsername:Password:
Name
Username:Password:
Reading Formative
Date
Taught Indicator
Score Overall Score
Date Overall Score
Date Overall ScoreMath Comprehensive
Math Interim
Math Formative
Front Page Second Page
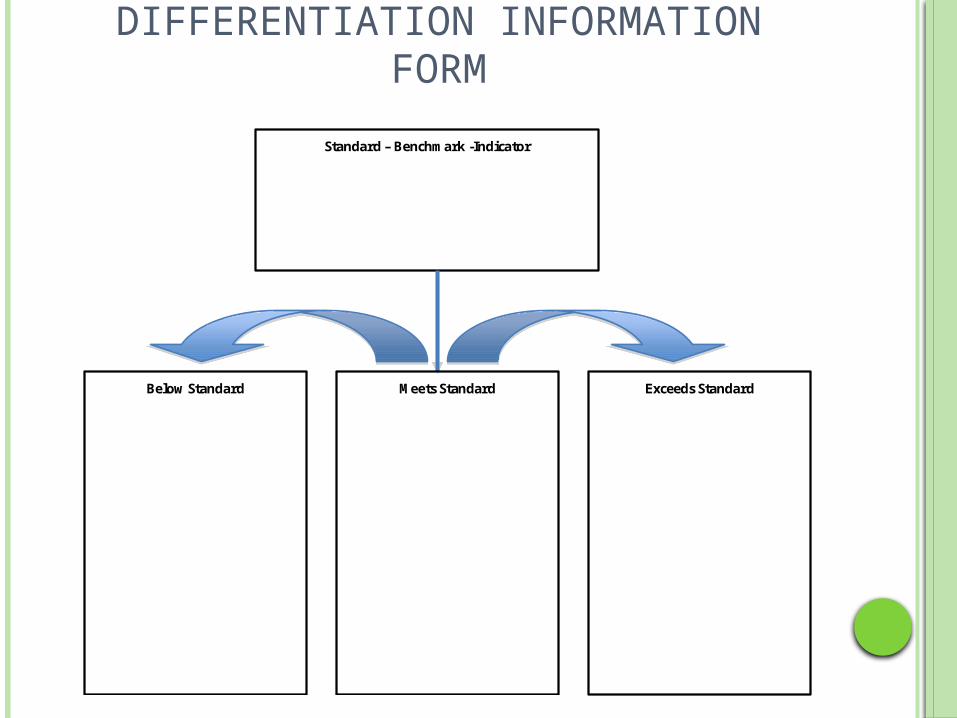
DIFFERENTIATION INFORMATION FORM
Standard – Benchmark -Indicator
Meets Standard Exceeds Standard Below Standard