grameenphone it ltd. · pdf filegrameenphone it ltd. for the year ended december 31, 2011 dear...
TRANSCRIPT

Grameenphone IT Ltd.FOR THE YEAR ENDED DECEMBER 31, 2011
Dear Shareholders,
On behalf of the Board of Directors, Management and myself, I welcome you all to the 2nd Annual General Meeting of Grameenphone IT Ltd. (GPIT). We are very delighted to place herewith the Directors’ Report and Auditors’ Report together with the Audited Financial Statements of the Company for the year ended December 31, 2011 for your consideration, approval and adoption.
Macroeconomic Perspective
Despite the challenges in the global economy, the IT industry has continued to experience steady growth. Bangladesh has potentials to be one of the preferred IT outsourcing destinations for the future with its skilled work force at a very competitive labour cost. The market analysis indicates that the total Bangladesh software and Information Technology Enabled Services (ITES) market size is USD 250 million with a steady growth of 20% for the next 2 years. Although the market is still dominated by hardware, more software innovation as application and development, coding, system integration and design are gradually becoming more pronounced. The Bangladesh IT market is fragmented and continues to embrace smaller companies that are engaged in casual and freelance works for the IT industry.
Regulatory Environment and Road Map
By extending the tax exemption for ITES until 2013 and broadening the definition of ITES, the IT service industry has received due attention from the Government. Also being the host of e-Asia 2011, Asia’s premier ICT event, and establishing the new Information and Communication Technology Ministry, the government has reinforced its commitment to Digital Bangladesh. However, poor infrastructure and lengthy regulatory processing have impeded the growth of the sector. Though the local industry has continued to attract positive international exposure and interest, the high bandwidth cost, lack of market outreach, and complex regulatory regime are the main reasons for not registering higher growth rate in export earnings. To make a self sufficient local ICT industry and to establish Bangladesh as an attractive outsourcing destination, the government has to adopt a robust plan that includes proper implementation of the current ICT policy, simplification of regulatory processes and supportive policies towards training and development.
Business Summary of the Year 2011
Many changes were initiated throughout the year 2011. At the onset, a new Management Team was appointed, and the commercial division was strengthened towards more focused sales, customer relationship and product development.
The internal organizational processes were designed in a way that it crafts a more customer driven company, supports external revenues, and upholds the overall shape of a professional customer oriented IT Company. Local Focus Group Discussions were established and awareness workshops were arranged to assert ourselves as being part of the industry and take steps to drive the industry forward. At the same time, we have also realized that the potential of this company lies not just within the limits of Bangladesh, but across the border and hence started to create awareness on a global level.
ISO Certification
In an unprecedented accomplishment, GPIT has prevailed to qualify for ISO 27001 and ISO 20000 Certifications in the very first year of its commencement. While ISO 27001 is protection of customer rights and information security, the ISO 20000 certification is ensuring quality in the processes to deliver high standards IT services. Together, they ensure a robust world class management system, touching all critical areas to ensure effective service delivery. The ISO certification confirms our commitment to quality and adds credibility which is as a prerequisite for entering the global market.
126/127Annual Report 2011
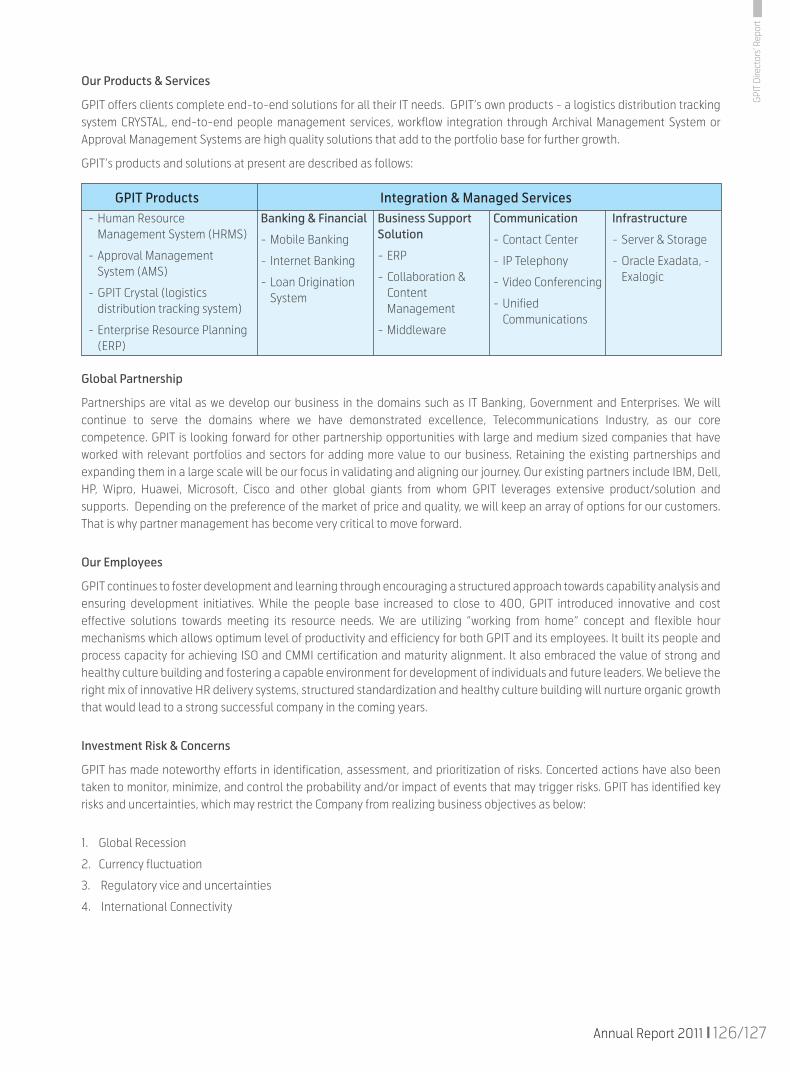
Our Products & Services
GPIT offers clients complete end-to-end solutions for all their IT needs. GPIT’s own products - a logistics distribution tracking system CRYSTAL, end-to-end people management services, workflow integration through Archival Management System or Approval Management Systems are high quality solutions that add to the portfolio base for further growth.
GPIT’s products and solutions at present are described as follows:
Global Partnership
Partnerships are vital as we develop our business in the domains such as IT Banking, Government and Enterprises. We will continue to serve the domains where we have demonstrated excellence, Telecommunications Industry, as our core competence. GPIT is looking forward for other partnership opportunities with large and medium sized companies that have worked with relevant portfolios and sectors for adding more value to our business. Retaining the existing partnerships and expanding them in a large scale will be our focus in validating and aligning our journey. Our existing partners include IBM, Dell, HP, Wipro, Huawei, Microsoft, Cisco and other global giants from whom GPIT leverages extensive product/solution and supports. Depending on the preference of the market of price and quality, we will keep an array of options for our customers. That is why partner management has become very critical to move forward.
Our Employees
GPIT continues to foster development and learning through encouraging a structured approach towards capability analysis and ensuring development initiatives. While the people base increased to close to 400, GPIT introduced innovative and cost effective solutions towards meeting its resource needs. We are utilizing “working from home” concept and flexible hour mechanisms which allows optimum level of productivity and efficiency for both GPIT and its employees. It built its people and process capacity for achieving ISO and CMMI certification and maturity alignment. It also embraced the value of strong and healthy culture building and fostering a capable environment for development of individuals and future leaders. We believe the right mix of innovative HR delivery systems, structured standardization and healthy culture building will nurture organic growth that would lead to a strong successful company in the coming years.
Investment Risk & Concerns
GPIT has made noteworthy efforts in identification, assessment, and prioritization of risks. Concerted actions have also been taken to monitor, minimize, and control the probability and/or impact of events that may trigger risks. GPIT has identified key risks and uncertainties, which may restrict the Company from realizing business objectives as below:
1. Global Recession
2. Currency fluctuation
3. Regulatory vice and uncertainties
4. International Connectivity
GPIT Products Integration & Managed Services- Human Resource
Management System (HRMS)
- Approval Management System (AMS)
- GPIT Crystal (logistics distribution tracking system)
- Enterprise Resource Planning (ERP)
Banking & Financial
- Mobile Banking
- Internet Banking
- Loan Origination System
Business Support Solution
- ERP
- Collaboration & Content Management
- Middleware
Communication
- Contact Center
- IP Telephony
- Video Conferencing
- Unified Communications
Infrastructure
- Server & Storage
- Oracle Exadata, - Exalogic
GPI
T D
irect
ors’
Repo
rt

We will continue to take timely measures to control the probability and/or negative impact of the risks mentioned above. We will also look into ways to how we can turn some of the risks into prospects. The global recession with a strong focus on increased cost effectiveness and increased productivity may open opportunities for GPIT’s products and services, which are cost competitive in the global market.
Contribution to the National Exchequer
Grameenphone IT Ltd. paid a significant contribution to the National Exchequer in the last year. The collective contribution to the National Exchequer up to December 2011 was BDT 72 million.
Enhanced Value of Shareholders’ Investment:
The Directors present the financial results of the Company for the year ended December 31, 2011 and recommend the appropriation as mentioned in the “Appropriation of Profit” table below:
2011 2010
Profit available for appropriation 126,175,141
Profit /( Loss) during the year (140,729,616) 126,175,141
Total amount available for appropriation (14,554,475) 126,175,141
Profit/(Loss) carried forward (14,554,475) 126,175,141
Dividend
In view of accumulated loss of BDT 14,554,475 during the year up to December 31, 2011, the Directors are unable to offer any dividend to the Shareholders for the year 2011.
Board of Directors & Board Meetings
The composition of the Board of Directors who held office during the year is as below:
1. Mr. Tore Johnsen
2. Mr. Raihan Shamsi
3. Mr. Arild Kaale
4. Mr. Frode Stoldal
5. Mr. Haroon Bhatti
6. Mr. Kazi Monirul Kabir
7. Mr. Tanveer Mohammad
Mr. Haroon Bhatti was appointed as a Director at the 26th Board meeting on December 12, 2011 in replacement of Mr. Arnfinn Groven as per provision of the Articles of Association of the Company.
During 2011, a total of 13 (thirteen) Board meetings were held, which met the regulatory requirement in this respect.
Directors’ appointment & Re-appointment
With regard to the appointment, retirement and re-appointment of Directors, the Company is governed by its Articles of Association, the Companies Act, 1994 and other related legislations. Accordingly, the following Directors of the Board will retire at the Annual General Meeting. They are, however, eligible for re-appointment:
1. Mr. Raihan Shamsi
2. Mr. Arild Kaale
3. Mr. Haroon Bhatti
GPI
T D
irect
ors’
Repo
rt
Figures in BDT

128/129Annual Report 2011
Appointment of Auditors
The appointment, reappointment and replacement of statutory auditors for the Company are governed by the provisions of the Companies Act 1994. The statutory auditors of the Company, M/S Rahman Rahman Huq, Chartered Accountants, a member firm of KPMG, shall retire in this AGM. The Firm, being eligible, has expressed their willingness to be re-appointed. The Board recommends their re-appointment for the year 2012 and to continue till the next AGM at a fee of BDT 550,000 (Taka Five Hundred Fifty thousand only) plus applicable VAT.
Looking ahead 2012 and beyond
GPIT has set the strategies and fundamentals to continue on the journey of profitable growth. The Company will continue to invest in organizational development, process improvement, customer relationship and market presence. We want to be a driving force to build the local IT industry and to make Bangladesh a potential outsourcing destination for software development in collaboration with local partners. We are confident that with the current strategy, progression and steady growth, we will be able to reach our targets.
Acknowledgements
Members of the Board take this opportunity to express their gratitude and sincere thanks to the Shareholders for their continued support and guidance.
The Board also records its appreciation for the employees at all levels for their dedicated services, sincerity, hard works and strong commitment, which enabled the Company to advance to what we perceive to be a sustainable growth path.
Thanking you all and with best regards.
For and on behalf of the Board of Directors of Grameenphone IT Ltd.
Tore JohnsenChairman
Grameenphone IT Ltd.
February 08, 2012
GPI
T D
irect
ors’
Repo
rt
Auditors’ Report &Audited Financial Statements ofGrameenphone IT Ltd.
130/131Annual Report 2011
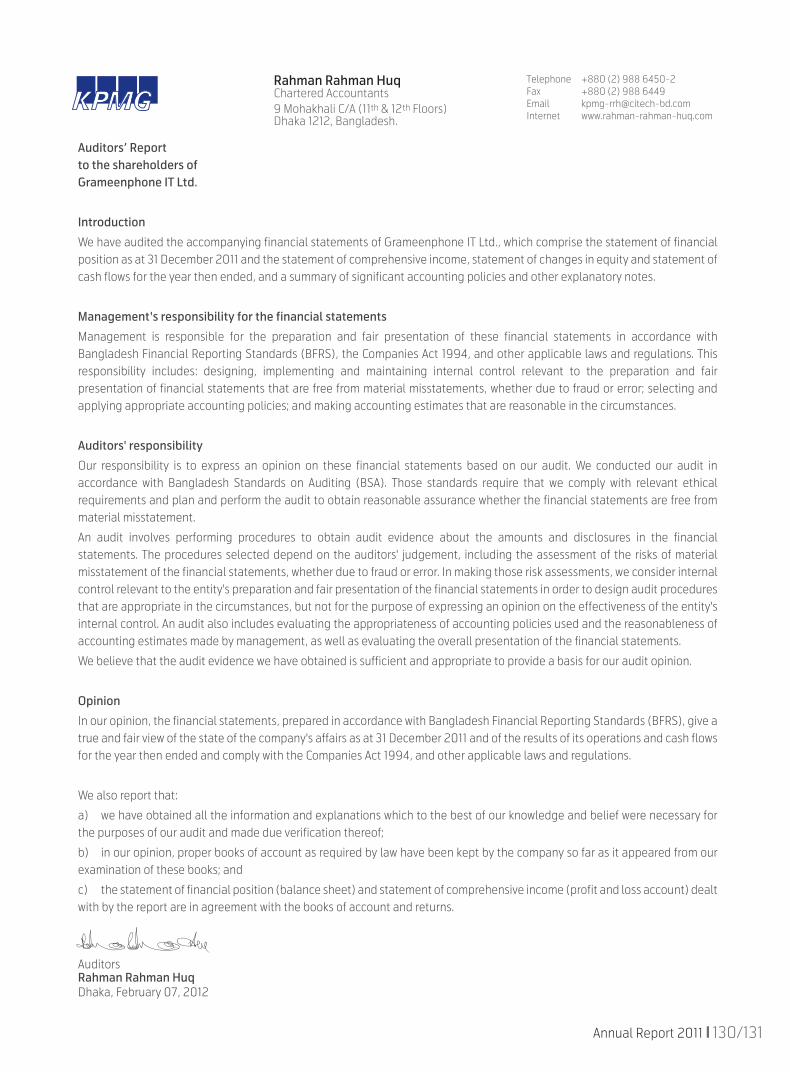
Auditors’ Reportto the shareholders ofGrameenphone IT Ltd.
Introduction
We have audited the accompanying financial statements of Grameenphone IT Ltd., which comprise the statement of financial position as at 31 December 2011 and the statement of comprehensive income, statement of changes in equity and statement of cash flows for the year then ended, and a summary of significant accounting policies and other explanatory notes.
Management's responsibility for the financial statements
Management is responsible for the preparation and fair presentation of these financial statements in accordance with Bangladesh Financial Reporting Standards (BFRS), the Companies Act 1994, and other applicable laws and regulations. This responsibility includes: designing, implementing and maintaining internal control relevant to the preparation and fair presentation of financial statements that are free from material misstatements, whether due to fraud or error; selecting and applying appropriate accounting policies; and making accounting estimates that are reasonable in the circumstances.
Auditors' responsibility
Our responsibility is to express an opinion on these financial statements based on our audit. We conducted our audit in accordance with Bangladesh Standards on Auditing (BSA). Those standards require that we comply with relevant ethical requirements and plan and perform the audit to obtain reasonable assurance whether the financial statements are free from material misstatement.
An audit involves performing procedures to obtain audit evidence about the amounts and disclosures in the financial statements. The procedures selected depend on the auditors' judgement, including the assessment of the risks of material misstatement of the financial statements, whether due to fraud or error. In making those risk assessments, we consider internal control relevant to the entity's preparation and fair presentation of the financial statements in order to design audit procedures that are appropriate in the circumstances, but not for the purpose of expressing an opinion on the effectiveness of the entity's internal control. An audit also includes evaluating the appropriateness of accounting policies used and the reasonableness of accounting estimates made by management, as well as evaluating the overall presentation of the financial statements.
We believe that the audit evidence we have obtained is sufficient and appropriate to provide a basis for our audit opinion.
Opinion
In our opinion, the financial statements, prepared in accordance with Bangladesh Financial Reporting Standards (BFRS), give a true and fair view of the state of the company's affairs as at 31 December 2011 and of the results of its operations and cash flows for the year then ended and comply with the Companies Act 1994, and other applicable laws and regulations.
We also report that:
a) we have obtained all the information and explanations which to the best of our knowledge and belief were necessary for the purposes of our audit and made due verification thereof;
b) in our opinion, proper books of account as required by law have been kept by the company so far as it appeared from our examination of these books; and
c) the statement of financial position (balance sheet) and statement of comprehensive income (profit and loss account) dealt with by the report are in agreement with the books of account and returns.
AuditorsRahman Rahman HuqDhaka, February 07, 2012
2011Taka
2010Taka
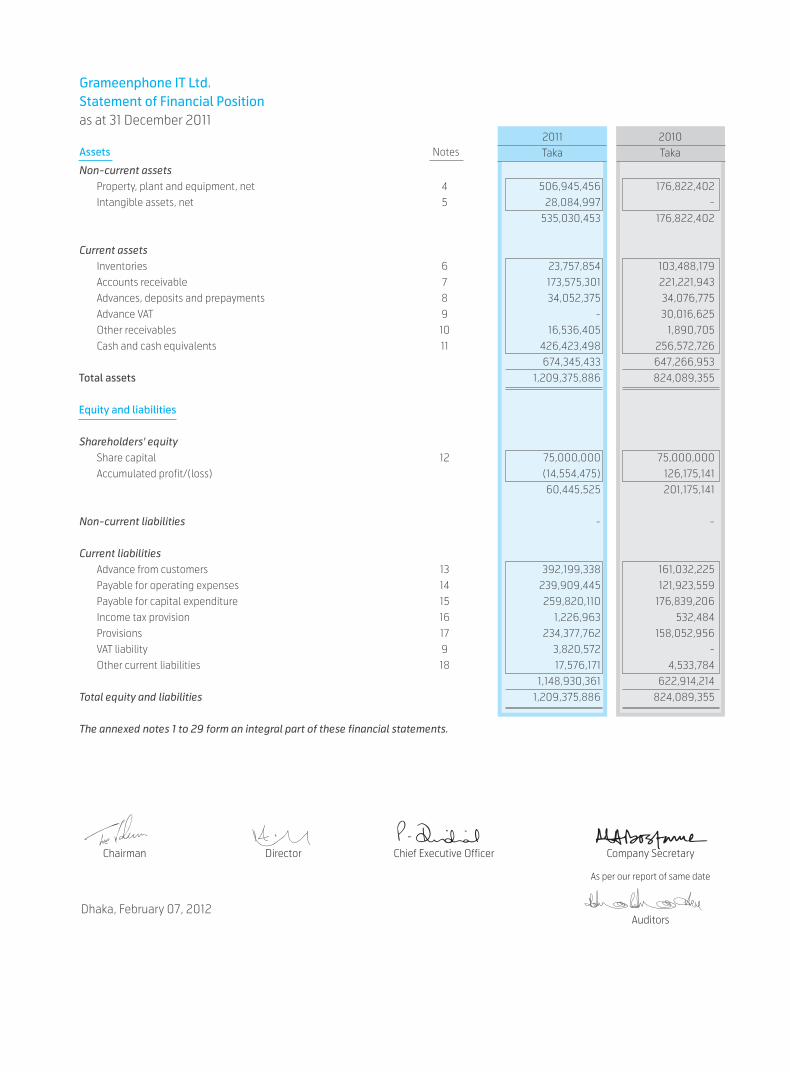
Grameenphone IT Ltd.Statement of Financial Positionas at 31 December 2011
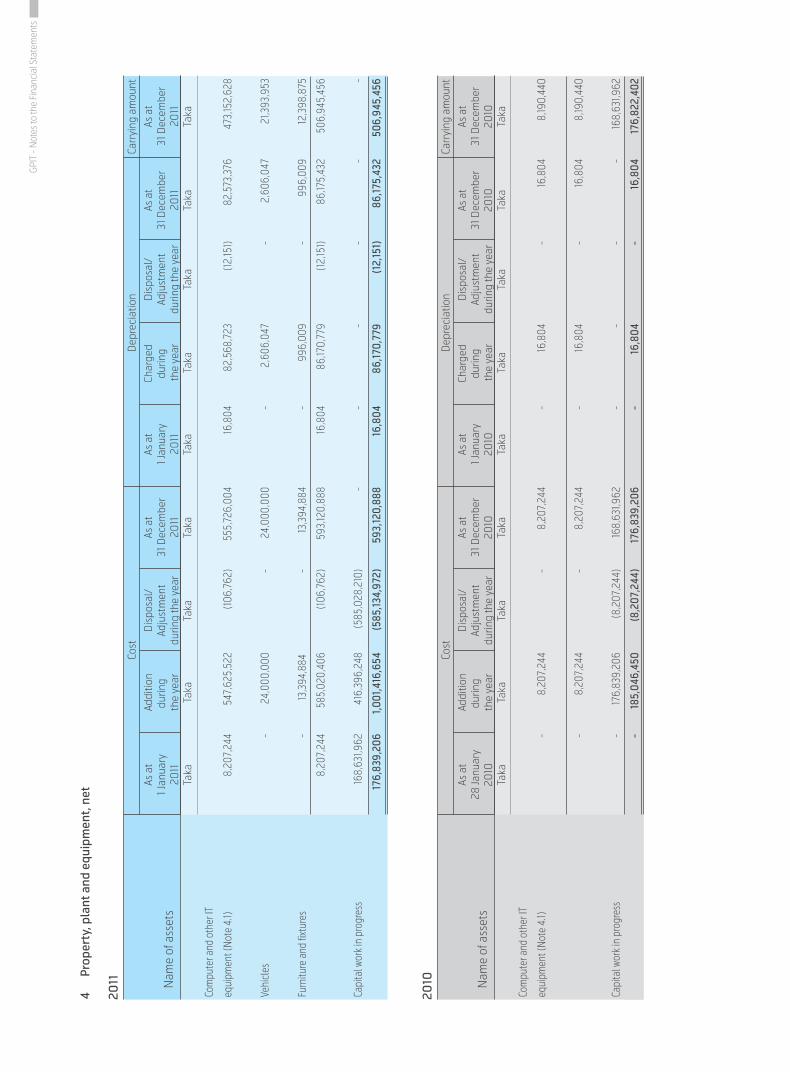
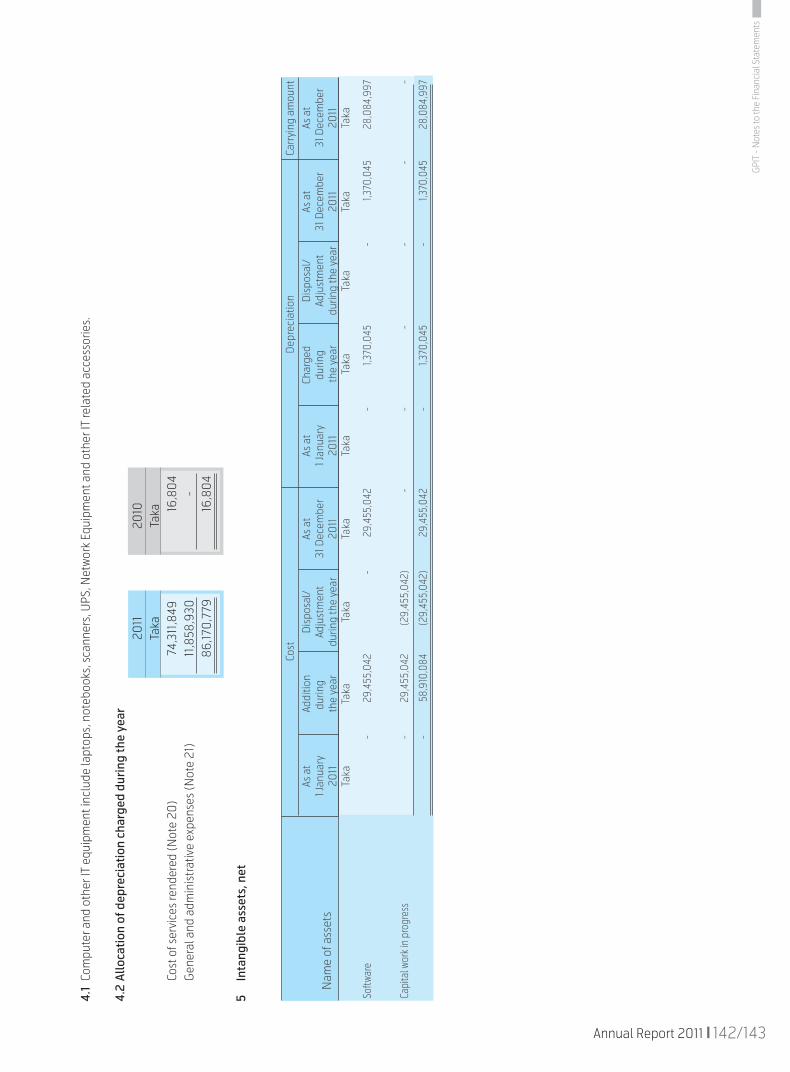
Non-current assets Property, plant and equipment, net 4 506,945,456 176,822,402 Intangible assets, net 5 28,084,997 - 535,030,453 176,822,402
Current assets Inventories 6 23,757,854 103,488,179 Accounts receivable 7 173,575,301 221,221,943 Advances, deposits and prepayments 8 34,052,375 34,076,775 Advance VAT 9 - 30,016,625 Other receivables 10 16,536,405 1,890,705 Cash and cash equivalents 11 426,423,498 256,572,726 674,345,433 647,266,953Total assets 1,209,375,886 824,089,355
Equity and liabilities
Shareholders' equity Share capital 12 75,000,000 75,000,000 Accumulated profit/(loss) (14,554,475) 126,175,141 60,445,525 201,175,141
Non-current liabilities - -
Current liabilities Advance from customers 13 392,199,338 161,032,225 Payable for operating expenses 14 239,909,445 121,923,559 Payable for capital expenditure 15 259,820,110 176,839,206 Income tax provision 16 1,226,963 532,484 Provisions 17 234,377,762 158,052,956 VAT liability 9 3,820,572 - Other current liabilities 18 17,576,171 4,533,784 1,148,930,361 622,914,214Total equity and liabilities 1,209,375,886 824,089,355
The annexed notes 1 to 29 form an integral part of these financial statements.
NotesAssets
Chairman Director Chief Executive Officer Company Secretary
As per our report of same date
AuditorsDhaka, February 07, 2012
132/133Annual Report 2011
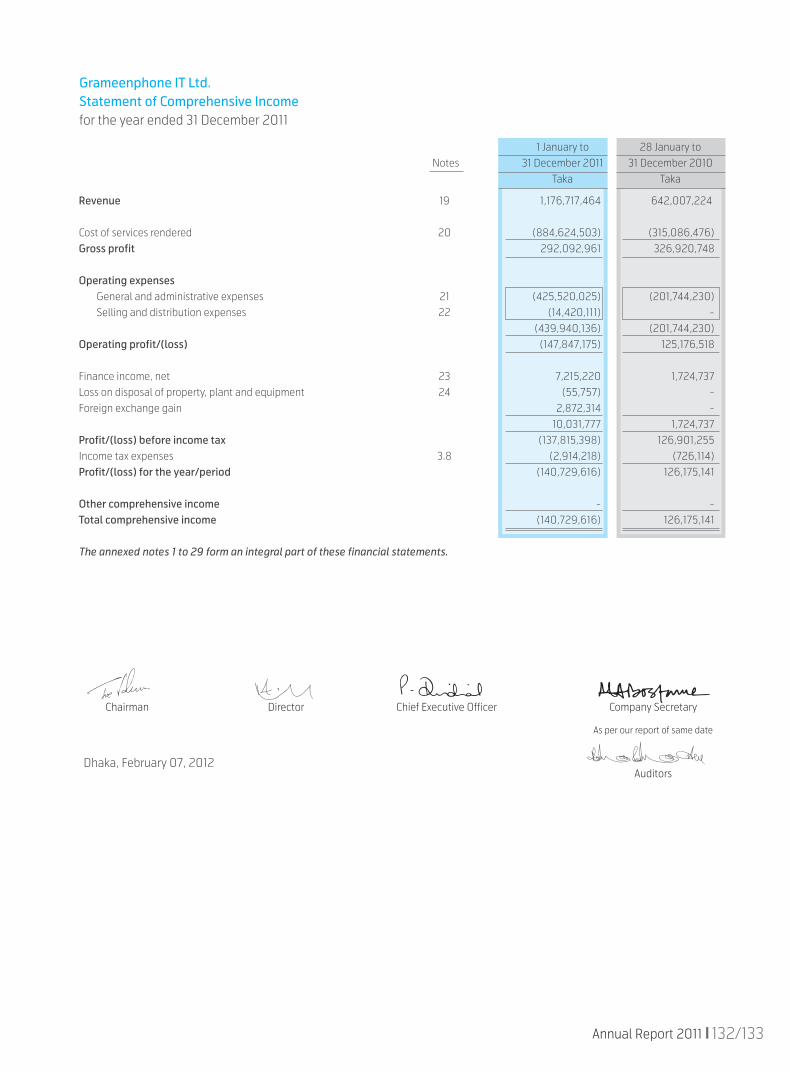
Grameenphone IT Ltd.Statement of Comprehensive Incomefor the year ended 31 December 2011
Revenue 19 1,176,717,464 642,007,224
Cost of services rendered 20 (884,624,503) (315,086,476)Gross profit 292,092,961 326,920,748
Operating expenses General and administrative expenses 21 (425,520,025) (201,744,230) Selling and distribution expenses 22 (14,420,111) - (439,940,136) (201,744,230)Operating profit/(loss) (147,847,175) 125,176,518
Finance income, net 23 7,215,220 1,724,737Loss on disposal of property, plant and equipment 24 (55,757) -Foreign exchange gain 2,872,314 - 10,031,777 1,724,737Profit/(loss) before income tax (137,815,398) 126,901,255Income tax expenses 3.8 (2,914,218) (726,114)Profit/(loss) for the year/period (140,729,616) 126,175,141
Other comprehensive income - -Total comprehensive income (140,729,616) 126,175,141
The annexed notes 1 to 29 form an integral part of these financial statements.
28 January to 31 December 2010
Taka
1 January to 31 December 2011
Taka Notes
Chairman Director Chief Executive Officer Company Secretary
As per our report of same date
AuditorsDhaka, February 07, 2012

Grameenphone IT Ltd.Statement of Changes in Equityfor the year ended 31 December 2011
Issue of shares 75,000,000 - 75,000,000Profit for the period - 126,175,141 126,175,141Other comprehensive income - - -Balance as at 31 December 2010 75,000,000 126,175,141 201,175,141
Loss for the year - (140,729,616) (140,729,616)Other comprehensive income - - -Balance as at 31 December 2011 75,000,000 (14,554,475) 60,445,525
The annexed notes 1 to 29 form an integral part of these financial statements.
TotalTaka
Accumulatedprofit/(loss)
Taka
Sharecapital
Taka
134/135Annual Report 2011
28 January to 31 December 2010
Taka
1 January to 31 December 2011
Taka
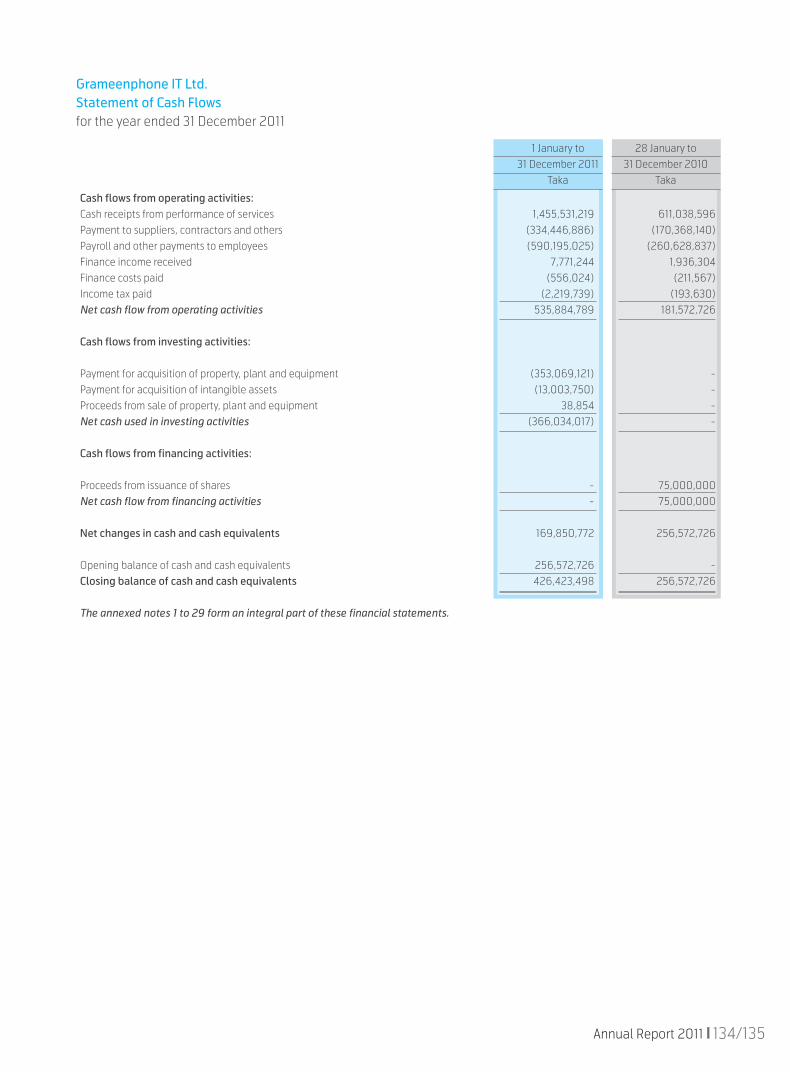
Grameenphone IT Ltd.Statement of Cash Flowsfor the year ended 31 December 2011
Cash flows from operating activities:Cash receipts from performance of services 1,455,531,219 611,038,596Payment to suppliers, contractors and others (334,446,886) (170,368,140)Payroll and other payments to employees (590,195,025) (260,628,837)Finance income received 7,771,244 1,936,304Finance costs paid (556,024) (211,567)Income tax paid (2,219,739) (193,630)Net cash flow from operating activities 535,884,789 181,572,726
Cash flows from investing activities:
Payment for acquisition of property, plant and equipment (353,069,121) -Payment for acquisition of intangible assets (13,003,750) -Proceeds from sale of property, plant and equipment 38,854 -Net cash used in investing activities (366,034,017) -
Cash flows from financing activities:
Proceeds from issuance of shares - 75,000,000Net cash flow from financing activities - 75,000,000
Net changes in cash and cash equivalents 169,850,772 256,572,726
Opening balance of cash and cash equivalents 256,572,726 -Closing balance of cash and cash equivalents 426,423,498 256,572,726
The annexed notes 1 to 29 form an integral part of these financial statements.
Grameenphone IT Ltd.Notes to the financial statementsas at and for year ended 31 December 2011
1. Reporting entity
Grameenphone IT Ltd. (hereinafter referred to as "GPIT/the company") is a private limited company incorporated in Bangladesh under the Companies Act 1994 with an authorised share capital of Tk 7,500,000,000 divided into 75,000,000 ordinary shares of Tk 100 each. The company was registered on 28 January 2010. The company is a wholly owned subsidiary of Grameenphone Ltd. ("Grameenphone"/"GP"). Registered office of the company is GPHOUSE, Bashundhara, Baridhara, Dhaka-1229, Bangladesh.
The company launched its commercial operation on 1 April 2010.
The purpose of this company is to provide IT services to Grameenphone Ltd. and other external parties.
2. Basis of preparation
2.1 Statement of compliance
These financial statements have been prepared in accordance with Bangladesh Financial Reporting Standards (BFRS), the Companies Act 1994 and other applicable laws in Bangladesh.
These financial statements have been authorised for issue by the board of directors on February 07, 2012.
2.2 Basis of measurement
Except for the employee benefit plan, which is measured on the basis of actuarial valuation, these financial statements have been prepared on the basis of historical cost convention.
2.3 Functional and presentation currency
These financial statements are presented in Bangladesh Taka (Taka/Tk/BDT) which is both functional currency and presentation currency of the company. The amounts in these financial statements have been rounded off to the nearest Taka.
2.4 Use of estimates and judgments
The preparation of these financial statements requires management to make judgments, estimates and assumptions that affect the application of accounting policies and the reported amounts of assets, liabilities, income and expenses. Actual results may differ from these estimates.
Estimates and underlying assumptions are reviewed on an ongoing basis. Revision to accounting estimates is recognised in the period in which the estimates are revised if the revision affects only that period, or in the period of revision and future periods if the revision affects both current and future periods.
In particular, information about significant areas of estimation uncertainty and critical judgments in applying accounting policies that have significant effect on the amount recognised in the financial statements are described in the following notes:
Note 16 Income taxes
Note 17 Provisions
Note 19 Revenue
2.5 Comparative information
Comparative information presented in these financial statements covers the period from 28 January 2010 (the date of incorporation) to 31 December 2010. Accordingly, comparative figures for the statement of comprehensive income, statement of changes in equity, statement of cash flows and related notes are not entirely comparable.
136/137Annual Report 2011
3. Significant accounting policies
Accounting policies set out below have been applied consistently to all periods presented in these financial statements.
3.1 Property, plant and equipment
(a) Recognition and measurement
Items of property, plant and equipment are measured at cost less accumulated depreciation and accumulated impairment losses, if any.
The cost of an item of property, plant and equipment comprises its purchase price, import duties and non-refundable taxes, after deducting trade discount and rebates, and any costs directly attributable to bringing the asset to the location and condition necessary for it to be capable of operating in the intended manner. Purchased software that is integral to the functionality of the related equipment is capitalised as part of that equipment.
When parts of an item of property, plant and equipment have different useful lives, they are accounted for as separate items (major components) of property, plant and equipment.
(b) Subsequent costs
The cost of replacing or upgrading an item of property, plant and equipment is recognised in the carrying amount of the item if it is probable that the future economic benefits embodied within the item will flow to the company and its cost can be measured reliably. The carrying amount of the replaced component is derecognised. The costs of the day to day servicing of property, plant and equipment are recognised in the statement of comprehensive income as incurred.
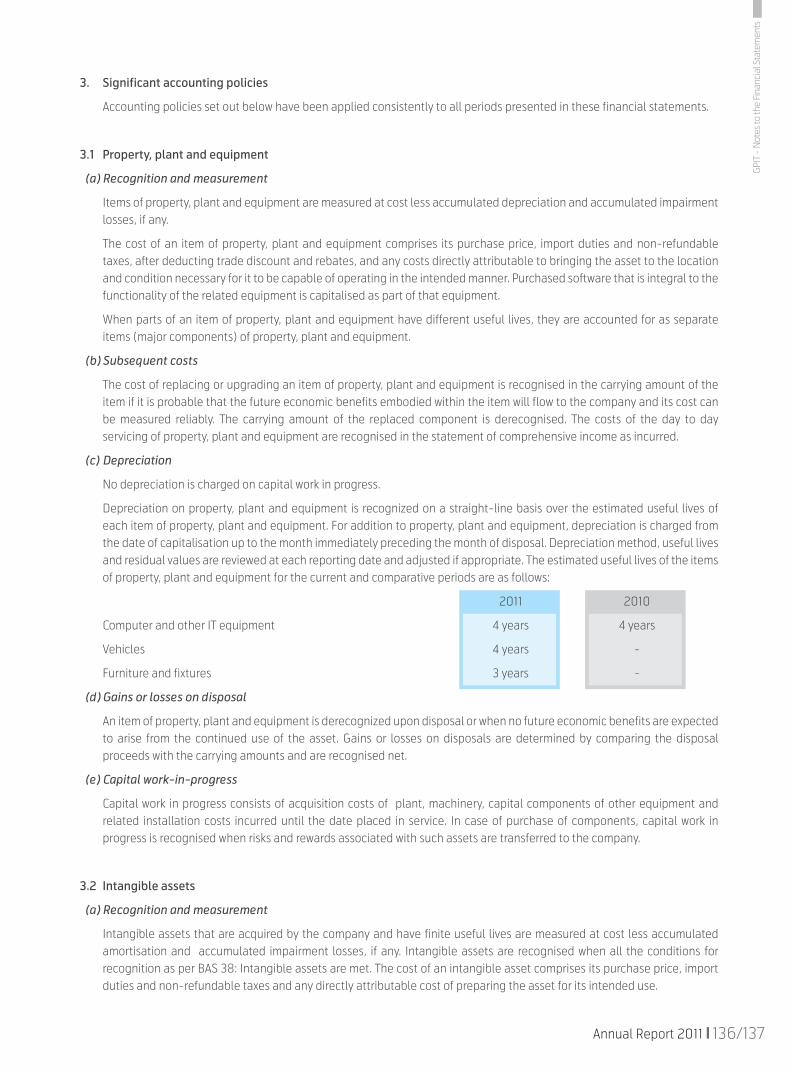
(c) Depreciation
No depreciation is charged on capital work in progress.
Depreciation on property, plant and equipment is recognized on a straight-line basis over the estimated useful lives of each item of property, plant and equipment. For addition to property, plant and equipment, depreciation is charged from the date of capitalisation up to the month immediately preceding the month of disposal. Depreciation method, useful lives and residual values are reviewed at each reporting date and adjusted if appropriate. The estimated useful lives of the items of property, plant and equipment for the current and comparative periods are as follows:
2011 2010
Computer and other IT equipment 4 years 4 years
Vehicles 4 years -
Furniture and fixtures 3 years -
(d) Gains or losses on disposal
An item of property, plant and equipment is derecognized upon disposal or when no future economic benefits are expected to arise from the continued use of the asset. Gains or losses on disposals are determined by comparing the disposal proceeds with the carrying amounts and are recognised net.
(e) Capital work-in-progress
Capital work in progress consists of acquisition costs of plant, machinery, capital components of other equipment and related installation costs incurred until the date placed in service. In case of purchase of components, capital work in progress is recognised when risks and rewards associated with such assets are transferred to the company.
3.2 Intangible assets
(a) Recognition and measurement
Intangible assets that are acquired by the company and have finite useful lives are measured at cost less accumulated amortisation and accumulated impairment losses, if any. Intangible assets are recognised when all the conditions for recognition as per BAS 38: Intangible assets are met. The cost of an intangible asset comprises its purchase price, import duties and non-refundable taxes and any directly attributable cost of preparing the asset for its intended use.
GPI
T -
Not
es to
the
Fina
ncia
l Sta
tem
ents
(b) Subsequent costs
Subsequent costs are capitalised only when they increase the future economic benefits embodied in the specific asset to which they relate. All other costs are recognised in profit or loss as incurred.
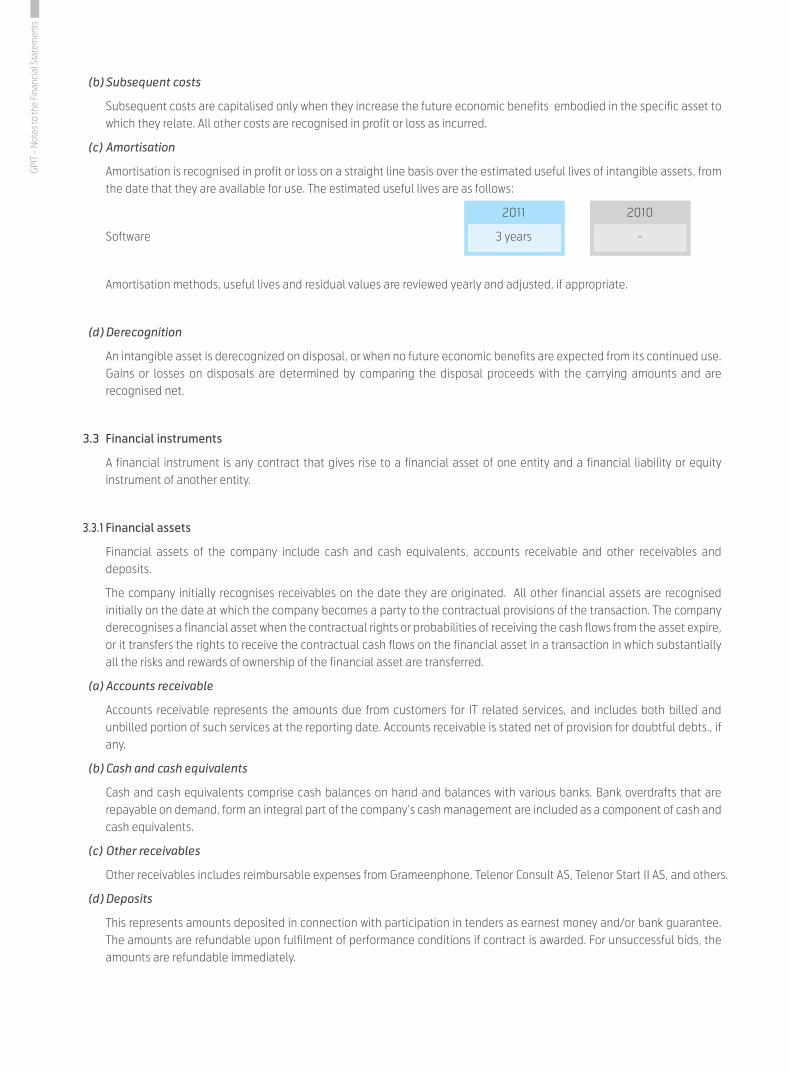
(c) Amortisation
Amortisation is recognised in profit or loss on a straight line basis over the estimated useful lives of intangible assets, from the date that they are available for use. The estimated useful lives are as follows:
2011 2010
Software 3 years -
Amortisation methods, useful lives and residual values are reviewed yearly and adjusted, if appropriate.
(d) Derecognition
An intangible asset is derecognized on disposal, or when no future economic benefits are expected from its continued use. Gains or losses on disposals are determined by comparing the disposal proceeds with the carrying amounts and are recognised net.
3.3 Financial instruments
A financial instrument is any contract that gives rise to a financial asset of one entity and a financial liability or equity instrument of another entity.
3.3.1 Financial assets
Financial assets of the company include cash and cash equivalents, accounts receivable and other receivables and deposits.
The company initially recognises receivables on the date they are originated. All other financial assets are recognised initially on the date at which the company becomes a party to the contractual provisions of the transaction. The company derecognises a financial asset when the contractual rights or probabilities of receiving the cash flows from the asset expire, or it transfers the rights to receive the contractual cash flows on the financial asset in a transaction in which substantially all the risks and rewards of ownership of the financial asset are transferred.
(a) Accounts receivable
Accounts receivable represents the amounts due from customers for IT related services, and includes both billed and unbilled portion of such services at the reporting date. Accounts receivable is stated net of provision for doubtful debts., if any.
(b) Cash and cash equivalents
Cash and cash equivalents comprise cash balances on hand and balances with various banks. Bank overdrafts that are repayable on demand, form an integral part of the company’s cash management are included as a component of cash and cash equivalents.
(c) Other receivables
Other receivables includes reimbursable expenses from Grameenphone, Telenor Consult AS, Telenor Start II AS, and others.
(d) Deposits
This represents amounts deposited in connection with participation in tenders as earnest money and/or bank guarantee. The amounts are refundable upon fulfilment of performance conditions if contract is awarded. For unsuccessful bids, the amounts are refundable immediately.
GPI
T -
Not
es to
the
Fina
ncia
l Sta
tem
ents

138/139Annual Report 2011
3.3.2 Financial liabilities
Financial liabilities are recognised initially on the transaction date at which the company becomes a party to the contractual obligations arising from the past events and the settlement of which is expected to result in an outflow of resources embodying economic benefit. The company derecognises a financial liability when its contractual obligations are discharged or cancelled or exp
Financial liabilities include payable for operating expenses, payable for capital expenditure, provisions, advance from customers and other current liabilities.
3.4 Impairment
(a) Financial assets
Financial assets are assessed at each reporting date to determine whether there is any objective evidence of impairment. Financial assets are impaired if objective evidence indicates that a loss event has occurred after the initial recognition of the asset, and that the loss event had a negative effect on the estimated future cash flows of that asset that can be estimated reliably. Objective evidence that financial assets are impaired can include default or delinquency by a debtor, indications that a debtor or issuer will enter bankruptcy, etc.
(b) Non-financial assets
An asset is impaired when its carrying amount exceeds its recoverable amount. The company assesses yearly whether there is any indication that an asset or a Cash Generating Unit (CGU) may be impaired. If any such indication exists, the company estimates the recoverable amount of the asset or CGU. The recoverable amount of an asset or a CGU is the higher of its fair value less costs to sell and its value in use. Carrying amount of the asset is reduced to its recoverable amount by recognising an impairment loss, if and only if, the recoverable amount of the asset is less than its carrying amount. Impairment loss is recognised immediately in profit or loss, unless the asset is carried at revalued amount. Any impairment loss of a revalued asset is treated as a revaluation decrease.
3.5 Revenue
Revenues are measured at fair value of the consideration received or receivable, net of discount and sales related taxes (e.g. VAT). Revenues are reported gross with separate recording of expenses to vendors of products or services. However, when the company acts only as an agent or broker on behalf of suppliers of products or services, revenues are reported on a net basis. Revenues of Grameenphone IT Ltd. arise from:
(a) Sale of software
Revenue from the sale of software is recognised when significant risks and rewards associated with the software is transferred and the entity retains neither significant managerial involvement nor effective control over the software. The other criteria for revenue recognition, i.e. availability of reliable measure for revenue and associated costs and probable flow of economic benefits to the entity must also be met.
Accordingly delivery of a software is not considered complete and revenue is not recognised when the software is shipped subject to installation and the installation is a significant part of the contract which has not yet been completed by the company.
(b) IT service revenue
Revenue from IT service is recognised on a percentage of completion basis. Percentage of completion of service is determined upon periodic review and usually evidenced by work completion certificate. Revenue is recognised only when it is probable that the economic benefits associated with the transaction will flow to the entity.
(c) Revenue from Construction contracts
When the outcome of a construction contract can be estimated reliably, revenue from construction contracts is recognized by reference to the stage of completion of the contract activity at the end of the reporting period. The stage of completion of a contract is determined in a variety of ways depending on the nature of the contract. The entity uses the method that measures reliably the work performed. The methods include cost-to-cost, survey of work performed and completion of physical proportion of the contract work.
GPI
T -
Not
es to
the
Fina
ncia
l Sta
tem
ents
If circumstances arise that may change the original estimates of revenues, costs or extent of progress toward completion, estimates are revised. These revisions may result in increases or decreases in estimated revenues or costs and are reflected in the profit or loss for the period in which the circumstances that give rise to the revision become known by management.
When the outcome of a construction contract cannot be estimated reliably, revenue is recognized only to the extent of recoverable contract costs incurred and contract costs are recognized as an expense in the period in which they are incurred. An expected loss on the construction contract is recognized as an expense immediately.
3.6 Foreign currency transactions
Transactions in foreign currencies are recorded in the books at the rate of exchange prevailing on the date of the transaction. Monetary assets and liabilities in foreign currencies at the date of statement of financial position are translated into Bangladesh taka at the rate of exchange prevailing at that date. Non-monetary items that are measured in terms of historical cost in a foreign currency are translated using the exchange rates as at the dates of the initial transactions. Non-monetary items measured at fair value in a foreign currency are translated using the exchange rates at the date when the fair value was determined. Exchange differences arising on the settlement of monetary items or on translating monetary items at the end of the reporting period are recognised in profit or loss as per BAS 21: The Effects of Changes in Foreign Exchange Rates.
3.7 Inventories
Cost of inventories include expenditure incurred in acquiring the inventories, and other costs incurred in bringing them to their existing location and condition. Net realisable value is based on estimated selling price in the ordinary course of business less the estimated costs of completion and the estimated costs necessary to make the sale.
Grameenphone IT Ltd. measures service related inventories at the lower of cost or net realizable value. Inventory costs consist primarily of cost for the personnel directly engaged in providing the service, including supervisory personnel, other direct costs and attributable overheads.
Cost of software inventory for customers is specifically identified on a item by item basis since these items are not interchangeable with each other.
3.8 Income tax expense
Income tax expense is recognised in the statement of comprehensive income except to the extent that it relates to items recognised directly in equity, in which case it is recognised in equity.
As per the provisions of Income Tax Ordinance 1984 (ITO), IT enabled services are subject to tax exemption until 30 June 2013. However, income from sources other than IT enabled services are taxable as per Income Tax Ordinance 1984. Applicable income tax for such other income is 37.5%. as per Finance Act 2011.
3.9 Employee benefits
The company maintains both defined contribution plan and defined benefit plan for its eligible permanent employees.
(a) Defined contribution plan (provident fund)
The company contributes 10% of basic salary of all eligible permanent employees to a provident fund (defined contribution plan) constituted under an irrevocable trust, while the employees also contribute an equal amount to the fund as per the rules of the trust deed.
The company recognises contribution to defined contribution plan as an expense when an employee has rendered services in exchange for such contribution. The legal and constructive obligation is limited to the amount it agrees to contribute to the fund.
GPI
T -
Not
es to
the
Fina
ncia
l Sta
tem
ents

140/141Annual Report 2011
(b) Defined benefit plan (gratuity)
The company provides retirement benefit in the form of gratuity payments determined by reference to employees' earnings and years of service to each eligible employees at the time of retirement/separation. Gratuity obligation at the reporting date is measured on the basis of actuary valuation.
(c) Short term employee benefits
Short term employee benefits include salary, bonuses, leave encashment. Obligations for such benefits are measured on an undiscounted basis and are expensed as the related service is provided.
3.10 Provisions
A provision is recognised in the statement of financial position when the company has a legal or constructive obligation as a result of a past event, it is probable that an outflow of economic benefits will be required to settle the obligation and a reliable estimate can be made of the amount of the obligation. Provision is ordinarily measured at the best estimate of the expenditure required to settle the present obligation at the date of statement of financial position. Where the effect of time value of money is material, the amount of provision is measured at the present value of the expenditures expected to be required to settle the obligation.
3.11 Events after the reporting period
Events after the reporting period that provide additional information about the company's position at the date of statement of financial position or those that indicate the going concern assumption is not appropriate are reflected in the financial statements. Events after the reporting period that are not adjusting events are disclosed when material.
GPI
T -
Not
es to
the
Fina
ncia
l Sta
tem
ents
Com
pute
r and
oth
er IT
equi
pmen
t (No
te 4
.1)
8,20
7,24
4 54
7,62
5,52
2 (1
06,7
62)
555,
726,
004
16,8
04
82,5
68,7
23
(12,
151)
82
,573
,376
47
3,15
2,62
8
Vehi
cles
-
24,0
00,0
00
- 24
,000
,000
-
2,60
6,04
7 -
2,60
6,04
7 21
,393
,953
Furn
iture
and
fixt
ures
-
13,3
94,8
84
- 13
,394
,884
-
996,
009
- 99
6,00
9 12
,398
,875
8,20
7,24
4 58
5,02
0,40
6 (1
06,7
62)
593,
120,
888
16,8
04
86,17
0,77
9 (1
2,15
1)
86,17
5,43
2 50
6,94
5,45
6
Capi
tal w
ork i
n pr
ogre
ss
168,
631,9
62
416,
396,
248
(585
,028
,210
) -
- -
- -
-
176,
839,
206
1,001
,416
,654
(5
85,13
4,97
2)
593,
120,
888
16,8
04
86,17
0,77
9 (1
2,15
1)
86,17
5,43
2 50
6,94
5,45
6
2011
4 Pr
oper
ty, p
lant
and
equ
ipm
ent,
net As
at
1 Jan
uary
2011
Taka
Addi
tion
durin
g th
e ye
arTa
ka
Dis
posa
l/Ad
just
men
tdu
ring
the
year
Taka
As a
t31
Dec
embe
r20
11Ta
ka
As a
t1 J
anua
ry20
11Ta
ka
Char
ged
durin
g th
e ye
arTa
ka
Dis
posa
l/Ad
just
men
tdu
ring
the
year
Taka
As a
t31
Dec
embe
r20
11Ta
ka
As
at
31 D
ecem
ber
2011
Tak
a
Carr
ying
am
ount
Dep
reci
atio
nCo
st
Nam
e of
ass
ets
Com
pute
r and
oth
er IT
equi
pmen
t (No
te 4
.1)
- 8,
207,
244
- 8,
207,
244
- 16
,804
-
16,8
04
8,19
0,44
0
- 8,
207,
244
- 8,
207,
244
- 16
,804
-
16,8
04
8,19
0,44
0
Capi
tal w
ork i
n pr
ogre
ss
- 17
6,83
9,20
6 (8
,207
,244
) 16
8,63
1,962
-
- -
- 16
8,63
1,962
- 18
5,04
6,45
0 (8
,207
,244
) 17
6,83
9,20
6 -
16,8
04
- 16
,804
17
6,82
2,40
2
2010
As a
t28
Janu
ary
2010
Taka
Addi
tion
durin
g th
e ye
arTa
ka
Dis
posa
l/Ad
just
men
tdu
ring
the
year
Taka
As a
t31
Dec
embe
r20
10Ta
ka
As a
t1 J
anua
ry20
10Ta
ka
Char
ged
durin
g th
e ye
arTa
ka
Dis
posa
l/Ad
just
men
tdu
ring
the
year
Taka
As a
t31
Dec
embe
r20
10Ta
ka
As
at
31 D
ecem
ber
2010
Tak
a
Carr
ying
am
ount
Dep
reci
atio
nCo
st
Nam
e of
ass
ets
GPI
T -
Not
es to
the
Fina
ncia
l Sta
tem
ents
142/143Annual Report 2011
Softw
are
- 29
,455
,042
-
29,4
55,0
42
- 1,3
70,0
45
- 1,3
70,0
45
28,0
84,9
97
Capi
tal w
ork i
n pr
ogre
ss
- 29
,455
,042
(2
9,45
5,04
2)
- -
- -
- -
- 58
,910
,084
(2
9,45
5,04
2)
29,4
55,0
42
- 1,3
70,0
45
- 1,3
70,0
45
28,0
84,9
97
As a
t1 J
anua
ry20
11Ta
ka
Addi
tion
durin
g th
e ye
arTa
ka
Dis
posa
l/Ad
just
men
tdu
ring
the
year
Taka
As a
t31
Dec
embe
r20
11Ta
ka
As a
t1 J
anua
ry20
11Ta
ka
Char
ged
durin
g th
e ye
arTa
ka
Dis
posa
l/Ad
just
men
tdu
ring
the
year
Taka
As a
t31
Dec
embe
r20
11Ta
ka
As
at
31 D
ecem
ber
2011
Tak
a
Carr
ying
am
ount
Dep
reci
atio
nCo
st
Nam
e of
ass
ets
4.1
Com
pute
r and
oth
er IT
equ
ipm
ent i
nclu
de la
ptop
s, n
oteb
ooks
, sca
nner
s, U
PS, N
etw
ork
Equi
pmen
t and
oth
er IT
rela
ted
acce
ssor
ies.
4.2
Allo
catio
n of
dep
reci
atio
n ch
arge
d du
ring
the
year
2011
20
10
Ta
ka
Taka
Co
st o
f ser
vice
s re
nder
ed (N
ote
20)
74,3
11,8
49
16,8
04
G
ener
al a
nd a
dmin
istr
ativ
e ex
pens
es (N
ote
21)
11,8
58,9
30
-
86
,170
,779
16
,80
4
5 In
tang
ible
ass
ets,
net
GPI
T -
Not
es to
the
Fina
ncia
l Sta
tem
ents
2011Taka
2010Taka
2011Taka
2010Taka
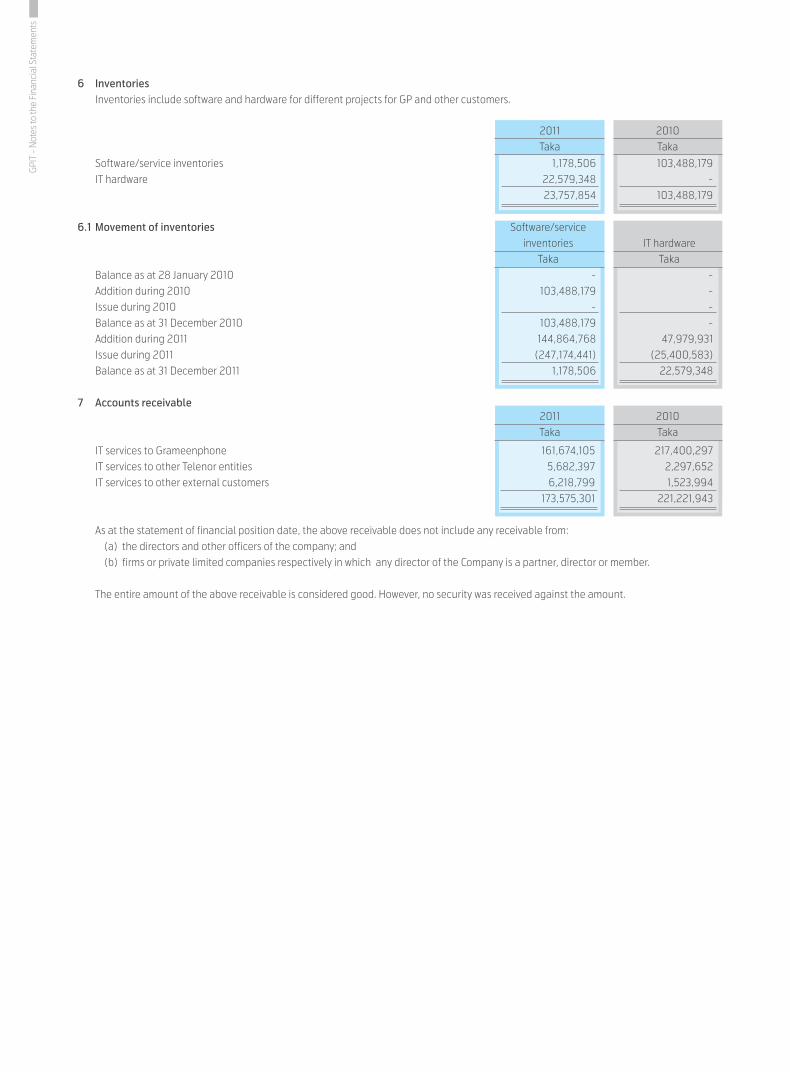
6 Inventories Inventories include software and hardware for different projects for GP and other customers.
Software/service inventories 1,178,506 103,488,179 IT hardware 22,579,348 - 23,757,854 103,488,179
6.1 Movement of inventories Software/service inventories IT hardware Taka Taka Balance as at 28 January 2010 - - Addition during 2010 103,488,179 - Issue during 2010 - - Balance as at 31 December 2010 103,488,179 - Addition during 2011 144,864,768 47,979,931 Issue during 2011 (247,174,441) (25,400,583) Balance as at 31 December 2011 1,178,506 22,579,348
7 Accounts receivable IT services to Grameenphone 161,674,105 217,400,297 IT services to other Telenor entities 5,682,397 2,297,652 IT services to other external customers 6,218,799 1,523,994 173,575,301 221,221,943
As at the statement of financial position date, the above receivable does not include any receivable from: (a) the directors and other officers of the company; and (b) firms or private limited companies respectively in which any director of the Company is a partner, director or member.
The entire amount of the above receivable is considered good. However, no security was received against the amount.
GPI
T -
Not
es to
the
Fina
ncia
l Sta
tem
ents

144/145Annual Report 2011
2011Taka
2010Taka
8 Advances, deposits and prepayments
Advances Advance to employees (Note 8.1) 3,295,716 9,048,385
Deposits Deposit for bank guarantee 2,700,000 - Security deposits 4,031,408 - 6,731,408 -
Prepayments Group insurance premium 4,955,131 3,631,615 Software implementation support fees (Note 8.2) - 21,243,620 Service maintenance fees 19,070,120 153,155 24,025,251 25,028,390 34,052,375 34,076,775
8.1 Advance to employees Advance to employees represents advances made to employees for foreign travel, training, meeting, workshop, presentation etc in. No
advances were made to the shareholder directors during the year.
8.2 Software implementation support fees This represents the amount paid in advance to Oracle Corporation Singapore Pte. Ltd. as fees for implementation support services.
9 Advance VAT/VAT liability This represents balance of VAT current account maintained with NBR.
10 Other receivables Other receivables include receivable for reimbursable expenses from Telenor Consult AS, Grameenphone and others.
11 Cash and cash equivalents Cash in hand - 39,742 Cash at bank 426,423,498 256,532,984 426,423,498 256,572,726
As at the reporting date the company did not have any restriction on its cash balances.
GPI
T -
Not
es to
the
Fina
ncia
l Sta
tem
ents
2011Taka
2010Taka
2011Taka
2010Taka
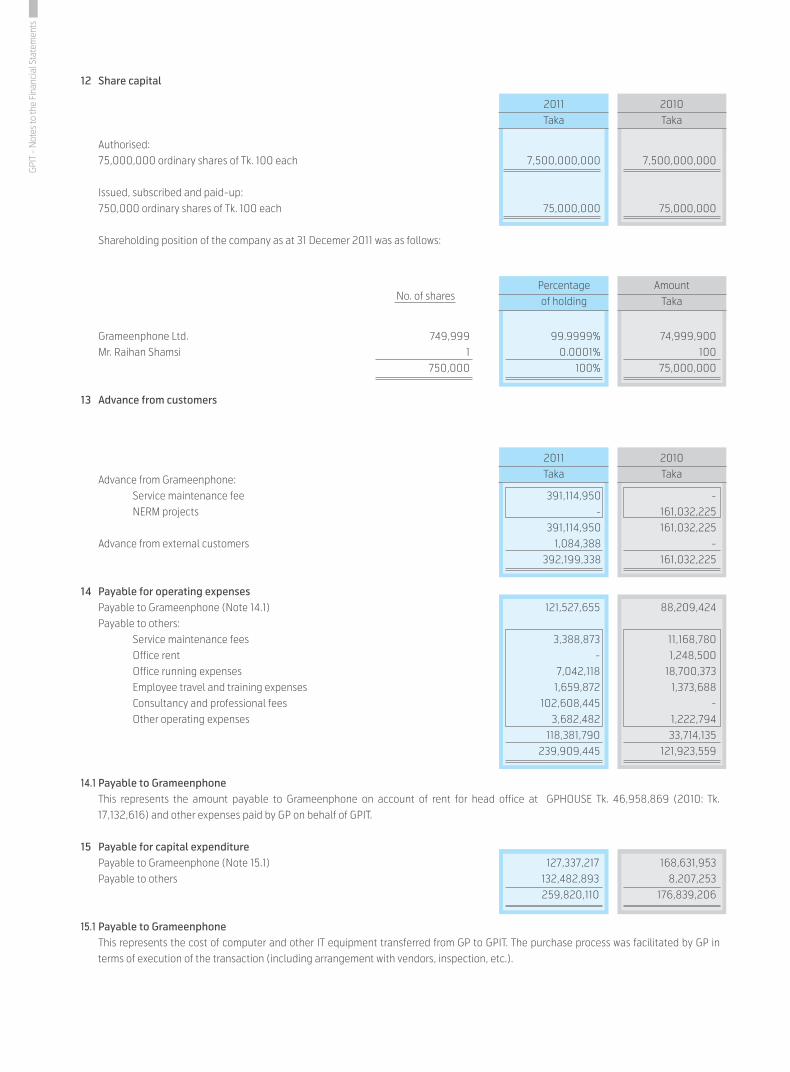
12 Share capital
Authorised: 75,000,000 ordinary shares of Tk. 100 each 7,500,000,000 7,500,000,000
Issued, subscribed and paid-up: 750,000 ordinary shares of Tk. 100 each 75,000,000 75,000,000
Shareholding position of the company as at 31 Decemer 2011 was as follows:
Grameenphone Ltd. 749,999 99.9999% 74,999,900 Mr. Raihan Shamsi 1 0.0001% 100 750,000 100% 75,000,000
13 Advance from customers
Advance from Grameenphone: Service maintenance fee 391,114,950 - NERM projects - 161,032,225 391,114,950 161,032,225 Advance from external customers 1,084,388 - 392,199,338 161,032,225
14 Payable for operating expenses Payable to Grameenphone (Note 14.1) 121,527,655 88,209,424 Payable to others: Service maintenance fees 3,388,873 11,168,780 Office rent - 1,248,500 Office running expenses 7,042,118 18,700,373 Employee travel and training expenses 1,659,872 1,373,688 Consultancy and professional fees 102,608,445 - Other operating expenses 3,682,482 1,222,794 118,381,790 33,714,135 239,909,445 121,923,559
14.1 Payable to Grameenphone This represents the amount payable to Grameenphone on account of rent for head office at GPHOUSE Tk. 46,958,869 (2010: Tk.
17,132,616) and other expenses paid by GP on behalf of GPIT.
15 Payable for capital expenditure Payable to Grameenphone (Note 15.1) 127,337,217 168,631,953 Payable to others 132,482,893 8,207,253 259,820,110 176,839,206
15.1 Payable to Grameenphone This represents the cost of computer and other IT equipment transferred from GP to GPIT. The purchase process was facilitated by GP in
terms of execution of the transaction (including arrangement with vendors, inspection, etc.).
Amount Taka
Percentage of holding No. of shares
GPI
T -
Not
es to
the
Fina
ncia
l Sta
tem
ents
146/147Annual Report 2011
2011Taka
2010Taka
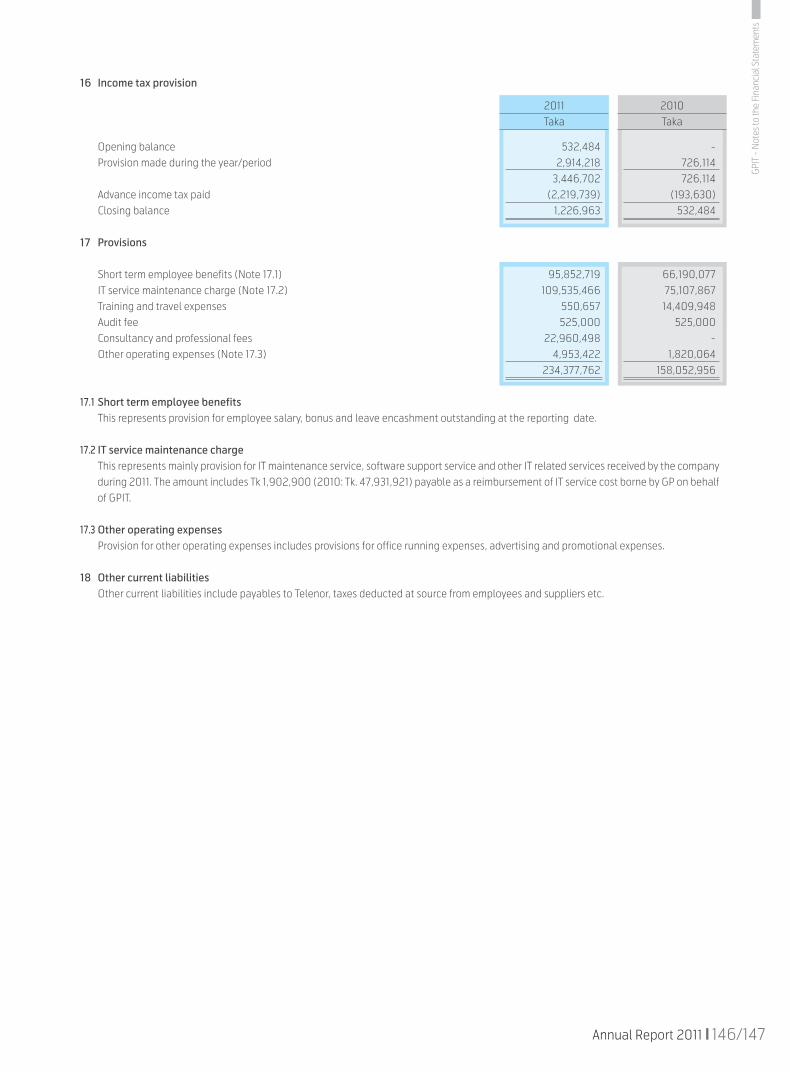
16 Income tax provision
Opening balance 532,484 - Provision made during the year/period 2,914,218 726,114 3,446,702 726,114 Advance income tax paid (2,219,739) (193,630) Closing balance 1,226,963 532,484
17 Provisions
Short term employee benefits (Note 17.1) 95,852,719 66,190,077 IT service maintenance charge (Note 17.2) 109,535,466 75,107,867 Training and travel expenses 550,657 14,409,948 Audit fee 525,000 525,000 Consultancy and professional fees 22,960,498 - Other operating expenses (Note 17.3) 4,953,422 1,820,064 234,377,762 158,052,956
17.1 Short term employee benefits This represents provision for employee salary, bonus and leave encashment outstanding at the reporting date.
17.2 IT service maintenance charge This represents mainly provision for IT maintenance service, software support service and other IT related services received by the company
during 2011. The amount includes Tk 1,902,900 (2010: Tk. 47,931,921) payable as a reimbursement of IT service cost borne by GP on behalf of GPIT.
17.3 Other operating expenses Provision for other operating expenses includes provisions for office running expenses, advertising and promotional expenses.
18 Other current liabilities Other current liabilities include payables to Telenor, taxes deducted at source from employees and suppliers etc.
GPI
T -
Not
es to
the
Fina
ncia
l Sta
tem
ents
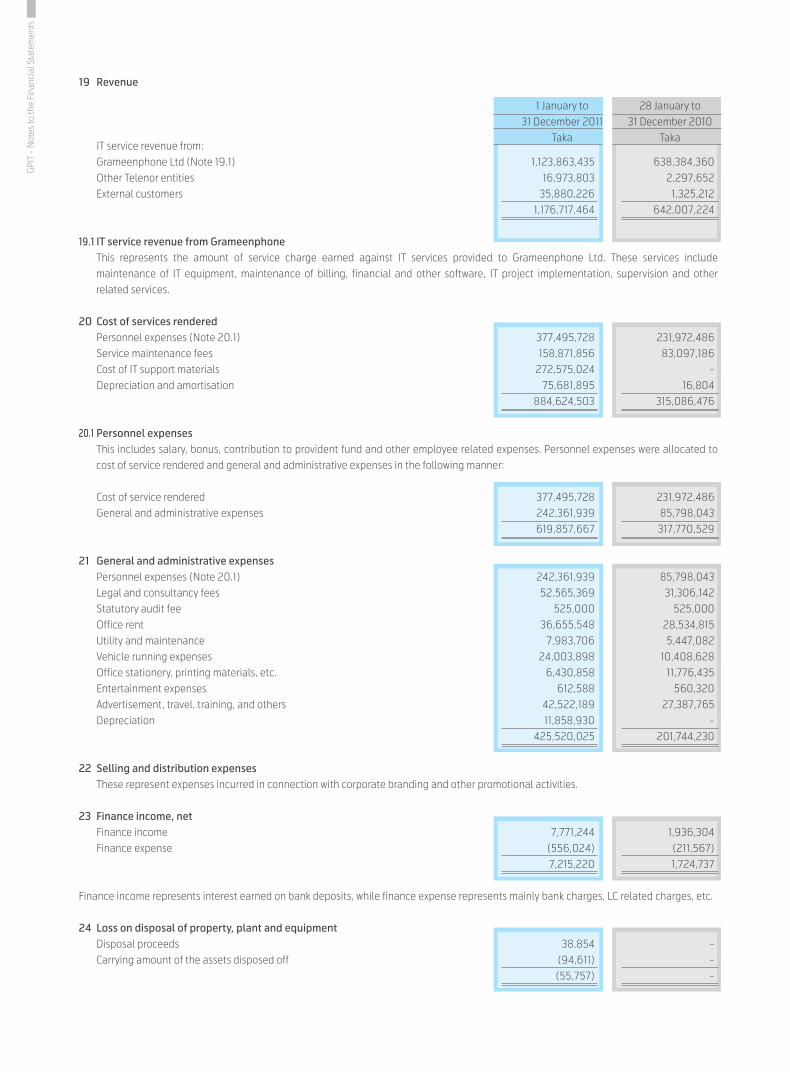
19 Revenue
IT service revenue from: Grameenphone Ltd (Note 19.1) 1,123,863,435 638,384,360 Other Telenor entities 16,973,803 2,297,652 External customers 35,880,226 1,325,212 1,176,717,464 642,007,224
19.1 IT service revenue from Grameenphone This represents the amount of service charge earned against IT services provided to Grameenphone Ltd. These services include
maintenance of IT equipment, maintenance of billing, financial and other software, IT project implementation, supervision and other related services.
20 Cost of services rendered Personnel expenses (Note 20.1) 377,495,728 231,972,486 Service maintenance fees 158,871,856 83,097,186 Cost of IT support materials 272,575,024 - Depreciation and amortisation 75,681,895 16,804 884,624,503 315,086,476
20.1 Personnel expenses This includes salary, bonus, contribution to provident fund and other employee related expenses. Personnel expenses were allocated to
cost of service rendered and general and administrative expenses in the following manner:
Cost of service rendered 377,495,728 231,972,486 General and administrative expenses 242,361,939 85,798,043 619,857,667 317,770,529
21 General and administrative expenses Personnel expenses (Note 20.1) 242,361,939 85,798,043 Legal and consultancy fees 52,565,369 31,306,142 Statutory audit fee 525,000 525,000 Office rent 36,655,548 28,534,815 Utility and maintenance 7,983,706 5,447,082 Vehicle running expenses 24,003,898 10,408,628 Office stationery, printing materials, etc. 6,430,858 11,776,435 Entertainment expenses 612,588 560,320 Advertisement, travel, training, and others 42,522,189 27,387,765 Depreciation 11,858,930 - 425,520,025 201,744,230
22 Selling and distribution expenses These represent expenses incurred in connection with corporate branding and other promotional activities.
23 Finance income, net Finance income 7,771,244 1,936,304 Finance expense (556,024) (211,567) 7,215,220 1,724,737
Finance income represents interest earned on bank deposits, while finance expense represents mainly bank charges, LC related charges, etc.
24 Loss on disposal of property, plant and equipment Disposal proceeds 38,854 - Carrying amount of the assets disposed off (94,611) - (55,757) -
28 January to 31 December 2010
Taka
1 January to 31 December 2011
Taka
GPI
T -
Not
es to
the
Fina
ncia
l Sta
tem
ents
148/149Annual Report 2011
2011Taka
2010Taka
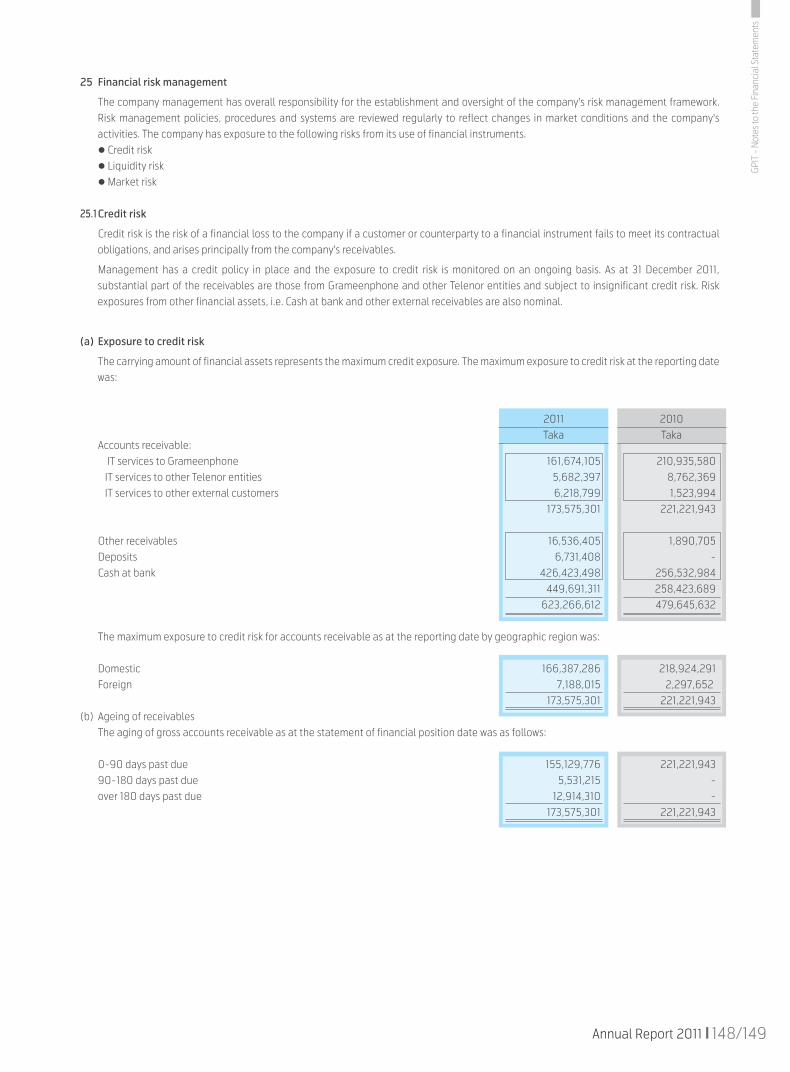
25 Financial risk management
The company management has overall responsibility for the establishment and oversight of the company's risk management framework. Risk management policies, procedures and systems are reviewed regularly to reflect changes in market conditions and the company's activities. The company has exposure to the following risks from its use of financial instruments.
Credit risk Liquidity risk Market risk
25.1 Credit risk
Credit risk is the risk of a financial loss to the company if a customer or counterparty to a financial instrument fails to meet its contractual obligations, and arises principally from the company's receivables.
Management has a credit policy in place and the exposure to credit risk is monitored on an ongoing basis. As at 31 December 2011, substantial part of the receivables are those from Grameenphone and other Telenor entities and subject to insignificant credit risk. Risk exposures from other financial assets, i.e. Cash at bank and other external receivables are also nominal.
(a) Exposure to credit risk
The carrying amount of financial assets represents the maximum credit exposure. The maximum exposure to credit risk at the reporting date was:
Accounts receivable: IT services to Grameenphone 161,674,105 210,935,580 IT services to other Telenor entities 5,682,397 8,762,369 IT services to other external customers 6,218,799 1,523,994 173,575,301 221,221,943
Other receivables 16,536,405 1,890,705 Deposits 6,731,408 - Cash at bank 426,423,498 256,532,984 449,691,311 258,423,689 623,266,612 479,645,632
The maximum exposure to credit risk for accounts receivable as at the reporting date by geographic region was:
Domestic 166,387,286 218,924,291 Foreign 7,188,015 2,297,652 173,575,301 221,221,943(b) Ageing of receivables The aging of gross accounts receivable as at the statement of financial position date was as follows:
0-90 days past due 155,129,776 221,221,943 90-180 days past due 5,531,215 - over 180 days past due 12,914,310 - 173,575,301 221,221,943
GPI
T -
Not
es to
the
Fina
ncia
l Sta
tem
ents
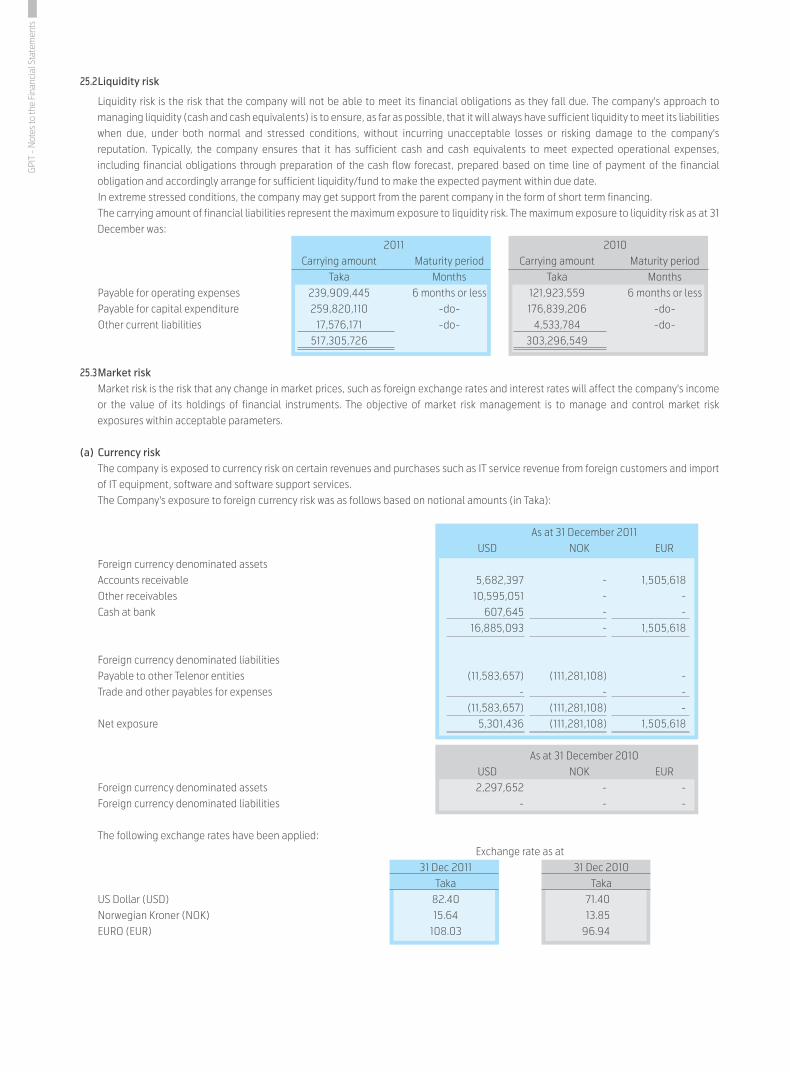
25.2 Liquidity risk
Liquidity risk is the risk that the company will not be able to meet its financial obligations as they fall due. The company's approach to managing liquidity (cash and cash equivalents) is to ensure, as far as possible, that it will always have sufficient liquidity to meet its liabilities when due, under both normal and stressed conditions, without incurring unacceptable losses or risking damage to the company's reputation. Typically, the company ensures that it has sufficient cash and cash equivalents to meet expected operational expenses, including financial obligations through preparation of the cash flow forecast, prepared based on time line of payment of the financial obligation and accordingly arrange for sufficient liquidity/fund to make the expected payment within due date.
In extreme stressed conditions, the company may get support from the parent company in the form of short term financing. The carrying amount of financial liabilities represent the maximum exposure to liquidity risk. The maximum exposure to liquidity risk as at 31
December was: 2011 2010 Carrying amount Maturity period Carrying amount Maturity period Taka Months Taka Months Payable for operating expenses 239,909,445 6 months or less 121,923,559 6 months or less Payable for capital expenditure 259,820,110 -do- 176,839,206 -do- Other current liabilities 17,576,171 -do- 4,533,784 -do- 517,305,726 303,296,549
25.3 Market risk Market risk is the risk that any change in market prices, such as foreign exchange rates and interest rates will affect the company's income
or the value of its holdings of financial instruments. The objective of market risk management is to manage and control market risk exposures within acceptable parameters.
(a) Currency risk The company is exposed to currency risk on certain revenues and purchases such as IT service revenue from foreign customers and import
of IT equipment, software and software support services. The Company's exposure to foreign currency risk was as follows based on notional amounts (in Taka):
As at 31 December 2011 USD NOK EUR Foreign currency denominated assets Accounts receivable 5,682,397 - 1,505,618 Other receivables 10,595,051 - - Cash at bank 607,645 - - 16,885,093 - 1,505,618
Foreign currency denominated liabilities Payable to other Telenor entities (11,583,657) (111,281,108) - Trade and other payables for expenses - - - (11,583,657) (111,281,108) - Net exposure 5,301,436 (111,281,108) 1,505,618
As at 31 December 2010 USD NOK EUR Foreign currency denominated assets 2,297,652 - - Foreign currency denominated liabilities - - -
The following exchange rates have been applied: Exchange rate as at 31 Dec 2011 31 Dec 2010 Taka Taka US Dollar (USD) 82.40 71.40 Norwegian Kroner (NOK) 15.64 13.85 EURO (EUR) 108.03 96.94
GPI
T -
Not
es to
the
Fina
ncia
l Sta
tem
ents

150/151Annual Report 2011
2011Taka
2010Taka
Currency risk (Contd…)
Foreign exchange rate sensitivity analysis-
An increase/(decrease) of 10 basis points in exchange rates would have increased/(decreased) equity and profit or loss by the amounts shown below. This analysis assumes that all other variables, in particular interest rates remain constant.
Profit or loss Equity
10 bp increase 10 bp decrease 10 bp increase 10 bp decrease
2011 Taka Taka Taka Taka
Expenditures denominated in:
USD 5,301 (5,301) 5,301 (5,301)
NOK (111,281) 111,281 (111,281) 111,281
EURO 1,506 (1,506) 1,506 (1,506)
(104,474) 104,474 (104,474) 104,474
2010
Expenditures denominated in:
USD (115,123) 115,123 (115,123) 115,123
NOK - - - -
EURO - - - -
(115,123) 115,123 (115,123) 115,123
(b) Interest rate risk
The only interest bearing financial instrument for the company is the short notice deposit (SND) account maintained by the company with its banks. Historically, interest rates for such instruments show little fluctuation. Interest rate risk for the company is therefore insignificant.
26 Related party disclosures
During the period, the company entered into a number of transactions with related parties in the normal course of business. The names of the related parties and nature of these transactions have been set out below in accordance with the provisions of BAS 24: Related Party Disclosures.
Related party transactions during the year/period
Name of related parties and nature of relationship Nature of transaction
Grameenphone Ltd. Revenue from IT services 856,328,939 633,428,614
(parent company) Sale of software 267,534,496 -
Office rent 29,826,253 17,132,616
Telenor Broadcast Holding AS Revenue from IT service 6,068,558 2,297,652
Telenor Serbia Revenue from IT service 9,327,210 -
Telenor Start II AS Cell Bazaar revenue sharing 1,578,035 665,746
Telenor Consult AS Consultancy expenses 102,740,233 -
GPI
T -
Not
es to
the
Fina
ncia
l Sta
tem
ents

2011Taka
2010Taka
2011Taka
2010Taka
Related party disclosures (Contd...)
Receivable from/(payable to) related parties
Name of related parties and nature of relationship Nature of transaction
Grameenphone Ltd. Receivable for IT services 161,674,105 210,935,580
(parent company) Receivable for reimbursable expenses 3,999,110 -
Advance received (391,114,950) (161,032,225)
Liabilities for operating expenses (76,471,686) (71,076,808)
Office rent payable (46,958,869) (17,132,616)
Payable for capital expenditure (127,337,217) (168,631,953)
Telenor Broadcast Holding AS Receivable for IT services - 2,297,652
Other payables (824,000) -
Telenor Start II AS Receivable for cell Bazaar revenue sharing 1,942,244 -
Payable for cell Bazaar revenue sharing (710,395) (665,746)
Telenor Serbia Receivable for IT services 5,581,187 -
Telenor ASA Receivable for IT services 101,210 -
Telenor Consult AS Payable for consultancy (102,605,001) -
Other receivable 10,595,051 -
26.1 Key management personnel compensation
Short-term employee benefits (salary and other allowances) 124,667,722 113,146,296
Post employment benefits (provident fund, gratuity, etc.) 15,981,060 8,060,965
Other long-term benefits 2,096,025 3,566,944
142,744,807 124,774,205
Key management personnel includes employees of the rank of Deputy General Manager (DGM), DGM equivalent and above.
27 (Expenses)/(expenditures) and revenue in foreign currency during the year/period
CIF value of imports:
Capital inventory (4,293,661) (96,164,211)
Other operating inventory (54,657,367) (21,243,620)
Consultancy expenses (132,387,597) -
IT service revenue 19,092,656 2,297,652
28 Capital commitments
As at 31 December 2011, Grameenphone IT Ltd had a capital commitment of Tk. 364,502,196 (2010: Tk 64,514,024) for purchase of IT equipment, installation of such equipment and other implementation services.
29 Other disclosures
29.1 As at 31 December 2011, number of regular employees receiving remuneration of Tk. 36,000 or above per annum was 386 (2010: 356).
29.2 Events after the reporting period
There was no event after the reporting period that requires either disclosure of or adjustment to these financial statements.
GPI
T -
Not
es to
the
Fina
ncia
l Sta
tem
ents