grains eu sugarmarketunsettled afterthe end of quotas · grains ¨ strategie-grains.com oct-sept...
TRANSCRIPT

stratégiegrains®
strategie-grains.com
EU sugar market unsettledafter the end of quotas
October 25, 2018

stratégiegrains®
strategie-grains.com
100
200
300
400
500
600
700
800
900
1000
1100
Oct -06
May-07
Dec-07
Jul-08
Feb-09
Sep-09Apr-10
Nov-10
Jun-11
Jan-12
Aug -12
Mar-13
Oct -13
May-14
Dec-14
Jul-15
Feb-16
Sep-16Apr-17
Nov-17
Jun-18
RAW SUGAR
WHITE SUGAR
EU QUOTA SUGAR
EU NON QUOTA SUGAR
EU SUGAR
European prices have been collapsing for more than a year, reaching historical lows
25/10/2018 Sugar Outlook 2
§ -17% betweenOct 2017 and Aug 2018
§ Raw sugar pricedown 24% between Oct17 and Sept18
§White sugardown 12%
$/t

stratégiegrains®
strategie-grains.com
In a very heavy global market
§ Large production increases in 2017/18 in many regions of the world
§ Big increase in world stocks
§Decreasing Brazilian real value
25/10/2018 Sugar Outlook 3
-280
102454446 4677
20513
Brazil
India
EU Thailand
World
Changes in 2017/18 production compared to 2016/17 (kt raw eq.)
Dollar vs. Real value
3,13
4,19

stratégiegrains®
strategie-grains.com
European sugar beet production down in 2018/19 despite stable growing area
§ Beet roots suffered fromlate plantings and dry summer weather
25/10/2018 Sugar Outlook 4
Changes in sugar beet production between 2017 and 2018
111.7140.5
125.6
2016/17 2017/18 2018/19
EU sugar beet crop (Mt)

stratégiegrains®
strategie-grains.com
Sugar production to decrease by more than 2 Mt to 19 Mt
§ Sugar campaign started with some delay and should be shorter than last year
25/10/2018 Sugar Outlook 5
Main changes in 2018 sugar production compared to 2017 (Mt white eq.)
-950 -848
-223 -180 -177 -151
170
-2244
Fran
ce
Ger
man
y
Belg
ium
Aust
ria
Net
herla
nds
Czec
h Re
p.
Italy
Tota
l EU

stratégiegrains®
strategie-grains.com
Contrary to expectations, isoglucose production is decreasing§ Low sugar prices and higher
grain prices => isoglucose isnot competitive
§Despite the opening of a new plant in Hungary
§ 2018/19 isoglucose production close to 2017/18
25/10/2018 Sugar Outlook 6
EU production of isoglucose (kt)
780
600 600
2016/17 2017/18 2018/19

stratégiegrains®
strategie-grains.com
Domestic market more attractive thanexports§Downward trend for per
capita sugar intake but less competition thananticipated from othersweeteners
§ Industrial demand down with availabilities
§ Attractive ethanol outlet
25/10/2018 Sugar Outlook 7
31,530,9 30,7
2016/17 2017/18 2018/19
EU per capita sugar consumption (kg/year)
-75-175
156
-94
food industrial bioethanol total
Changes in 2018/19 EU sugar consumptioncompared to 2017/18 (kt white eq.)

stratégiegrains®
strategie-grains.com
EU exports forecast down, imports stable
25/10/2018 Sugar Outlook 8
14%
34%
22%
17%
10%
3%North Africa
Near andMiddle EastOther Africa
Europe outsideEUAsiancountriesOthercountries
§Countries around the Mediterranean should remain the main market for EU sugar
1607
3640
1587
2619
0500
1000150020002500300035004000
imports exports
EU imports and exports (kt white eq.)
2017/18 2018/19

stratégiegrains®
strategie-grains.com
12 %
14 %
16 %
18 %
20 %
22 %
24 %
26 %
28 %
30 %
32 %
20 0
25 0
30 0
35 0
40 0
45 0
50 0
55 0
60 0
65 0
2009/10
2010/11
2011/12
2012/13
2013/14
2014/15
2015/16
2016/17
2017/18
2018/19
raw sugar average price ($/t)stocks/ use (%)
World stocks to remain high in 2018/19
§ 2018/19 production forecastto decrease to a level close to consumption
25/10/2018 Sugar Outlook 9
9
§ Average raw sugar priceexpected close to 290 $/t
§White sugar price close to 370-380 $/t
-8270
1808
-2315 -930
-9421
Braz
il
Indi
a
EU Thai
land
Wor
ld
Changes in 2018/19 production compared to 2017/18 (kt raw eq.)

stratégiegrains®
strategie-grains.com
Oct-Sept 2017/18 2018/19carry-in stock 2.1 2.6production 21.1 18.9imports 1.6 1.6consumption 18.7 18.5exports 3.6 2.6carry-out stock 2.6 2.0stock/use ratio 11.7% 9.5%
Fragile EU balance sheet should maintain a premium for EU sugar
25/10/2018 Sugar Outlook
EU balance sheet (Mt white eq.) § World prices should continue to weight on European prices
§ EU premium maintained around50 €/t
§ 2018/19 average EU pricedecreasing to 360-370 €/t (376 €/t on average for Oct17-Aug18)
10
stratégiegrains®
strategie-grains.com
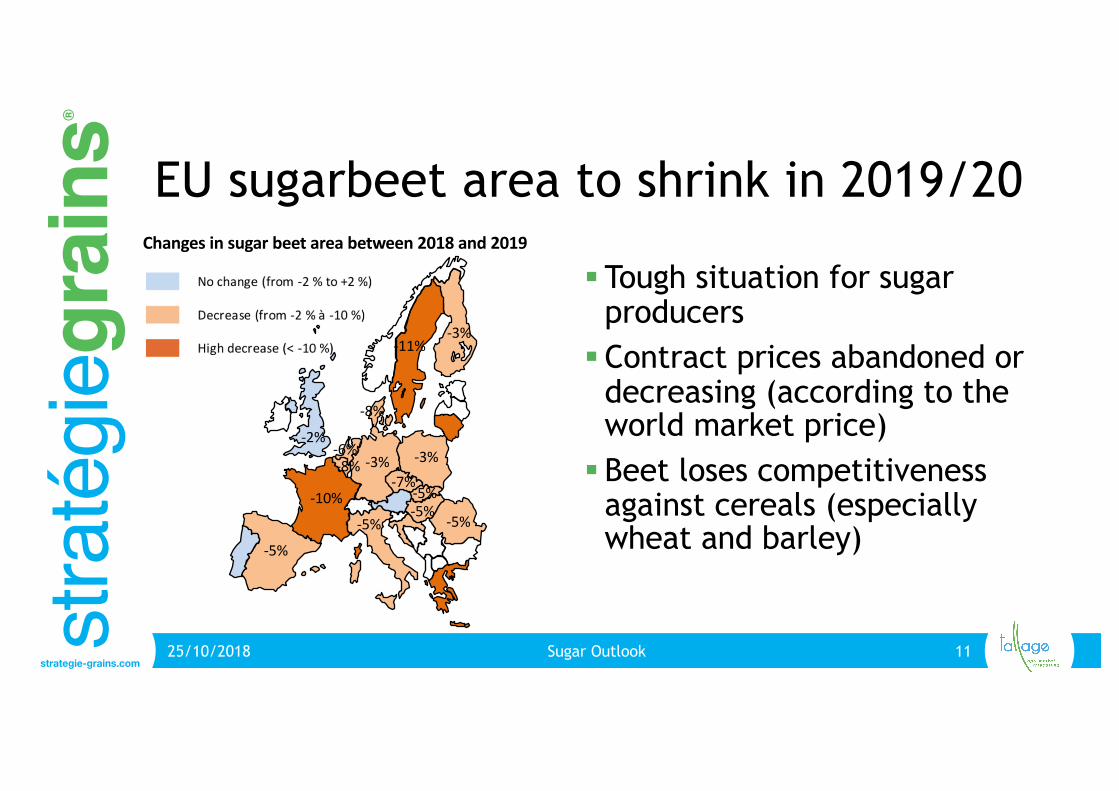
EU sugarbeet area to shrink in 2019/20
§ Tough situation for sugarproducers
§Contract prices abandoned or decreasing (according to the world market price)
§ Beet loses competitivenessagainst cereals (especiallywheat and barley)
25/10/2018 Sugar Outlook 11
Changes in sugar beet area between 2018 and 2019
-10%
-11%
-3% -3%-2%
-6%
-7%-8%
-8%
-5%
-5%-5%-5%-5%
-3%

stratégiegrains®
strategie-grains.com
First prospects for 2019/20 beet and sugar production
§ Lower area does not necessarily mean lowerproduction
§ Sugar production between17,5 Mt and 20,5 Mt
25/10/2018 Sugar Outlook 12
118
141
126 125
138
105
110
115
120
125
130
135
140
145
2017/18 2018/19 2019/20
EU sugar beet production (Mt)
Low yield = 2018
Average yield = 5-year average
Good yield = 5% above trend

stratégiegrains®
strategie-grains.com
Thank you for your attention
Any questions?
• Sugar analyst: Madeleine Breguet• Crop analysts (EU/Black Sea): Benoit Fayaud, Jean-Sébastien Jacquet, Laurine Simon
13