graduate school of decision sciences
TRANSCRIPT

Graduate School of Decision Sciences All processes within our society are based on decisions – whether they are individual or collective decisions. Understanding how these decisions are made will provide the tools with which we can address the root causes of social science issues. The GSDS offers an open and communicative academic environment for doctoral researchers who deal with issues of decision making and their application to important social science problems. It combines the perspectives of the various social science disciplines for a comprehensive understanding of human decision behavior and its economic and political consequences. The GSDS primarily focuses on economics, political science and psychology, but also encompasses the complementary disciplines computer science, sociology and statistics. The GSDS is structured around four interdisciplinary research areas: (A) Behavioural Decision Making, (B) Intertemporal Choice and Markets, (C) Political Decisions and Institutions and (D) Information Processing and Statistical Analysis. GSDS – Graduate School of Decision Sciences University of Konstanz Box 146 78457 Konstanz Phone: +49 (0)7531 88 3633 Fax: +49 (0)7531 88 5193 E-mail: [email protected] -gsds.uni-konstanz.de ISSN: 2365-4120 March 2016
© 2016 by the author(s)

1
Revisiting the Oil Curse: Does Ownership Matter?
Arpita Khanna
University of Konstanz
Abstract
A large body of scholarship finds a negative relationship between oil abundance and economic
growth. The existing empirical evidence on the oil curse, however, does not account for
variations in the ownership of oil. This article investigates whether the effect of oil abundance on
growth varies with ownership structures. It also investigates whether institutional quality
influences the effect of different ownership structures. Using a novel database on ownership
structures and employing a panel fixed-effects estimation method, it analyzes a sample of 20
oil-exporting developing countries during the period 1984-2005. The results show that different
ownership structures have differential effects on growth, and that their effect is influenced by the
quality of institutions. State ownership and control reduces growth when the institutional quality
is poor, but increases growth when the institutional quality is good. Private ownership, on the
other hand, increases growth when the institutional quality is poor, but reduces growth when the
institutional quality is good. The results contrast the existing knowledge that institutional quality
alone is decisive for the resource curse; the results show that the choice of ownership structure
in the oil sector plays an important role in determining whether oil-exporting countries benefit
from their oil wealth or suffer from the curse. The policy advice in this article is: retain state
ownership and control if the institutions are strong, if the institutions are weak, transfer
ownership to foreign oil companies.
Key words: oil curse, ownership, economic growth, institutional quality.

2
1. Introduction
One important finding in the development literature is the presence of a negative relationship
between resource abundance and economic growth. This paradoxical relationship has received
significant attention from both policymakers and academicians over the past few decades. While
the focus was initially on resource-rich countries in general, attention started shifting in the
1970s and 1980s to oil-exporting countries in the developing world. Oil-exporting countries
received unprecedented windfall profits during the oil booms of the 1970s which led to high
expectations about their future growth prospects. Yet, they grew more slowly than their oil-poor
counterparts. Some of the countries even witnessed a decrease in their per capita income.
Between 1980 and 2006, for instance, per capita income decreased by 85% in Iraq, 45% in
Gabon, and 6% in Venezuela (Ross 2012:1).
The disappointing economic performance of oil-exporting countries has given rise to the
contention that oil abundance is detrimental to growth and development. Oil abundance is, in
fact, considered most detrimental as compared to the abundance of other types of resources.
Few scholars, however, claim that oil abundance is not responsible for poor economic growth;
rather, it is the presence of state ownership in the oil sector which causes adverse economic
effects (e.g. Ross 1999, 2012; Quinn and Conway 2008). This claim, however, has not been
validated through a quantitative analysis of a large set of oil-dependent countries. Most studies
on the oil curse overlook ownership that is, the right to explore and produce resources as an
explanatory variable (e.g., Karl 1997, Gelb et al 1998). The studies which focus on natural
resources in general and question the assumption that resource abundance, by itself, is an
economic curse also neglect the issue of ownership (e.g., Mehlum et al 2006a, b); they
investigate only the role of institutions and claim that institutions are decisive for the resource
curse that is, countries with strong institutions benefit from their resource wealth, while
countries with weak institutions suffer from the curse.

3
This article addresses the following questions: Is state ownership really responsible for the
worse effect of oil abundance on economic growth? Does a shift away from state ownership
leads to better growth outcomes? State leaders of many oil-exporting countries such as
Cameroon, Republic of the Congo, and Yemen have transferred ownership to private oil
companies (particularly foreign oil companies)1. Private ownership is expected to become more
common in the coming years, as new developments in oil extraction (for instance, deep water
offshore drilling) require complex technologies and large investments which are more
forthcoming from private oil companies. Also, many new oil deposits are increasingly being
discovered in poor states (see Ross 2012: 8-9), which do not have the financial and technical
capacity to develop oil fields. There is currently no systematic knowledge on how private
ownership in the oil sector affects economic growth. The existing knowledge is limited to the
effect of private versus state ownership on firm-level efficiency and profitability indicators (e.g.
Megginson et al 1994; Victor 2007; Wolf 2008).
The variations in oil-development strategies are, however, not limited to only state and
private ownership; there are variations even within state ownership. Jones Luong and Weinthal
(2010) find that state leaders, while assuming their ownership, do not always retain control over
oil operations and management. There are many oil-exporting countries including Angola,
Brunei, United Arab Emirates, and Qatar in which the state has transferred control to foreign
oil companies, usually through production sharing contracts2. In fact, over the past few decades,
state ownership without control has become more common than state ownership with control.
Scholars who claim that state ownership is responsible for lower economic growth of oil-
exporting countries, however, do not account for variations within state ownership. This raises
the question whether transfer of control to foreign oil companies leads to a differential effect of
state ownership on economic growth.
4
I use pooled time-series cross-national data of 20 oil-exporting countries between 1984 and
2005 to investigate whether the effect of oil abundance on economic growth differs across the
three ownership structures – that is, state ownership with control, state ownership without
control, and private ownership. I also investigate whether institutional quality – which has been
found to play a decisive role in resource-rich countries – influences the growth effect of different
ownership structures. The empirical analysis is based on a novel database on ownership
structures developed by Jones Luong and Weinthal (2010), and uses a fixed-effects panel
estimation method.
The overall results show that different ownership structures have differential effects on
growth, and that their effect is influenced by the quality of institutions. The key findings are
summarized as follows: First, state ownership affects growth only when the state retains
operational and management control; when the state transfers control to foreign oil companies,
state ownership has no significant effect on growth. Second, state ownership with control
reduces growth when the institutional quality is poor; but when the institutional quality is good, it
leads to higher growth. Third, transfer of ownership to foreign oil companies increases growth
when the institutional quality is poor; but is detrimental to growth when the institutional quality is
good.
The results suggest that the choice of ownership structure plays an important role in
determining whether oil-exporting countries with different institutional strengths benefit from
their oil wealth or suffer from the curse. The results contrast the existing knowledge that
institutional quality alone is decisive for the resource curse. According to estimates in this study,
during 1984-2005, Iraq with extremely weak institutions could have escaped the curse and
witnessed 1.1% higher growth from every percent increase in oil production to GDP by choosing
an appropriate ownership structure, that is, private (foreign) ownership. The policy advice in this

5
article is: choose state ownership and control if the institutions are strong, if the institutions are
weak, transfer ownership to foreign oil companies.
This article takes forward the pioneering work of Jones Luong and Weinthal (2010) on
ownership structures; they focus on five transition economies of the former Soviet Union during
1990-2005 and investigate the effect of ownership structures on taxation and expenditure
institutions. This article relates to the work of Brunnschweiler (2009) who did an exploratory
analysis of the effect of oil ownership on growth of transition countries of the former Soviet
Union, and Central and Eastern Europe during 1990-2006. Based on the ownership data of
Jones Luong and Weinthal, the author finds that all ownership structures lead to higher growth
and that state ownership with control contributes most positively to growth. However, as the
author herself suggests, the results are not reliable given that the sample consists of only six oil-
rich countries, which have limited variability in the ownership structures adopted by them. In
another article, Brunnschweiler and Valente (2013) investigate whether ownership by foreign
companies and partnership arrangements in the oil sector lead to higher income vis-à-vis
ownership by domestic (both state and private) companies3. While their study provides valuable
insights, it does not address the question whether state ownership is responsible for poor
economic growth and whether transfer of control and/or ownership to private companies
produces different results.
Also, none of the existing studies investigate the role of institutional quality in influencing the
effect of different ownership structures. Brunnschweiler and Valente did account for the effect of
political regimes (i.e. whether democracy, autocracy or anocracy) on ownership-income nexus.
However, the type of political regime is not indicative of the quality of institutions. In theory, we
expect democratic countries to have a good institutional environment. However, there have
been many instances where democracies have been appropriative and characterized by poor
policies, while autocracies have followed self-restraints and adopted good policies.

6
In the next section, I begin by discussing the existing arguments on oil and ownership and
their limitations. I then provide a more complete explanation of how different ownership
structures could affect economic growth and how the effect could vary depending on the
institutional circumstances of the country. Section 3 gives methodology and data, and presents
results. Section 4 concludes and discusses implications for policy.
2. Oil abundance, ownership and institutions
Oil abundance produces negative consequences for the economy, as it generates a large scale
of volatile revenues. The volatility of oil revenues exposes oil-exporting economies to rapid
boom and bust cycles and creates uncertainty in state finances. The problems resulting from
uncertainty can be countered if state leaders adopt effective fiscal policies, which entail saving a
fraction of revenues during booms in order to enable adjustments during busts. However, there
is considerable evidence in the literature that oil-exporting countries increase their spending
significantly during booms and to an extent that it surpasses the level of oil revenues (e.g., Gelb
et al 1998; Lane and Tornell 1999). The increase in spending is often facilitated by borrowing
against oil revenues, which results in large debt burden on these countries. What makes the
situation worse is that oil revenues are often directed towards wasteful expenditure as against
building infrastructure and promoting economic diversification. Most oil-exporting countries
provide their citizens with a wide array of subsidized goods and services, and invest in
inefficient ‘white-elephant’ projects. The inefficient and unrestrained spending by state leaders
during booms is the primary channel leading to lower economic growth in oil-exporting countries
(see Davis 2001; Manzano and Rigbon 2003; Torres et al 2013).
The failure of oil-exporting countries to adopt effective spending and saving policies has
been one of the central puzzles of the oil curse. The explanation for the seemingly irrational
spending behavior of state leaders during oil booms comes from Ross (2012: 67-80); he argues
that citizens in oil-exporting countries recognize their rights to benefit from their nation’s oil-
7
wealth, and support leaders only when they believe that the spending by leaders is
commensurate with the oil revenues that they receive via exports. Given that the expenditure
and revenue accounts are not made public in many of the oil-exporting countries, the beliefs of
the citizens are formed based on their observations about different projects and programs
undertaken by the state, and the popular perception of what accrues to the state during oil
booms. Thus, to remain in power and maintain political support, state leaders, both in
democracies and autocracies, make expenditure which is more visible even though inefficient.
Jones Luong and Weinthal (2010), however, argue and systematically prove using the
case studies of oil-rich countries of the former Soviet Union4 that citizens’ perception of oil
revenues and, in turn, their expectations from state leaders depend on who owns the oil sector.
When the oil sector is owned by the state, citizens’ expectations for distribution of benefits are
large, as they believe that state leaders receive significant revenues during booms. But when
ownership is transferred to private companies, citizens’ expectations reduce, as they now
receive a signal that state leaders are not receiving the full amount of oil proceeds. According to
Jones Luong and Weinthal, these expectations are realized by state leaders and accounted for
in their decision making calculus. As a result, spending and saving patterns in oil-exporting
countries vary with ownership that is, under state ownership, state leaders engage in populist-
style spending that has a high degree of visibility (for instance, universal subsidies and
grandiose public work projects), while under private ownership, they save and invest oil rents
more efficiently.
The above argument lead us to expect that oil abundance would be most harmful to
economic growth under state ownership, and less so under private ownership. However, there
are two points of consideration here: First, expectations of citizens alone cannot determine how
oil revenues are managed in a country. Much also depends on the degree of discretion with
state leaders. Ownership structures not only affect the expectations of citizens, but also the
8
ability of state leaders to meet these expectations, and both these factors jointly determine
spending and saving patterns, and in turn growth. Second, the effect of ownership structures on
growth is unlikely to be independent of the quality of institutions. The institutional environment in
the country influences both the expectations of citizens and the behavior of the state and private
agents, which in turn affects spending and growth outcomes under different ownership
structures. I discuss these points in detail below.
Degree of discretion with state leaders
Under state ownership, large expectations of citizens are often accompanied with the
unconstrained ability of state leaders to meet these expectations which facilitates
channelization of oil rents towards wasteful expenditure. The ability of state leaders to spend
with full discretion comes from the presence of national oil companies (NOCs) whose accounts
are generally hidden from the public, not only in oil-rich autocracies, but also in oil-rich
democracies of the developing world. The NOCs give state leaders easier and direct access to
oil revenues, and are often used as the primary vehicle for dispensing subsidies, distributing
patronage, and making other unproductive expenditure (see, e.g., Hults 2007; Brumberg and
Ahram 2007; Lwanda 2011).
The dissipation of NOCs by the state leaders is facilitated by the absence of internal
monitoring: government officials often chair the NOCs board of directors and appoint its other
members on political grounds (Tordo et al 2011: 27). External monitoring mechanisms such as
stock markets also fail to serve as deterrents. NOCs where the state holds 100 per cent shares
are anyway not listed on the stock exchange and are opaque. There is also not much reliable
information available for NOCs where the state holds majority shares (say 51 per cent) and
there is an active stock market for the remaining shares; majority state ownership creates an
illiquid market and reduces the incentives of stock market participants to acquire information
about the company (Holmstrom and Tirole 1989). There is also no market for corporate control

9
as NOCs face a soft budget constraint that is, they receive subsidies from the state and are
protected from bankruptcy, takeovers and closures (Nolan and Thurber 2010: 20; Victor 2013:
449).
Private ownership in the oil sector, on the other hand, not only reduces the expectations of
citizens with regard to distribution of benefits, but also the state leaders’ ability to engage in
unfettered distribution of oil rents. Under private ownership, NOCs either do not exist or have a
marginal role. The main authorities dealing in the oil sector are the bureaucracies in charge of
tax, finance, and environment related matters. These bureaucracies cannot facilitate state’s
control over the oil sector and its profits in a way that a NOC can (Sarbu 2014:2). Operations by
private companies also bring in a certain level of transparency in the oil sector as the financial
interests of these companies are served when they disclose information about their operations
to shareholders, potential investors and partners. Foreign oil companies, in particular, are also
required to adhere to internationally-recognized accounting standards (particularly since the late
1980s) and are more subject to the international pressure for transparency and other norms.
The relative transparency of private operations makes it difficult for state leaders to interfere in
private companies and impose political obligations on them.
There could be a possibility of corrupt privatization corrupt state leaders could transfer
ownership to those who have well-established connections with them, or who offers bribes and
political favors in return of access to resources. In this case, state leaders could find it easier to
collude with private companies to manipulate the accounts, conceal information about the
company’s fundamentals, and distort operations to meet their political goals. However, there is a
large literature which suggests that the value of private companies cannot be dissipated for
long, as they are subject to the scrutiny of markets and face a credible threat of bankruptcy and
takeovers (see Shirley and Walsch 2001).

10
There have been instances of corrupt privatization of the oil sector in the past, the most
publicized example being that of Russia in the early 1990s, where both private companies and
the state were primarily concerned with stripping oil resources for their personal and political
benefits. However, there is evidence that when the private oil companies in Russia faced hard
budget constraints during the financial crisis of 1998, they started investing in long term
efficiency and profitability, instituted oversight mechanisms for internal monitoring, demanded
clear separation from the state, and increased transparency of their operations and revenues5.
Thus, even with corrupt privatization, the extent of state leaders’ ability to distort oil operations
to meet their political objectives remains limited.
Thus, on account of both the factors expectations of citizens and discretion with state leaders
it is expected that oil abundance would have the worse growth effect under state ownership
and that the effect would be better under private ownership.
When the state retains ownership but transfer control to foreign oil companies, the
expectations of citizens remain large given that the state is still the owner (Jones Luong and
Weinthal 2010); but the ability of state leaders to engage in unfettered distribution of benefits
reduces. Under state ownership without control, NOCs produce only a fraction of oil reserves
owned by the state, which reduces the scale of oil rents that accrue directly to NOCs and the
amount that could be cloaked in secrecy by the state leaders for meeting their political
objectives. Thus, state ownership without control is likely to lead to higher growth than state
ownership with control. However, growth would not be as high as that with private ownership
because, even when control is transferred, the state by virtue of ownership often reserves
the contractual right to interfere in management decisions, which gives them the ability to distort
private oil operations for political purposes (see Bindemann 1999). Private ownership is thus

11
expected to have the most positive effect on growth vis-à-vis state ownership with control and
state ownership without control.
Institutional environment
While drawing the expectation that oil abundance would have the worse growth effect under
state ownership vis-à-vis private ownership, it is implicitly assumed that the state is ruled by
self-interested leaders whose only concern is retaining power, even if it is at the expense of
social welfare. This assumption, however, undermines the role of constraints that could affect
the state leaders’ ability to pursue their utility at the expense of citizens’ welfare. It also
precludes the possibility of benevolent state leaders who, even in an unrestrained environment,
choose to maximize social welfare as against their personal gain.
State leaders can, in fact, adopt good policies either because of their own will or because
of certain constraints on them resulting in a good institutional environment which includes low
corruption, strong rule of law, effective bureaucracy, and strong property rights protection. In the
presence of strong institutions, citizens are more willing to accept restraints on the state’s
spending during booms, as they feel confident that the unspent oil surplus would not be
squandered and would instead be saved and invested wisely6. State leaders, thus, do not feel
obligated to immediately spend oil rents during booms even under state ownership. Also,
when the institutions are strong, NOCs do not become the vehicle for unrestrained wasteful
spending. Instead, they are rationally organized along the meritocratic as against the political
lines. The efficient organization of NOCs, in turn, increases the revenues available with the state
(Marcel 2006: 3), which are then used for productive purposes. In this case, state ownership in
the oil sector is unlikely to have the worse growth effect. In fact, with strong institutions, state
ownership could even lead to higher growth than private ownership.
12
Under private ownership, the ability of state leaders to make productive investments in the
country depends on how effectively they can tax and regulate private companies. Good state
leaders with citizens’ welfare as the priority are likely to adopt effective taxation policies and
stringent regulations. However, even with the most effective policies, it is difficult to extract
optimal tax revenues from private oil companies, as they always have incentives to hide their
income and evade taxes in order to increase their profits (Stiglitz 2007). In fact, with increased
vertical integration of oil companies, hiding of revenues through semi-legal means such as
transfer pricing has become relatively easy.
Stiglitz (2007) argues that the private companies’ incentives to evade taxes are higher when
the expected penalties from doing so are not too great. When the institutions are weak and the
property rights are insecure, the expected penalty for tax evasion is very high as even a
suspicion by state leaders that private companies are not paying the prescribed taxes could
result in an outright expropriation of oil assets 7 . In this case, paying taxes is a relatively
inexpensive way for private companies to secure their property rights (Jones Luong and
Weinthal 2010: 68). However, when the institutions are strong and the property rights are
secure, the penalty for tax evasion (usually in the form of fines) is relatively low. This increases
the private companies’ incentives to evade taxes. The regulation and detection of tax evasion, in
turn, put enormous strain on state’s resources and divert them away from productive uses.
Thus, in the presence of strong institutions, state ownership would lead to higher growth vis-à-
vis private ownership. State ownership with control, in particular, would have the most positive
effect on growth due to the limited involvement of private companies and, hence, the minimum
diversion of oil revenues away from productive investments in the country.
In sum, the discussion above suggests that the effect of oil abundance on economic growth
would vary with ownership structures, and that the effect would be influenced by the quality of

13
institutions. When the institutional quality is poor, private ownership would have the most
positive effect on growth; when the institutional quality is good, state ownership with control
would have the most positive effect on growth. The next section provides a test of this
hypothesis.
3. Empirical analysis
3.1. Methodology & Data
I first test whether the effect of oil abundance on economic growth varies with ownership
structures. I study a sample of 20 oil-exporting developing countries during the period 1984-
2005 (see appendix for the list of countries included in the sample). These countries are
selected on the basis of the following criteria: oil production is at least 10% of the real GDP, and
net oil exports constitute at least 50% of the total exports during the period under consideration.
This is the conventional criteria used in the literature for classifying oil-dependent countries
(e.g., Karl 1997; World Bank 1993:329). Data on oil production and net exports are taken from
Ross (2013), and data for real GDP and merchandise exports are available from the World
Development Indicators. The following model is estimated using a panel fixed-effects estimation
method:
= + + + ( ) + ′ + ∝ + (1)
where is the country and is the year index. is the growth rate of PPP adjusted real GDP
per capita. refers to oil abundance and is measured as the natural log of oil production to
GDP. refers to ownership structures. Data on ownership structures are taken from a novel
database developed by Jones Luong and Weinthal (2010). This database provides categorical
variables for state ownership with control, state ownership without control, and private

14
ownership (both domestic and foreign). The categorical variables are drawn by reviewing each
country’s constitution, mineral laws and regulations, and (where available) oil contracts between
the state and private companies (see appendix for the criteria used for coding these categories).
is the vector of control variables which includes time dummies, openness, institutional
quality, secondary school enrollment rate, and investment. The appendix gives the description
of the variables along with data sources and descriptive statistics. ∝ is the country-specific
error component and is the idiosyncratic error term. The use of country-specific fixed effects
allows us to control for the initial level of development (which accounts for the conditional
convergence effect), and other time-invariant characteristics of the country such as geography
and history. All independent variables are lagged by one year to address the possibility of
endogeneity arising from reverse causality.
For measuring institutional quality (IQ), I construct an index which is an unweighted average
of the four variables obtained from the International Country Risk Guide (ICRG) database:
corruption, law and order, quality of bureaucracy, and investment profile8. The IQ index ranges
from 0 (lowest institutional quality) to 1 (highest institutional quality).
The ICRG based measures of institutional quality have been criticized by a few scholars
(e.g., Glaeser et al 2004; Boschini et al 2013); they argue that these measures do not reflect the
commonly agreed interpretation of institutions as durable rules that constrain human behavior9.
They instead prefer to use the constraint on executive measure available from the Polity IV
database arguing that it reflects durable constraints on states. The constraint on executive
measure, however, has a limitation; it does not account for good policy choices taken by the
leaders who operate relatively freely and do not face formidable constraints. ICRG indicators, on
the other hand, are based on the perception of the situation in the country and reflect past policy
actions taken by the state leaders. These policy actions could be the result of either the leaders’

15
own choice or constraints imposed on them. ICRG based measures are therefore more
comprehensive in measuring the ‘institutional environment’, and are preferred in this study.
The sample constitutes a total of 416 observations which entail 108 county-periods for state
ownership with control (Sc from here on), 204 country-periods for state ownership without control
(Swc from here on) and 104 country-periods for private ownership (P from here on). Private
ownership here only shows the effect of private foreign ownership, as there are no observations
for private domestic ownership in the sample10. I set Sc as the base category and evaluate the
effect of Swc and P in reference to that. Thus, the coefficient (or /100 to be precise) in
equation (1) gives the marginal growth effect of oil abundance under Sc. indicates whether
alternate ownership structures lead to higher (i.e. positive coefficient) or lower (i.e. negative
coefficient) growth. The marginal growth effect of oil abundance under alternate ownership
structures is given by [( + )/100].
3.2. Results
Table 1 shows the estimation results. I start with the parsimonious specification and include only
oil abundance and its interaction with ownership11. The results are presented in column (1). The
effect of oil abundance under Sc is significant and negative, while the differential effect under P
is significantly positive followed by Swc. I sequentially add covariates such as time dummies,
openness, and IQ to the baseline estimation. The results are shown in column (2), (3) and (4) of
Table 1. The inclusion of IQ results in the loss of two countries and 26 observations from the
sample. The results for the main coefficients of interest remain consistent Sc, holding all the
other variables constant, has a significantly negative effect, while the differential effects of both
Swc and P are significantly positive12.

16
Table 1: Effect of oil abundance on growth under different ownership structures
(1) (2) (3) (4) (5) (6) Variables Oil -18.39*** -15.76*** -22.16*** -19.05*** -31.13*** -53.69** (2.420) (2.782) (4.189) (5.009) (8.187) (20.82) Oil*Swc 25.84*** 22.68*** 25.26*** 20.02*** 16.23*** 31.55** (3.793) (4.663) (5.140) (5.812) (4.324) (10.88) Oil*P 38.97*** 35.25*** 37.77*** 22.01*** 35.26*** 56.42** (4.137) (4.233) (3.733) (6.221) (11.57) (24.51) Openness 4.876* 2.488 17.83** 14.68 (2.692) (2.428) (7.614) (11.04) IQ -6.887 6.968 3.582 (5.344) (8.974) (10.86) Enrollment -0.0211 -0.103 (0.0746) (0.0841) Investment 4.524 (2.926) Constant 7.338*** 7.334** -9.679 5.725 -62.37* -44.03 (1.686) (3.445) (10.57) (8.318) (32.76) (49.69) Observations 358 358 358 332 225 185 R-square within 0.100 0.188 0.194 0.159 0.295 0.329 Number of countries
20 20 20 18 17 15
Time dummies No Yes Yes Yes Yes Yes Notes: The dependent variable is growth rate of PPP adjusted real GDP per capita. Sc is the
base outcome. Swc and P dummies are included in the model estimation (results not reported).
Robust (country-clustered) standard errors are given in parentheses. *, **, *** indicate that the
estimates are statistically significant at 10, 5 and 1 percent levels respectively.
In the subsequent columns, I add the remaining covariates, that is, secondary school
enrollment rate and investment which results in the loss of three more countries and 147
observations from the sample. The results show that oil abundance still has a significantly
negative effect under Sc. The magnitude of the negative effect, in fact, increases. The
differential effects of Swc and P continue to be significantly positive. In the full model (column 6),
1% increase in the share of oil production to GDP leads to a 0.5% decrease in growth rate
under Sc; but the growth rates under Swc and P (as compared to Sc) are 0.3% and 0.6% higher
respectively. There is no clear connection between growth and other covariates in the sample.
None of the covariates are significant in the presence of the oil variable13.
17
I now test whether the three variables – oil abundance without and with interaction – are
jointly significant. Joint significance is confirmed at the 1% level of significance in all
specifications except one (i.e. column 6) in which it is confirmed at the 10% level of significance.
The results could be driven by influential observations, that is, observations with high
residuals and high leverage. To check for this, I use the DFITS index and exclude observations
with the index value larger than the absolute value of 2(k/n)^(1/2)(where is the number of
independent variables including the constant and is the number of observations)(Belsley, Kuh
and Welsch 1980:28)14. The results remain robust in terms of the sign and significance of the
coefficients (see Table A.1. in appendix)15. I also estimate the model using oil production per
capita as a measure of oil abundance instead of oil production to GDP. The results mostly
remain consistent (see Table A.2. in appendix).
The results could be subject to some concerns due to the presence of IQ in the model. IQ
could be endogenous to oil abundance as measured by the share of oil production in GDP oil
production could have an effect on institutional quality which in turn affects growth. In this case,
the main coefficients of interest oil abundance and its interaction with ownership would
capture a part of the effect of institutional quality. The IQ variable could also be subject to a
typical measurement error problem. In reality, we do not observe the quality of institutions
directly and it is possible that the proxy measure only captures a part of the true institutional
quality, leading to endogeneity concerns (see Hall and Jones 1999; Acemoglu et al 2001).
One way to address these concerns is to use instruments for institutional quality. The
literature offers various instruments that could be used (see Mauro 1995; Hall and Jones 1999;
Acemoglu et al 2001; Acemoglu et al 2002); however, these are time invariant and cannot be
used in a fixed-effects estimation model. The common practice in the literature is to use a cross-
sectional or a pooled OLS estimation, and then use instruments for the institutional variable
(e.g., Boschini et al 2013). However, doing so will lead to biased estimates for the main

18
coefficients of interest, as both oil abundance and ownership could be correlated to time
invariant variables such as geography, history, culture etc. – country’s geography, for instance,
could determine the level of investments and the type of technologies that is needed to develop
oil fields and, hence, could affect the choice of ownership as well as the level of oil production. I,
therefore, resort to other measures to address the concerns related to IQ.
First, I look at the correlation between IQ, oil abundance, and ownership. Oil abundance and
ownership dummies are only modestly correlated with IQ suggesting that multi-collinearity is not
a major concern in the sample (see Table 2). The variance inflation factor for the IQ variable is
also low – estimated at 6.72 for the model given in column (6) of Table 1.
Second, I use constraints on executive for measuring institutional quality, as it reflects
durable constraints which are less likely to be endogenous to oil production. The results mostly
remain robust; but in the model which includes all the covariates, the main coefficients of
interest become insignificant. This, however, results due to the elimination of countries from the
sample and the shrinking of sample size (see Table A.3 in appendix). I also use another
commonly adopted measure of institutional quality – the polity variable of the Polity IV database
– for robustness check. The results remain consistent; although in the full model, the main
coefficients of interest either assume significance at the lower levels or become insignificant due
to decrease in the number of observations (see Table A.4 in appendix).
As a check for the endogeneity of IQ due to the measurement error problem, I use a pooled
OLS (with time effects) estimation method and conduct a regression-based Hausman test using
latitude (see Acemoglu et al 2001) and population density (see Acemoglu et al 2002) as
instruments16. The test fails to reject the null hypothesis that the IQ variable is exogenous. Given
that the endogeneity of IQ is not a concern in the pooled OLS specification, it is unlikely to be a
concern in the fixed-effects estimation model.

19
Table 2: Correlation matrix
IQ Oil Sc Swc P Openness Enrollment IQ 1
Oil -0.26* 1 Sc -0.15* 0.15* 1
Swc 0.29* -0.07 -0.58* 1 P -0.19* -0.07 -0.34* -0.56* 1
Openness -0.01 0.69* 0.02 0.08 -0.12 1 Enrollment 0.50* -0.04 0.11 0.24* -0.41* 0.18* 1
Investment 0.24* -0.14 -0.21* -0.23* 0.44* 0.07 0.01 Note: * denotes significance at 1% level. Figures in bold denote significance at least at 10% level.
I now test whether the results are robust to the inclusion of other covariates. I control for
population growth rate, oil price shocks as measured by terms of trade changes, and conflicts.
The rationale for including conflicts is that it could be correlated to both oil production and
growth. However, it is not just the presence but also the perception of violence or anticipation of
conflicts that can deter investments and, in turn, reduce oil production and growth. I, therefore,
use the measure of conflict available from the ICRG database. It is a perception-based measure
which assesses political violence in the country. The highest rating is given when there is no
armed or civil opposition to the government, and the lowest rating is given when there is an
ongoing civil war in the country.
The results are presented in Table 3. Column (1) reproduces the results of column (6) from
Table 1. The additional control variables are added sequentially in column (2), (3), and (4).
Population growth rate is significantly and positively associated with growth although the
coefficient loses significance in the full model (i.e. column 4). The coefficients for conflict and
terms of trade are insignificant albeit of the expected sign. The sign and significance of the main
coefficients of interest remain unaffected by the inclusion of these variables17.

20
Table 3: Effect of oil abundance on growth under different ownership structures
(1) (2) (3) (4) Variables Oil -53.69** -48.64** -49.50** -46.00** (20.82) (17.15) (17.00) (20.67) Oil*Swc 31.55** 32.57*** 33.27*** 30.05*** (10.88) (8.334) (8.716) (9.811) Oil*P 56.42** 50.33** 52.24** 52.93* (24.51) (21.38) (20.91) (29.83) Openness 14.68 15.98 15.83 19.38 (11.04) (11.39) (11.69) (17.10) IQ 3.582 7.483 6.201 10.22 (10.86) (10.63) (13.37) (19.29) Enrollment -0.103 -0.0149 -0.0179 0.0835 (0.0841) (0.0660) (0.0671) (0.148) Investment 4.524 3.488 3.676 3.468 (2.926) (2.862) (2.662) (3.500) Population growth 0.509*** 0.502*** 0.179 (0.0868) (0.0920) (1.969) Conflict 0.143 0.126 (0.333) (0.412) Terms of trade 0.0338 (0.0380) Constant -44.03 -56.98 -57.05 -86.60 (49.69) (50.62) (50.91) (84.03) Observations 185 179 179 144 R-square within 0.329 0.379 0.380 0.316 Number of countries 15 15 15 15 Time dummies Yes Yes Yes Yes
Notes: The dependent variable is growth rate of PPP adjusted real GDP per capita. Sc is the
base outcome. Swc and P dummies are included in the model estimation (results not reported).
Huber-White robust standard errors are given in parentheses. *, **, *** indicate that the
estimates are statistically significant at 10, 5 and 1 percent levels respectively.
To sum up, the results so far suggest that the effect of oil abundance on economic growth
varies with ownership structures. The marginal growth effect of oil abundance under Sc is
negative, while the differential effect of P is positive followed by Swc. In the subsequent section, I
delve into the marginal growth effect of oil abundance under Swc and P and its significance, and
test whether the ownership-growth nexus is influenced by the quality of institutions.

21
3.3. Does institutional quality matter?
To investigate the effect of institutional quality, I modify the model given in equation (1) to
include a three-way interaction between oil abundance, ownership, and IQ. The model that is
now estimated is given as follows:
= + + + + ( ∗ ) + ( ∗ ) + ( ∗ ) + ( ∗ ) +
+ ( ∗ ) + ( ∗ ∗ ) + ( ∗ ∗ ) + ′+ ∝ + (2)
I omit the time and country subscripts from equation (2) for simplicity. includes IQ, other
covariates from equation (1), and also population growth rate, conflicts, and terms of trade
changes. The marginal growth effect of oil abundance under different ownership structures is
given in Table 418.
Table 4: Marginal growth effect of oil abundance
Marginal effect
Sc +
Swc + + ( + )
P + + ( + )
The results are presented in Table 5. The first column reproduces the results from column (4) of
Table 2. The second column presents the results from including the three-way interaction in the
model. The results show that the estimated coefficient for is significantly negative while that
of is significantly positive. The positive coefficient for implies that as the value of IQ
increases, the negative growth effect of oil abundance under Sc reduces. What is interesting
here is that the estimated value of is not only positive, but is also greater than the estimated
absolute value of . This means that not only the negative effect under Sc reduces as the value
of IQ increases, but also turns positive at a high enough value of IQ.

22
Table 5: Effect of institutional quality on the ownership-growth nexus
(1) (2) Variables Oil -46.00** -146.6*** (20.67) (36.49) Oil*Swc 30.05*** 122.9** (9.811) (48.96) Oil*P 52.93* 186.0*** (29.83) (32.69) Openness 19.38 6.147 (17.10) (9.646) IQ 10.22 -215.6** (19.29) (79.07) Enrollment 0.0835 -0.0209 (0.148) (0.117) Investment 3.468 2.306 (3.500) (3.357) Population growth 0.179 -0.538 (1.969) (1.832) Conflict 0.126 0.201 (0.412) (0.472) Terms of trade 0.0338 0.0383 (0.0380) (0.0332) Oil*IQ 309.2*** (78.33) Oil*Swc*IQ -260.2** (96.73) Oil*P*IQ -399.0*** (79.75) Constant -86.60 31.77 (84.03) (69.70) Observations 144 144 R-square within 0.316 0.442 Number of countries 15 15 Time dummies Yes Yes Notes: The dependent variable is growth rate of PPP adjusted real GDP per
capita. Sc is the base outcome. Swc and P dummies and their interaction with IQ
are included in the model estimation (results not reported). Huber-white robust
standard errors are given in parentheses. *, **, *** indicate that the estimates are
statistically significant at 10, 5 and 1 percent levels respectively.
The marginal growth effect of oil abundance under Swc is negative when the value of IQ is
zero. However, the effect is still less negative as compared to Sc, given that the estimated value

23
of is positive. The negative effect under Swc also decreases as the value of IQ increases.
Here also the negative effect turns positive at a high enough level of IQ, as the estimated value
of + is greater than the estimated absolute value of + .
In the case of P, the marginal growth effect of oil abundance is positive when the value of IQ
is zero, given that the estimated sum of and is positive. The positive effect reduces as
the value of IQ increases. Interestingly, the effect eventually turns negative given that the
estimated absolute value of + is greater than the estimated value of + .
The institutional thresholds at which the negative growth effect under Sc and Swc get reversed
are 0.47 and 0.48 respectively19. The institutional threshold above which the positive growth
effect under P turns negative is 0.4420. To get better clarity on the marginal effects and their
significance, I use the relevant coefficients to calculate the marginal growth effect under
different ownership structures across different levels of institutional quality. I also use the
variance and covariance of relevant coefficients to generate the coefficient bands. The solid
sloping line in Figure 1a, 1b, and 1c shows how the marginal growth effect of oil abundance
changes with the increase in the value of IQ. 90% confidence intervals around the line allow us
to determine whether oil abundance has a statistically significant effect on economic growth – it
has a statistically significant effect whenever the upper and lower bounds of the confidence
interval are in the same direction.
Figure 1a shows that the marginal growth effect under Sc is significantly negative until the IQ
value of 0.41, and becomes significantly positive above the IQ value of 0.55. The marginal
growth effect under Swc , although improving with every unit increase in the value of IQ, is not
significant at any level of IQ (see Figure 1b). The marginal growth effect under P is significantly
positive until the IQ value of 0.35 and becomes significantly negative above the IQ value of 0.86
(see Figure 1c). Thus, while Swc has no significant effect on growth, the results for Sc and P are
consistent with the hypothesis.

24
Figure 1: Effect of oil abundance on growth across different levels of institutional quality
-2-1
01
2
Mar
gina
l Effe
ct
0 .1 .2 .3 .4 .5 .6 .7 .8 .9 1
Institutional quality (IQ)
Marginal effect of oil abundance
90% Confidence Interval
Figure 1a: State ownership with control (Sc)
-1-0
.50
0.5
1
Mar
gina
l Effe
ct
0 .1 .2 .3 .4 .5 .6 .7 .8 .9 1
Institutional quality (IQ)
Marginal effect of oil abundance
90% Confidence Interval
Figure 1b: State ownership without control (Swc)
-1-0
.50
0.5
1
Mar
gina
l Effe
ct
0 .1 .2 .3 .4 .5 .6 .7 .8 .9 1
Institutional quality (IQ)
Marginal effect of oil abundance
90% Confidence Interval
Figure 1c: Private ownership (P)

25
The results suggest that, to avoid the oil curse, countries with strong institutions (i.e. with the
IQ value greater than 0.55) should choose state ownership and control, while countries with
weak institutions (i.e. with the IQ value less than 0.36) should choose private ownership. The
results contrast the claim of Mehlum et al (2006) and Boschini et al (2007) that institutions alone
are decisive for the resource (or minerals) curse. As we see here, the choice of ownership
structure also plays a decisive role; oil-exporting countries, even the ones with weak institutions,
can avoid the curse by choosing an appropriate ownership structure.
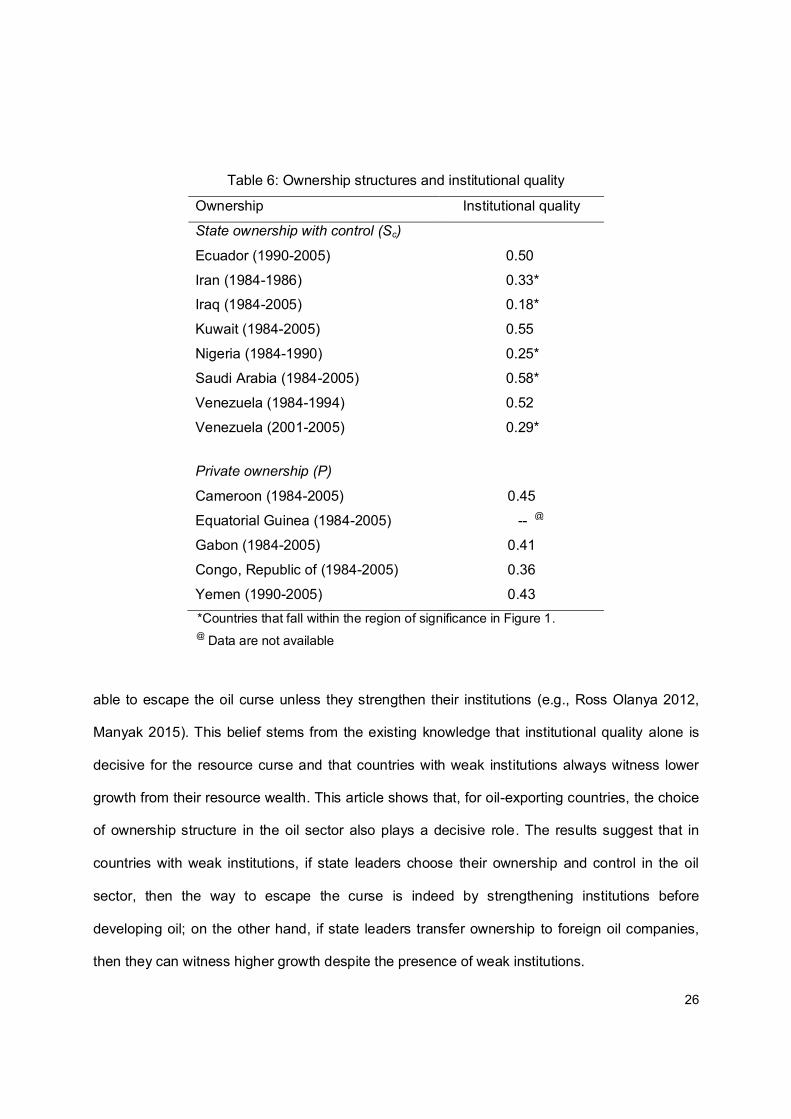
To put the results into perspective, I list the countries from the sample that have adopted
state ownership with control and private ownership during the time period analyzed, and the
corresponding institutional quality (see Table 6). Countries that fall within the region of
significance (in Figure 1) are marked with an asterisk. The results suggest that Saudi Arabia –
with the IQ value greater than 0.55 – benefits from retaining state ownership and control. Other
countries such as Iraq, Nigeria, Iran, and Venezuela (2001-2005) – with the IQ value less than
0.36 – would have witnessed higher growth by choosing private ownership. In Iraq, for instance,
every percent increase in oil production to GDP reduced the growth by 0.9% during 1984-2005.
However, if it would have adopted private ownership, a percent increase in oil production to
GDP would have increased the growth by 0.2%. Similarly, in Nigeria, under private ownership,
every percent increase in oil production to GDP would have contributed to 0.2% increase in
growth. This stands in contrast to the 0.7% decrease that it witnessed under state ownership
with control during 1984-1990.
4. Concluding remarks
Many countries in Africa such as Kenya, Tanzania, Uganda, and Mozambique have recently
discovered large amounts of oil, and are expected to soon become the major oil-exporting
countries of the continent. The sentiment in these countries with regard to oil discoveries and
expected revenues is euphoric. However, skeptics believe that these countries would not be
26
Table 6: Ownership structures and institutional quality
Ownership Institutional quality
State ownership with control (Sc)
Ecuador (1990-2005) 0.50
Iran (1984-1986) 0.33* Iraq (1984-2005) 0.18*
Kuwait (1984-2005) 0.55
Nigeria (1984-1990) 0.25*
Saudi Arabia (1984-2005) 0.58*
Venezuela (1984-1994) 0.52
Venezuela (2001-2005) 0.29*
Private ownership (P)
Cameroon (1984-2005) 0.45
Equatorial Guinea (1984-2005) -- @
Gabon (1984-2005) 0.41
Congo, Republic of (1984-2005) 0.36
Yemen (1990-2005) 0.43 *Countries that fall within the region of significance in Figure 1.
@ Data are not available
able to escape the oil curse unless they strengthen their institutions (e.g., Ross Olanya 2012,
Manyak 2015). This belief stems from the existing knowledge that institutional quality alone is
decisive for the resource curse and that countries with weak institutions always witness lower
growth from their resource wealth. This article shows that, for oil-exporting countries, the choice
of ownership structure in the oil sector also plays a decisive role. The results suggest that in
countries with weak institutions, if state leaders choose their ownership and control in the oil
sector, then the way to escape the curse is indeed by strengthening institutions before
developing oil; on the other hand, if state leaders transfer ownership to foreign oil companies,
then they can witness higher growth despite the presence of weak institutions.
27
This paper focuses on economic growth as the outcome variable, which is only a subset of
the overall well-being and development of the country. It is therefore important to also analyze
the effect of different ownership structures on human welfare, environment, local communities,
and political and institutional dynamics within the country. These are important areas for future
research.
Acknowledgements
I thank Pauline Jones Luong for sharing the database on ownership structures with me. I also
thank Gerald Schneider, Luna Bellani, Michael Becher, Christa N Brunnschweiler, and Halvor
Mehlum for their valuable comments.
Notes
1. The transfer of ownership is mainly done through the signing of concessionary contracts between the
state and private companies. These contracts give private companies the exclusive right to explore and
produce oil over a tract of land for a limited number of years (generally 20-40 years). In return, these
companies pay royalty and taxes to the state.
2. Under these contracts, foreign oil companies explore and produce oil on behalf of the state and, in
return, receive a share of the oil produced as payment.
3. Brunnschweiler and Valente (2013) use the term ‘control rights’ instead of ‘ownership’ but conceptually
it implies the same.
4. These include Azerbaijan, Kazakhstan, Russia, Turkmenistan, and Uzbekistan.
5. Interviews conducted by Pauline Jones Luong and Erika Weinthal with oil companies and other
stakeholders in Russia (see Jones Luong and Weinthal 2010: 173-175)
6. This argument is consistent with the research of Alesina et al (2008), who find that citizens/voters
demand higher spending from the state during booms when they see corruption in the political system.

28
7. Modern oil contracts do contain “stability” and “international arbitration” clauses to protect private
companies against expropriation (Smith and Dzienkowski 1989). However, these clauses are hardly
effective in limiting the state (Brunnschweiler and Valente 2013).
8. This method of measuring IQ is similar to the method used in previous studies (see Mehlum et al
2006a; Boschini et al 2007) and is drawn from Keefer and Knack (2002).
9. The conceptualization of institutions as durable constraints on human behavior comes from the work
of North (1981), Rodrik et al (2004), and Easterly and Levine (2003).
10. Among private players, foreign oil companies assume a dominant role in the oil sector of developing
countries. The presence of private domestic companies has been quite rare. Over the course of the 20th
century, only four developing countries have adopted private domestic ownership: Brazil (1891-1937),
Venezuela (1904-1906), Romania (1924-1944), and Guatemala (1949-1982). In the more recent time
period, only Russia adopted private domestic ownership from 1993 to 2004 (Jones Luong and Weinthal
2010).
11. Swc and P dummies are included in the model estimation, but the results are not shown for simplicity.
Also, during 1984-2005, most of the variation in the dummy variable P is cross-sectional rather than over
time. Hence, it is not possible to get the estimates for P in a fixed-effects estimation model.
12. I also estimate the model using the individual components of the IQ measure. The results (not
reported) do not differ across the four variables.
13. In the model given in Table-1, robust clustered errors at the panel (i.e. country) level are used to deal
with the problem of serial correlation {present in specifications (2)-(5)} along with heteroskedasticity. The
model, however, does not have a large number of clusters. This could create a downward bias in the
estimated standard errors. Cameroon and Miller (2013) suggests that one can reduce the downward bias
by scaling the residuals by √c (where c = ∗ ; G is the number of clusters, N is the number of
observations, and k is the number of regressors) and using critical values from T distribution with degrees
of freedom equal to G − 1. STATA already makes small-cluster adjustments in residuals; but the xtreg
command (as used in the model estimation) continues to use standard normal critical values. I, therefore,
also estimate the model using T (G − 1) critical values. The results (not reported) remain consistent.

29
14. DFITS = r h /(1 − h ) ; where r are the studentized residuals, and h is the leverage.
15. I also test the robustness of results by increasing the lag size of explanatory variables. The results
(not reported) for the main coefficients of interest remain robust up to the lag size of three years. Beyond
that, the sample size becomes too small to draw meaningful inferences – particularly when covariates
such as IQ, enrollment and investment are added to the model.
16. The structural model is G = β + β oil + β os + β (oil os ) + β IQ + β x′ + w , where x´ is
now the vector of covariates which includes time dummies, openness, enrollment and investment. I
suspect IQ to be endogenous. I run the first stage reduced form regression, IQ = β + β oil + β os +
β (oil os ) + β Z´ + β x′ + v , where Z´ is the set of instruments. Then, I include least square
residuals i.e. v in the structural equation, and conduct a standard t test of significance for v .
17. The results also remain robust to controlling for foreign direct investment and inflation (results not
reported). Note that the model does not control for technologies available for oil extraction – which is an
important determinant of the choice of ownership – due to difficulties in observing the variable. This,
however, does not bias the results as oil-extraction technologies are unlikely to have any direct effect on
economic growth; they are likely to affect growth only through their effect on the choice of ownership and
the level of oil production. This is particularly true given that oil extraction takes place in an economic
enclave and does not have linkages with the rest of the economy (which otherwise could have affected
economic growth directly through, for instance, technical spillovers) (see Ross 2012: 44-45).
18. The estimated coefficients need to be scaled by 100 to get their precise effect on growth.
19 The threshold for Sc is given by β /β and that for Swc is given by (β + β )/(β + β ).
20. The threshold for P is given by (β + β )/(β + β ).

30
References
Acemoglu, D., Johnson, S. and Robinson, J.A. (2001), ‘The Colonial Origins of Comparative
Development: An Empirical Investigation’, The American Economic Review, Vol. 91, No.5, pp.
1369-1401.
Acemoglu, D., Johnson, S. and Robinson, J.A. (2002), ‘Reversal of Fortune: Geography and
Institution in the Making of the Modern World Income Distribution’, The Quarterly Journal of
Economics, Vol. 117, No. 4, pp. 1231-1294.
Alesina, A., Campante, F.R., Tabellini, G. (2008), ‘Why Is Fiscal Policy Often Procyclical?’,
Journal of the European Economic Association, Volume 6, Issue 5, pp. 1006-1036.
Belsley, D.A., Kuh, E. and R.E. Welsch (1980), ‘Regression Diagnostics’, New York: John Wiley
and Sons.
Bindemann, K. (1999), ‘Production-Sharing Agreements: An Economic Analysis’, WPM 25,
Oxford Institute for Energy Studies.
Boschini, A., Pettersson, J. and Roine, J. (2007), ‘Resource Curse or Not: A Question of
Appropriability’, Scandinavian Journal of Economics, 109(3), 593-617.
Boschini, A., Pettersson, J. and Roine, J. (2013), ‘The Resource Curse and its Potential
Reversal’, World Development, Volume 43, March, 19-41.
Brumberg, D. and Ahram, A.I. (2007), ‘The National Iranian Oil Company in Iranian Politics’, The
James A. Baker III Institute for Public Policy Rice University.
Brunnschweiler, C.N. (2009), ‘Oil and Growth in Transition Countries’, Working Paper 09/108,
CER-ETH-Center of Economic Research at ETH Zurich.

31
Brunnschweiler, C.N. and Valente, S. (2013), ‘Property Rights, Oil and Income Levels: Over a
Century of Evidence’, Working Paper Series, No. 18/2013, Norwegian University of Science and
Technology, ISSN 1503-299X.
Cameron, A.C. and Miller, D.J. (2013), ‘A Practitioner’s Guide to Cluster-Robust Inference’,
http://cameron.econ.ucdavis.edu/research/Cameron_Miller_Cluster_Robust_October152013.pdf
, last accessed on February 19, 2016.
Davis, J. (2001), ‘Stabilization and Savings Funds for Non-renewable Resources: Experience
and Fiscal Policy Implications’, Washington D.C.: International Monetary Fund.
Easterly, W. and R. Levine (2003), ‘Tropics, germs, and crops: How endowments influence
economic development’, Journal of Monetary Economics, 50, 3-39.
Gelb, A. H. (1988), ‘Oil Windfalls: Blessing or Curse?’ (Published for the World Bank) New York:
Oxford University Press.
Gelb, A. H. (1988), ‘Oil Windfalls: Blessing or Curse?’ (Published for the World Bank) New York:
Oxford University Press.
Glaeser, E.L., La Porta, R., Lopez-De-Silanes, F. and Shleifer, A.(2004), ‘Do Institutions Cause
Growth?’, Journal of Economic Growth 9: 271-303.
Hall, R.E and Jones, C. I. (1999), ‘Why Do Countries Produce So Much More Output per
Worker Than Others?’, Vol. 114, No.1, pp. 83-116.
Heston, A., Summers, R. and Aten, B. (2012), Penn World Table Version 7.1, Center for
International Comparisons of Production, Income and Prices at the University of Pennsylvania.
Holmstrom, B., and Tirole, J. (1989), ‘Corporate Control and the Monitoring Role of the Stock
Market’, mimeo, Yale and MIT.

32
Hults, D. (2007), ‘Petróleos de Venezuela, S.A.: The Right-Hand Man of the Government’,
Working Paper no. 70, Program on Energy and Sustainable Development, Stanford University.
Jones Luong, P. and Weinthal, E. (2010), ‘Oil Is Not a Curse: Ownership Structure and
Institutions in Soviet Successor States’, New York: Cambridge University Press.
Karl, T. L. (1997), ‘The Paradox of Plenty: Oil Booms and Petro-States’, Berkeley: University of
California Press.
Keefer, P. and Knack, S. (2002), ‘Polarization, politics and property rights: Links between
inequality and growth’, Public Choice 111: 127-154.
Lane, P. and Tornell, A. (1999), ‘The voracity effect’, American Economic Review 89, 22– 46.
Lwanda, G.C. (2011), ‘Oiling economic growth and development: Sonangol and the governance
of oil revenues in Angola’, Development Planning Division Working Paper Series No. 21,
Development Bank of Southern Africa.
Manyak, T.G. (2015), ‘Oil and Governance in Uganda’, Journal of Public Administration and
Governance, Vol.5, No.1, ISSN 2161-7104
Manzano, O. and Rigobon, R. (2003), ‘Resource Curse or Debt Overhang?’, In ‘Natural
Resources and Development: Are They a Curse? Are They Destiny?’ Edited by Lederman, D.
and Maloney, W.F., Stanford University Press.
Marcel, V. (2006), ‘Oil Titans: National Oil Companies in the Middle East’, Chatham House,
London.
Marshall, M.G., Gurr, T.R., Jaggers, K (2014), Polity IV Project: Political Regime Characteristics
and Transitions, 1800-2013.
Mauro, P., (1995), ‘Corruption and Growth’, The Quarterly Journal of Economics, 110(3): 681–
712.

33
Megginson. W.L., Robert C. N., van Randenborgh, M. (1994), ‘Financial and Operating
Performance of Newly Privatized Firms: An International Empirical Analysis’, Journal of Finance,
49(2).
Mehlum, H., Moene, K., and Torvik, R. (2006a), ‘Cursed by resources or institutions?’, World
Economy.
Mehlum, H., Moene, K., and Torvik, R. (2006b), ‘Institutions and the resource curse’, Economic
Journal 116, 1–20.
Nolan, P.A. and Thurber, M.C. (2010), ‘On the State’s Choice of Oil Company: Risk
Management and the Frontier of the Petroleum Industry’, Working Paper no. 99, Program on
Energy and Sustainable Development, Stanford University.
North, D. C. (1981), ‘Structure and change in economic history’, New York: Norton.
Quinn, J.J. and Conway, R.T. (2008), ‘The Mineral Resource Curse in Africa: What Role Does
Majority State Ownership Play?’, Available on http://www.csae.ox.ac.uk/conferences/2008-
edia/papers/285-quinn.pdf, last accessed on February 19, 2016.
Rodrik, D., Subramanian, A. and Trebbi, F (2004), ‘Institutions Rule: The Primacy of Institutions
over Geography and Integration in Economic Development’, Journal of Economic Growth 9,
131-165.
Ross Olanya, D. (2012), ‘Resource Curse, Staple Thesis and Rentier Politics in Africa’,
Available on http://www.iese.ac.mz/lib/publication/III_Conf2012/IESE_IIIConf_Paper33.pdf, last
accessed on September 15, 2015.
Ross, M.L. (1999), ‘The Political Economy of the Resource Curse’, World Politics 51, 297-322.
Ross, M.L. (2012), ‘How Petroleum Wealth Shapes the Development of Nations’, New Jersey:
Princeton University Press.
34
Ross, M.L. (2013), ‘Oil and gas data,1932-2011’, Harvard Dataverse Network.
Sarbu, B. (2014), ‘Ownership and Control of Oil: Explaining policy choices across producing
countries’, Routledge, New York.
Shirley, M. M. and Walsh, P. (2001), ‘Public versus Private Ownership: The Current State of the
Debate’, Available on http://elibrary.worldbank.org/doi/pdf/10.1596/1813-9450-2420, last
accessed on June 24, 2015.
Smith, E.E. and Dzienkowski, J.S. (1989), ‘A Fifty Year Perspective on World Petroleum
Arrangements’, 24 TEXAS, International Law Journal 13.
Stiglitz, J. E. (2007), ‘What Is the Role of the State?’, In ‘Escaping the Resource Curse’, Edited
by Humphreys, M., Sachs, J.D., and Stiglitz, J.E., New York: Columbia University Press.
Tordo, S., Tracy, B.S. and Arfaa, N. (2011), ‘National Oil Companies and Value Creation’, World
Bank Working Paper No. 218.
Torres, N., Afonso, O., and Soares, I. (2013), ‘A survey of literature on the resource curse:
critical analysis of the main explanations, empirical tests, and resource proxies’, Centro de
Economia e Financas da UP Working Paper 2013-02.
Victor, D.G. (2013), ‘National Oil Companies and the Future of the Oil Industry’, The Annual
Review of Resource Economics, 5: 445-462.
Victor, M.N. (2007), ‘On Measuring the Performance of National Oil Companies (NOCs)’,
Working Paper no. 64, Program on Energy and Sustainable Development, Stanford University.
Wolf, C. (2008), ‘Does Ownership Matter? The Performance and Efficiency of State Oil vs.
Private Oil (1987-2006)’, EPRG Working Paper 0813, Cambridge Working Paper in Economics.
World Bank (1993), ‘World Development Report 1993: Investing in Health’, New York: Oxford
University Press.

35
Appendix
Countries in the sample*
Angola Gabon Qatar
Brunei Iran Republic of the Congo
Cameroon Iraq Saudi Arabia
East Timor Kuwait United Arab Emirates
Ecuador Libya Venezuela Egypt Nigeria Yemen
Equatorial Guinea Oman *The period of analysis for all countries is 1984-2005 except for East Timor (2002-2005) and Yemen
(1990-2005).
Data and sources
Growth: growth rate of PPP adjusted GDP per capita (chain series) at 2005 constant prices
(annual %). The growth rates are computed from the rgdpch variable (i.e. the PPP converted
GDP per capita at 2005 constant prices) available from Heston et al (2012). For China, version
2 is used. The formula used for computing growth rate is = {( ℎ − ℎ ) ∗
100/ ℎ }
Oil: natural log (log) of oil production to GDP. Source: oil production (in metric tonnes) is
obtained from Ross (2013). GDP (in constant 2005 US$) is available from the World
Development Indicators, World Bank.
Ownership structure: 0-1 dummy for three types of ownership structures: state ownership with
control (Sc), state ownership without control (Swc) and private ownership (P). The criteria used
for coding is as follows: Sc: the state holds the rights to develop majority of oil deposits and hold
majority of shares (i.e. >50%) in the oil sector. Foreign involvement is limited either to operating
as service subcontractors or participating in other forms that restrict managerial and operational
control; Swc: the state holds the rights to develop majority of oil deposits and hold majority of
shares in the oil sector. Foreign investors are allowed to participate in contracts which grant

36
them considerable managerial and operational control (for instance, in production sharing
contracts); P: private companies hold the rights to develop majority of oil deposits and hold
majority of shares in the oil sector. Source: Jones Luong and Weinthal (2010). Note that Jones
Luong and Weinthal distinguish between private domestic ownership (wherein private domestic
companies assume ownership) and private foreign ownership (wherein foreign oil companies
assume ownership). In this study, P only shows the effect of private foreign ownership, as there
are no observations for private domestic ownership in the sample.
Openness: (log) ratio of imports plus exports divided by GDP (at 2005 constant prices). Source:
Heston et al (2012). China version 2 is used.
Institutional quality (IQ): the IQ index is constructed from the four indices available from the
International Country Risk Guide (ICRG) database: 1) corruption: it is an assessment of
corruption within the political system. It is measured on a 6 point scale, with 0 indicating higher
risk from corruption and 6 indicating lower risk, 2) law and order: it is an assessment of strength
and impartiality of legal system and popular observance of the law. It is measured on a 6 point
scale, with higher score indicating low risk, 3) bureaucratic quality: it is an assessment of the
institutional strength and quality of the bureaucracy. It is measured on a 4 point scale, with
higher score indicating low risk, 4) investment profile: it is a sum of risk ratings assigned to three
variables: contract viability/expropriation, profits repatriation, and payment delays. It is
measured on a 12 point scale, with higher score indicating lower risk. I first normalize the four
indices to 0-1 scale, and then calculate their unweighted average.
Enrollment: gross secondary school enrollment rate (in %). Source: World Development
Indicators, World Bank
Investment: (log) share of gross fixed capital formation to GDP (in %). Source: World
Development Indicators, World Bank

37
Oilpc: (log) ratio of oil production to population. Source: oil production (in metric tonnes) is
obtained from Ross (2013). Population (in thousands) is obtained from Heston et al (2012); for
China, version 2 is used.
Executive constraints: it measures the extent of institutionalized constraints on the decision
making power of chief executive. It is concerned with the checks and balances between the
various parts of the decision making process. The measure ranges from 1 (unlimited authority)
to 7 (executive parity or subordination). I have purged out the periods of foreign interruptions,
transitions, interregnum or anarchy (with scores -66, -77, -88) from the sample (i.e. declared it
as missing data), and have normalized the variable to 0-1 scale. Source: Polity IV database,
Marshall et al 2014.
Polity: it is computed by subtracting autocracy score from democracy score and ranges from 10
(strongly democratic) to -10 (strongly autocratic). The instances of ‘standardized authority
scores’ (i.e. -66,-77,-88) are converted to conventional polity scores (i.e. within the range -10 to
+10) by applying simple treatment or ‘fix’. I use the normalized (to 0-1 scale) variable for the
estimation. Source: Polity IV database, Marshall et al 2014.
Population growth: population growth rate (annual %). It is computed from population data
available from Heston et al (2012) (i.e. the pop variable). For China, version 2 is used. The
formula used for computation is as follows: {( − ) ∗ 100/ }
Conflict: It is an assessment of political violence in the country and its actual and potential
impact on governance. The highest rating (i.e.12) is given when there is no armed or civil
opposition to the government and when the government does not engage in arbitrary violence
against its people. The lowest rating (i.e. 0) is given when there is an ongoing civil war. The risk
ratings assigned is a sum of three subcomponents with a maximum score of 4 points and a
minimum score of 0 points: civil war/coup threat, terrorism/political violence and civil disorder.
Source: International Country Risk Guide (ICRG)
38
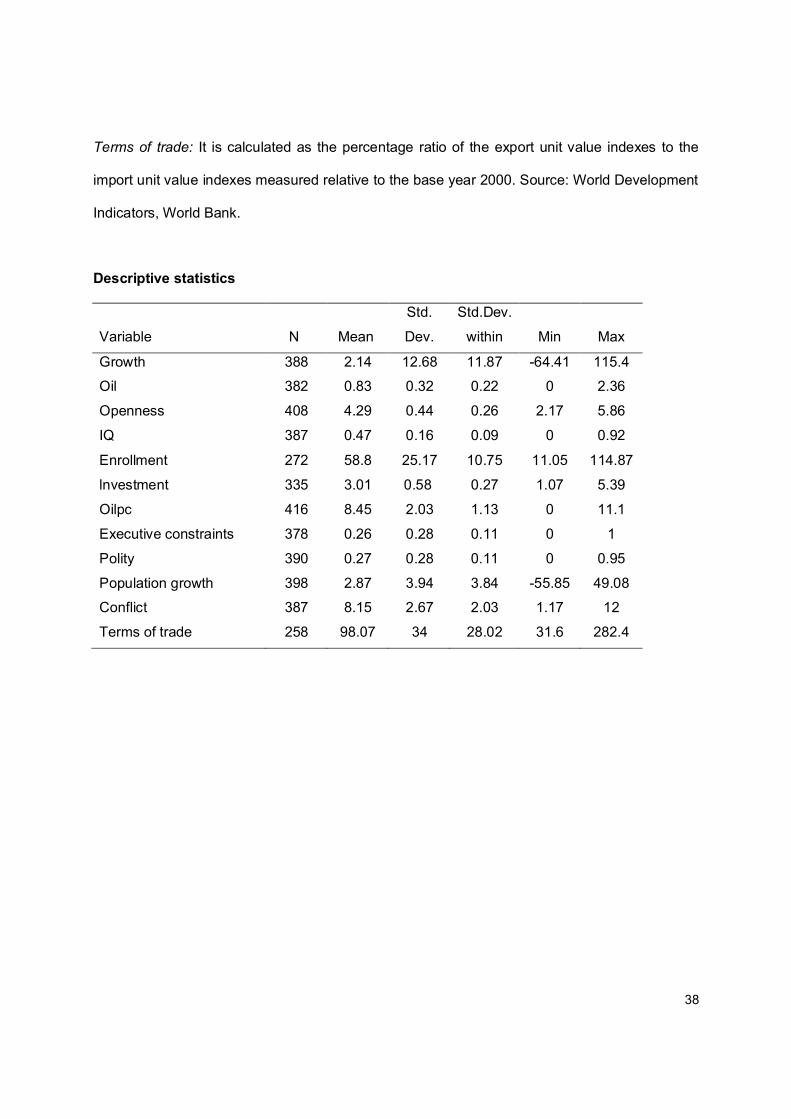
Terms of trade: It is calculated as the percentage ratio of the export unit value indexes to the
import unit value indexes measured relative to the base year 2000. Source: World Development
Indicators, World Bank.
Descriptive statistics
Variable N Mean
Std.
Dev.
Std.Dev.
within Min Max
Growth 388 2.14 12.68 11.87 -64.41 115.4 Oil 382 0.83 0.32 0.22 0 2.36
Openness 408 4.29 0.44 0.26 2.17 5.86
IQ 387 0.47 0.16 0.09 0 0.92
Enrollment 272 58.8 25.17 10.75 11.05 114.87
lnvestment 335 3.01 0.58 0.27 1.07 5.39
Oilpc 416 8.45 2.03 1.13 0 11.1
Executive constraints 378 0.26 0.28 0.11 0 1
Polity 390 0.27 0.28 0.11 0 0.95
Population growth 398 2.87 3.94 3.84 -55.85 49.08 Conflict 387 8.15 2.67 2.03 1.17 12
Terms of trade 258 98.07 34 28.02 31.6 282.4

39
Table A.1: Effect of oil abundance on growth under different ownership structures (excluding
outliers)
(1) (2) (3) (4) (5) (6) Variables Oil -16.72*** -14.30*** -15.74*** -14.64*** -21.91*** -57.09*** (2.180) (3.618) (5.136) (4.484) (3.970) (12.86) Oil*Swc 18.50*** 19.75*** 15.72*** 15.59*** 19.53*** 42.87*** (3.626) (5.167) (4.196) (4.830) (4.060) (8.915) Oil*P 33.97*** 30.92*** 29.52*** 16.57** 17.11** 51.60*** (4.045) (5.532) (4.015) (5.784) (6.944) (12.70) Openness 5.803 1.203 6.983 6.487 (3.865) (2.904) (5.350) (6.523) IQ -7.767** 1.062 -0.898 (3.547) (4.505) (3.797) Enrollment 0.0340 -0.0595* (0.0344) (0.0332) Investment 2.165 (2.536) Constant 6.325*** 7.712*** -16.26 8.945 -20.01 1.279 (1.495) (2.302) (13.90) (10.69) (22.48) (22.53) Observations 338 337 337 316 207 168 R-square within 0.175 0.314 0.323 0.260 0.380 0.445 Number of countries 20 20 20 18 16 14 Time dummies No Yes Yes Yes Yes Yes
Notes: The dependent variable is growth rate of PPP adjusted real GDP per capita. Sc is the base outcome.
Swc and P dummies are included in the model estimation (results not reported). Outliers are excluded using
the DFITS index. Robust (country-clustered) standard errors are given in parentheses. *, **, *** indicate that
the estimates are statistically significant at 10, 5 and 1 percent levels respectively.

40
Table A.2: Effect of oil abundance on growth under different ownership structures (using oil
production per capita)
(1) (2) (3) (4) (5) (6) Variables Oilpc -9.803** -8.833** -10.25* -14.48** -18.90*** -25.57** (4.105) (3.864) (5.321) (5.144) (4.352) (10.52) Oilpc*Swc 10.20** 9.165* 9.934* 4.899 3.243 4.715 (4.499) (4.392) (5.371) (3.643) (2.916) (5.003) Oilpc*P 12.70*** 11.50*** 12.51** 13.47** 20.21*** 25.14* (4.108) (3.827) (5.015) (5.118) (6.602) (12.02) Openness 3.342 5.903 17.92*** 14.67 (2.649) (3.535) (6.020) (9.353) IQ -3.920 11.43* 8.650 (5.665) (5.995) (8.772) Enrollment -0.0736 -0.128 (0.0748) (0.0849) Investment 3.410 (2.413) Constant 54.82** 51.52** 46.57* 78.72*** 51.59*** 88.51* (24.17) (22.84) (24.00) (19.39) (14.09) (47.28) Observations 386 386 386 360 240 185 R-square within 0.102 0.188 0.191 0.182 0.305 0.377 Number of countries 20 20 20 18 17 15 Time dummies No Yes Yes Yes Yes Yes
Notes: The dependent variable is growth rate of PPP adjusted real GDP per capita. Sc is the base outcome. Swc
and P dummies are included in the model estimation (results not reported). Huber-White robust standard errors are
given in parentheses. *, **, *** indicate that the estimates are statistically significant at 10, 5 and 1 percent levels
respectively. The estimated coefficient for Oilpc*Swc becomes insignificant from model (4) onwards due to the
elimination of countries from the sample and the shrinking of sample size.

41
Table A.3: Effect of oil abundance on growth under different ownership structures (using
constraints on executive)
(1) (2) (3) (4) Variables Oil -22.16*** -18.72*** -21.13*** -23.63 (4.189) (4.947) (5.449) (19.16) Oil* Swc 25.26*** 22.98*** 21.39*** 24.51 (5.140) (4.528) (4.621) (18.56) Oil*P 37.77*** 35.84*** 31.56*** 32.86 (3.733) (3.827) (7.674) (20.11) Openness 4.876* 2.804 12.52** 10.21* (2.692) (4.080) (4.321) (5.637) Executive constraints 4.753 1.930 1.248 (3.664) (3.599) (6.551) Enrollment -0.00119 -0.0683 (0.0626) (0.0824) Investment 0.776 (4.585) Constant -9.679 -3.761 -42.56** -29.42 (10.57) (16.02) (16.75) (29.91) Observations 358 323 217 179 R-square within 0.194 0.203 0.263 0.310 Number of countries 20 19 18 16 Time dummies Yes Yes Yes Yes
Notes: The dependent variable is growth rate of PPP adjusted real GDP per capita. Sc is the base
outcome. Swc and P dummies are included in the model estimation (results not reported). Robust
(country-clustered) standard errors are given in parentheses. *, **, *** indicate that the estimates
are statistically significant at 10, 5 and 1 percent levels respectively. The main coefficients of
interest become insignificant in model (4) due to the shrinking of sample size.

42
Table A.4: Effect of oil abundance on growth under different ownership structures (using polity)
(1) (2) (3) (4) Variables Oil -22.16*** -19.88*** -21.34*** -24.33 (4.189) (4.728) (5.499) (15.40) Oil*Swc 25.26*** 23.67*** 21.16*** 25.77* (5.140) (4.498) (4.804) (14.37) Oil*P 37.77*** 36.97*** 31.45*** 32.95* (3.733) (3.808) (7.577) (16.41) Openness 4.876* 3.245 12.21** 8.283 (2.692) (3.848) (4.458) (6.802) Polity 6.590 3.921 3.806 (3.857) (3.617) (4.653) Enrollment -0.00507 -0.0813 (0.0668) (0.0862) Investment 3.427 (4.042) Constant -9.679 -5.906 -41.41** -28.80 (10.57) (15.19) (18.29) (30.80) Observations 358 335 220 182 R-square within 0.194 0.197 0.256 0.312 Number of countries 20 19 18 16 Time dummies Yes Yes Yes Yes
Notes: The dependent variable is growth rate of PPP adjusted real GDP per capita. Sc is the
base outcome. Swc and P dummies are included in the model estimation (results not reported).
Robust (country-clustered) standard errors are given in parentheses. *, **, *** indicates that the
estimates are statistically significant at 10, 5 and 1 percent levels respectively. In model (4),
the estimated coefficient for the oil variable becomes insignificant and other coefficients of
interest assume significance at lower levels due to decrease in the sample size.