gprs controlled system for monitoring and control of well ... · optimization of water levels in...
TRANSCRIPT

10th International Conference on DEVELOPMENT AND APPLICATION SYSTEMS, Suceava, Romania, May 27-29, 2010
250
Abstract — In this paper a hardware realization of a water well monitoring and control system is presented. The system for water level monitoring is built of several field units witch measure the water levels, and gives full control over the well site pumps using inverters and other actuators. Measured data from field units are gathered and analyzed by central data analyzer. This gives user insight into the amount of water in a certain area and other parameters measured by field units. Organization of system allows operator to make remote commands to well site actuators instantly. Using modern technology it is possible to implement algorithm of self diagnostics and calibration and to use measured data to make model of underground water behavior for monitored area.
Index Terms — GPRS, remote control, well monitoring,water level measurement.
I. INTRODUCTION
Water is an irreplaceable resource for life on Earth. We cannot optimize the amount of water needed for the living creatures on Earth to survive, but we can optimize the systems for its distribution. In this paper, a theoretical base of water level control system is given, and a hardware realization is presented, without going into construction details of particular system elements. The water level sensors in combination with the data transmission and acquisition units represent a whole system for analyzing and optimization of water levels in wells.
II. SYSTEM DESCRIPTION
System consists of field units that are placed on well sites and data analyzer that is running on remote computer with internet connection. Figure 1. presents the simplified blockdiagram of the entire water level monitoring system. Field units are directly connected to all sensors and actuators on well site while data analyzer provides user interface and communicates with units in real time or in preprogrammed intervals.
Modular structure of whole system ensures easy upgrade and adding new features and modules so it can be custom made at costumers needs and expanded if needed. Field units are custom made hardware, data analyzer is specialized software running on PC platform and connection is made thru GPRS internet and existing GSM infrastructure which makes system installation quick and cheap.
III. SENSOR
Because of the great diversity of water level sensors, only some of them were taken into consideration: pressure sensor, ultrasonic sensor, capacitive sensor and a discrete water level sensor. If measurement of water level in a tank not deeper than 1m is needed, than all of these sensors are good enough. For greater depths (~100m) it is hard to achieve a good resolution (let us say the desired resolution is ΔH = ±0.5m) with some sensors. The capacitive sensors for this purpose are expensive and hard to get. The ultrasonic sensors are not suitable in these circumstances because the walls of the well would cause the sound waves to reflect and generate a false result. To track the water level in the well with a satisfying resolution a continuous sensor or a suitable number of discrete sensors is needed. For a well of 100m, the number of discrete sensors would be too big. The pressure sensor has a disadvantage because of its lower precision, but the measured values can still be considered good enough, within the given error boundaries.
IV. PRESSURE TO WATER LEVELTRANSFORMATION
The pressure sensor can be used for water level calculation by using the Pascal law modified for this purpose:
H
waterwaterairbottomtheon dhghTPP0
__ ))((
where Pon_the_bottom is the pressure of the water column on the bottom of the well, Pair is the atmospheric pressure, and ρwater(Twater(h)) the density of water depending on the water temperature and the height of the water column.
Figure 2. shows an example of density change with depth. The sensor should be placed as close as possible to the wall of the well where the change density is very small, so it can be considered constant.
GPRS Controlled System for Monitoring and Control of Well Sites
Vladimir MILOSAVLJEVIC, Milos ZIVANOV, Viktor DOGANFaculty of Technical Sciences, Serbia
[email protected], [email protected]
Unit 1 Unit 2 Unit N
Modem Modem Modem
Data analyzer (PC)
Internet connection
Figure 1 – Water level monitoring system block diagram

10th International Conference on DEVELOPMENT AND APPLICATION SYSTEMS, Suceava, Romania, May 27-29, 2010
251
In order to minimize the influence of turbulence caused by the pump, the sensor should be departed at least 1.5m from the pump drain.
V. SENSOR POWER SUPPLY AND DATA TRANSFER
Sensor and water pump must be on the bottom of the well. That is why power cables for motor pumps and sensor cables must be close to each other (limit is maximum diameter of the well ~0.5m). Well is usually ~100m deep so ~50kW pumps are used. They have starting current of ~7x150A which generates great electromagnetic interference. Water level sensor required 13-32V DC. At the bottom of the well next to sensor is placed 220V-22V linear AC-DC converter. Information signal is transferred to the surface thru 2-20mA industrial standard current transfer. This is done because of the length of the cable (~100m). Also good solution for precise data transfer on bigger distance would be putting the optical cable inside well but it is expensive and requires sensitive optical equipment.
VI. FREQUENCY OF MEASUREMENT AND SENDINGOF MEASURED DATA
Time interval between two measurements and between storage of measured data into the memory should be adoptable, depending on intensity of water level variation. Using algorithm for calculating these intervals data logger should read current water level frequently enough to detect water changes and store data into the memory. Sending of data from data logger memory to data analyzer is done in predefined time intervals and additionally at data analyzer request. Snapshoot of data analyzer software is shown on figure 3.
Figure 3 – Data analyzer software
VII. UNIT FOR MEASUREMENT OF WATER LEVELINSIDE WELL
This system architecture presents optimal solution contribute system reliability, working speed and lowers component count needed for system realization. Standard linear AC-DC converter is used for power supply. Symmetrical power supply +-15V is used and voltage is later lowered to 5V for each module where needed.
soil temperature – Ts
air temperature – TA air
soil
Equitemperature lines
well
sensor
pump drain
Figure 2 – Example of water density change
AC-DC
Pressure sensor
L
µ
modem
Linear voltage convertor. Power:30W;Output voltages: 15V, 5V, 3V
Preassure sensor: Honeywell, CIP-Ultra, CP100
Modem: Siemens ES75GSM-GPRS modem
Coaxial cable
GSM Power supply cable
Low pass filter: Microchip, MCP6021
Microcontroler: Microchip, DsPic
Memory: Atmel, AT45DB021B
Hermetically closed metal casing
Power supply linesData transfer lines
Figure 4 – Unit for measurement of water level in the well
10th International Conference on DEVELOPMENT AND APPLICATION SYSTEMS, Suceava, Romania, May 27-29, 2010
252
Block diagram of the unit for measurement of water level in the well is shown on figure 4. For pressure sensor we used Honeywell, CIP-Ultra, CP100 which provides working range 0-600psi with measurement precision of 0,1%. Based on these data we can calculate minimal resolution of water level measurement. If all parameters are assumed to be average for our life environment (such as water characteristics, g force...) this sensor provides measurement resolution of 0.42m. Low pass filter tuned to 10-30Hz stops unwanted noise that is mostly generated by 50Hz signal. Water level changes are relatively slow so additional digital filters are implemented on microcontroller. Since water variations are usually small, there is no need to constantly send data to data analyzer. Instead, these data is stored in internal memory until water level drastically changes or data analyzer sends request for measured data send.
Siemens ES75 GSM modem is used for data sending thru GPRS connection from data logger to data analyzer and vice versa. Since water variations are usually small, there is no need to constantly send data to data analyzer. Instead, these data is stored in internal memory until water level drastically changes or data analyzer sends request for measured data send. Hermetically closed metal casing is constructed to protect all components from mechanical damage and electromagnetic interference. One of main features of this system is his upgradeability. On metal casing are placed
several connectors for standard industrial communication busses (RS232, RS485, I2C, SPI, CAN...). This makes additional modules very easy to add. Moreover, upgradeable Firmware inside microcontroller ensures capability to communicate with large number of data transfer protocols. One of connectors for example is used for controlling invertors that drive water pumps inside well. In addition, busses such as RS485 allows usage of strings of smart sensors that can be placed inside well and its robustness make it possible to displace sensors far away from measurement unit.
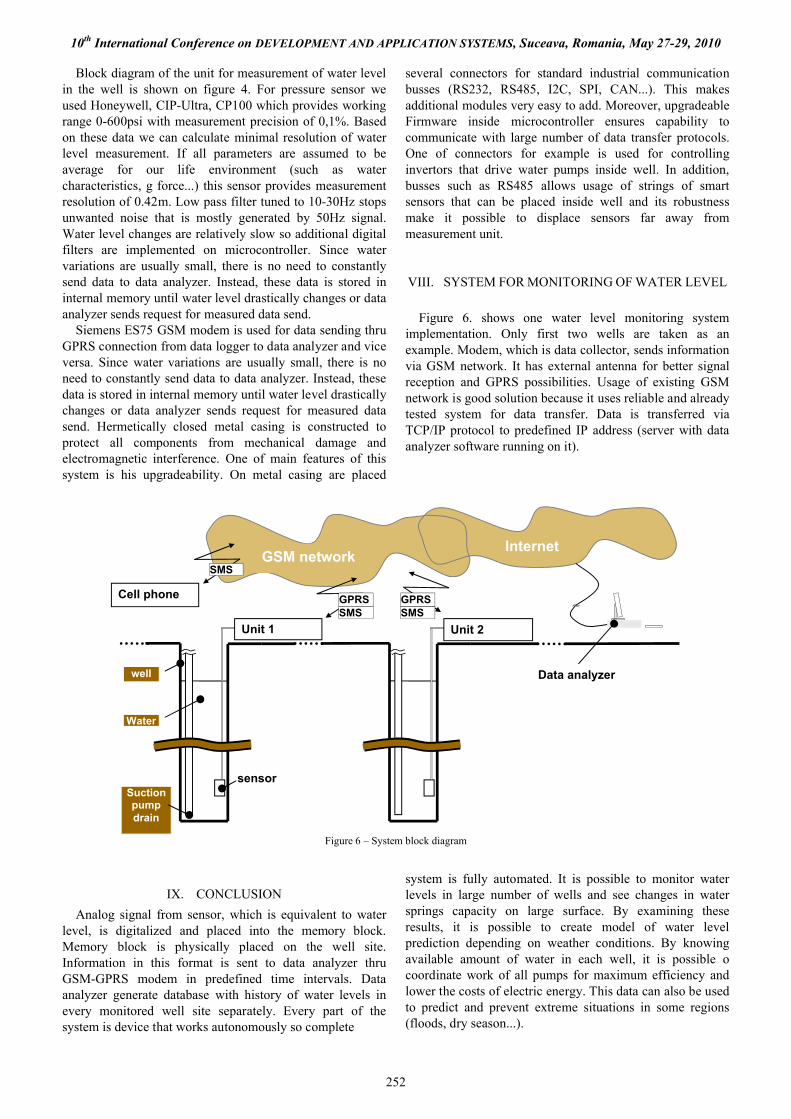
VIII. SYSTEM FOR MONITORING OF WATER LEVEL
Figure 6. shows one water level monitoring system implementation. Only first two wells are taken as an example. Modem, which is data collector, sends information via GSM network. It has external antenna for better signal reception and GPRS possibilities. Usage of existing GSM network is good solution because it uses reliable and already tested system for data transfer. Data is transferred via TCP/IP protocol to predefined IP address (server with data analyzer software running on it).
Figure 6 – System block diagram
IX. CONCLUSION
Analog signal from sensor, which is equivalent to water level, is digitalized and placed into the memory block. Memory block is physically placed on the well site. Information in this format is sent to data analyzer thru GSM-GPRS modem in predefined time intervals. Data analyzer generate database with history of water levels in every monitored well site separately. Every part of the system is device that works autonomously so complete
system is fully automated. It is possible to monitor water levels in large number of wells and see changes in water springs capacity on large surface. By examining these results, it is possible to create model of water level prediction depending on weather conditions. By knowing available amount of water in each well, it is possible o coordinate work of all pumps for maximum efficiency and lower the costs of electric energy. This data can also be used to predict and prevent extreme situations in some regions (floods, dry season...).
well
Suction pump drain
Water
GSM network
Data analyzer
GPRS
Internet
Unit 2Unit 1
sensor
SMS
Cell phone
SMS SMSGPRS

10th International Conference on DEVELOPMENT AND APPLICATION SYSTEMS, Suceava, Romania, May 27-29, 2010
253
REFERENCES[1] W. Ritcher, W. Lilich: „Ground water basic data and network design
principles and problems”, Geological Survey of Niedersachsen-Federal Republic of Germany
[2] Jerry T. Thornhill: „Accuracy of depth to water measurements”, Superfund ground water issue, March 1989.
[3] W. D. Welsh, J. Doherty: „Great artesian basin groundwater modelling”, 29th Hydrology and Water Resources Symposium, February 2005.
[4] K. Ubell: „Principles on network design and basic data to study groundwater balance”, Research Institute for Water Resources, Budapest, Hungary
[5] „Strategic Plan for Groundwater Monitoring at the Waste Isolation Pilot Plant”, United States Department of Energy, February 2003.
[6] Buha Slavenko, Živanov Miloš, Mihajlović Danijel, NADGLEDANJE NIVOA VODE U BUNARIMA, Indel, Banja Luka, 2006
[7] Jovan Radak, Živorad Mihajlović, Milan Lukić, Miloš Živanov, Miloš Slankamenac,T HE NOVELL SOLUTION FOR SEISMIC RECORDING, Indel, Banja Luka, 2008