government of the commonwealth of dominica€¦ · characteristics and consequences of this bill...
TRANSCRIPT

The Prospectus has been drawn up in accordance with the rules of the Regional Government
Securities Market. The Regional Debt Coordinating Committee and Eastern Caribbean Central
Bank accept no responsibility for the content of this Prospectus, make no representations as to
its accuracy or completeness and expressly disclaim any liability whatsoever for any loss
whatsoever arising from or reliance upon the whole or any part of the contents of this
Prospectus. This prospectus is issued for the purpose of giving information to the public. If you
are in doubt about the contents of this document or need financial or investment advice you
should consult a person licensed under the Securities Act or any other duly qualified person who
specializes in advising on the acquisition of government instruments or other securities.
GOVERNMENT OF THE COMMONWEALTH OF
DOMINICA
PROSPECTUS
For
EC$60 Million, 91 day Treasury bills
(Series A: ECD 20M; Series B: ECD 20M; Series C: ECD 20M)
EC$25 Million 5 year Bond
Ministry of Finance
Financial Centre
Kennedy Avenue
Roseau
DOMINICA
Telephone: (767) 266-3221
Fax: (767) 448-0054
Email: [email protected]
DATE OF PROSPECTUS: JANUARY 2015
DA
PROSPECTUS DATE: AUGUST 2014
1
Page
1

2
Page
2
TABLE OF CONTENTS
Notice to Investors .......................................................................................................................... 3 Abstract ........................................................................................................................................... 4 I. General Information ................................................................................................................ 5
II. Information about the Issues .................................................................................................... 6
III. History ................................................................................................................................... 12
IV. Demographics ........................................................................................................................ 12 V. Political .................................................................................................................................. 14 VI. Management and Administration of Public Finance ............................................................. 14 V11. Public Debt Overview ......................................................................................................... 17
VIII. Macro-Economic Performance ...................................................................................... 21 IX. Fiscal Performance ................................................................................................................ 27 X. Prospects ................................................................................................................................ 35
XI. Security Issuance Procedures, Clearance and Settlement ..................................................... 36 XII. Appendices ......................................................................................................................... 38

3
Page
3
Notice to Investors
This prospectus is issued for the purposes of giving information to the public. The Government
of the Commonwealth of Dominica (GOCD) affirms the accuracy of the information contained
herein and accepts full responsibility for the same. The GOCD confirms that, having made all
reasonable inquiries, this prospectus contains all information material in the context of the
securities being issued, and to the best of its knowledge there are no other facts, the omission of
which would cause the information in this prospectus to be misleading.
This prospectus and its content are issued for the specific securities described herein. Should you
need advice, you should consult a person licensed under the Securities Act or any other duly
qualified person who specializes on advising on the acquisition of Governments instruments or
other securities.
The ultimate decision and responsibility to proceed with any transaction with respect to this
offering rests solely with you. Therefore, prior to entering into the proposed investment, you
should determine the economic risks and merits, as well as the legal, tax and accounting
characteristics and consequences of this Bill offering, and that you are able to assume those risks.
This Prospectus and its content are issued for the specific securities described.

4
Page
4
Abstract
The Government of the Commonwealth of Dominica (thereafter referred to as GOCD) proposes
to raise a total of EC$85 Million on the Regional Government Securities Market (RGSM)
through the issue of the following securities:
One 5 year EC$25 Million Bond with maximum bid price of 7.0%
Three 91 day Treasury bills:
EC$20 Million, with a maximum bid price of 6.0%
EC$20 Million, with a maximum bid price of 6.0%
EC$20 Million, with a maximum bid price of 6.0%
The securities will be issued under the authority of the Bonds and Securities Act and the
Treasury Bills Act No. 5 of 2010 of the Commonwealth of Dominica.
The securities will be issued on the Regional Government Securities Market (RGSM) in the
months of February 2015, March 2015, June 2015 and September 2015, and listed on the Eastern
Caribbean Securities Exchange (ECSE) as follows:
Issue amount: EC$85 Million
Auction Date Tenor/Type Amount Trading Symbol Settlement Date Maturity Date
25th
February 2015 5 year Bond EC$25.0 Million DMG050220 26th
February 2015 26th
February 2020
26th
March 2015 91 Day T-bill EC$20.0 Million DMB260615 27th
March 2015 26th
June 2015
29th
June 2015 91 Day T-bill EC$20.0 Million DMB290915 30th
June 2015 29th
September 2015
30th
September 2015 91 day T-bill EC$20.0 Million DMB311215 1st October 2015 31
st December 2015
Bidding will commence at 9:00 a.m. and will be closed at 12:00 noon on the auction day.

5
Page
5
I. General Information
Issuer: Government of the Commonwealth of Dominica (GOCD)
Address: Ministry of Finance
Financial Centre
Roseau
Commonwealth of Dominica
Email: [email protected]
Telephone No.: (767) 266-3221
Facsimile No.: (767) 448-0054
Contact Persons: Hon. Mr. Roosevelt Skerrit, Prime Minister and Minister
for Finance
Mrs. Rosamund Edwards, Financial Secretary
Mrs. Beverly Pinard, Accountant General
Arranger: ECFH Global Investment Solutions Limited
Address: 5th
Floor Financial Centre Building
1 Bridge Street
Castries, St. Lucia W.I.
Telephone No.: (758) 457 7233
Facsimile No.: (758) 456 6740
Contact Persons: Dianne Augustin
Issue Dates: 26th
February 2015; 27th
March 2015; 30th
June 2015; 1st
October 2015
Types of Securities: One 5 year Bond, three 91 day Treasury bills
Amount of Issue: EC$25 Million 5 year Bond with a maximum bid price of
7.0%

6
Page
6
EC$20 million 91 day Treasury bill with a maximum bid
price of 6.0%
EC$20 million 91 day Treasury bill with a maximum bid
price of 6.0%
EC$20 million 91 day Treasury bill with a maximum bid
price of 6.0%
Use of Proceeds: The proceeds of this issue will be used to finance part of
the GOCD operational budget and to refinance existing
GOCD debt.
Legislative Authority: The Bonds and Securities Act and the Treasury Bills Act
No. 5 of 2010 of the Commonwealth of Dominica.
II. Information about the Issues
EC$25 Million 5-year Bond Issue
Amount of Issue: EC $25 Million
Maximum Bid Price: 7.0%
Tenor: 5 year Bond
Trading Symbol: DMG050220
Auction Date: 25th
February 2015
Settlement Date: 26th
February 2015
Maturity Date: 26th
February 2020
Method of Issue: The price of the issue will be determined by a competitive
uniform price auction with open bidding
Repayment: The bond will be paid by bullet payment.

7
Page
7
Interest Payment: The interest payments will be made semiannually on
August 26th
and February 26th
of each year beginning
August 26th
2015 and ending February 26th
2020.
Listing: The securities will be issued on the RGSM and listed on the
Eastern Caribbean Securities Exchange (ECSE), the
secondary market trading platform.
Minimum Bid Amount: The minimum bid quantity is EC $5,000.
Bid Multiplier: The bid multiplier will be EC $1,000.
Bidding Period: The bidding period will start at 9:00 a.m. and end at
12:00 noon on auction day.
Bid Limitation: Each investor is limited to one (1) bid with the option of
increasing the amount being tendered or reducing the
interest rate offered until the close of the bidding period.
Taxation: Yields on these securities will not be subject to any tax,
duty or levy by Eastern Caribbean Currency Union (ECCU)
participating Governments.
Participation: Investors may participate in the auction through licensed
financial intermediaries on the Eastern Caribbean Securities
Exchange (ECSE).
$20 Million 91-day Treasury bill
Amount of Issue: EC $20 Million
Maximum Bid Price: 6.0%
Tenor: 91 days
Trading Symbol: DMB260615
Auction Date: 26th
March 2015

8
Page
8
Settlement Date: 27th
March 2015
Maturity Date: 26th
June 2015
Method of Issue: The price of the issue will be determined by a competitive
uniform price auction with open bidding
Listing: The securities will be issued on the RGSM and traded on
the Eastern Caribbean Securities Exchange (ECSE), the
secondary market trading platform.
Minimum Bid Amount: The minimum bid quantity is EC $5,000.
Bid Multiplier: The bid multiplier will be EC $1,000.
Bidding Period: The bidding period will start at 9:00 a.m. and end at
12:00 noon on auction day.
Bid Limitation: Each investor is limited to one (1) bid with the option of
increasing the amount being tendered or reducing the
interest rate offered until the close of the bidding period.
Taxation: Yields on these securities will not be subject to any tax,
duty or levy by Eastern Caribbean Currency Union (ECCU)
participating Governments.
Participation: Investors may participate in the auction through licensed
financial intermediaries on the Eastern Caribbean Securities
Exchange (ECSE).

9
Page
9
$20 Million 91-day Treasury bill
Amount of Issue: EC $20 Million
Maximum Bid Price: 6.0%
Tenor: 91 days
Trading Symbol: DMB290915
Auction Date: 29th
June 2015
Settlement Date: 30th
June 2015
Maturity Date: 29th
September 2015
Method of Issue: The price of the issue will be determined by a competitive
uniform price auction with open bidding
Listing: The securities will be issued on the RGSM and traded on
the Eastern Caribbean Securities Exchange (ECSE), the
secondary market trading platform.
Minimum Bid Amount: The minimum bid quantity is EC $5,000.
Bid Multiplier: The bid multiplier will be EC $1,000.
Bidding Period: The bidding period will start at 9:00 a.m. and end at
12:00 noon on auction day.
Bid Limitation: Each investor is limited to one (1) bid with the option of
increasing the amount being tendered or reducing the
interest rate offered until the close of the bidding period.
Taxation: Yields on these securities will not be subject to any tax,
duty or levy by Eastern Caribbean Currency Union (ECCU)
participating Governments.

10
Page
10
Participation: Investors may participate in the auction through licensed
financial intermediaries on the Eastern Caribbean Securities
Exchange (ECSE).
$20 Million 91-day Treasury bill
Amount of Issue: EC $20 Million
Maximum Bid Price: 6.0%
Tenor: 91 days
Trading Symbol: DMB311215
Auction Date: 30th
September 2015
Settlement Date: 1st October 2015
Maturity Date: 31st December 2015
Method of Issue: The price of the issue will be determined by a competitive
uniform price auction with open bidding
Listing: The securities will be issued on the RGSM and traded on
the Eastern Caribbean Securities Exchange (ECSE), the
secondary market trading platform.
Minimum Bid Amount: The minimum bid quantity is EC $5,000.
Bid Multiplier: The bid multiplier will be EC $1,000.
Bidding Period: The bidding period will start at 9:00 a.m. and end at
12:00 noon on auction day.
Bid Limitation: Each investor is limited to one (1) bid with the option of
increasing the amount being tendered or reducing the
interest rate offered until the close of the bidding period.

11
Page
11
Taxation: Yields on these securities will not be subject to any tax,
duty or levy by Eastern Caribbean Currency Union (ECCU)
participating Governments.
Participation: Investors may participate in the auction through licensed
financial intermediaries on the Eastern Caribbean Securities
Exchange (ECSE).
List of Intermediaries: The Bank of Nevis Limited
ECFH Global Investment Solutions Limited
First Citizens Investment Services Limited
Bank of St Vincent and the Grenadines Limited
St. Kitts-Nevis-Anguilla National Bank Limited
Currency of Issue: All currency references are to Eastern Caribbean Dollars
unless otherwise specified.

12
Page
12
III. History
Nicknamed the “Nature Island of the Caribbean”, Dominica is reputed as an unspoiled nature
haven and the quintessential eco-tourism destination in the Caribbean. The country’s early
inhabitants, the Kalinago (Island Caribs), named the island Wai'tukubuli, meaning ‘Tall is her
body’; a fitting description of the country’s mountainous interior.
Largely due to Dominica's position between Martinique and Guadeloupe, France eventually
became predominant, and a French settlement was established and grew. The island became a
British possession following the 1763 Treaty of Paris which ended the Seven Years' War
between Britain and France. The French successfully invaded in 1778 with the active
cooperation of the population. The island was subsequently returned to British rule by the1783
Treaty of Paris. French invasions in 1795 and 1805 ended in failure.
Britain established a legislative assembly, representing only the white population in 1763. With
the liberalization of racial attitudes around 1831 came the Brown Privilege Bill which conferred
political and social rights on free nonwhites. Three Blacks were elected to the legislative
assembly the following year. Slavery was abolished in 1838 and Dominica became the first and
only British Caribbean colony with a Black-controlled legislature in the 19th century.
Dominica became part of the Leeward Island Federation in 1871 and the Crown Colony
government was re-established in 1896. Political rights for the vast majority of the population
were curtailed.
Heightened political consciousness post World War I led to a Representative Government
Association. The group successfully captured one-third of the popularly elected seats of the
legislative assembly in 1924 and one-half in 1936. Dominica subsequently was transferred from
the Leeward Island Administration and was governed as part of the Windwards until 1958, when
it joined the short-lived West Indies Federation.
After the federation was dissolved, Dominica became an associated state of the United Kingdom
in 1967 and formally took responsibility for its internal affairs. On November 3, 1978, the
Commonwealth of Dominica was granted independence by the United Kingdom.
IV. Demographics
As of 2010 Dominica’s population was estimated at 72,729with an annual growth rate of 0.6%
and density of 96.5 per square kilometer. Males account for 50.9% of the total population while
females account for 49.1%. GDP per capita was estimated at $ 17,961. Life expectancy at birth is
74.1 years while infant mortality per thousand live births is 13. Adult literacy is 88.0%.

13
Page
13
According to the most recent Country Poverty Assessment (2010), the unemployment rate has
declined from 25.0% to 14.0%.
Table 1 - Age distribution of the Dominican population
Age Group Males Females Total
% of Total
Population
0-4 3,328 3,140 6,468 8.9
5-9 4,046 3,689 7,735 10.6
10-14 3,643 3,631 7,274 10.0
15-19 3,534 3,447 6,981 9.6
20-24 2,496 2,191 4,687 6.4
25-29 2,663 2,580 5,243 7.2
30-34 2,955 2,844 5,799 8.0
35-39 2,908 2,513 5,421 7.4
40-44 2,474 2,108 4,582 6.3
45-49 1,993 1,652 3,645 5.0
50-54 1,502 1,385 2,887 4.0
55-59 1,238 1,210 2,448 3.4
60-64 1,046 1,262 2,308 3.2
65-69 1,117 1,262 2,379 3.3
70-74 891 996 1,887 2.6
75-79 610 754 1,364 1.9
80-84 372 576 948 1.3
85+ 304 567 871 1.2
Total 37,120 35,807 72,927
Ability to influence future growth and demand for services
Education
During the review period the education policy of Government was geared towards improving the
quality and relevance of the education system. Government was primarily focused on changing
the nature, form and content of primary and secondary education, while strengthening and
expanding welfare and support services and developing a quality system for Technical
Vocational Education and Training (TVET). Government’s commitment to educating the
populace continued to be reflected in the distribution of its financial resources. During the fiscal
year 2014/15, Government will be investing $70.1 million in education or 4.9% of GDP, with the
view of investing significantly more in the coming fiscal years.

14
Page
14
Social Infrastructure
Public Sector expenditure on social infrastructure has been steady over the past four (4) fiscal
years averaging 12.4% of total capital spending. In an effort to minimize the impact of the global
recession on vulnerable groups, the government sought to contain unemployment and poverty by
providing a fiscal stimulus. This was done through the Public Sector Investment Programme
which created many jobs as the portfolio of projects was increased. The extent of the stimulus is
reflected in the total PSIP expenditure which is at $173.8 million or 12.7% of GDP.
V. Political
National elections were held in December 2014 and Dominica scores well on a number of
governance indicators. The increase in the Dominica Labor Party’s majority suggests a strong
mandate to continue with the government’s economic and political agenda. Dominica has strong
ratings for voice and accountability, political stability, government effectiveness, control of
corruption, regulatory quality, and the rule of law.
VI. Management and Administration of Public Finance
Debt management functions are coordinated among the Ministry of Finance (MOF) Debt Unit,
the Accountant General’s Office, and the Attorney General’s chambers. The Debt Unit (DU),
which operates under the control of the Budget Comptroller in the MOF, leads debt management
strategy and implementation. The Public Debt and Cash Management Committee in the MOF
oversee the debt management operations. The Public Debt and Cash Management Committee is
comprised of the Financial Secretary, the Budget Comptroller, the Accountant General and the
Debt Economist.
1. Debt Management Objectives
The GOCD’s high-level debt management objective is “to ensure that the GOCD’s financing
needs and obligations are met on a timely basis. To do so in a way that minimizes cost over the
medium to long term, while taking account of risks, and subject to that, to develop over time a
range of financing options.”
Guided by the foregoing the GOCD seeks to ensure that the GOCD’s debt management policies
over the medium to long term support fiscal and monetary policy and help build a robust and
resilient economy, able to withstand economic shocks. As such, the GOCD purports to lower
public debt as a percentage of GDP to 60.0% by Financial Year (FY) 2020.

15
Page
15
2. Debt management Strategy
The overall debt management strategy hinges on the objectives of lowering the debt to GDP ratio
to 60.0% by FY 2020 and minimizing borrowing costs. The GOCD recognizes the need to factor
the impact of fluctuations in exchange rates on debt servicing costs and takes this into account in
formulating its debt management strategy. The underlying elements guiding the strategy are:
Limiting variable rate funding to no more than 15.0% of the public debt portfolio;
Limiting non-US dollar external financing to a maximum of 20.0% of the public debt
portfolio;
Maintaining an Average Time to Maturity (ATM) of 9 years to minimize refinancing
risk’
Maintaining government guaranteed debt at 17.0% of total debt stock.
The overall debt management strategy also includes the provision of legal borrowing limits. The
issuance of Treasury Bills, for example, is limited to EC$60.0 million. Additionally, the
authorities have capped the overdraft facility at $31.5 million in totality. There are no borrowing
limits for loans.
3. Transparency and Accountability
The GOCD is continuously seeking ways of improving its systems of accountability and
transparency. As the authorities continue to adopt more prudent and transparent fiscal
management practices, they intend to continue to utilize the Regional Government Securities
Market (RGSM). As a consequence, disclosure of information on the cash flow and debt stock
will be made available bi-annually to all investors, consistent with the rules of the Regional Debt
Coordinating Committee (RDCC).
4. Institutional Framework
The Debt Unit (DU) of the Ministry of Finance (MOF) of the GOCD is charged with the
responsibility of administering the Government’s debt portfolio on a day-to-day basis and
implementing the Government’s borrowing strategy. The unit is directly accountable to the
Budget Comptroller.
5. Risk Management Framework
The establishment of an effective and efficient debt management system as a major element of
economic management is of paramount importance to the government of the Commonwealth of
Dominica. Accordingly, attempts have been made to strengthen the capacity of the debt unit
(DU). Consequently, the DU’s functions have been broadened to include:
Assisting in the formulation of debt management strategies and policies
Managing the debt portfolio to minimize cost with an acceptable risk profile

16
Page
16
Conducting risk analysis and developing risk management policies; and
In collaboration with the Macro-policy Unit, conduct debt sustainability analysis to
assess optimal borrowing levels.
Debt restructuring programme: an experience to learn from
In the financial year 2004/2005 the Government of Dominica undertook a debt restructuring
programme which took the form of debt forgiveness, debt conversion, and extension in maturity
period, reduction in interest rates, and debt consolidation. As part of the debt restructuring,
bondholders were offered three categories of bonds at 3.5% interest as follows:
Short bond – 30.0% haircut1 and 10 years amortized maturity
Intermediate bond – 20.0% haircut and 20 years amortized maturity
Long bond – no haircut and 30 years amortized maturity.
The debt restructuring programme has been very successful with 99.9% being restructured. The
Government of Dominica is committed to the pledges made to creditors, in the Offer Circular
dated April 06, 2004. In this regard an Escrow account was established for debt service
payments on restructured terms, to be paid to non-participating creditors upon completion of
negotiations and all outstanding payments have been paid. Additionally, Government continues
to make payments on the intermediate bonds while the short bonds have been fully paid.
CariCRIS Credit rating
The Caribbean Information and Credit Rating Services Limited (CariCRIS) has assigned ratings
on the USD 25 million debt issue (notional) of the Government of the Commonwealth of
Dominica (GOCD) of CariBBB- (Foreign Currency Rating) and CariBBB- (Local Currency
Rating) on its regional rating scale. These ratings indicate that the level of creditworthiness of
this obligation, adjudged in relation to other obligations in the Caribbean is adequate.
The ratings reflect Dominica’s favourable performance in the last 3 years relative to its regional
peers in key areas such as economic growth and fiscal performance. The ratings of the GOCD
reflect its prudent fiscal policy, relatively low indebtedness, moderate monetary indicators,
relatively healthy external sector performance and consistency in economic policies in a stable
political environment.
1 Hair Cut: A reduction in the principal amount of the bond.

17
Page
17
V11. Public Debt Overview
At the end of June 2014, total disbursed outstanding debt of the public sector2 stood at $ 1.03
billion or 75.5% of GDP3. This is, approximately 5.7% above the outstanding amount at the end
of July 2013 on account of a 6.3% increase in central government debt to $867.54 million. The
public corporations outstanding debt increased by 2.9% ($159.26 million). Alternatively, gross
external debt increased by $46.12 million to stand at $749.27 million while domestic debt
increased by $9.39 million to stand at $277.58 million at the end of June 2014 (see Table 2). The
structure of public and publicly guaranteed debt shows that 27.0% of the total debt is domestic
while 73.0% is external as shown in Figure 1.
Table 2: Size of Public Debt, end June 2014 (in EC $) with July 2013 comparative
Domestic External
TOTAL
Jun-14 Jul-13 Jun-14 Jul-13 Jun-14 Jul-13
Central
Government
230,150,319
220,556,723
637,393,490
595,940,486
867,543,809
816,497,209
Guarantees
47,426,873
47,626,221
111,833,367
107,165,826
159,260,240
154,792,047
TOTAL
277,577,192
268,182,944
749,226,857
703,106,312
1,026,804,049
971,289,256
Total
Guarantees/Total
Public Debt
15.5% 15.9%
Percentage of
Total Public Debt
27.0% 27.6% 73.0% 72.4%
Source: Debt Unit and Macro Policy Unit
The increase in the debt stock was the result of an increased reliance on public external
borrowing, as capital grants- a traditional source of financing- fell short of target and foreign
direct investment remained subdued.
The increase in the domestic debt stock largely reflected increases in the obligations of central
government associated with an increase in loans and advances.
2 Includes both central government and central government guaranteed debt
3 Based on nominal GDP of $1.365 billion

18
Page
18
Figure 1: Composition of Public Debt
Source: Debt Unit and Macro Policy Unit
Cost/Risk Characteristics of Public Debt
The Government external debt strategy is one of contracting or guaranteeing external loans with
highly concessional terms to minimize interest rate cost. In addition, the Government seeks to
lengthen the maturity structure of total public sector debt to minimize refinancing risk in line
with the Medium Term Debt Strategy.
Size of Public and Publicly Guaranteed External Debt
Overall, public and publicly guaranteed external debt increased on an account of an increase in
loans.
Table 3: External debt (by instrument) in EC$
Jul-13 June-14 Central Government
Loans 491,981,845 539,287,453
Bonds 92,988,641 87,136,038
Treasury Bills 10,970,000 10,970,000
595,940,486 637,393,491
Guarantees 107,165,826 111,833,367
Total 703,106,312 749,226,857
External Debt
73.0%
Domestic
Debt
27.0%

19
Page
19
Source: Debt Unit. Differences due to rounding
Figure 2: Components of Total External Debt – June 2014
Source: Debt Unit
Figure 3 indicates the currency composition of external debt. It shows that US dollars form the
largest share of the external debt portfolio at 50.2% followed by the Special Drawing Rights
15.1%.
Figure 3: Currency Composition of External Debt at the end of June 2014
Source: Debt Unit, Ministry of Finance
72.0%
11.6% 1.5%
14.9% 16.4%
Loans Bonds Treasury Bills Guarantees
1.8%
10.2%
9.1%
1.6%
15.1% 50.2%
12.1% Barbados Dollars
Eastern Caribbean Dollars
Euro
European Currency Units
Kuwaiti Dinars
Special Drawing Rights
US Dollars
Yuan Renminbi

20
Page
20
Domestic Debt
At the end of June 2014, debentures continued to hold the largest proportion of the domestic debt
amounting to $116.63 million or 42.01% as shown in Table 4 and Figure 4.
Table 4: Domestic Debt by Instrument – June 2014
Instrument $
Overdraft 18,068,920
Loans 43,953,518
Debentures 116,624,881
Treasury Bills 51,503,000
Government Guarantees 47,426,873
Total 277,577,192
Source: Debt Unit, Ministry of Finance
The structure of the holding is consistent with the debt strategy of holding more domestic debt on
longer dated instruments to minimize refinancing risk and promote development of domestic
markets for Government securities.
Figure 4: Components of Total Domestic Debt- June 2014
Source: Debt Unit, Ministry of Finance
Debt service payment for the fiscal year 2013/2014 is estimated at $53.31 million, an increase of
18.1% above the total recorded during the previous fiscal year. Of total debt service payments,
principal repayments comprised of $26.94 million or 50.5% and interest payments accounted
$26.37 million for 49.5% of total debt servicing.
Overdraft 6.5%
Loans and Advances
15.8%
Debentures 42.0%
Treasury Bills 18.6%
Government Guarantees
17.1%

21
Page
21
Developments on the Regional Government Securities Market (RGSM)
Dominica performance on the Regional Government Securities Market (RGSM) has been
reasonably good since its first issuance of securities on February 24th
2012. During the period
July 2013 to June 2014, Dominica’s gross issuance on the RGSM totaled $80.0 million.
Table 5: Dominica’s RGSM Auction Results during the period July 2013 - June 2014
Auction date
Issue Amount
(EC$ million)
Value of Bids
(EC$ million)
Amount Accepted
(EC$ million)
Over Subscription (EC$ million)
Interest Rate
%
Tenor
10 Sep. 2013
20.0 25.110 20.0 5.110 2.500 91 days
12 Dec. 2013
20.0 25.911 20.0 5.911 2.499 91 days
18 Mar 2014
20.0 49.437 20.0 29.437 1.999 91 days
19 Jun 2014
20.0 25.500 20.0 5.500 1.99 91 days
Total 80.0 125.958 80.0 45.958
Source: ECCB
VIII. Macro-Economic Performance
Overview
Economic activity in Dominica is estimated to have grown marginally during fiscal year
2013/2014 following a contraction in the previous fiscal year. However, sectoral data reveal
mixed performance in the more traditional contributors to gross domestic product (GDP)
including Agriculture, Livestock & Forestry, Construction and Tourism. Consumer prices
decelerated influenced by a moderate decrease in the heavy weighted index category of Housing,
Water, Electricity, Gas and Other Fuels. However the Food Only Index registered an increase.
For the fiscal year under review, both the current account balance and capital and financial
account balance of the balance of payments is projected to have improved (as a percentage of
gross domestic product). According to a preliminary outturn, the fiscal operation of central
government recorded a lower overall fiscal deficit for the fiscal year 2013/2014 relative to the
outturn in the previous fiscal year 2012/2013 largely influenced by a decline in capital
expenditure. Notwithstanding the smaller overall deficit, outstanding public sector debt rose
mainly through an increase in external debt.
Over the next few years, the Dominican economy is expected to continue on a growth path with
contribution from all the major sectors. Inflation is projected at the usual two (2) percent rate.
The Central Government’s overall balance is projected to improve, although expected to remain
in deficit on account of less than favourable expectations primarily regarding current spending,

22
Page
22
non-tax revenues and grant financing. However, this outlook is likely to be better if fiscal
consolidation is undertaken complemented by appropriate structural measures to engender a
growth-centric environment. Downside risks to this outlook are diverse and include
vulnerability to natural disasters and global downside risks which could reduce concessional
external financing, particularly grants from donors, exports and remittances.
Gross Domestic Product/Output
Against the economic backdrop of a challenging external environment, Dominica’s GDP (at
market prices) is estimated to have grown by 0.8% in fiscal year 2013/2014 in contrast to a
contraction of 1.1% in 2012/2013, albeit, the economic picture was mixed.
According to preliminary data, the performance of the Agriculture, Livestock and Forestry
sector, a major sector of the Dominican economy, improved compared to 2012/2013. Indications
are that banana production has begun to stabilize since the onset of Black Sigatoka disease in
2012 following action to contain the contamination. Recovery in this sector was further assisted
by an increase in the output of other crops and livestock. The rise in the livestock subsector
reflected an increase in egg and poultry production.
During the 2013/2014 fiscal year, Construction activity, a major contributor to growth, was
mixed. The bulk of construction activity was supported by public sector projects, predominantly
road improvement works, while private-sector construction activity weakened as evidenced by
fewer construction starts and reduced cement sales. Notwithstanding, public sector construction
was still subdued relative to previous fiscal years as indicated by a reduction in expenditure
under the public sector investment programme as a result of fewer grant receipts to finance the
programme. Output in the mining and quarrying sector which is closely related to construction
activity is estimated to have expanded as suggested from increased cargo loadings.
The expansion in GDP during the fiscal year under review was further supported by the on-going
recovery in the manufacturing sector led by an increase in the production of soaps, beverages and
paint.
Utility production was also mixed, with electrical generation slightly down and water
consumption slightly up. Mixed activity was also experienced in service sectors. Rebounding
cargo landings suggest firmer household consumption with a consequent improvement in
wholesale and retail activity. In contrast, tourism indicators pointed to weaknesses in both the
stay-over and cruise ship segments of the sector as cruise ship calls remained low and tourism
receipts in the more lucrative stay-over market fell with reduced expenditure per tourist.
Financial intermediation was estimated to have grown very little on account of weaknesses in the
financial sector. Business services was estimated to have been restrained while education was
estimated to have grown slightly as the ceiling on medical students is not expected to be raised

23
Page
23
until additional capacity is added at the major offshore medical school. The graph below shows
real GDP growth from fiscal year 2009/2010 to 2013/2014.
Figure 5: Real GDP growth 2009/2010 – 2013/2014
Source: Ministry of Finance
Prices
For the fiscal year under review, it is estimated that consumer prices (end-of-period) declined by
0.1% in contrast to inflation of 1.4% for the fiscal year 2012/2013. The downward movement in
prices emanated primarily from a decline in prices for the heaviest weighted sub-index of
Housing, Water, Electricity, Gas and Other Fuels largely driven by the lower price of electricity.
The decrease in the CPI was further assisted by a decline in the second heaviest sub-index of
Transport. The declines in the two said sub categories constrained the increase in the
subcategory of Food and Non-alcoholic beverages.
Balance of Payments
During fiscal year 2013/2014, Dominica’s external position improved in contrast to deterioration
in fiscal year 2012/2013. It is projected that the current account deficit will narrow from $254.85
million or (-18.9%) of GDP in 2012/2013 to $229.85 million or (-16.6%) of GDP in fiscal year
2013/2014. The surplus on the capital and financial account is projected to increase from
$197.25 million or 14.6% in fiscal year 2012/2013 to $211.10 million or 15.2% in fiscal year
2013/2014.
(1.1)
1.2
0.20
(1.1)
0.8
2009/2010 2010/2011 2011/2012 2012/2013 2013/2014
24
Page
24
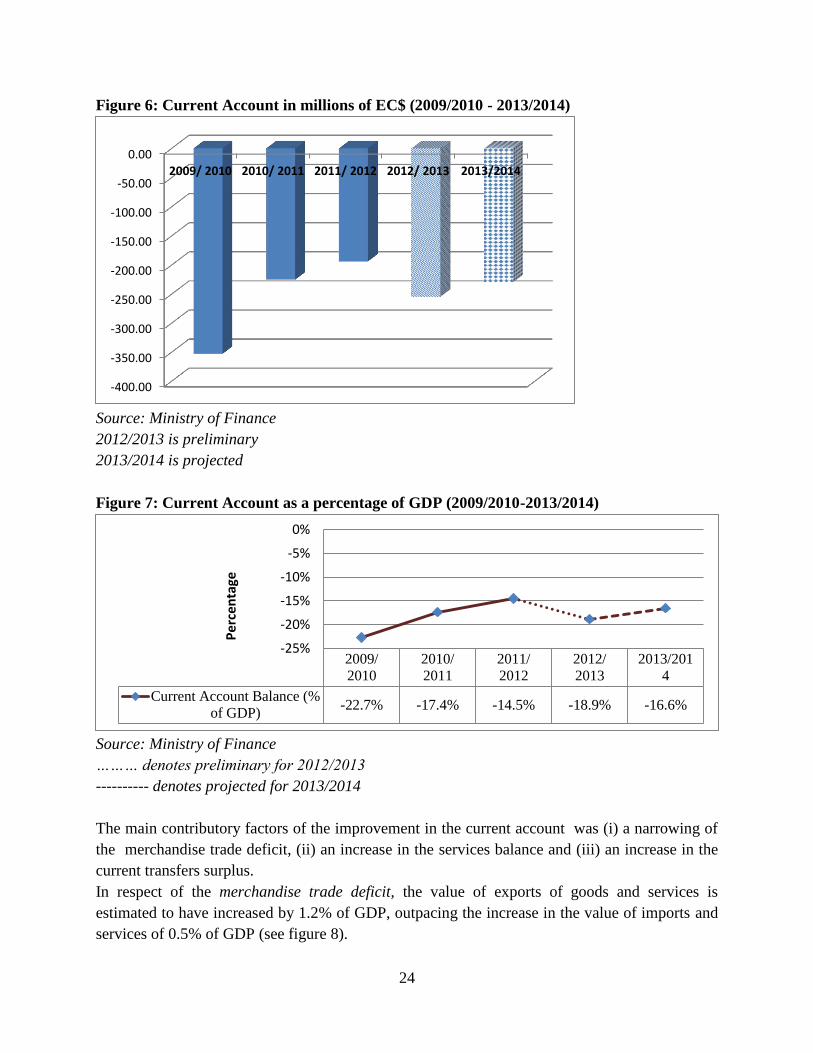
Figure 6: Current Account in millions of EC$ (2009/2010 - 2013/2014)
Source: Ministry of Finance
2012/2013 is preliminary
2013/2014 is projected
Figure 7: Current Account as a percentage of GDP (2009/2010-2013/2014)
Source: Ministry of Finance
……… denotes preliminary for 2012/2013
---------- denotes projected for 2013/2014
The main contributory factors of the improvement in the current account was (i) a narrowing of
the merchandise trade deficit, (ii) an increase in the services balance and (iii) an increase in the
current transfers surplus.
In respect of the merchandise trade deficit, the value of exports of goods and services is
estimated to have increased by 1.2% of GDP, outpacing the increase in the value of imports and
services of 0.5% of GDP (see figure 8).
-400.00
-350.00
-300.00
-250.00
-200.00
-150.00
-100.00
-50.00
0.00
2009/ 2010 2010/ 2011 2011/ 2012 2012/ 2013 2013/2014
2009/
2010
2010/
2011
2011/
2012
2012/
2013
2013/201
4
Current Account Balance (%
of GDP)-22.7% -17.4% -14.5% -18.9% -16.6%
-25%
-20%
-15%
-10%
-5%
0%
Pe
rce
nta
ge

25
Page
25
Figure 8: Exports and Imports of Goods and Services (as a percentage of GDP) 2009/2010-
2013/2014
Source: Ministry of Finance
………. denotes that 2012/2013 is preliminary
---------denotes that 2013/2014 is projected
In respect of exports , manufacturing exports picked up a bit, particularly in the soap, beverage
and paint industries which more than compensated for the loss of revenue from banana exports.
In respect of imports, food and fuel import bills remained hefty, as international prices remained
elevated. Tourism revenue is expected to exhibit very slight improvement despite a estimated
decline in revenue from the stay-over sector. However, the actual decrease of receipts from the
Economic Citizenship programme (ECP) constrained the improvement in the services balance.
On initial assessment the surplus on the Capital and Financial Account was projected to increase
from 14.6% of GDP to 15.2% of GDP on account of higher capital grant receipts while net
receipts from foreign direct investments remained flat. However, it is unlikely that the surplus on
the Capital and Financial Account would have improved during the fiscal year under review
given:
i. lower capital grant receipts,
ii. flat net receipts from foreign direct investments,
iii. lower disbursements of loan funds
iv. Dominicans being very active in the Regional Government Securities Market
instruments of other countries in the Eastern Caribbean Currency due to higher interest
rates obtained4.
The estimate for the capital and financial account, in addition to the current account will be
confirmed on validation of the National Accounts Survey.
4 Active participation in external instruments is an outflow.
2009/ 2010 2010/ 2011 2011/ 2012 2012/ 2013 2013/2014
Exports of Goods and
Services (% of GDP)31.0% 36.1% 38.1% 32.7% 33.9%
Imports of Goods and
Services (% of GDP)54.8% 55.7% 53.9% 51.3% 51.8%
0%10%20%30%40%50%60%
Pe
rcen
tage

26
Page
26
Figure 9: Capital and Financial Account as a percentage of GDP (2009 - 2013)
Source: Ministry of Finance
………. denotes that 2012/2013 is preliminary
---------denotes that 2013/2014 is projected
Financial Sector Analysis
The financial system in Dominica is relatively small among its peers in the ECCU, with about
17.0% of GDP in assets. Banks (one domestic and three foreign) dominate the financial sector,
however, credit unions play a much more significant and dynamic role in Dominica given its
agriculture dependent economy. Credit unions account for a third of total financial system assets
and their membership covers 83.0% of the population, the highest penetration in the world.
Financial soundness indicators suggest that domestic banks coped relatively well with the recent
weak macroeconomic environment. Modest credit expansion prior to the crisis limited the
accumulation of nonperforming assets. This, together with weaker provisioning against loan
losses, explains the resilience of banks’ capital ratios, which strengthened to 10.3% by end-
2010, above the 8.0% minimum regulatory requirement.
Increased efforts in the nonbanking system, such as the passage of the legal framework for the
regulation and supervision of nonbanks, and the supplementary credit union legislation and
drafting of the insurance legislation, as well as strengthening of the Financial Services Unit, are
all efforts aimed at ensuring financial stability. The authorities have also endeavored to become
more proactive in monitoring and tackling of existing vulnerabilities to ensure that they do not
pose any risks to macro stability.
2009/
2010
2010/
2011
2011/
2012
2012/
2013
2013/201
4
Capital and financial account
balance (% of GDP)22.8% 18.5% 18.0% 14.6% 15.2%
0%
5%
10%
15%
20%
25%
Pe
rcen
tage

27
Page
27
IX. Fiscal Performance
The consolidated fiscal operations of central government resulted in an estimated smaller overall
deficit of $46.33 million for the fiscal year 2013/2014 compared with one of $71.84 million in
the previous fiscal year. This outturn was associated with an estimated decline in capital
expenditure coupled with an estimated contraction in grant receipts. The primary deficit is
estimated to have improved slightly to $19.96 million from $46.49 million in fiscal year
2012/2013 despite a slight increase in interest payments.
Table 6: Revenue and Expenditure Comparisons for Fiscal Year 2013/2014
Indicator Actual
Outturn Original Budget
Estimate
Actual as a percentage of original estimate
Variance Actual vs Budget
REVENUE and GRANTS 414.7 491.51 84.34 (76.96) REVENUE 369.7 407.00 90.80 (37.45)
Current Revenue 369.4 401.45 91.98 (32.18) Capital Revenue 0.3 5.55 5.05 (5.27)
GRANTS 45.00 84.51 53.25 (39.51)
Current Grants 0 7.00 0.00 (7.00) Capital Grants 45.00 77.51 58.06 (32.51)
EXPENDITURE 460.88 491.22 93.82 (30.34)
Current Expenditure 331.47 329.03 100.74 2.44 Capital Expenditure 130.00 163.59 79.47 (33.59)
Net lending (0.59) (1.40) 42.14 0.81
Overall Balance
(including grants and net lending)
(46.33) 0.29
(46.62)
Primary Balance (including grants and net
lending) -19.96 22.19 (89.95) (42.15)
Primary Balance (% of GDP) -1.5% 1.6% (92.26) (0.030)
Source: Macro Policy Unit, Ministry of Finance

28
Page
28
Table 7: Revenue and Expenditure Comparisons for Fiscal Years 2009/2010 to 2012/2013
2009/ 2010
2010/ 2011
2011/ 2012
2012/ 2013
TOTAL REVENUE AND GRANTS 475.94 476.79 406.48 408.94
TOTAL REVENUE 361.80 349.94 345.41 372.33
Current Revenue 360.74 348.11 343.60 370.93
Tax Revenue 326.84 308.24 300.24 299.04
Taxes on Income & Profits 60.78 57.05 55.53 58.11
Taxes on Property 8.87 7.81 7.45 6.73
Taxes on Domestic Goods & Services 185.24 176.10 173.11 176.75
Taxes on International Trade & Transactions 71.95 67.27 64.15 57.44
Non Tax Revenue 33.89 39.87 43.36 71.90
Capital Revenue 1.06 1.82 1.81 1.40
Total Grants 114.14 126.86 61.08 36.61
TOTAL EXPENDITURE 475.08 529.52 466.08 480.78
Current Expenditure 293.29 311.15 309.24 336.75
Personal Emoluments 126.23 134.96 135.51 146.47
Goods & Services 82.68 86.07 87.90 96.67
Interest Payments 17.80 20.61 18.13 25.35
Transfers & Subsidies 66.59 69.52 67.70 68.27
Capital Expenditure 183.28 220.24 156.99 144.03
Net lending -1.49 -1.87 -0.15 0
Overall Balance (after grants) 0.85 -52.73 -59.60 -71.84
Primary Balance (after grants) 18.65 -32.12 -41.47 -46.49
Primary Balance (after grants) as percent of
GDP
1.44% -2.46% -3.11% -3.47%
Nominal GDP at Market Prices
1,293.00
1,305.00
1,333.00
1,341.00

29
Page
29
Current Revenue
It is estimated that current revenue fell by 0.5% ($1.66 million) to $369.27 million, constrained
by a reduction in non-tax revenue receipts, especially from the Economic Citizenship
Programme. The other component of current revenue, tax revenues, is estimated to have risen by
1.6% ($4.75 million) to $303.79 million. The preliminary outturn for the entire fiscal year will be
8.1% ($32.18 million) short of the targeted amount of $ 401.45 million.
Table 8: Current Revenue (in $millions)
Indicator
Year to Date:
July 2013
to
June 2014
Original
Budget
Estimate
Actual as a
percentage of
budget estimate
Variance
Actual vs
Budget
(absolute)
Current Revenue 369.27 401.45 91.98 (32.18)
Tax Revenue 303.79 311.07 97.66 (7.28)
Non-tax Revenue 65.48 90.38 72.45 (24.90)
Brackets denote a shortfall in revenue collection.
Table 9: Non Tax Revenue (in $millions) for the fiscal year 2013/2014
Indicator
Year to Date
July 2013
to
June 2014
Original
Budget
Estimate
Actual as a
percentage of
budget
estimate
Variance
Actual vs
Budget
TOTAL 65.48 90.38 72.45 (24.90)
ECCB Profits 0 1.50 0.00 (1.50)
Rents & Interest 1.87 4.50 41.56 (2.63)
Fees, Fines and Sales 13.19 11.95 110.38 1.24
Financial Services 0.09 3.07 2.93 (2.98)
Economic Citizenship
Programme 46.69 61.60 75.80 (14.91)
Other Non - Tax Revenue 3.65 7.76 47.04 (4.11)
30
Page
30
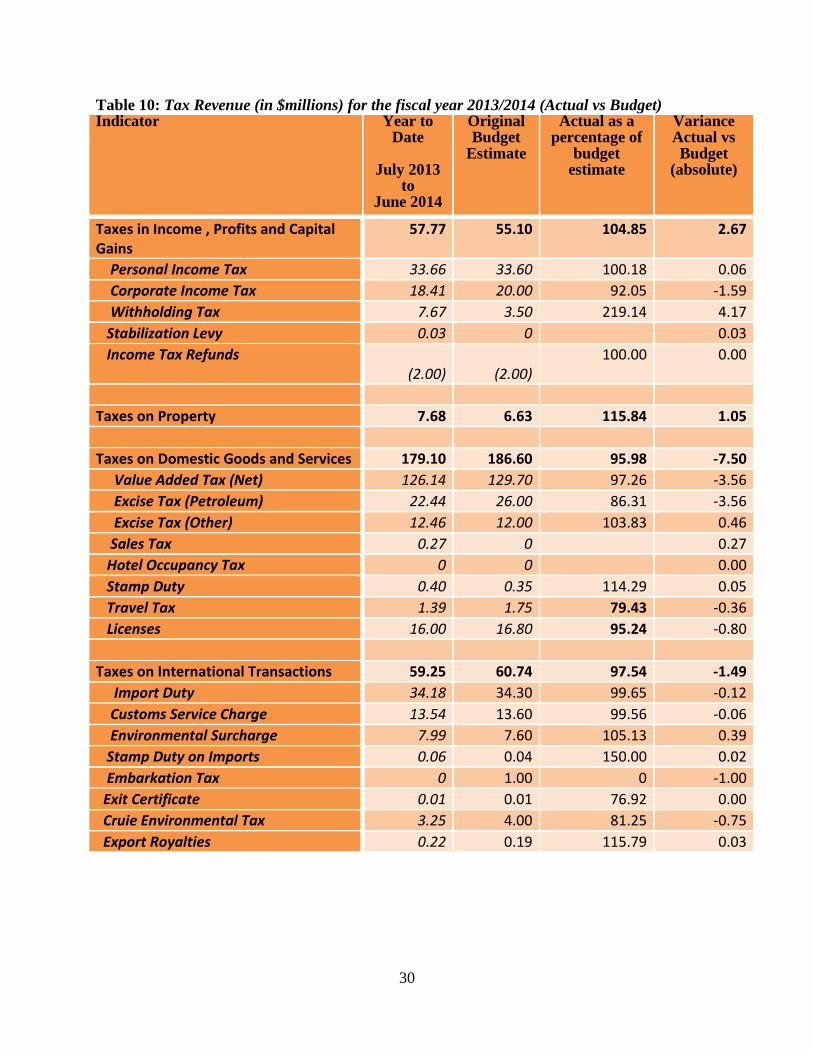
Table 10: Tax Revenue (in $millions) for the fiscal year 2013/2014 (Actual vs Budget) Indicator Year to
Date
July 2013 to
June 2014
Original Budget
Estimate
Actual as a percentage of
budget estimate
Variance Actual vs Budget
(absolute)
Taxes in Income , Profits and Capital Gains
57.77 55.10 104.85 2.67
Personal Income Tax 33.66 33.60 100.18 0.06
Corporate Income Tax 18.41 20.00 92.05 -1.59
Withholding Tax 7.67 3.50 219.14 4.17
Stabilization Levy 0.03 0 0.03
Income Tax Refunds (2.00)
(2.00)
100.00 0.00
Taxes on Property 7.68 6.63 115.84 1.05
Taxes on Domestic Goods and Services 179.10 186.60 95.98 -7.50
Value Added Tax (Net) 126.14 129.70 97.26 -3.56
Excise Tax (Petroleum) 22.44 26.00 86.31 -3.56
Excise Tax (Other) 12.46 12.00 103.83 0.46
Sales Tax 0.27 0 0.27
Hotel Occupancy Tax 0 0 0.00
Stamp Duty 0.40 0.35 114.29 0.05
Travel Tax 1.39 1.75 79.43 -0.36
Licenses 16.00 16.80 95.24 -0.80
Taxes on International Transactions 59.25 60.74 97.54 -1.49
Import Duty 34.18 34.30 99.65 -0.12
Customs Service Charge 13.54 13.60 99.56 -0.06
Environmental Surcharge 7.99 7.60 105.13 0.39
Stamp Duty on Imports 0.06 0.04 150.00 0.02
Embarkation Tax 0 1.00 0 -1.00
Exit Certificate 0.01 0.01 76.92 0.00
Cruie Environmental Tax 3.25 4.00 81.25 -0.75
Export Royalties 0.22 0.19 115.79 0.03

31
Page
31
Figure 10: Comparison of Revenue by Tax Type for Fiscal Years 2009/2010 - 2013/2014
Source: Macro Policy Unit, Ministry of Finance
- - - - - denotes the actual outturn for 2013/2014
Higher tax revenues were associated with increases in the collection of taxes on property
(14.0%), taxes on international trade and transactions (3.2%) and taxes on domestic goods and
services(1.3%), partially offset by a decline in taxes on income and profits (0.6%). The decline in
taxes on income and profits was largely influenced by the shortfall in corporate income tax.
However, overall the amount of taxes on income and profits exceeded the budget estimate of
$55.10 million. Higher than estimated receipts from taxes on international trade and
transactions for the fiscal year 2013/2014 was largely influenced by increases across the main
categories including import duty (5.1%), environmental surcharge (3.9%) and customs service
charge (1.4%). Receipts from taxes on domestic goods and services for the year under review
were higher than the previous fiscal year on account of improved performance of the value added
tax which outpaced the declines in receipts from excise tax and licenses. An increase in gross
VAT was recorded coupled with fall in the amount paid out as refunds due to cash management
issues.
2009/2010 2010/2011 2011/2012 2012/2013 2013/2014
Taxes on Income & Profits 60.78 57.05 55.53 58.11 57.77
Taxes on Property 8.87 7.81 7.45 6.73 7.67
Taxes on Domestic Goods &Services
185.24 176.10 173.11 176.75 179.10
Taxes on International Tradeand Transactions
71.95 67.27 64.15 57.44 59.25
TOTAL TAX REVENUE 326.84 308.24 300.24 299.04 303.79
0
50
100
150
200
250
300
350
Am
ou
nt
in E
C$
mill
ion

32
Page
32
Current Expenditure
The table below shows that all expenditure sub-categories of current expenditure, with the
exception of personal emoluments, exceeded the budgetary allocation for the fiscal year
2013/2014.
Table 11: Expenditure (in $millions) for the fiscal year 2013/2014 (Actual vs Budget)
Indicator Year to
Date
Original
Budget
Estimate
Actual as a
percentage of
budget
estimate
Variance
Actual vs
Budget
(absolute)
Total Expenditure = a + b + c 460.88 491.21 93.82 (30.33)
Current Expenditure (a) = (i) + (ii) + (iii)
+(iv)+ (v) 331.47 329.03 100.74 2.44
Personal Emoluments (i) 144.12 148.82 96.84 (4.70)
Salaries (including salaried
allowances) 124.68 132.93 93.79 (8.25)
Wages 4.93 5.94 82.99 (1.01)
Other Allowances 14.51 9.95 145.82 4.56
Good and Services (ii) 92.36 88.78 104.03 3.58
-
Interest Payments (iii) 26.37 21.94 120.17 4.43
Domestic 11.45 9.10 125.83 2.35
Foreign 14.92 12.84 116.16 2.08
Transfers and Subsidies (iv) 68.62 67.48 101.69 1.14
Gratuities and Pension 23.47 22.50 104.31 0.97
Grants and Contribution to Local,
Regional and International Institutions 38.25 37.69 101.49 0.56
Public Assistance and Casual Relief 6.90 7.29 94.59 (0.39)
Refunds (v) 0 2.00 0 (2.00)
Capital Expenditure (b)5 130.00 163.59 79.47 (33.59)
Grant 45.00 77.51 58.05 (32.51)
Other 85.00 86.08 98.75 (1.08)
Net lending (c ) (0.59) (1.40) 42.14 0.81
On-lending 0 0
Loan repayment (0.59) (1.40) 42.14 0.81
5 The amount of $130 million is projected to account for project expenses which have not been
journalized.

33
Page
33
Overall current expenditure is estimated to have decreased by 4.1% ($19.90 million) from
$480.78 million in fiscal year 2012/2013 to $460.88 million for the fiscal year under review.
This contrasts with a 8.9% increase in 2012/2013. The outturn for 2013/2014 largely reflected a
decrease in outlays on goods and services by 4.44 percent in contrast to an expansion of 10.0%
in fiscal year 2012/2013. Higher interest payments (4.0%) were also recorded particularly
domestic interest payments while external interest payments are estimated to be lower than the
previous fiscal year. Outlays on personal emoluments decreased by 1.6% ($2.35 million)
influenced by a decrease in salaries, salaried allowances and wages which surpassed the slight
increase in other allowances.
Figure 11: Comparison of Current Expenditure Categories for Fiscal Years 2009/2010 -
2013/2014
Source: Macro Policy Unit, Ministry of Finance
- - - - - denotes the preliminary outturn for 2013/2014
The wage bill which totaled 10.6% of GDP was below the target of 12.3% of GDP. Expenditure
on transfers and subsidies increased marginally by 0.5% or $0.34 million during the period under
review.
Capital Expenditure
Outlays on capital expenditure registered a decline for the third consecutive fiscal year largely as
a result of lower than expected grant receipts for the financing of the overall capital investment
programme which is often more than 60.0% financed with grant resources6. Overall, the
6 Lower disbursement of grant resources was partly influenced by the pace of project implementation
2009/2010 2010/2011 2011/2012 2012/2013 2013/2014
Personal Emoluments 126.23 134.96 135.51 146.47 144.12
Goods & Services 82.68 86.07 87.90 96.67 92.36
Interest Payments 17.80 20.61 18.13 25.35 26.37
Transfers & Subsidies 66.59 69.52 67.70 68.27 68.62
Total Current Expenditure 293.29 311.15 309.24 336.75 331.47
0
50
100
150
200
250
300
350
400
Am
ou
nt
in E
C$
mill
ion
34
Page
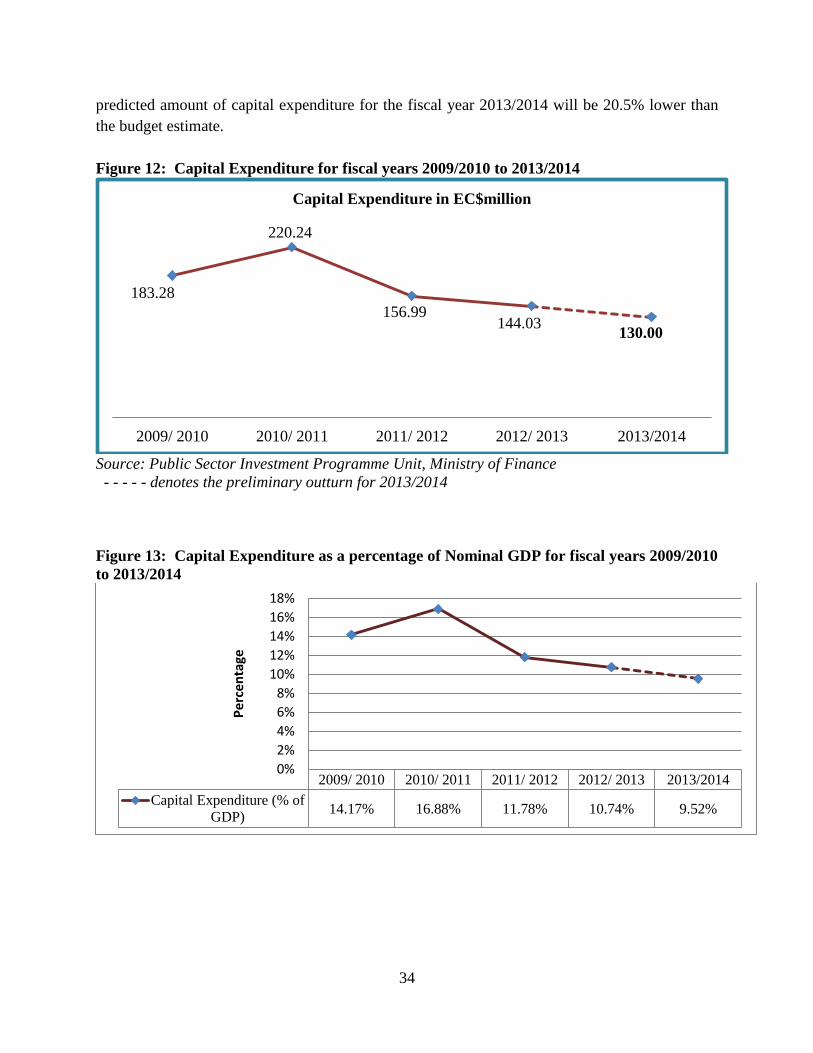
34
predicted amount of capital expenditure for the fiscal year 2013/2014 will be 20.5% lower than
the budget estimate.
Figure 12: Capital Expenditure for fiscal years 2009/2010 to 2013/2014
Source: Public Sector Investment Programme Unit, Ministry of Finance
- - - - - denotes the preliminary outturn for 2013/2014
Figure 13: Capital Expenditure as a percentage of Nominal GDP for fiscal years 2009/2010
to 2013/2014
183.28
220.24
156.99 144.03
130.00
2009/ 2010 2010/ 2011 2011/ 2012 2012/ 2013 2013/2014
Capital Expenditure in EC$million
2009/ 2010 2010/ 2011 2011/ 2012 2012/ 2013 2013/2014
Capital Expenditure (% of
GDP)14.17% 16.88% 11.78% 10.74% 9.52%
0%
2%
4%
6%
8%
10%
12%
14%
16%
18%
Pe
rcen
tage

35
Page
35
X. Prospects
In April’s World Economic Outlook (WEO) report, the International Monetary Fund reiterated
that high debt and lack of competitiveness continue to restrict growth in the Caribbean, which is
expected to average 3.3% in 2014 and 2015, up from 2.8% in 2013. The Eastern Caribbean
Central Bank forecasts that the regional economy will strengthen to a 1.9% increase in 2014
“with all member countries expected to record positive growth. Economic activity in Dominica is
projected to expand in 2014 and 2015 reflecting an uptick in all sectors, in particular
Construction, Wholesale and Retail Trade and Transport, Storage and Communications.
Recovery is projected for the construction sector based on planned intensified public sector
activity. Consequently, development in this sector will favourably impact developments in the
Transport, Storage and Communications and Wholesale and Retail Trade sectors.
In respect of the real sector, recovery is projected for the banana sub-sector as effects to mitigate
Black Sigatoka and as other efforts begin to take hold. This will be supplemented by an increase
in other agricultural activity as the horticulture program, abattoir, coffee plant and pack houses
yield results over the next few years. Predicated on these phenomena, the agriculture, livestock
and forestry sector is forecasted to record positive growth in fiscal year 2014/2015.
The geothermal energy power plant development coupled with the stabilization of private sector
construction is expected to increase the performance of the construction sector.
The tourism sector is projected to grow as growth continues and unemployment abates in key
tourism markets, additional room capacity becomes available for example following the
completion of the Portsmouth Hotel.
The current account deficit of the balance of payments is estimated to widen in 2014/2015 to -
17.7% of GDP compared to -17.0% in 2013 premised on the following assumptions:
i. A wider deficit on the goods and services account as the anticipated increase in
imports of goods and services will outpace the increase in exports of goods and
services.
ii. The Income account deficit is improve marginally
iii. The surplus on the current transfers account is also expected to improve
marginally.
However, the surplus on the capital and financial account is projected to increase based on
increases in capital grants related to the renovation and expansion of the state hospital and
foreign direct investment related to Ross University expansion project.
On the fiscal front, a widening of the overall fiscal deficit is projected in 2014/2015 based on an
anticipated increase current expenditure and capital spending which is expected to outpace the
anticipated increase in total revenue and grants.

36
Page
36
XI. Security Issuance Procedures, Clearance and Settlement
The series of Securities will be listed on the ECSE. This market operates on the ECSE trading
platform for both primary issuance and secondary trading. The pricing methodology to be used
for selling the securities will be a Competitive Uniform Price Auction. The ECSE is responsible
for disseminating market information, providing intermediaries with market access,
administering the auction process and monitoring the auctions.
The ECSE, through the Eastern Caribbean Central Securities Depository (ECCSD), will be
responsible for facilitating clearance and settlement for the securities allotted. The ECCSD will
ensure that funds are deposited to the account of the Government of the Commonwealth of
Dominica.
The ECSE, through the Eastern Caribbean Central Securities Registry (ECCSR), will record and
maintain ownership of the government securities in electronic book-entry form. The ECCSR
will mail confirmation of proof of ownership letters to all investors who were successful in the
auction. The ECCSR will also process corporate action on behalf of issuing governments.
Intermediaries will be responsible for interfacing with prospective investors, collecting
applications for subscription and processing the same for bidding on the ECSE platform.
Investors must provide the intermediaries with funds to cover the cost of the transaction. For this
particular offering, investors will pay the applicable brokerage fees to the intermediaries. A list
of licensed intermediaries who are members of the ECSE is provided (Appendix 1).
Successful clients will be informed of their payment obligations and the funds provided to the
intermediary will be used to purchase the allotted amount.
As an issuer on the RGSM, the Government of the Commonwealth of Dominica will be subject
to the rules, guidelines and procedures developed by the Regional Debt Coordinating Committee
(RDCC) for the operation of the market, including ongoing reporting and disclosure
requirements.
Outstanding debt section is missing:
Debt outstanding on the RGSM as at 26 January 2015:
1. 91-day T-bill
Trading Symbol - DMB250315

37
Page
37
Issue Date: 24 December 2014
Maturity Date: 25 March 2015
Authorised Amount: $20,000,000.00
Outstanding Amount: $20,000,000.00
2. 5-year bonds
Trading Symbol: DMG050719
Issue Date: 28 July 2014
Maturity Date: 28 July 2019
Authorised Amount: $15,065,000.00
Outstanding Amount: $15,065,000.00
Trading Symbol: DMG051117
Issue Date: 15 November 2012
Maturity Date: 15 November 2017
Authorised Amount: $25,000,000.00
Outstanding Amount: $25,000,000.00
3. 20-year Restructured Bond
Trading Symbol: DMG200624
Issue Date: 11 June 2004
Maturity Date: 10 June 2024
Authorised Amount: $75,233,726.00
Outstanding Amount: $75,233,726.00
4. 30-year Restructured Bond
Trading Symbol: DMG300634
Issue Date: 11 June 2004
Maturity Date: 10 June 2034
Authorised Amount: $11,287,315.00
Outstanding Amount: $11,287,315.00

38
Page
38
XII. Appendices
i. Listing of Licensed intermediaries
ii. Dominica selected Economic and Social Indicators
iii. Summary of Government Fiscal Operations (EC$ Millions)
iv. Total Public Sector Outstanding Debt As at June 2014 (EC$ millions)
v. Balance of Payments (millions EC$)
39
Page
39
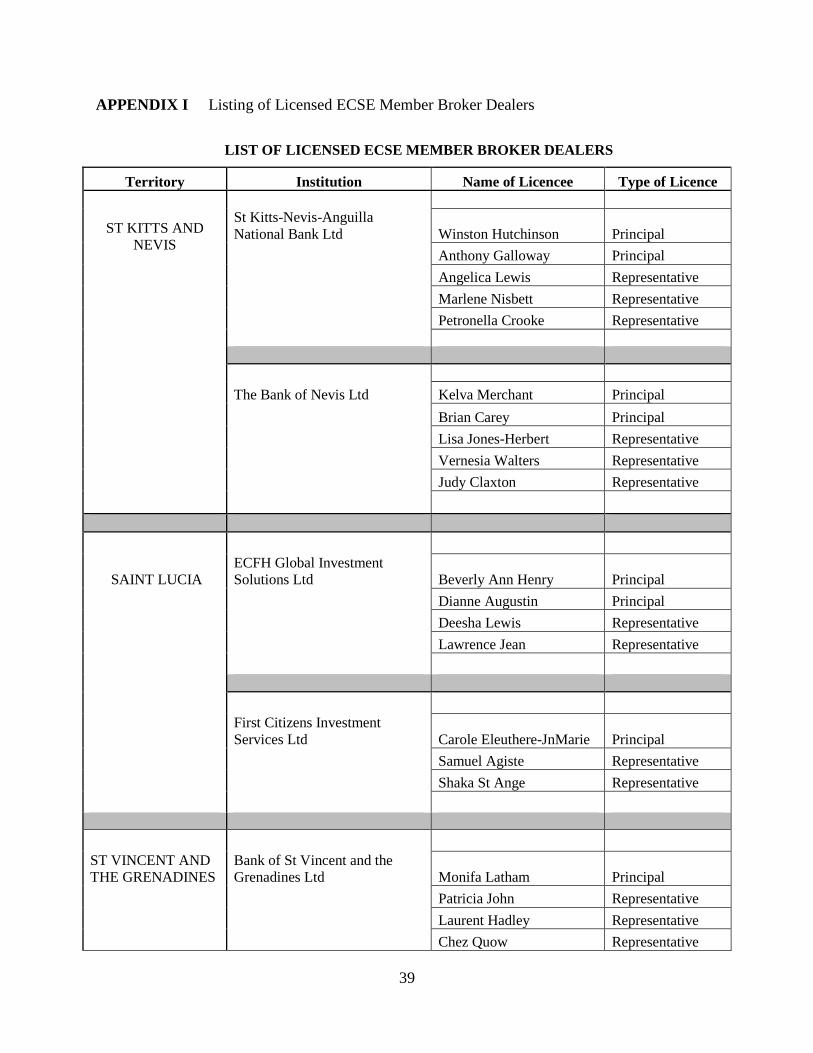
APPENDIX I Listing of Licensed ECSE Member Broker Dealers
LIST OF LICENSED ECSE MEMBER BROKER DEALERS
Territory Institution Name of Licencee Type of Licence
ST KITTS AND
NEVIS
St Kitts-Nevis-Anguilla
National Bank Ltd Winston Hutchinson Principal
Anthony Galloway Principal
Angelica Lewis Representative
Marlene Nisbett Representative
Petronella Crooke Representative
The Bank of Nevis Ltd Kelva Merchant Principal
Brian Carey Principal
Lisa Jones-Herbert Representative
Vernesia Walters Representative
Judy Claxton Representative
SAINT LUCIA
ECFH Global Investment
Solutions Ltd Beverly Ann Henry Principal
Dianne Augustin Principal
Deesha Lewis Representative
Lawrence Jean Representative
First Citizens Investment
Services Ltd Carole Eleuthere-JnMarie Principal
Samuel Agiste Representative
Shaka St Ange Representative
ST VINCENT AND
THE GRENADINES
Bank of St Vincent and the
Grenadines Ltd Monifa Latham Principal
Patricia John Representative
Laurent Hadley Representative
Chez Quow Representative

40
Page
40
APPENDIX II
Area (sq. km.) 754.0 Adult literacy rate (percent, 2004) 88
Population (2011) Unemployment rate (2011) 11.0
Total 71,293 Annual rate of growth (percent) 0.2 Density (per sq. km.) 94.6 Gross Domestic Product (2012) Population characteristics (millions of E.C. dollars) 1,339
Life expectancy at birth (years, 2006) 74.1 (millions of U.S. dollars) 496
Infant mortality (per thousand live births, 2006) 13.0 (US dollars per capita) 6,957
2008/09 2009/10 2010/11 2014/15 2015/16 2016/17 2017/18 2018/19 Prel. Budget Proj.
Output and prices Real GDP 1/ 7.8 -1.1 1.2 0.2 -1.1 1.6 0.8 1.7 1.7 2.0 2.2 2.4 Nominal GDP 9.6 6.7 -1.5 3.4 0.9 … 0.3 3.5 3.5 3.9 4.3 4.4 Consumer prices (end of period) 2.0 3.2 0.0 2.0 2.0 … -0.9 2.3 1.7 1.7 2.1 2.1 Consumer prices (period average) 6.4 0.0 2.8 1.3 1.5 … -0.4 1.8 1.8 1.9 2.0 2.0 Output gap (percent of potential GDP) 7.0 3.6 3.0 1.5 -1.2 … -1.9 -1.7 -1.5 -1.1 -0.6 0.0 Real effective exchange rate
(period average, depreciation -) 0.9 5.0 -2.8 -5.3 0.3 … … … … … … …
Central government balances 2/ Revenue 35.9 36.5 37.0 30.6 30.3 34.5 33.2 32.6 32.5 32.3 32.3 32.1
Taxes 24.9 25.0 24.2 22.6 22.2 22.0 22.1 22.2 22.3 22.3 22.5 22.5 Non-tax revenue 2.0 2.6 3.1 3.3 5.4 6.4 6.1 5.9 5.7 5.5 5.3 5.1 Grants 3/ 9.0 8.8 9.7 4.8 2.7 6.0 5.0 4.5 4.5 4.5 4.5 4.5
Expenditure 35.2 36.8 40.4 35.0 35.7 34.9 36.0 35.7 35.4 35.4 35.4 35.4 Current primary expenditure 20.9 21.1 22.0 21.8 23.1 21.7 22.7 22.7 22.6 22.7 22.7 22.7 Interest payments 1.7 1.4 1.6 1.5 2.0 1.6 1.6 1.6 1.7 1.7 1.7 1.7 Capital expenditure 12.5 14.3 16.9 11.7 10.6 11.7 11.6 11.3 11.1 11.0 11.0 10.9
Primary balance 2.4 1.1 -1.9 -2.9 -3.4 1.2 -1.1 -1.4 -1.2 -1.4 -1.4 -1.5 excl. Economic Citizenship Program 2.0 0.4 -3.2 -4.8 -7.2 … -5.3 -5.4 -5.0 -5.0 -4.8 -4.8 Overall balance 0.7 -0.3 -3.5 -4.4 -5.4 -0.4 -2.7 -3.1 -2.9 -3.1 -3.1 -3.3 excl. Economic Citizenship Program 0.3 -1.0 -4.8 -6.4 -9.1 … -6.9 -7.1 -6.7 -6.7 -6.5 -6.5
Central government debt (incl. guaranteed) 4/ 65.2 64.2 68.8 69.7 73.3 … 75.2 76.2 76.8 77.4 77.7 78.5
External 45.8 44.9 50.4 50.7 52.7 … 53.9 54.1 54.3 54.5 54.6 54.9 Domestic 19.4 19.2 18.3 19.0 20.6 … 21.2 22.1 22.6 22.9 23.1 23.5
Money and credit (annual percent change) Broad money (M2) 4.3 10.0 6.1 0.3 9.7 … 0.6 3.1 3.6 3.7 4.2 4.5 Real credit to the private sector 6.1 3.6 9.4 4.5 2.3 … 0.8 1.7 1.7 2.0 2.2 2.4
Balance of payments Current account balance, o/w: -28.7 -22.7 -17.4 -14.5 -18.9 … -17.0 -17.7 -16.7 -16.0 -15.6 -15.4 Exports of goods and services 5/ 34.7 31.0 36.1 38.1 32.7 … 34.2 34.7 35.1 35.3 35.5 35.6 Imports of goods and services 63.5 54.8 55.7 53.9 51.3 … 52.7 54.1 53.3 52.7 52.5 52.4 Capital and financial account balance 24.2 22.8 18.5 18.0 14.6 … 15.6 17.9 16.9 16.2 15.8 15.6 FDI 12.5 8.8 5.1 2.9 3.1 … 4.0 5.7 5.8 5.9 5.9 6.0 Capital grants 12.0 8.5 6.4 3.2 1.8 … 3.6 4.5 4.5 4.5 4.5 4.5 Other (incl. errors and omissions) -0.3 5.5 7.0 11.9 9.7 … 8.0 7.8 6.7 5.9 5.4 5.1 External debt (gross) 6/ 65.8 66.1 70.5 75.1 81.3 … 88.1 92.8 96.4 98.8 100.4 100.4
… Savings-Investment Balance -28.7 -22.7 -17.4 -14.5 -18.9 … -17.0 -17.7 -16.7 -16.0 -15.6 -15.4
Savings -7.3 -3.0 3.9 7.0 5.0 … -0.1 -0.3 0.9 1.8 2.5 3.0 Investment 21.4 19.6 21.4 21.5 20.8 … 16.9 17.5 17.6 17.8 18.1 18.4
Public 12.9 14.0 16.7 15.0 12.0 … 12.1 12.3 12.1 11.9 11.9 11.8 Private 8.4 5.6 4.7 6.5 8.8 … 4.8 5.2 5.5 5.9 6.2 6.6
Memorandum items: Nominal GDP (EC$ millions) 1,221 1,303 1,283 1,327 1,339 … 1,343 1,391 1,439 1,495 1,559 1,629 Nominal GDP, fiscal year (EC$ millions) 1,262 1,293 1,305 1,333 1,341 1,402 1,367 1,415 1,467 1,527 1,594 1,659 Net imputed international reserves:
End year (millions of US dollars) 55.1 64.5 66.4 74.5 91.8 … 84.9 85.8 86.9 88.1 89.5 91.0 Months of imports of goods and services 2.3 2.9 3.0 3.4 4.3 … 3.9 3.7 3.7 3.6 3.5 3.5
.
.
. . .
I. Social and Demographic Indicators
2013/14 Proj.
II. Economic Indicators
(Annual percentage change, unless otherwise specified)
(In percent of GDP, unless otherwise specified)
2011/12 2012/13
Sources: Dominican authorities.

41
Page
41
APPENDIX III Summary of Government Fiscal Operations (EC$ Millions)
FY09/10
FY10/11
FY11/12
FY12/13 FY13/14 Est.
2014/15 Proj.
2015/16
Total Revenue + Grants 477.5 481.2 410.1 417.2 414.7 502.1 573.1
Total Revenue 363.4 354.3 349.0 380.6 369.7 422.1 428.2
Current Revenue 362.3 351.6 346.7 378.2 369.4 417.0 423.2
Tax Revenue 327 311.9 302.5 304.5 303.9 312.5 318.3
of which
Taxes on Incomes and Profits 60.9 57.1 55.6 57.3 57.8 59.5 61.3
Taxes on Property 8.9 7.8 7.5 6.7 7.7 8.0 8.3
Taxes on Domestic Goods and Services 185.2 179.7 175.2 183.2 179.1 181.6 183.5
Taxes on International Trade & Transactions 72.0 67.3 64.2 57.3 59.3 63.3 65.2
Non Tax Revenue 35.3 39.7 44.2 73.7 65.5 104.5 104.9
Capital Revenue 1.1 2.7 2.4 2.4 0.3 5.1 5.1
Grants 114.1 126.9 61.1 36.6 45.0 80.0 144.8
Total Expenditure 478.8 530.0 470.7 483.2 460.9 513.6 580.7
Current Expenditure 294.1 312.0 313.9 339.2 331.5 339.8 336.1
Personal Emoluments 126.5 135.2 135.7 146.8 144.1 148.3 149.3
Goods & Services 83.1 86.7 88.6 97.0 92.4 96.5 93.3
Interest Payments 17.9 20.6 20.5 26.6 26.4 23.2 23.9
Transfers & Subsidies 66.6 69.5 69.1 68.8 68.6 71.8 69.6
Capital Expenditure + Net Lending 184.7 218.0 156.8 144.0 129.4 173.8 244.6
Principle repayments 29.5 26.1 36.7 20.3 26.9 38.8 43.4
Current Account Balance 68.2 39.6 32.8 39.0 37.9 77.2 87.1
Overall Balance (- Grants) -115.4 -175.7 -121.7 -102.6 -91.2 -91.5 -152.5
Overall Balance (+ Grants) -1.3 -48.8 -60.6 -66.0 -46.2 -11.5 -7.6
Primary Balance (PB) 16.6 -28.2 -40.1 -39.4 -19.8 11.7 16.3
PB as a % of GDP (CSO) 1.3 -2.2 -3.0 -2.9 -1.4 0.8 1.1
Nominal GDP (CSO)
1,293.0
1,305.0
1,333.0
1,341.0
1,367.0
1415.0
1467.0
Source: Ministry of Finance

42
Page
42
APPENDIX IV Total Public Sector Outstanding Debt As at June 2014 (EC$ millions)
TOTAL PUBLIC SECTOR OUTSTANDING DEBT
As at September 2014
(In EC$ millions)
2008/09 2009/10 2010/11 2011/12 2012/13 2013/2014 %
Change Sep 2014
1. TOTAL OUTSTANDING 783.7 799.6 866.3 934.0 971.4 1,040.0 7.1 1,045.4
LIABILITIES
GDP Figures 1,262.0 1,293.0 1,305.0 1,333.0 1,341.0 1,365.0 1.8 1,365.0
2. OFFICAL DEBT 783.7 799.6 866.3 934.0 971.4 1,040.0 7.1 1,045.4
% GDP at market prices 62.1 61.8 66.4 70.1 72.4 76.2 5.2 76.5
A. Central Government
Outstanding Debt 648.0 657.7 703.1 773.2 814.9 880.7 8.1 886.5
- Domestic 188.1 185.8 180.2 209.5 219.6 230.0 4.7 247.6
- External 459.9 471.9 522.9 563.7 595.3 650.7 9.3 638.9 - Treasury Bills/Notes 15.1 11.0 11.0 11.0 11.0 11.0 - 11.0
- Bonds 111.2 110.6 109.5 108.2 92.8 87.0 -6.3 87.0
- Loans 333.6 350.3 402.4 444.5 491.5 552.7 12.5 540.9
- Bilateral 44.3 46.0 83.9 118.7 166.4 225.8 35.7 220.2
- Multilateral 282.5 297.5 311.7 319.0 318.3 320.1 0.6 313.9
- Other 6.8 6.8 6.8 6.8 6.8 6.8 - 6.8
B. Government Guaranteed
Outstanding Debt 135.7 141.9 163.2 160.8 156.5 159.3 1.8 158.9
- Domestic 29.4 38.5 44.6 45.5 47.6 47.4 -0.4 47.0
- External 106.3 103.4 118.6 115.3 108.9 111.9 2.8 111.9
TOTAL (Domestic) 217.5 224.3 224.8 255.0 267.2 277.4 3.8 294.6
TOTAL (External) 566.2 575.3 641.5 679.0 704.2 762.6 8.3 750.8
Source: Dominica Authority

43
Page
43
APPENDIX V Balance of Payments (millions EC$)
Sources: Dominican authorities
2008 2009 2010 2011 2014 2015 2016 2017 2018 Prel. Proj.
Current account balance -129.9 -109.3 -82.9 -71.4 -93.8 -84.6 -91.4 -89.1 -88.7 -89.9 -92.6 Exports of goods and services 156.7 149.7 171.3 187.4 162.3 170.4 178.8 186.9 195.4 204.9 214.9
Goods 43.9 36.8 34.5 32.6 38.2 36.7 38.3 40.0 41.5 43.3 45.2 Tourism 76.2 79.0 93.6 105.9 78.6 81.6 85.3 90.7 96.7 103.2 109.9 Other services 36.7 33.9 43.2 48.9 45.5 52.2 55.2 56.1 57.2 58.4 59.8
Imports of goods and services 287.3 264.5 264.5 264.8 254.6 262.1 278.4 284.1 292.0 303.2 315.8 Fuel 43.4 32.4 32.1 41.5 41.9 42.5 43.6 43.9 44.8 46.4 48.4 Food 32.6 32.3 32.9 34.1 35.3 36.0 36.3 37.0 38.0 39.1 40.3 Other goods 141.3 133.5 131.9 123.3 109.7 115.0 126.7 129.3 132.8 138.2 144.1 Services 69.9 66.2 67.6 65.9 67.6 68.6 71.8 73.9 76.4 79.5 82.9
Net income, o.w.: -18.3 -13.7 -9.4 -10.5 -18.3 -9.6 -9.4 -10.1 -11.0 -11.9 -12.8 Interest payments (public sector) -8.9 -3.4 -5.7 -7.4 -6.2 -5.4 -4.7 -4.9 -5.0 -5.2 -5.5
Net current transfers 19.0 19.1 19.7 16.5 16.8 16.7 17.6 18.3 19.0 20.2 21.1 Capital and financial account 109.5 109.8 87.8 88.3 72.6 77.7 92.3 90.2 89.9 91.1 93.8 Grants 57.6 44.0 33.5 19.0 12.3 21.9 27.2 28.1 29.2 30.5 31.8 Public sector flows, o.w.: 2/ -3.4 8.0 22.3 10.0 32.9 7.6 10.9 10.9 12.4 13.8 14.7
PetroCaribe 8.6 4.9 5.7 6.6 7.6 7.4 7.2 5.5 5.2 5.2 5.2 Foreign direct investment 56.5 42.4 24.3 14.2 15.6 20.1 29.2 30.8 32.5 34.3 36.1 Commercial banks -17.6 -10.5 10.0 37.5 -15.3 0.5 -1.7 -1.7 -2.1 -2.6 -2.9 Other private flows 3/ 16.3 25.9 -2.3 7.7 27.2 27.6 26.7 22.0 17.8 15.1 14.1 Errors and omissions 17.1 20.3 -3.7 -10.5 25.6 0.0 0.0 0.0 0.0 0.0 0.0 Overall balance -3.4 20.8 1.2 6.4 4.5 -7.0 0.9 1.1 1.2 1.2 1.2 Overall financing 3.4 -20.8 -1.2 -6.4 -4.5 7.0 -0.9 -1.1 -1.2 -1.2 -1.2 Change in ECCB NFA, o.w.: 4/ 5.3 -21.7 -1.9 -7.9 -17.4 7.0 -0.9 -1.1 -1.2 -1.2 -1.2
IMF reserve liabilities 3.2 4.3 -1.1 -2.9 -0.8 -2.7 -1.6 -2.3 -1.7 -1.3 -1.7 Change in Government Foreign Assets -2.0 0.9 0.7 1.5 12.9 0.0 0.0 0.0 0.0 0.0 0.0
Current account balance -28.7 -22.7 -17.4 -14.5 -18.9 -17.0 -17.7 -16.7 -16.0 -15.6 -15.4 Exports of goods and services 34.7 31.0 36.1 38.1 32.7 34.2 34.7 35.1 35.3 35.5 35.6
Goods 9.7 7.6 7.3 6.6 7.7 7.4 7.4 7.5 7.5 7.5 7.5 Tourism 16.8 16.4 19.7 21.6 15.8 16.4 16.6 17.0 17.5 17.9 18.2 Other services 8.1 7.0 9.1 9.9 9.2 10.5 10.7 10.5 10.3 10.1 9.9
Imports of goods and services 63.5 54.8 55.7 53.9 51.3 52.7 54.1 53.3 52.7 52.5 52.4 Fuel 9.6 6.7 6.8 8.4 8.5 8.5 8.5 8.2 8.1 8.0 8.0 Food 7.2 6.7 6.9 6.9 7.1 7.2 7.1 6.9 6.9 6.8 6.7 Other goods 31.3 27.7 27.8 25.1 22.1 23.1 24.6 24.3 24.0 23.9 23.9 Services 15.5 13.7 14.2 13.4 13.6 13.8 13.9 13.9 13.8 13.8 13.7
Net income -4.1 -2.8 -2.0 -2.1 -3.7 -1.9 -1.8 -1.9 -2.0 -2.1 -2.1 Interest payments (public sector) -2.0 -0.7 -1.2 -1.5 -1.3 -1.1 -0.9 -0.9 -0.9 -0.9 -0.9
Net current transfers 4.2 4.0 4.1 3.4 3.4 3.4 3.4 3.4 3.4 3.5 3.5 Capital and financial account 24.2 22.8 18.5 18.0 14.6 15.6 17.9 16.9 16.2 15.8 15.6 Capital transfers 12.7 9.1 7.0 3.9 2.5 4.4 5.3 5.3 5.3 5.3 5.3 Public sector flows, o.w.: 2/ -0.7 1.7 4.7 2.0 6.6 1.5 2.1 2.1 2.2 2.4 2.4
Petrocaribe 1.9 1.0 1.2 1.3 1.5 1.5 1.4 1.0 0.9 0.9 0.9 Foreign direct investment 12.5 8.8 5.1 2.9 3.1 4.0 5.7 5.8 5.9 5.9 6.0 Commercial banks -3.9 -2.2 2.1 7.6 -3.1 0.1 -0.3 -0.3 -0.4 -0.5 -0.5 Other private flows 3/ 3.6 5.4 -0.5 1.6 5.5 5.5 5.2 4.1 3.2 2.6 2.3 Overall balance -0.7 4.3 0.3 1.3 0.9 -1.4 0.2 0.2 0.2 0.2 0.2 Memorandum items: Trade balance (percent of GDP) -38.4 -33.5 -34.2 -33.9 -30.0 -31.5 -32.7 -31.9 -31.5 -31.2 -31.1 Services balance (percent of GDP) 9.5 9.7 14.6 18.1 11.4 13.1 13.3 13.7 14.0 14.2 14.4 Net imputed international reserves:
Millions of US dollars 55.1 64.5 66.4 74.5 91.8 84.9 85.8 86.9 88.1 89.5 91.0 Months of imports of goods and services 2.3 2.9 3.0 3.4 4.3 3.9 3.7 3.7 3.6 3.5 3.5
Gross external debt 5/ 65.8 66.1 70.5 75.1 81.3 88.1 92.8 96.4 98.8 100.4 101.8 Public sector 45.8 44.9 50.4 50.7 52.7 53.9 54.1 54.3 54.5 54.6 54.9 Private sector 20.0 21.2 20.0 24.5 28.6 34.2 38.8 42.1 44.3 45.8 46.9
GDP (in US$ millions) 452.2 482.4 475.1 491.3 496.0 497.6 515.0 533.1 553.8 577.6 603.2
.
. . .
2012
(In millions of USD)
(In percent of GDP)
2013 Proj.