government expenditure and unemployment: empirical
TRANSCRIPT

Eastern Illinois University Eastern Illinois University
The Keep The Keep
Masters Theses Student Theses & Publications
Fall 2019
Government Expenditure and Unemployment: Empirical Government Expenditure and Unemployment: Empirical
Investigation of Sub-Saharan African (SSA) Countries Investigation of Sub-Saharan African (SSA) Countries
Grace Ayiwah Fosu Eastern Illinois University
Follow this and additional works at: https://thekeep.eiu.edu/theses
Part of the Growth and Development Commons
Recommended Citation Recommended Citation Fosu, Grace Ayiwah, "Government Expenditure and Unemployment: Empirical Investigation of Sub-Saharan African (SSA) Countries" (2019). Masters Theses. 4573. https://thekeep.eiu.edu/theses/4573
This Dissertation/Thesis is brought to you for free and open access by the Student Theses & Publications at The Keep. It has been accepted for inclusion in Masters Theses by an authorized administrator of The Keep. For more information, please contact [email protected].
GOVERNMENT EXPENDITURE AND UNEMPLOYMENT: EMPIRICAL
INVESTIGATION OF SUB-SAHARAN AFRICAN (SSA) COUNTRIES
Grace Ayiwah Fosu
Eastern Illinois University
2019
Thesis Committee
Dr. Teshome Abebe (Advisor)
Dr. Ali Moshtagh
Dr. Ahmed Abu-Zaid

Abstract
Over the years, there have been increasing trends in government expenditures in
most countries in Sub-Sahara Africa, but some of the social-economic indicators such as
health, unemployment, education, inflation, and the others paint a blurry image of the effect
of the rising public spending. It is worrisome to see that pictures painted by the economic
indicators show that budgets made by governments in Sub-Sahara Africa look good on
paper than their actual effect in the economy (Andrews, 2010; Peterson, 2010). As a result
of this, the question that keeps emerging is that “does government spending actually impact
economic indicators in the region”? Unemployment remains one of the most challenging
socio-economic problems of almost all the countries in Sub-Sahara Africa. With the
consistent rise in unemployment situations in Sub-Sahara Africa, this study attempts to find
the relationship between public spending and unemployment. To examine whether the
increasing public expenditures reduce unemployment, increases unemployment or have
nothing to do with unemployment, the study investigates the impact of government
expenditure on unemployment in 34 Sub-Saharan African countries for the period 1990 to
2017. The study further disaggregates government expenditure into two categories;
government investment expenditure and government consumption expenditure.
Utilizing the panel data estimation technique on annual series data, the pooled OLS,
the fixed effect, and random effect models are employed to examine the relationship
between government expenditure and unemployment in the selected SSA countries. Based
on the fixed effect model selected with the aid of the Hausman test, both government
consumption expenditure and government investment expenditure were found to have an
effect on unemployment in the SSA countries. The findings of the study revealed that an

increase in government consumption expenditures results in an increase in unemployment
whereas a rise in government investment expenditures results in a reduction in
unemployment, holding all other variables constant. In other words, government
investment expenditure creates more employment in Sub-Sahara Africa. Foreign direct
investment (FDI) was also found to increase employment in the SSA region. The study
recommended that governments in the region focus more on investment expenditures
which have a greater tendency of creating employment for the people than the consumption
expenditures.

Dedication
This thesis is dedicated to the memory of my beloved father, Mr. Joseph Yaw
Fosu, a great and gentle soul who taught me to believe in God, dedicate to hard work and
be persistent in perseverance. Wherever you are, I still love you, Papa.

Acknowledgments
First and foremost, I am most grateful to God almighty for His unending love,
guidance, and protection throughout my life.
I would want to acknowledge my thesis advisor, Dr. Teshome Abebe for sharing
his wisdom and knowledge to support my study and also for guiding me throughout the
research. Another thank you goes to my thesis committee members, Dr. Ali Moshtagh and
Dr. Ahmed Abu-Zaid for their criticisms and constructive contributions in making my
thesis a success. In addition, I would like to thank Dr. Mukti Upadhyay for his reviews and
suggestions on my data analysis.
To my lovely mother, Mad. Grace Ayiwah Snr, I want to give a very special thank
you for her love and her supporting me with immense prayers. And also, many thanks to
my siblings, Yaw, Adu, Adwoa and Emma for their love and encouragement.
I would also like to thank the Parrish family especially Ms. Patsy Parrish for playing
the role of a mother and supporting me throughout my years at Eastern Illinois University.
My final thanks go to all my colleagues who encouraged me throughout my study and
made my stay on EIU campus a memorable one.
Table of Contents
CHAPTER ONE ................................................................................................................1
INTRODUCTION..............................................................................................................1
1.1 Background of Study ..................................................................................................1
1.2 Statement of Problem .................................................................................................4
1.3 Objective of the Research ..........................................................................................5
1.4 Research Hypothesis ..................................................................................................5
1.5 Justification of the Study ............................................................................................6
1.6 Organization of the Study ..........................................................................................6
CHAPTER TWO ...............................................................................................................7
LITERATURE REVIEW .................................................................................................7
2.0 Introduction ................................................................................................................7
2.1 Theoretical review ......................................................................................................7
2.1.1 Unemployment ........................................................................................................8
2.1.2 Theories on Unemployment ....................................................................................9
2.2 Fiscal Policy .............................................................................................................12
2.2.1 Stances of Fiscal policy .....................................................................................12
2.2.2 Fiscal policies and fiscal adjustments ................................................................14
2.3 Empirical review ......................................................................................................15
CHAPTER THREE .........................................................................................................35

OVERVIEW OF THE TRENDS IN GOVERNMENT EXPENDITURE AND
UNEMPLOYMENT IN SUB-SAHARAN AFRICA ....................................................35
3.0 Introduction ..............................................................................................................35
3.1 Overview of Fiscal Policy Implementation in Sub-Saharan Africa .........................35
3.2 Trends in Unemployment and Fiscal Policy in Sub-Saharan Africa .......................38
CHAPTER FOUR ............................................................................................................41
METHODOLOGY AND DATA ....................................................................................41
4.0 Introduction ..............................................................................................................41
4.1 Methodology ............................................................................................................41
4.1.1 Model Specification ...........................................................................................43
4.2 Source of Data, Definition and Measurement of Variables .....................................44
CHAPTER FIVE .............................................................................................................49
ESTIMATION AND DISCUSSION OF RESULTS .....................................................49
5.0 Introduction ..............................................................................................................49
5.1 Descriptive Statistics ................................................................................................49
5.2 Test of Stationarity ...................................................................................................51
5.3 Presentation and Discussion of Regression Results .................................................52
5.4 Fixed Effect and Random Effect Estimation............................................................53
5.5 Hausman Test ...........................................................................................................54
5.6 Interpretation ............................................................................................................55
CHAPTER SIX ................................................................................................................60
CONCLUSION AND POLICY RECOMMENDATIONS .........................................60
6.0 Introduction ..............................................................................................................60
6.1 Summary and Conclusion of Findings .....................................................................60
6.3 Policy Recommendations .........................................................................................62
REFERENCES .................................................................................................................65
APPENDIX .......................................................................................................................74
Appendix 1A ..................................................................................................................74
Appendix 1B ..................................................................................................................76
Appendix 1C ..................................................................................................................40
List of Tables
Table 5.1: Summary Statistics of Variables .......................................................................49
Table 5.2: Stationarity Test of Variables ...........................................................................52
Table 5.3: Pooled OLS Regression ....................................................................................53
Table 5.4: Fixed and Random Effect Regression ..............................................................54
Table 5.5: Hausman Test Results.......................................................................................55

1
CHAPTER ONE
INTRODUCTION
1.1 Background of Study
The role of the government in an economy has been a germane debate over the
years in the world’s growing economies. While some believe a larger role by the
government is more efficient for economic growth, others believe otherwise. In as much
as the debate keeps spinning, we cannot ignore the fact that governments still have roles to
play in an economy. Governments develop policies to react to certain economic conditions
and these policies and regulations are usually geared towards economic growth or prevent
negative economic consequences.
Fiscal policy among many other policies is one policy framework used by
governments to regulate their spending and taxation. Governments of both developed and
developing countries adopt the framework of fiscal policy as a means to adjust their
spending levels and tax rates to monitor and influence their countries’ economies. Fiscal
policy, thus, is a management tool of a government with respect to the country’s economy
(Anayochukwu, 2012). More importantly, two major goals of fiscal policy are to reduce
unemployment and encourage economic growth.
The emergence of Keynesian concepts has induced governments to assume
essential roles in the administration of countries which may include the various direct
government investments in all sectors of an economy. When the government increases its
spending, for instance when there are high government funds on new public work programs
like building infrastructures such as bridges, roads or train systems, it tends to create jobs

2
that reduce unemployment and increases disposable income leading to high levels of
consumption. When disposable income increases, consumers demand more goods and
services which go a long way to boost businesses since the level of production will rise in
order to meet the high demand of consumers. As the level of production increases, more
people are employed. Taxation, on the other hand, is another way a government can use to
reduce unemployment; tax cuts increase disposable income and enables business expansion
and hiring. Tax hikes put less money into consumers’ hands which tends to decrease
consumption.
Baker (2007), stipulated that despite government involvement in shaping the
economy of a country using fiscal policy, a high incidence of unemployment still occur.
The recent high rates of unemployment encountered by many economies reflect both
cyclical conditions and deep-rooted frailties in labor market institutions and fiscal policies
(Cottarelli, 2012). Unemployment impacts negatively on the government’s ability to
generate income, and it also reduces economic activity (Kelechukwu and Amadi (2016).
Enormous amount of government revenue is generated from taxes of all forms, and so if
fewer people are employed, then the government’s revenue that could be used to boost
economic activities decreases because fewer people would be paying taxes (especially
income-related taxes and all other forms of taxes that could be generated when labor force
is employed). Since the employment of available human resources is vital to economic
growth, it is thus, the aim of every government to implement policies that would reduce
unemployment rates. Mostly, the creation of jobs from governments occurs via government
spending in the provision of social and economic infrastructural amenities. These are
generally referred to as government investment expenditure.

3
Issues on fiscal policy especially government spending and its implications on key
macroeconomic indicators including unemployment has been one of the most pertinent
debatable topics for the past years. Both academicians and policymakers have developed a
keen interest in the issues of fiscal policy and its effects on key macroeconomic indicators.
This has resulted in copious research works on the topic. Most often, plentiful studies are
geared towards the impact of fiscal policy on the general economic growth of countries.
Surprisingly, there seems to be a limited number of researches on the effects of fiscal policy
on unemployment, and what makes it interesting is the lack of consensus in the limited
literature and empirical analysis of the fiscal policy and unemployment nexus.
With respect to fiscal policy and its influence on the unemployment rate, a lot of
questions have been raised including: Does the policy mitigate unemployment? What are
some of the consequences of fiscal policies in its application to reduce unemployment?
Despite the increasing trend in government expenditures in Sub-Saharan Africa, it is quite
contradictory and bothersome to pinpoint that social-economic indicators have painted dull
pictures of the situation (Nwosa, 2014). Fiscal policy implementation in Sub Saharan
Africa happens to be predominantly challenging. Budgets created by governments of the
countries in this region are known to appear great on paper but unrealistic in practice
(Andrews, 2010; Peterson, 2010).
Taking a look at fiscal policy employed by the governments of some of the
countries in the region, the South African government has been using an expansionary
fiscal policy framework over the years. For several years up until 2010, expansionary fiscal
policy dominated which consistently pushed the government to encourage national budget
deficits (Treasury, 2009). South Africa’s budget deficit as a percentage of GDP

4
skyrocketed from about 1.3 percent in 1980 to about 4.8 percent in 2010, averaging about
2.8 percent for the period 1980 to 2010 (DTI, 2011). Regardless of the government’s
immense struggle to influence the economy via an expansionary fiscal policy framework,
unemployment remains one of the most challenging issues in South Africa.
Interestingly, the Nigerian government also in some time past, has employed several fiscal
policies to curb the increasing rate of unemployment but to no avail (Egbulonu and Amadi,
2016). In spite of the impressive nature of the economic growth rate from the years 2000
to 2011(an average of 6.4 percent); unemployment in Nigeria has been rising from 1.8
percent in 1995 to 23.9 percent in 2011 (CBN annual report).
During the period of the 2007-2008 global financial crisis, the expansionary fiscal policy
framework became a popular policy practice by most developed nations and some of these
countries experienced higher unemployment rates during that period of the crisis (Umut,
2015). Undoubtedly, the effects of government spending on unemployment still remain
vague; there exists some empirical evidence which shows that fiscal stimulus improves
employment (see Monacelli et al., 2010) while others provide a contrasting view in their
research that fiscal stimulus rather worsens unemployment (Bruckner and Pappa, 2012).
1.2 Statement of Problem
Unemployment is one of the biggest social and economic menace which has been
haunting Sub-Saharan African economies over the years. It persistently hampers economic
growth and reduces the standard of living in this region. Unemployment in the region rose
to 7.2% in 2008 which was above the global unemployment rate of 5.5% (ILO,2018). With
a strongly growing labor force coupled with limited improvement in the labor market, the
region has the highest rate of vulnerable employment globally, staging about 66%.
5
Governments in Sub-Saharan Africa region have adopted various fiscal policy measures to
regulate their economies in which these policies are directed towards reducing
unemployment, but the problem does not seem to be solved.
1.3 Objective of the Research
This research is intended to investigate the effects of government expenditures on
unemployment in Sub-Saharan Africa by disaggregating the government expenditures into
recurrent expenditure (government consumption expenditure) and capital expenditure
(government investment expenditure). This division is incorporated to dive into which of
the two has a relevant impact on unemployment, and the direction of the impact whether
positive or negative. Moreover, the study will analyze the trends in the two forms of
government expenditure, and unemployment in the region.
1.4 Research Hypothesis
The study seeks to empirically test the following hypothesis based on the research
objective stated:
Ho: Government expenditure has no effects on unemployment in Sub-Saharan Africa.
H1: Government expenditure has an effect on unemployment in Sub-Saharan Africa.

6
1.5 Justification of the Study
For several decades, most of the theoretical and empirical studies have focused
extensively on government expenditure and economic growth in general. However, there
seem to exist limited studies on the relationship between government spending and the
labor market, especially in Africa. Moreover, most of the studies on government spending
and other macroeconomic indicators incorporate the aggregated government expenditure,
and so the differences in the effects of the various types of government expenditures are
not fully exposed. This study stands to differ and add to the limited studies on government
spending and unemployment, and also adopt the disaggregated forms of government
expenditure to disclose the full effects of the various types of government spending on
unemployment in Sub-Saharan Africa.
1.6 Organization of the Study
The study will be sectioned into six chapters, and it is organized as follows. Chapter
one presents the introduction of the study followed by chapter two which presents extensive
literature both theoretical and empirical. The background information on the trends in
government expenditure and unemployment are presented in chapter three. The
methodology employed, and the data used are described in chapter four and chapter five
discusses the empirical results from the data analysis. Finally, chapter six concludes the
main findings of the research with some policy recommendations.
7
CHAPTER TWO
LITERATURE REVIEW
2.0 Introduction
This chapter focuses on the review of relevant literature on government expenditure
and its relationship with other key macroeconomic indicators in different countries. The
chapter consists of two broad sections. The first section reviews the theoretical literature
on fiscal policy with an emphasis on government expenditure and its impact on key
macroeconomic indicators. Section two is a review of empirical studies on the fiscal policy
tool, government expenditure and its effect on unemployment and some other
quintessential indicators in the economies of different countries.
2.1 Theoretical review
There have been numerous studies on the relationship between government
expenditure and other key macroeconomic indicators in different countries. Due to
differences in methods and data used, these studies come up with diverse outcomes and
conclusions. For years now, limited but diverse research works have been conducted on
developed, emerging and developing countries in regard to finding the effects fiscal policy
especially government expenditure imposes on unemployment. The theoretical reviews are
mostly connected with the Keynesian theory, Real Business Cycle (RBC), Okun’s Law
and Wagner’s Law. Thus, this research would seek to explore these theories and concepts
related to both unemployment and government expenditure as a fiscal policy tool. Before

8
then, the study explores separate and concise reviews on unemployment and government
expenditure as a fiscal policy mechanism.
2.1.1 Unemployment
Unemployment remains a major issue across the globe. Economies have been
battling with the problem of unemployment for decades, and they have tried with various
policy frameworks to curb this socio-economic problem. There are various interpretations
of the definition of unemployment which allow us to have a better understanding of the
status of the labor market. Generally, unemployment is a phenomenon that occurs when a
person who is actively searching for employment is unable to find work.1 It is mostly
measured in terms of the unemployment rate, which is the number of unemployed
individuals divided by all individuals currently in the labor force. Unemployment is often
used to measure the health of an economy.
Economically, unemployment represents a loss in a country’s Gross Domestic
Product (GDP). It impacts negatively on the government’s ability to generate income, and
it also reduces economic activity. Economists study unemployment to find its causes and
thus, suggest public policy frameworks that would help improve employment levels. There
remains considerable theoretical debate regarding the causes, consequences, and solutions
for unemployment. Economic literature provides many explanations for the unemployment
problem. Some theories blame the economic systems, and others blame the unemployed
workers. Still, other theories shift the problem to external sources and shock, or
1 https://www.investopedia.com/terms/u/unemployment.asp
9
unpredictable events, and others argue that technology and labor market institutions are the
causes of the unemployment problem. (Mouhammed 2012).
2.1.2 Theories on Unemployment
There are various schools of economic thought that differ on the causes,
consequences, and solutions of unemployment. This has resulted in various theories
including the classical theory of unemployment, Keynesian theory of unemployment and
Marxist theory of unemployment. There are other theories from the Austrian School of
economics, neoclassical economics and the new classical economics (builds analysis on a
neoclassical framework). The most popular among these are the classical theory and the
Keynes theory.
According to the classical economic theory, originally developed by Adam Smith,
David Ricardo, and others in the late 18th century, unemployment is explained simply by
the real wages being higher than the market-equilibrium wage.2 Unemployment is
perceived as a sign that smooth labor market functioning is being impeded in some way.
The Classical approach assumes that markets behave in response to the idealized supply-
demand model. In view of the Classical theory, an economy will achieve full employment
(natural rate of employment) if wages and prices are flexible. This implies that
unemployment occurs when wages rise too high to maintain equilibrium. When wages rise,
firms cannot pay as many workers so they may not be able to maintain more workers and
may lay some off which would tend to increase unemployment. In this regard, there would
be fewer people with an income to demand goods and services, so demand would fall, and
2 https://en.wiktionary.org/wiki/classical_unemployment

10
prices tend to go down as well. Since unemployment goes up, there would be more people
in search of jobs thereby giving firms a wider range of choices in the number of people to
hire and how much they would pay for such labor. The classical view claims that the
unemployment rate will always go through cycles, but in the end, it will always correct
itself to the natural unemployment rate.
Economist John Maynard Keynes (1883-1946) changed the world’s view of the
workings of the economy with his book “The Theory of Employment, Interest, and Money”
(1936). Keynes introduced the theory that aggregate demand determines the equilibrium.
Keynes's theory suggested that the level of employment in the short run is dependent on
aggregate effective demand for goods and services. The principle of effective demand is a
major point related to Keynes's theory of employment. Aggregate demand is the number
of goods and services all buyers demand at various prices (Sayer and Morris 170).
According to Keynes, when the demand for goods and services in an economy increases,
firms are encouraged to produce more. The total level of employment of a country can be
determined by the total demand of the country. Therefore, when aggregate effective
demand increases, the level of employment would increase and vice-versa. Classical
theorists viewed the economy in terms of reduced prices and wages whereas Keynes saw
the economy in terms of fall in production.
Keynes's theory criticized the perceptions of classical economists that the forces of
the market in the capitalist economy would adjust themselves to reach equilibrium.
Classical theorists believed the principle of “Laissez Faire”, that government should not
intervene but allow the economy to resolve itself because the economy goes through
business cycles. Keynes's book which was published after the Great Depression succeeded

11
in criticizing the classical theory of employment since the great depression proved that
market forces could not by themselves attain equilibrium but needed an external
intervention for support. Keynes believed that government interference is useful to an
economy. His models recommend government interventions designed to increase demand
for labor. The theory suggests fiscal and monetary policies, in that the use of government
spending can reduce the business cycle which can increase demand for goods and services
and also raise the level of consumption in an economy. When there is an increase in demand
firms would increase their level of production and thus would hire more people.
The Marxist theory of unemployment shares the Keynesian viewpoint of the
relationship between economic demand and employment, but cautions that the market
system’s propensity to slash wages and reduce labor participation on an enterprise-level
causes a requisite decrease in aggregate demand in the economy as a whole, causing crises
of unemployment and periods of low economic activity before the capital accumulation
(investment) phase of economic growth can continue.3 According to Karl Marx,
unemployment is inherent within the unstable capitalist system and periodic crises of mass
unemployment are to be expected.
According to Marx, in his book “Manifesto of the communist party” the only way
to permanently eliminate unemployment would be to abolish capitalism and the system of
forced competition for wages and then shift to a socialist or communist economic system.
For modern Marxists, the existence of persistent unemployment is proof of the inability of
capitalism to ensure full employment.
3 https://en.wikipedia.org/wiki/Unemployment

12
The Austrian School of economics and the new classical economics also share a
viewpoint with classical economics and believe that market forces are reliable means of
finding solutions to unemployment. These schools of thought argue against interventions
imposed on the labor market from the outside. Some interventions such as unionization
and bureaucratic work rules.
2.2 Fiscal Policy
Fiscal policy evolved out of the “Great Depression” when the laissez-faire system
of economic management ended, and government intervention became the means of
influencing macroeconomic variables.4 It is based on the theories of the British economist,
John Maynard Keynes (1883-1946), also known as Keynes economics, this theory
basically states that governments can influence macroeconomic productivity levels by
increasing or decreasing government spending and tax levels.5 The composition and
variations in the level of taxation and government expenditure can influence the
macroeconomic variables, among which include aggregate demand, saving and
investment, allocation of resources and income distribution. In an open economy, fiscal
policy influences the exchange rate and trade balance of the economy.
2.2.1 Stances of Fiscal policy
The state of an economy may determine the economic goals of fiscal policy. Fiscal
policy may be geared towards constraining economic growth by regulating inflation or, in
reverse, stimulate economic growth by reducing taxes, enhancing spending activities that
4 https://en.wikipedia.org/wiki/Fiscal_policy 5 https://www.investopedia.com/articles/04/051904.asp

13
will propel economic growth and facilitate borrowing and spending. The three perspectives
of fiscal policy are:
(i) Expansionary fiscal policy: This is the form of fiscal policy that involves
the lowering of taxes, increasing government spending or both, in order to combat
recessionary pressures. This is mostly used by governments when trying to stabilize
the contraction phase in the business cycle. Some typical examples of expansionary
fiscal policy programs comprise increased government expenditure on public
activities (such as roads and bridges construction, building schools) and granting
tax cuts to the residents of the economy in order to stimulate their purchasing power
so as to be able to control a decrease in aggregate demand.
(ii) Contractionary fiscal policy: The type of fiscal policy that embraces
governments increasing taxes and decreasing spending or both in order to combat
inflationary pressures. It mostly occurs when government deficit expenditure is
lower than normal, and this has the capacity to slacken economic growth if inflation
caused by a substantial increase in aggregate demand and money supply gets
higher. Thus, contractionary fiscal policy measures are adopted when growth is
untenable which results in inflation, recession, high prices of investment
unemployment above the “acceptable” level of 3 percent to 4 percent.6
(iii) Neutral fiscal policy: This measure of fiscal policy is embarked on
when an economy is neither in a recession nor a boom. There is no change in the
amount of government deficit spending over the average period of time. Thus, there
6 https://en.wikipedia.org/wiki/Fiscal_policy
14
is no impact from such a level of spending since there is no variation in government
spending.
2.2.2 Fiscal policies and fiscal adjustments
The literature on the determinants of fiscal policy both theoretical and empirical
has been extensively studied over the years. Over the last century, one pivotal debate
among economists and politicians as to whether or not government intervention in an
economy using the available monetary or fiscal policies is significant for economic
development has provided different schools of thought on the role of fiscal policy in an
economy. One school of thought believes that exogenous shocks in the economy, primarily
on the supply side via technological changes cause the rise of economic fluctuations. On
the other hand, others think that imprudent monetary policies but not government
interventions in the economy cause shocks in aggregate demand.
Neo-classical and monetarist economists stand by their argument that the market
will solve the changes in the economy by itself, thus disregarding the efficiency of policy
instruments. With rational expectations taken into the picture, they opine that private
activities will equipoise any governmental interventions in the system in the medium run.
Using the assumptions based on the Phillips curve which relates inflation and
unemployment, they make the assertion that any efforts by the government to fuel the
economy, will result in a rise in price levels which will yield no results or worsen the
economic situation. They propose that if obstructions of full market operations are be rid
of, then the actual output will tend to potential output, and the economy will gradually
attain its natural rate of employment.

15
Meanwhile, the other school of thought of economists believes that economic
wavering is fundamental to the capitalist system and replicate the usual process of the
investment production cycle (Mulas-Granados, 2004). This group of economists with
Keynesian economists sustain their thoughts on the grounds of insufficient aggregate
demand causing economic slackness and believe government interventions can stimulate
economic growth. They do not agree with the neoclassical assumption of the market
absorbing and responding to shocks by itself without any interventions. For this group of
economists, even if the operations of markets are perfectly efficient, governments still have
significant roles to play in influencing the decisions of consumers and firms through tax
policies, welfare expenditure, investment credits and provision of public goods.
Even at the point where rational expectations are taken into account, some
government activities can induce a substantial influence on the economy since wages and
prices are not as flexible as the neo-classical economist assert. These inflexibilities result
in failures in the market which government activities can provide solutions to. Government
policies may be embarked upon to influence market systems to fix some market imbalances
in certain key sectors of the economy, or more significantly in income distribution (Mulas-
Granados, 2004).
2.3 Empirical review
Considering the large empirical literature on the impact of monetary policy, fiscal
policy gained less attention in economic research until a few years back. This low attention
was at odds with the fact that numerous key public debates on the role of fiscal policy were
functioned on arguments occasioning the macroeconomic relevance of government
16
expenditure and taxation. At last, the dynamic effects of discretionary fiscal policy on
macroeconomic indicators, an archetypal subject in the large macro-econometric models
of the 1960s and 1970s has over the years been revived within the framework of vector
autoregressions in the work of Blanchard and Perotti (1999).
In recent years, there have been substantial studies on the relationship between
government expenditure and other key macroeconomic variables in different countries. But
there seems to be a limited study on government spending and unemployment nexus in
Africa. And there exists some degree of ambiguity in the outcomes of the empirical studies
which can be attributed to differences in methodologies, modeling analysis, and data
standardizations, these studies come up with diverse and mixed conclusions.
Holden and Sparrman (2016) investigated the effects of government purchases on
unemployment using panel data on 20 OECD countries spanning from 1980 to 2007.
Seeking to understand the impact of government purchases on unemployment in these
countries, they analyzed other factors such as labor market institutions, exchange rate
regimes and economic booms and downturns, and how they contribute to the measure of
the effect. According to their estimation, unemployment is reduced by about 0.3 percentage
points as a result of an increase in government purchases equal to 1 percent of GDP. They
propounded that the size of the effect is highly dependent on other factors in the economy.
The study found the effect to be greater and more persistent in countries with labor market
institutions that are less conducive to employment. Again, the study uncovered a strong
effect of fiscal policy on unemployment in countries with a fixed exchange rate and a
weaker impact under a floating exchange rate regime. The impact was observed to be
greater in recessions than in booms.

17
Analyzing fiscal policies, institutions, and unemployment in the past decades,
Bassani and Duval (2006) examined and estimated a standard model of institutional
determinants of unemployment in OECD countries. They estimated a reduced–form
unemployment equation using cross-country/time-series data for 21 OECD countries from
the years 1982-2003. Their results concluded that for the average OECD country, high and
durable unemployment benefits, high tax wedges and severe anti-competitive product
market regulation (PMR) increase unemployment. On the other hand, the study observed
that highly integrated and or centralized wage bargaining structures appear to dampen it.
Presenting an extensive sensitivity estimation results of a robust model specification,
sample estimation choice, and estimation technique, the authors alerted that their inferences
be viewed solely on the average OECD country.
In their working paper for the IMF, Bova, et al., (2015) studied the impact of fiscal
policy on employment via the Okun’s Law view. Exploring a panel data on OECD
countries over the past thirty years, the study findings exposed fiscal policy in these
countries to impact employment beyond the conventional effect it is presumed to pose via
the output multiplier. Specifically, this effect is revealed to be working effectively for a
number of items of recent discretionary expenditure and for corporate income taxes and
social security contributions. In almost all of the model specifications, Okun’s Law is
discovered to be steady, but increasing expenditure on subsidies and lower social security
contributions can intensify the effect output gap exerts on employment gaps.
Using quarterly data on GDP, private consumption, private investment, government
consumption expenditures, wages, short-term interest rate, labor force participation rate,
employment and unemployment rate from OECD countries, Pappa (2011) sought to

18
theoretically and empirically investigate fiscal expansions, unemployment and labor force
participation in OECD countries using a Structural Vector Autoregressive (SVAR)
modelling. The research findings pointed out that for a number of OECD countries, labor
force participation, employment, and unemployment rate increases significantly following
a rise in government expenditure under a mixture of specifications and identification
structures. Also, fiscal expansions lean towards a rise in real wages. Following that
previous models have encountered complications in coming up with such outcomes, the
study explained that empirical regularities can be recreated with two addenda into the
conventional New Keynesian model with corresponding frictions that is, a labor force
participation choice and workers’ heterogeneity.
In the same OECD context, Wang and Abrams (2011) in their working paper
investigated the effect of government size on the steady-state unemployment rate from a
dynamic perspective. The study employed a panel error-correction modeling technique to
examine both the short-run dynamics and the long run estimation of the unemployment
rate. Using panel data on twenty OECD countries spanning from 1970 to 1999 and
controlling for simultaneity bias, the results of the study suggested that the size of
government measured as total government outlays as a percent of GDP, significantly affect
the steady-state unemployment rate. Specifically, when government spending is partitioned
into various categories, transfers and subsidies are discovered to exert a significant effect
on the steady-state unemployment rate whereas government purchases of goods and
services have no significant effect on the steady-state unemployment rate.
Seeking to explore the unemployment effects of fiscal policy in Netherlands, Unal
(2015) made use of a Vector Autoregressive (VAR) analysis with the identification scheme

19
of Blanchard and Perotti (2002) on a quarterly data covering the period 1960:1 to 2007:3
on unemployment rate and the fiscal variables government spending, net tax, social
security tax and the control variables. The findings of the study revealed that
unemployment increases following a fiscal shriveling while fiscal expansion causes a fall
in unemployment. There was also an indication from the results that a social security tax
initiative exerts a positive impact on unemployment, that is it causes a rise in the
unemployment rate. Furthermore, the study discovered that a social security tax innovation
is a more efficient scheme as compared to total net tax policies in the Netherlands in terms
of GDP and its private factors. In total, the study investigations reveal that the Netherlands
economy possesses the features of Keynesian theory in the view that a rise in government
spending and taxes exert opposing effects on investment.
In his article, Tagkalakis (2013) studied the unemployment effects of fiscal policy
in Greece utilizing an SVAR methodology based on Blanchard and Perotti (2002) SVAR
methodology. Incorporating a quarterly data on Greece spanning from 2000 to 2012, and
using a parsimonious specification due to sample size, the variables examined were real
government spending, real net taxes, real GDP and unemployment as the dependent
variable. The study observed that unemployment and growth impacts can be fairly sizeable
in the situation of cuts in government purchases, in particular, government consumption
and to lower the extent of government investment. Thus, the findings indicated that an
increase (cut) in government purchases and its subcomponents such as government
consumption expenditure, government wage bill, and government investment reduce
(increase) unemployment and unemployment rate. Conversely, an increase in taxes reduces
output and increase unemployment, especially those leading to higher implicit direct and

20
indirect tax rates. The study further remarked that the impact of fiscal policy shocks on
output and unemployment is more sizeable when taking into account recent year
improvements. Both unemployment and output respond in a highly consistent way as
compared to pre-crisis years.
Monacelli et al. (2010) examined the effect of fiscal policy on the US labor market
by employing the VAR estimation. Identifying government shocks on the basis of the
approach of Blanchard and Perotti (2002), they observed that an increase in government
spending of 1 percent of GDP generates about 1.2 percent output (at one year) and 0.6
percentage points in unemployment multipliers (at the peak). Whereby each percentage
point increase in GDP results in a rise in employment of approximately 1.3 million jobs.
They also found that total hours, employment and job finding probability all rise while the
separation rate falls.
Mountford and Uhlig (2009) proposed and applied a new approach for analyzing
the impacts of fiscal policy in the US economy using vector autoregressions. In particular,
the paper employed sign restrictions to detect a government revenue shock as well as a
government spending shock, while regulating a generic business cycle shock and a
monetary policy shock. The vector autoregressions methods were applied to US quarterly
data from 1955 to 2000. The study plainly made allowance for the likelihood of
announcement effects, that is, that a present fiscal policy shock changes fiscal policy
variables in the future, but not at present. Creating the impulse responses to three linear
amalgamation of these fiscal shocks, and paralleling to the three settings of deficit-
spending, deficit-financed tax cuts and a balanced budget spending expansion, the study
discovered that deficit-financed tax cuts work profoundly well among these three

21
situations to enhance GDP, with a maximum present value multiplier of five dollars of total
surplus GDP per each dollar of the total cut in government revenue five years after the
shock.
Pappa (2009) attempted to examine the effects fiscal shocks pose on employment
and the real wage. Studying the transmission of fiscal shocks in the US labor market, the
paper utilized a Structural Vector Autoregressive (SVAR) modeling technique and a base
identification on the constrictions that shock to government consumption, employment,
and investment must advance output and deficits. Characterising on a set of conventional
robust theoretical restrictions on the impact of fiscal shocks on output and the deficit
generated by standard Real Business Cycle (RBC) and New Keynesian models to detect
fiscal disruptions, as well as exploring the dynamics they exert on real wages and
employment, the study revealed that real wages and employment concurrently rise
significantly following government consumption and investment shocks. This effect of the
shocks occurs both in the aggregate and for most of the states in the US that were
investigated. Meanwhile, the aggregate rise in government employment increases the real
wage and total employment; in one-third of the states, the latter falls.
In the same United States, Mahdavis and Alanis (2013) re-examined the
relationship between unemployment and government expenditure in a panel of 50 US
States and Local Governments (SLGs). To present new pre-recession empirical evidence
that places the expectations on the impact of the federal relief to SLGs in a wider view, the
study covered the period from 1977 to 2006. The study findings revealed that per capita
real public spending (total and capital, assistance and subsidies, wages and salaries, and
social insurance categories) was a factor of a cointegrating relationship with the

22
unemployment rate and real per capita state personal income. Exempting social insurance,
other spending variables, when statistically significant, exhibited a depressing impact on
the unemployment rate. Again, the weight of this impact, however, was small in general.
The most sensitive effect on the unemployment rate was increased in wages and salaries.
Moreover, the analysis of a long- term causality centered on panel error-correction
coefficients showed a steady proof of a causal effect from spending to the unemployment
rate, but less consistent evidence of such impact in a contrasting direction. However, social
insurance was revealed as a driving factor for the unemployment rate. Further, the findings
of the research exposed the size of the error-correction coefficients to slacken the response
of the unemployment rate to digressions from the cointegrating relationship. Meanwhile,
the marginal impact spending induces on the unemployment rate increased with the amount
of the federal grants received. The study in total proposed that public spending may not
serve as a fast solution in relation to the unemployment rate, but the results seemed to
support the distribution of the federal funds to wage and salaries and assistance and
subsidies, but not to capital and social insurance expenditures to the lower unemployment
rate.
Employing a structural vector autoregression model (SVAR) to extrapolate the
causal response of fiscal policy to macroeconomic conditions, Huidrom et al.,(2018)
investigated the challenges of fiscal policy in emerging and developing countries. They
presented an extensive and systematic analysis of the availability of fiscal policy and the
utilization of fiscal space in emerging and developing economies by specifically using an
event study to evaluate fiscal space and policy during economic contraction events. The
study covered 196 countries and incorporated two broad categories of the dataset; annual

23
data ranging from 1980 to 2016 and a quarterly data with maximum coverage from 1980Q1
to 2014Q1 specifically used for estimating the SVAR model. Tracking the evolution of
fiscal space policy measures, they analyzed the dynamics of fiscal space and policy during
economic contractions, with the experience of the great recession and other previous
episodes of contractions being a point of comparison. The findings of the study showed
that emerging and developing economies fostered fiscal space in the transition to the great
recession of 2008-2009 which was later utilized and helpful for stimulus. Afterward, fiscal
space has declined and remains dwindling as these economies historically have benefited
from low-interest rates. Again, they discovered that fiscal policy in emerging and
developing countries turned out to be countercyclical, and it has been advancing since the
1980s, and the cause can be attributed to several factors such as policies and institutions
improvements and enhanced financial markets.
In the African context, Murwirapachena et al. (2013) investigated the effects of
fiscal policy on unemployment in South Africa using a vector autoregression (VAR) model
on an annual time series data from 1980 to 2010 that involved the variables; government
spending, government investment, tax, and unemployment. The study adopted the model
used by Baxter and King (1993) as further explored by Fatas and Mihov (2001) who
estimated employment against fiscal and non-fiscal variables. Murwirapachena et al.
(2013) adjusted the model to suit the situation of South Africa. Applying all the necessary
diagnostic tests, they subsequently tested for cointegration and applied a vector error
correction model (VECM) to estimate the long-run effect of fiscal policy on unemployment
and the other economic indicators. The results of their study showed that government
consumption expenditure and tax have a positive effect on unemployment while

24
government investment expenditure has a negative impact on unemployment in South
Africa. Based on the results of their research, they recommended that the South African
government reduce the corporate tax rate from 28 percent to numbers below 20 percent as
adopted by some OECD countries' policy framework.
Nwosa (2014), utilized an Ordinary Least Square (OLS) estimation technique to
investigate the impact of government expenditure on unemployment and poverty rates in
Nigeria. Annual timeseries data on the variables; unemployment rate, poverty rate,
government expenditure, public debt and economic growth from the period 1981 to 2011
were employed. The results of the study presented a positive and significant effect of
government expenditure on the unemployment rate. On the other hand, there was a negative
and insignificant relationship between government expenditure and the poverty rate.
With the same country under study, Kelechukwu and Amadi (2016) assessed the
relationship between fiscal policy and the unemployment rate in Nigeria using a
parsimonious Error Correction Model (ECM) to an annual time series data spanning from
the period 1970 to 2013. With government expenditure, government debt stock,
government tax revenue, and the unemployment rate are the key variables, the study
revealed that there is a negative relationship between fiscal policy tools (government
expenditure and government debt stock) and the unemployment rate in Nigeria while
government tax revenue positively impacted the unemployment rate. This means that a rise
in tax rate increased the unemployment rate in Nigeria. According to their study, there
existed also a long-run equilibrium relationship between fiscal policy and unemployment
in Nigeria. Concluding the study, the authors suggested based on the outcome of the
empirical and other theoretical analysis that the Nigerian government strongly implement
25
viable fiscal and monetary policies and diversify the country’s economy to attract more
foreign investors and create more job opportunities for people.
In examining the dynamic effects of fiscal policy on output and unemployment in
Nigeria under the Keynesian framework, Abubakar (2016) utilized the structural vector
autoregression (SVAR) methodology with long-run restrictions proposed earlier by
Blanchard and Quah (1989) to analyze annual series of data on the variables; Gross
Domestic Product, (GDP), unemployment rate, public expenditure and total revenue.
Annual time series data covering the years 1981 to 2015 were used. The result of the SVAR
model analysis revealed that shocks in public expenditure exert positive and a long-term
effect on output. Meanwhile, shocks in total revenue showed a negative impact but only in
the short run. In the conclusion of the entire research, the study suggested that the
government restructure its spending, and also enhance its revenue by enlarging its revenue
base through effective and efficient tax systems.
Employing a panel threshold model to assess the relationship between government
consumption and employment, N’guessan (2017) evaluated an annual dataset of 41 African
countries covering the period from 1980 to 2014. The study observed a threshold effect in
the relationship between government consumption ratio and employment whereby the
optimal government consumption ratio is 20.43 percent. Again, most of the countries’
government consumption ratio was above the threshold value during the period from 1981
to 1987. After 1987, most of the countries reached the low regimes of government
consumption. The outcome of the estimation showed that below the optimal value which
was 20.43 percent, government consumption has a positive and significant effect on
employment. Nonetheless, beyond the optimal value, the government consumption ratio

26
has no effect on employment. The findings from the study suggested that a non-linear
nature of the relationship between government consumption and employment should be
considered in evaluations since ignoring that could lead to misleading policing
recommendations.
For the past years, quite extensive research has evolved concerning government
expenditure as a fiscal policy tool and other key macroeconomic indicators aside
unemployment in various developed, emerging and developing countries. For instance,
Folawewo and Adeboje (2017) built their analysis on Okun’s Law and Philips curve
theoretical frameworks to determine the relationship between some macroeconomics
aggregates and unemployment in the Economic Community of West African States
(ECOWAS). Making use of the fixed effects and random effects estimation of panel data
as well as fully modified ordinary least squares (FMOL) panel data estimation technique
on an annual data spanning from 1991 to 2014, they empirically examined both aggregate
ECOWAS data level and a sub-regional level, that is, Francophone and Anglophone
country levels.
The outcome of the study exposed that gross domestic product (GDP) growth has
a reducing but insignificant impact on the unemployment rate, which indicates low
employment elasticity of growth in the region. Inflation exerted a prodigious positive effect
on unemployment, presenting invalidity of the Phillips curve hypothesis. Another vital
finding of the study was the positive effect of labor productivity on the unemployment rate,
manifesting a trade-off between labor productivity and employment. Meanwhile, foreign
direct investment (FDI) and external debt exhibited a weak negative impact on
unemployment, but population growth showed a positive effect. The study recommended

27
the essence of an enabling macroeconomic environment that will ensure the creation of
employment in the ECOWAS region.
In the same region, Magazzino (2016) investigated fiscal variables, net lending,
government expenditure and revenue, and growth convergence in the ECOWAS region.
Incorporating a yearly data series covering the period 1980 to 2011 in 15 Economic
Communities of West African States (ECOWAS) countries, the relationship among fiscal
variables, economic growth and trade was examined through panel data econometric
technique. The study further analyzed the long-run relationship between the fiscal variables
and economic growth. From the paper’s empirical analysis, government expenditure and
revenue exhibited pro-cyclical impact on the West African Economic and Monetary Union
(WAEMU) and ECOWAS countries, while fiscal balance showed a pro-cyclical nature for
WAEMU during the years 1999 to 2011.
Also, there was a weak long-run relationship between government expenditure and
revenue, but for only the case of the West African Monetary Zone (WAMZ) countries.
From the Granger causality analysis, there was a mixed outcome for WAEMU countries.
Meanwhile, for four out of the six WAMZ countries (Gambia, Liberia, Nigeria, and Sierra
Leone) the claim of the “tax-and-spend “hypothesis stands since government revenue
usually stimulates government spending. The study revealed that in the last three decades,
there has been a decrease in the variability of the cyclical component of economic growth,
both for WAEMU and WAMZ member states.
Attempting to explore the relationship between government expenditure and
economic growth, Ogundipe (2013) investigated fifteen ECOWAS countries by adopting
a panel data estimation framework covering annual data series from 2000 to 2010. Using

28
the fixed effects and random effects estimation technique, the Hausman test used in the
model estimation accentuated the suitability of the fixed effect model. The study revealed
that government expenditure induces a positive inelastic variation on economic growth
while the growth rates of government expenditure exert a nearly perfect inelastic negative
variation on GDP growth rates, and this was linked with the weak fiscal discipline in the
economy of Nigeria. The results from the estimation of growth rates were considered more
relevant to the study since the presence of rates would have justified the periodic effect.
The study suggested policy recommendations such as the essence of developing institutions
that would warrant a realistic, transparent and appropriate direction of government
spending towards productive economic activities.
Endogenous growth theory extrapolates that the effect of fiscal policy on growth
depends on the structure as well as the level of taxation and expenditure and so using a
panel data estimation technique to analyse a more up to date data on some selected Sub
Saharan African countries covering the years 1990 to 2012, Ugwuanyi and Ugwunta (2017)
examined fiscal policy and its effect on economic growth in those countries. Basing the
study on ex-post facto research design, the authors divided the fiscal policy variable into
four categories; productive expenditure, unproductive expenditure, distortionary taxes, and
non-distortionary taxes.
The findings of the research using the panel data estimation technique under the
fixed-effect assumptions disclosed that government productive, unproductive
expenditures, distortionary tax (a proportional tax on output at the rate) and non-
distortionary taxes have a significant impact on the economic growth of sub-Saharan
African countries. It was discovered that distortionary taxes increase economic growth

29
while productive expenditures impede the economic growth of Sub Saharan countries. The
findings of the study also proposed that consumption taxation can pragmatically be
considered as non-distortionary instead of being regarded as barely a mild distortionary as
compared to income taxation. On the other hand, the budget balances of sub-Saharan
African countries were revealed to exert a positive but insignificant impact on the economic
growth of sub-Saharan African countries.
Besides the use of the fixed and random effects panel data estimation technique to
assess the effect of fiscal policy on economic growth, Adefeso (2016) analysed the
performance of productive government expenditure on the economic growth of sub-
Saharan Africa by using a Generalised Method of Moments (GMM) estimation technique
on a dynamic panel data model. The study explored 20 sub-Saharan African countries with
the estimated years spanning from 1980 to 2010. Following close to the findings of
Ugwuanyi and Ugwunta (2017), the outcome of the study disclosed an antithetical link
between productive government spending and economic growth in sub-Saharan African
countries. Divergent from the expected results of the study but analogous with most
previous studies, productive government expenditure showed a negative effect on
economic growth. The budget deficit was also revealed to impact negatively on economic
growth which is also similar to studies conducted on most African countries.
Moreover, the study uncovered productive government expenditure to not really
being productive most particularly when financed by non-distortionary government tax
revenue in the sub-Saharan African region, thus, concluded that productive government
expenditure and its matching source of funding are counterproductive for the economic
well-being of African countries.

30
Using the same Generalised Method of Moments (GMM) estimation technique,
Adamu et al. (2017) conducted a study on globalization and its influence on unemployment
in sub-Saharan African countries. Evaluating 35 selected countries in the sub-Saharan
African region for the period 2007 to 2014, the empirical results of the study exposed the
significant effect of the aggregated globalization measures (economic, social and political)
on the unemployment rate. Meanwhile, amongst the components of globalization, political
globalization is the sole constituent that reduces unemployment. Economic growth rate and
labor market regulations showed a significant and negative relation to unemployment while
inflation and wage rate exerted a positive effect on the rate of unemployment.
Since the study findings showed that stagflation exists in SSA at the moment,
sustaining a low level of inflation is significant to addressing the unemployment situation
in sub-Saharan Africa. Therefore, the study recommended that policies aimed at cutting
down the unemployment rate should target low inflation rates, political globalization, labor
market regulation, and economic growth. Governments in the region should embark on
policies that would safeguard the regulations of the labor market to be more flexible so that
the true value of globalization can be absorbed into their economies which can lead to a
significant reduction in the unemployment rate.
In the same sub-Saharan African region, Ahmed and Hanif (2018) evaluated the
validity of Wagner’s law by studying the impact of public expenditure on the economic
growth of ten selected sub-Saharan African countries. The paper tested five variants of
Wagner’s law for the period 2005 to 2014, employing a panel data estimation approach
involving cointegration and causality. The results of the study uncovered a long-run
relationship between public expenditure and the other explanatory variables used as

31
substitutes for income. The long-run causality tests pointed out a bidirectional causality
between expenditure and income in all models with the exclusion of the Gupta model. The
research concluded that for the Sub-Saharan Africa region, both Wagner’s law the
Keynesian hypothesis have a valid tendency under the period of study. The reason being
that there has been a predisposition of public expenditure growing relative to national
income (Wagner’s law) and that public spending is a policy mechanism (an exogenous
factor) for increasing national income (Keynesian hypothesis) during the 10-year period.
Since subsequent studies on the government expenditure and growth nexus present
inconclusive empirical results, Yasin (2011) reassessed the impact of government spending
on economic growth making use of a panel data set spanning from 1987 to 1997 of 26 sub-
Saharan African countries. The model was estimated using two alternate panel data
estimation methods; fixed effects and random effects. The model was formed from an
aggregate production function with government spending, foreign assistance for
development and trade-openness as the explicit input factors. The findings from the fixed
effects and random effects estimation techniques showed that government spending, trade-
openness, and private investment spending exert a positive and significant impact on
economic growth. The growth rate in the population and foreign development assistance
were statistically insignificant. A restricted version of the model was tested, and it revealed
that the influence of foreign development assistance and the population growth rate on
economic growth are statistically zero.
In the context of Asia, Matsumae and Hasumi (2016) conducted a study on the
impact of government spending on unemployment in the Japanese economy. The study
estimated a twelve variable model using quarterly data from 1980Q2 TO 2012Q4. Tailing

32
the model of Gali et al. (2012) into a medium-scale DSGE model with the impact of
government consumption to kindle private consumption and the effect of government
investment to enhance the productivity of private firms in the short run via the accretion of
public capital. The findings of the research presented evidence that showed that both
government consumption and investment reduce unemployment. And the attribute of this
reduction is channeled to the traditional impact of a perk up in aggregate demand. On the
other hand, the effect of government consumption expenditure to stimulate private
consumption is relatively small. The study also discovered that there exists a short-term
effect of government investment on the productivity of private firms which increases real
wage but does not exert much impact on unemployment variations.
A study by Zhang and Zou (1998) sought to investigate fiscal decentralization,
public spending and economic growth in China. With the interest of exploring how the
apportionment of fiscal resources between the central and local governments has impacted
the Chinese economic growth since the reforms commenced in the 1970s, the study
estimated an annual data series covering the period 1980 to 1992 for 28 provinces. The
empirical analysis presented results that showed a higher degree of fiscal decentralization
of government spending linked with a lower provincial economic growth over the past 15
years. The negative linkage between fiscal decentralization and provincial economic
growth was found to be steadily significant and robust in China. The outcome was quite
shocking in the sense of the conventional view that fiscal decentralization customarily
contributes positively to local economic growth. This surprising result was attributed to the
recent stage of economic development in China, where the central government is
incessantly constricted by the inadequate resources for public investment in national

33
priorities such as highways, railways, power stations, telecommunications, and energy.
Such essential infrastructure projects may induce a substantial effect on growth across
provinces than their counterparts in each province.
In the same Asian region, Tulsidharan (2006) empirically reviewed the effect of
government expenditure on economic growth in India using annual data on government
final consumption and gross national product (GNP) at market price in nominal and real
terms covering the years 1960 to 2000. The paper employed the Granger causality analysis
to examine a bio-directional causality between government expenditure and economic
growth as well as an error correction model to estimate the long-run relationship between
government expenditure and economic growth. The data at the current price exhibited a
unidirectional causality from GNP at market price to government final consumption
expenditure. Meanwhile, the data in real term levels failed to confirm the causality test.
The principal findings of the study revealed that in nominal terms, an increase in
government final consumption expenditure results in an invariably higher economic
growth in India.
Rehman et al., (2010) attempted to examine the state and the direction of causality
between public spending and national income along with various chosen components of
public expenditure in Pakistan. The study utilized the Toda-Yamamoto causality test to
Pakistan data from 1971 to 2006. The results of the causality analysis showed that there
exists a unidirectional causality moving from GDP to government expenditure, which is in
support of Wagner’s Law. Furthermore, disaggregating government expenditure into
different levels, the study disclosed that only GDP causes administrative expenditure while
there was no causality revealed in development expenditures, defense expenditures and

34
debt-servicing expenditures. In total, the study did not favor the existence of the Keynesian
hypothesis both at the aggregate and disaggregate levels of public expenditures causing
economic growth in the Pakistani economy.

35
CHAPTER THREE
OVERVIEW OF THE TRENDS IN GOVERNMENT EXPENDITURE AND
UNEMPLOYMENT IN SUB-SAHARAN AFRICA
3.0 Introduction
This chapter presents the trends in the two forms of government spending
understudy and unemployment in some of the countries in Sub-Saharan Africa.
Analysis of the performance of fiscal policy over the years in some of the countries in
the region will be discussed and also there will be an outlook at the labor market to see
if there has been an improvement over the years. It is organized into two broad
sections. The first section presents the review of fiscal policy implementation in some
African countries and the second section presents a general overview of the trends in
unemployment in Africa.
3.1 Overview of Fiscal Policy Implementation in Sub-Saharan Africa
Most of the developing nations in Sub-Saharan Africa devoted to government
interventionist policies during the early 1960s. However, the setbacks of these failures
resulted in economic and institutional reforms in the 1990s which were instigated by
a constricted role of the state, chiefly targeting property rights improvements, raising
taxes, regulating the monetary base, providing basic education, health and
infrastructure, and public services. In spite of all these conventional initiations, the
burden of the public sector is still very weighty in most of the countries in the Sub-
36
Saharan region, which induces some sort of constrictions on the design and
implementation of fiscal policies.
According to (Auerbach,1995), fiscal policy implementation has a number of
constraints subjected to it. These constraints may arise from among other factors such
as strategic considerations that result in overambitious fiscal targets, difficulties in
real-time forecasting of downturns and bounce backs, weak budget procedures, and
political pressure to overspend or under tax. In 2015, the IMF reported that Sub-
Saharan Africa’s growth was to decelerate amidst weak global economic conditions,
but some countries in the region were in good shape to continue posting strong growth.
Commodity exporting countries in the region especially oil producers such as Angola,
Equatorial Guinea, Nigeria, and the Republic of Congo, but also producers of minerals
and metals, such as Botswana and Mauritania have been recognizing setbacks to
growth. In other cases, growth miseries, such as in the cases of South Africa and
Zambia, are intensified by domestic factors, notably electricity supply bottlenecks.
Political and social tensions are taking a stroll on economic activity in Burundi and
South Sudan. However, several countries, like Côte d’Ivoire, Ethiopia, Mozambique,
Rwanda, and Tanzania, are fighting the weakening regional trend and continuing to
post robust growth.
According to (Andrews, 2010; Peterson, 2010) budgets made by governments
in SSA are often better on paper than they are put into effect. In general, governments
of Sub-Saharan countries encounter lots of challenges in implementing fiscal policy
due to certain factors such as:

37
i. Inequitable distribution of income and the ever-growing proportion of the
population stung by extreme poverty;
ii. Lack of suitable incentives for the private sector operations in terms of
regulatory structures, judiciary systems, and competitive advantage.
iii. Governmental and institutional incompetence as a consequence of several
rigidities as well as credibility and governance challenges.
iv. Numerous market failures due to imperfect information, the incidence of
monopolistic customs and different forms of negative externalities.
v. Susceptibility to external shocks of all nature; natural disaster, world prices
of exported goods, over dependency on volatile and unpredictable aid flows, etc.
Further constraints include frailties in forecasting capacity, poor data quality,
inadequate and ineffectual budget institutions, slackness in project execution, and unstable
political systems (IMF, 2010).
Sub-Saharan African countries in the past two decades have put into effect
macroeconomic policies from the perspective of a structural adjustment program. The IMF
report in 2015 further indicated that policy buffers were low in most of the countries and
thus, constraining the response to the current environment and pointing out the essence for
African countries to improve domestic resource mobilization and improve public
expenditure efficiency to establish fiscal space via proper prioritization of crucial public
services and infrastructure (IMF,2015).

38
According to the same report in 2015, policy uncertainty, fiscal consolidation,
electric power shortages, and rising import costs were expected to lessen gradually to help
in promoting growth in Nigeria. South Africa was forecasted to still be in the battle of
higher unemployment rates, persistent power and infrastructure constraints coupled with
complicated labor relations and policy insecurity weigh on activity. Angola was expected
to experience a modest resurgence in spite of the increase in oil production, as government
spending stays constrained, and higher inflation weighs on household consumption.
3.2 Trends in Unemployment and Fiscal Policy in Sub-Saharan Africa
Unemployment has experienced fluctuating movements over the past decade in
Africa. Most of the countries still have significantly high rates of unemployment. The
graphs in appendix 1A show trends in unemployment (% of the total labor force) for all the
countries in the sample, grouped based on regions. The graphs show a consistent decline
in unemployment after 2010, though the values remain relatively high. This shows that
unemployment remains a major predicament in Africa. Countries such as South Africa and
Sierra Leone have recorded the highest unemployment rates in Africa. South Africa had
unemployment as high as 27.1% in 2018, while Sierra Leone recorded over 50% of the
total labor force is unemployed. Other countries have however made great strides. Rwanda
as of 2018 has less than 1% of the total labor force is unemployed, Tanzania has less than
2%, Cote D’lvoire has a little above 2%. Niger has below 1% and Madagascar has close to
2%.

39
Based on the regional comparison, the problem seems to be exacerbated in Southern
Africa, West Africa, and Central Africa, compared to East Africa. Nevertheless,
unemployment is still a predominant issue plaguing Africa as a content.
Fiscal policy involves government spending and taxation. This study, however,
concentrates on government spending as the major tool for fiscal policy. Governments
spend on a variety of activities. Ranging from more recurrent expenditures such as
workers' compensation to capital expenditures such as infrastructure spending. The graphs
in appendix 1B show trends in government consumption and investment spending as a
percentage of GDP for all the countries in the sample, grouped by regions.
Government consumption expenditure has been fluctuating over the period under
study. However, generally, it has been on an upward trend over the period. Most of the
countries have recorded more than 20% at different points from 1990 to 2018.
Consumption expenditure is generally considered less growth-enhancing compared to
capital expenditure. Therefore, the growing size of government consumption has become
of great concern in Africa. Growing wage bills has been a major contribution to the rising
trend in government consumption expenditures. This is due to the ever-growing pressure
on the governments of these countries to expand the public sector to absorb the growing
number of unemployed people.
Administrative expenses are also major contributors to rising consumption
expenditures. Most countries in Africa have large government size with rampant
bureaucracies that impose high administrative costs. Corruption, which is a major issue in
African politics also imposes significant costs. This spending is considered less beneficial
to employment generation than investment expenditure. Investment spending has similarly

40
experienced an upward trend. A comparison with consumption expenditure, however,
shows that consumption expenditure exceeds investment expenditures. Much of the
investment expenditures in most African countries have been mainly financed through
external borrowing, rather than from internally generated incomes.
The rising government spending especially investment spending is expected to
result in increased employment, and hence reduce the level of unemployment in the
country. This constitutes the major goal of this study. The result is will seek to establish
the nature of the relationship between government spending and unemployment in Sub-
Saharan Africa, and hence determine how effective fiscal policies have been, as tools to
stabilizing the macroeconomic variables especially unemployment.

41
CHAPTER FOUR
METHODOLOGY AND DATA
4.0 Introduction
This chapter presents the methodology and data used in the study. The chapter is
categorized into two main sections. The first section (methodology) focuses on the various
steps taken to attain the goal of the study, model specification and estimation technique for
the study. Section two, on the other hand, encompasses the data used in the analysis,
definition of variables, the sources of data and its measurement and theoretical framework
of the variables incorporated.
4.1 Methodology
In this section, the estimation technique and model specification of the research will
be established. The study will encompass the panel data estimation technique on 34 sub-
Saharan African countries for the period 1990 to 2017. Panel data models examine group
(individual-specific) effects, time effects, or both in order to deal with heterogeneity or
individual effect that may or may not be observed (Park, 2011). These effects are either
fixed or random effect.
There will be three techniques of the panel data estimation analysis, namely pooled OLS
regression, fixed effects and random effects modeling. To prevent any spurious analysis in
the first place, a test for stationarity of variables will be conducted to ensure that the

42
variables are stationary. The Fisher type Panel unit root test developed by Choi (2001) will
be used for this study. We will then examine the effect of government spending on
unemployment in a pooled OLS regression.
The pooled OLS produces efficient and consistent parameter estimates if the
individual effect (cross-sectional or time-specific effect) does not exist (Park,2011). Thus,
a baseline model will be constructed and then an initial pooled OLS estimation will be
analyzed.
𝑦𝑢 = 𝛼 + 𝑋𝑢𝛽 + 𝜀𝑢 (𝑢𝑖 = 0) …………………………………………………… (1)
I will proceed to estimate the fixed and random effects models. The major
difference between fixed effect models and random effect models exist in the role of
dummy variables. Fixed effect model examines whether intercepts vary across groups or
time periods. It evaluates the individual differences in intercepts, by assuming the same
slopes and constant variance across individual (group and entity). The fixed effect model
is estimated by least squares dummy variable (LSDV) regression (OLS with a set of
dummies) and within effect estimation methods (Park, 2011). The generalized fixed effect
model is given by;
𝑦𝑢 = (𝛼 + 𝑢𝑡) + 𝑋𝑢𝛽 + 𝑣𝑢 ……………………………………………………….. (2)
The random effect model presumes individual effect (heterogeneity) to be
uncorrelated with any regressor and then estimates error variance specific to groups (or
times). The intercepts and slopes of the regressors are the same across individuals or time
periods. The difference among individuals (or time periods) lies in their individual specific

43
errors, not in their intercepts (Park, 2011). The generalized random effect model is given
by;
𝑦𝑢 = 𝛼 + 𝑋𝑖𝑡𝛽 + (𝑢𝑡 + 𝑣𝑖𝑡)…………………………………………………… (3)
Following these two model estimations, a Hausman specification test (Hausman, 1978)
will then be evaluated to determine the appropriate model for the study.
4.1.1 Model Specification
To investigate the impact of government spending on unemployment, the study will
model unemployment as a function of fiscal policy tool, government expenditure, by
disaggregating government expenditure into recurrent (government consumption
expenditure) and capital (investment expenditure), the relevant control variables; foreign
direct investment (FDI), population growth, agriculture sector, external debt and private
investment. The baseline model for the panel data analysis is specified below;
UNEMP = f (GOVCONS, GOVINV, FDI, POPG, AGRIC, EXTD, PRINV)
To estimate the β parameters, the function is transformed into the generalized equation
below;
𝑈𝑁𝐸𝑀𝑃𝑡 = 𝛽0 + 𝛽1𝐺𝑂𝑉𝐶𝑂𝑁𝑆𝑡 + 𝛽2𝐺𝑂𝑉𝐼𝑁𝑉𝑡 + 𝛽3𝐹𝐷𝐼𝑡 + 𝛽4𝑃𝑂𝑃𝐺𝑡 + 𝛽5𝐴𝐺𝑅𝐼𝐶𝑡 +
𝛽6𝐸𝑋𝑇𝐷𝑇𝑡 + 𝛽7𝑃𝑅𝐼𝑉𝑇𝐼𝑁𝑉𝑡 + 𝜇𝑡…………………………..……………………… (4)
Where;
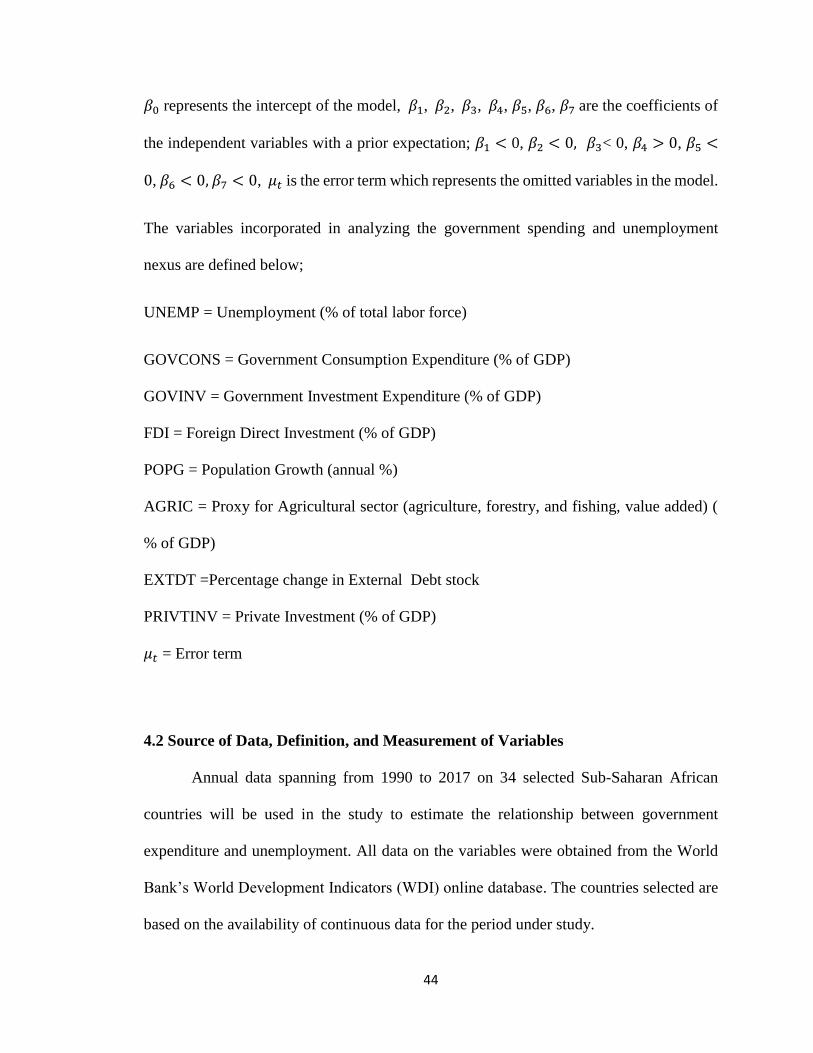
44
𝛽0 represents the intercept of the model, 𝛽1, 𝛽2, 𝛽3, 𝛽4, 𝛽5, 𝛽6, 𝛽7 are the coefficients of
the independent variables with a prior expectation; 𝛽1 < 0, 𝛽2 < 0, 𝛽3< 0, 𝛽4 > 0, 𝛽5 <
0, 𝛽6 < 0, 𝛽7 < 0, 𝜇𝑡 is the error term which represents the omitted variables in the model.
The variables incorporated in analyzing the government spending and unemployment
nexus are defined below;
UNEMP = Unemployment (% of total labor force)
GOVCONS = Government Consumption Expenditure (% of GDP)
GOVINV = Government Investment Expenditure (% of GDP)
FDI = Foreign Direct Investment (% of GDP)
POPG = Population Growth (annual %)
AGRIC = Proxy for Agricultural sector (agriculture, forestry, and fishing, value added) (
% of GDP)
EXTDT =Percentage change in External Debt stock
PRIVTINV = Private Investment (% of GDP)
𝜇𝑡 = Error term
4.2 Source of Data, Definition, and Measurement of Variables
Annual data spanning from 1990 to 2017 on 34 selected Sub-Saharan African
countries will be used in the study to estimate the relationship between government
expenditure and unemployment. All data on the variables were obtained from the World
Bank’s World Development Indicators (WDI) online database. The countries selected are
based on the availability of continuous data for the period under study.

45
i. Unemployment: According to WDI, unemployment is the share of the labor force that
is without work but available for and actively seeking employment. It is measured as a
percentage of the total labor force and the data is modeled according to the International
Labor Organisation (ILO) standards.
ii. Government Consumption Expenditure: This is a recurrent government expenditure
which includes all government current expenditures for purchases of goods and services
(including employees’ compensation). It also includes most expenditures on national
defense and security but excludes government military expenditures that are part of
government capital formation (WDI,2019). The variable is expressed as a percentage of
GDP. Empirically, the variable is expected to have no improvements in employment.
Considering the examples mentioned earlier (workers’ salaries, purchases of goods and
services, expenditures on national defense), the labor market is actually affected by these
expenditures since job creation is not realized from such spending.
iii. Government Investment Expenditure: This type of government spending involves
public financed infrastructure projects such as roads, railways, schools, hospitals, housing
and communication networks. The public sector develops some projects with desired social
returns (public goods) which may not seem profitable for the private sector. Governments
can use the public direct investment for countercyclical policy objectives. For example,
many OECD governments initiated fiscal stimulus plans via an increasing public
investment in soft and hard infrastructures during the 2008 economic downturn
(OECD,2013). Through these projects, employment is created. Thus, the expectation of
this variable is to decrease unemployment.

46
iv. Foreign Direct Investment (net inflows): According to WDI, FDI is the net inflows
of investment to acquire a lasting management interest in a company operating in an
economy other than that of the investor. It is the sum of equity capital, reinvestment of
earnings, other long-term capital, and short-term capital as shown in the balance of
payments. Foreign Direct investment represents the investment involving a long-term
relationship and reflecting a lasting interest and control of a resident entity in one economy
(foreign direct investor or parent enterprise) in an enterprise resident in an economy other
than that of the foreign direct investor (Orji, Orji, Nchege, & Okafor, 2015). For most
African countries where capital acquisition is a major constraint, FDI performs a principal
role in job creation. Employments generated from FDI inflows also have a tendency of
improving the aggregate labor productivity in the host county (Coniglio et al., 2015). There
exist evidence of such productivity advantages of Foreign Direct Investment (Conyon et
al., 2002; Girma and Görg, 2007; Arnold and Javorcik, 2009).
v. Population Growth: Population growth is generally considered as an increase in the
number of people living in a country, state, county, or city. The study will utilize population
growth measured as an annual percentage rate in the empirical estimation. According to
WDI estimation, the population variable is based on the de facto definition of population,
that is it records all residents regardless of legal status or citizenship. Among major areas,
Africa has a higher rate of population growth. According to a 2019 report by the United
Nations (UN) on population, Africa will possess more than half of the world’s population
growth between now and 2050 and the population of sub-Saharan Africa is estimated to
double by 2050. The region’s population is projected to account for a higher population
growth rate over the coming decades whereas other regions are expected to experience a

47
decrease in population growth rate. Most empirical literature supports the negative impact
population growth has on employment. Herrin and Pernia (2014) propounded in their study
that rapid population growth that results in an increase in the labor force could exacerbate
the unemployment situation in developing countries. In the ECOWAS region, the active
labor force population represents more than half of the entire regional population (World
Bank, 2015); nonetheless, the region has not profited from this enormous pool of labor
force. It is rather an encumbrance.
vi. Agriculture: Agriculture valued-added was used as a proxy for the agriculture sector.
This variable is measured as a percentage of GDP. Based on WDI measure, agriculture
value-added constitutes forestry, hunting, and fishing, as well as cultivation of crops and
livestock production. Value added is the net output of a sector after adding up all outputs
and subtracting intermediate inputs (WDI, 2019). Significant shares of the employed
population in Africa continue to work in agriculture (ILO, 2018). In the sub-Saharan
region, the agricultural sector employs a larger pool of the labor force, especially in rural
areas.
vii. External Debt: Total external debt stock is measured as a percentage change in the
total external debt stock of the country. External debt refers to the debt owed by a country
to non-residents repayable in currency, goods, or services. Total external debt is the sum
total of all public, publicly guaranteed, and private non-guaranteed long-term debt, use of
IMF credit, and short-term debt (WDI, 2019). Funds derived from external debt when
channeled to investment expenditures have a tendency for creating employment. Studies
by Egbulonu and Amadi, (2016) and Adeboje and Folawewo (2017) support the positive
effect of external debt on employment.

48
viii. Private Investment: Private investment is measured as a percentage of GDP. It covers
gross outlays by the private sector (including private non-profit agencies) on additions to
its fixed domestic assets (WDI, 2019). The private sector involving businesses and projects
contributes to employment in an economy.
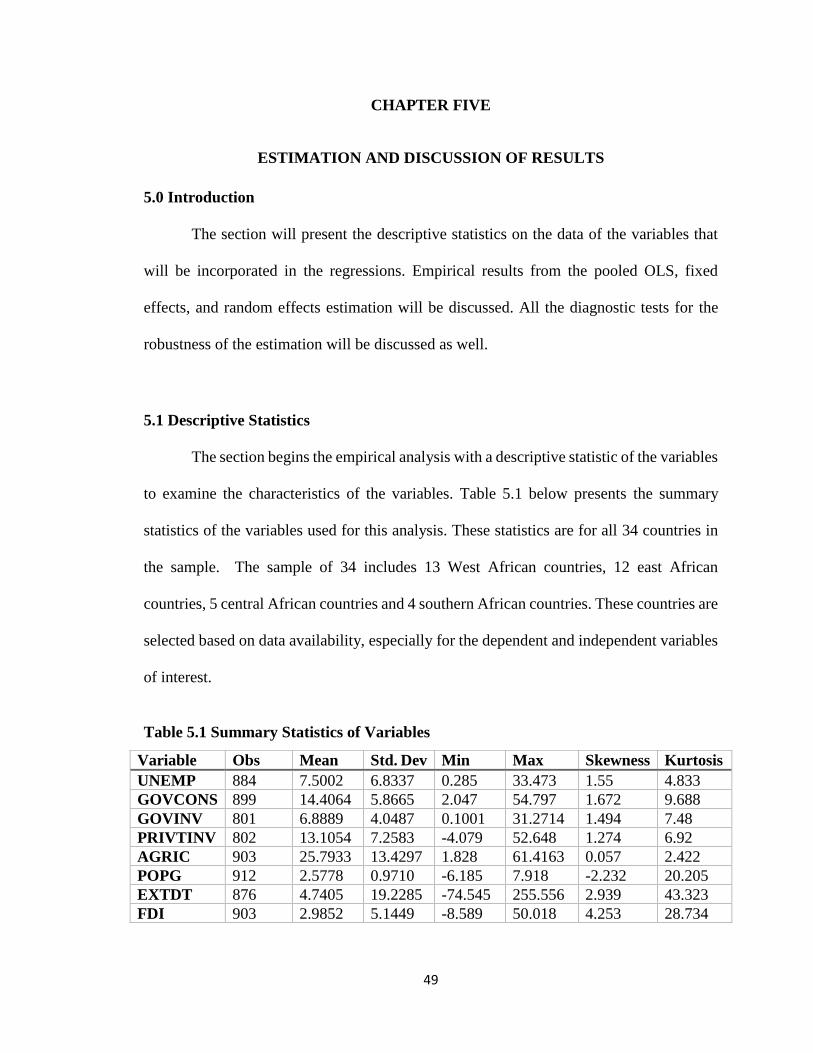
49
CHAPTER FIVE
ESTIMATION AND DISCUSSION OF RESULTS
5.0 Introduction
The section will present the descriptive statistics on the data of the variables that
will be incorporated in the regressions. Empirical results from the pooled OLS, fixed
effects, and random effects estimation will be discussed. All the diagnostic tests for the
robustness of the estimation will be discussed as well.
5.1 Descriptive Statistics
The section begins the empirical analysis with a descriptive statistic of the variables
to examine the characteristics of the variables. Table 5.1 below presents the summary
statistics of the variables used for this analysis. These statistics are for all 34 countries in
the sample. The sample of 34 includes 13 West African countries, 12 east African
countries, 5 central African countries and 4 southern African countries. These countries are
selected based on data availability, especially for the dependent and independent variables
of interest.
Table 5.1 Summary Statistics of Variables
Variable Obs Mean Std. Dev Min Max Skewness Kurtosis
UNEMP 884 7.5002 6.8337 0.285 33.473 1.55 4.833
GOVCONS 899 14.4064 5.8665 2.047 54.797 1.672 9.688
GOVINV 801 6.8889 4.0487 0.1001 31.2714 1.494 7.48
PRIVTINV 802 13.1054 7.2583 -4.079 52.648 1.274 6.92
AGRIC 903 25.7933 13.4297 1.828 61.4163 0.057 2.422
POPG 912 2.5778 0.9710 -6.185 7.918 -2.232 20.205
EXTDT 876 4.7405 19.2285 -74.545 255.556 2.939 43.323
FDI 903 2.9852 5.1449 -8.589 50.018 4.253 28.734

50
Unemployment as a percentage of total labor force averaged 7.50% over the period
with a standard deviation of 6.83. The highest value of 33.47% was recorded by South
Africa in 2001, while the least value of 0.29% was recorded by Niger in 2016. Government
consumption expenditure as a percentage of GDP also averaged 14.41% with a standard
deviation of 5.87. Zimbabwe recorded the lowest value of 2.047% in 2007 while the highest
value of 54.797% was recorded by Eritrea in 1999. Government investment expenditure
as a percentage of GDP averaged 6.89% with a standard deviation of 4.05. The highest
value of 31.27% was recorded by Eritrea in 1999 while the lowest value of 0.1% was
recorded by D.R. Congo in 1998.
Private investment expenditure as a percentage of GDP also averaged 13.11% with
a standard deviation of 7.26. The highest value of 52.65% was recorded by Mauritania in
2004. Agricultural value-added as a percentage of GDP also averaged 25.79% with a
standard deviation of 13.43. The lowest value of 1.83% was recorded by Botswana in 2004
while the highest value of 61.42% was recorded by Guinea Bissau in 1998.
Population growth averaged 2.58% with a standard deviation of 0.97. The lowest
value of -6.19% and the highest value of 7.92% were both recorded by Rwanda in 1993
and 1998 respectively. Percentage change in external debt stocks averaged 4.74% and has
a standard deviation of 19.23. The highest change of 255.56% was recorded by Botswana
in 2008. The highest reduction of 74.55% was recorded by Guinea Bissau in 2010. Foreign
direct investment (Net inflows) as a percentage of GDP averaged 2.99% with a standard
deviation of 5.14. The highest value of 50.02% was recorded in 2014 by the Congo
Republic and the highest reduction (8.59%) was recorded by Gabon in 1996.

51
The skewness and kurtosis values are used to assess the normality of the distribution
of the variables. All variables show a positive skewness aside population growth which
shows a negative skewness value. Standard kurtosis suggests that a value above 3 shows
evidence of non-normality. However, Kim (2013) suggests that this criterion may be
unreliable when the sample size exceeds 300. He suggests that an absolute kurtosis value
greater than 7 is evidence of non-normality. Based on this criterion, all variables are but
unemployment, private investment, and Agric value-added are normally distributed.
The kurtosis statistics again reveal that agriculture valued added (AGRIC) has a
platykurtic distribution meaning that the distribution is flat-topped curve relative normal
distribution whereas the other variables have leptokurtic distribution implying that their
distributions are high peaked relative to the normal distribution.
5.2 Test of Stationarity
Before any analysis can be conducted, it is relevant to determine the stationarity of
the variables that are employed in the model. This is to prevent the possibility of
spuriousness. The Fisher type Panel unit root test is used for this study. The test was
developed by Choi (2001). This test provides advantages over other tests because it
assumes that the number of panels is either infinite or finite. Each group or panel is also
assumed to have different types of non-stochastic and stochastic components. Also, the
possibility that some groups may have unit root while others do not is accurately managed
by the test. The augmented Dickey-Fuller option is chosen for this study. The stationarity
test results are presented below in Table 5.2.

52
Table 5.2 Stationarity Test of Variables
The results show that all variables are stationary at levels. This suggests that regression on
these variables will not produce spurious results.
5.3 Presentation and Discussion of Regression Results
The study adopts the Pooled OLS, Fixed and Random effects estimation
techniques to analyze the relationship between government expenditure and
unemployment in Sub-Saharan Africa for the period 1990 to 2017. The pooled OLS
produces efficient and consistent parameter estimates if the individual effect in a cross-
sectional or time-specific effect does not exist (Park,2011). Both Fixed and Random effect
estimation techniques are adopted to account for the fact that the panels or countries may
be heterogeneous. The Fixed effects model assumes that the heterogeneity is not random,
and hence transforms the model to eliminate the heterogeneity. The Random effects,
however, assumes the heterogeneities are random and hence captures it with a random
error. The Hausman test is conducted to determine which of the models is appropriate.
The results for the Pooled OLS model are presented in Table 5.3 below with the standard
errors in parenthesis.
Variable Test Statistic P-value Order
UNEMP 2.04** 0.02 I (0)
GOVCONS 2.503*** 0.0062 I (0)
GOVINV 4.472*** 0.000 I (0)
PRIVTINV 6.976*** 0.000 I (0)
AGRIC 2.055** 0.0199 I (0)
POPG 46.862*** 0.000 I (0)
EXTDT 19.357*** 0.000 I (0)
FDI 6.722*** 0.000 I (0)

53
Table 5.3 Pooled OLS Regression
Pooled OLS Pooled OLS (Robust
Results)
VARIABLES UNEMP UNEMP (Model I)
GOVCONS 0.1206*** 0.1206***
(0.0389) (0.0351)
GOVINV -0.1081** -0.1081**
(0.0554) (0.0545)
PRIVTINV 0.0152 0.0152
(0.0318) (0.0260)
AGRIC -0.2780*** -0.2780***
(0.0170) (0.0175)
POPG -0.7560*** -0.7560***
(0.2111) (0.2762)
EXTDT -0.0106 -0.0106
(0.0415) (0.0098)
FDI -0.0367 -0.0367
(0.0415) (0.0309)
Constant 15.6606*** 15.6606***
(1.0230) (1.0932)
Observations 761 761
R-squared 0.39 0.39
Number of countries 34 34
Standard errors in parentheses, *** p<0.01, ** p<0.05, * p<0.1
5.4 Fixed Effect and Random Effect Estimation
The results for the Fixed and Random Effect models are presented in Table 5.4
below with the standard errors in parenthesis.

54
Table 5.4 Fixed and Random Effect Regression
Fixed Effect Random Effect Elasticities at the
Means (Fixed
Effects)
VARIABLES UNEMP (Model II) UNEMP (Model III) UNEMP
GOVCONS 0.0699*** 0.0718*** 0.1343***
(0.0175) (0.0176)
GOVINV -0.0833*** -0.0840*** -0.0764***
(0.0194) (0.0196)
PRIVTINV 0.00507 0.00445 0.00885
(0.0112) (0.0113)
AGRIC 0.0204* 0.0122 0.0703*
(0.0112) (0.0113)
POPG 0.0568 0.0473 0.0195
(0.0709) (0.0718)
EXTDT -0.00188 -0.00184 -0.0202
(0.00287) (0.00291)
FDI -0.0319** -0.0335** -0.01271**
(0.0131) (0.0133)
Constant 6.619*** 6.721***
(0.475) (1.034)
Observations 761 761
R-squared 0.065 0.064
Number of
countries
34 34
Standard errors in parentheses, *** p<0.01, ** p<0.05, * p<0.1
5.5 Hausman Test
The next step is to conduct the Hausman test to determine if the Fixed effects model
is appropriate. As stated earlier, while the fixed effect eliminates the heterogeneity from
the model, the random effect model captures the individual country specific heterogeneity
into the error term. If these country specific characteristics are correlated with any of the
explanatory variables, the estimates of the random effects model become biased and
inconsistent. The null hypothesis of the Hausman test is that the Fixed and Random effects
models produce similar results. When this hypothesis is rejected, the conclusion is that the
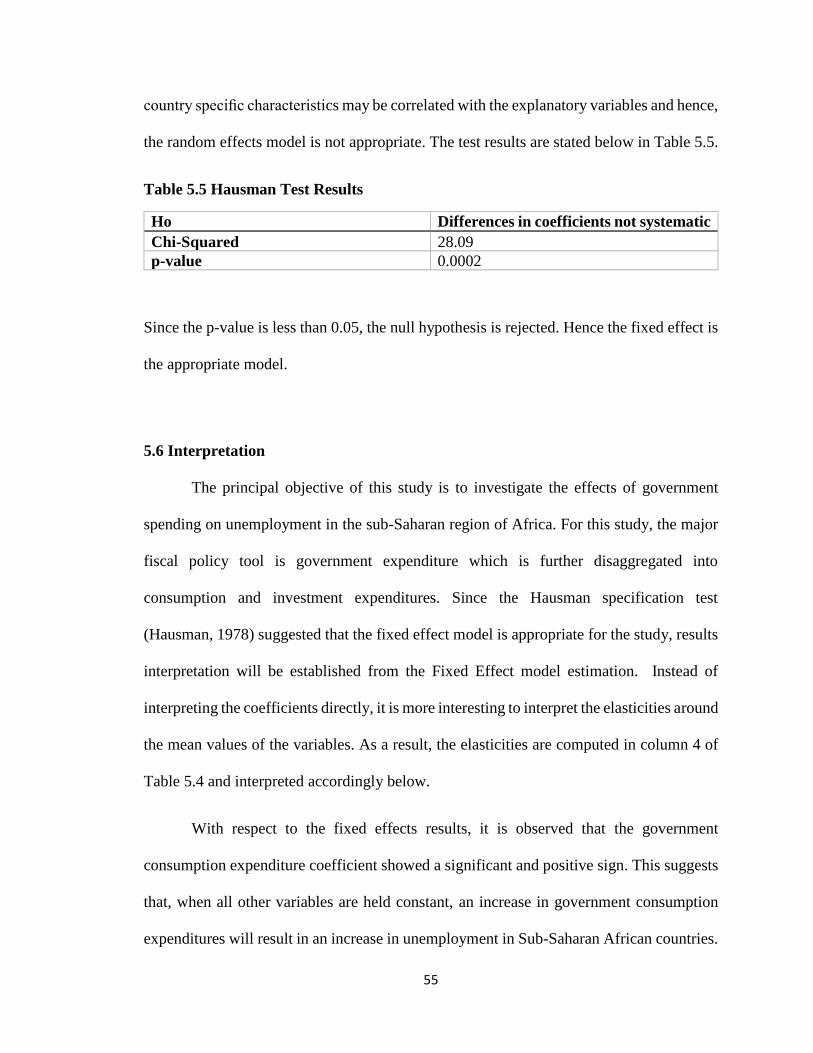
55
country specific characteristics may be correlated with the explanatory variables and hence,
the random effects model is not appropriate. The test results are stated below in Table 5.5.
Table 5.5 Hausman Test Results
Ho Differences in coefficients not systematic
Chi-Squared 28.09
p-value 0.0002
Since the p-value is less than 0.05, the null hypothesis is rejected. Hence the fixed effect is
the appropriate model.
5.6 Interpretation
The principal objective of this study is to investigate the effects of government
spending on unemployment in the sub-Saharan region of Africa. For this study, the major
fiscal policy tool is government expenditure which is further disaggregated into
consumption and investment expenditures. Since the Hausman specification test
(Hausman, 1978) suggested that the fixed effect model is appropriate for the study, results
interpretation will be established from the Fixed Effect model estimation. Instead of
interpreting the coefficients directly, it is more interesting to interpret the elasticities around
the mean values of the variables. As a result, the elasticities are computed in column 4 of
Table 5.4 and interpreted accordingly below.
With respect to the fixed effects results, it is observed that the government
consumption expenditure coefficient showed a significant and positive sign. This suggests
that, when all other variables are held constant, an increase in government consumption
expenditures will result in an increase in unemployment in Sub-Saharan African countries.

56
Around the mean values, a 1% increase in government consumption expenditure as a
percentage of GDP increases unemployment by 0.1343%, other variables held constant.
This is significant at 1% level of significance. Comparing the three models, government
consumption expenditure showed a highly significant and positive sign. With regards to
the emphasis of this study, the observed positive relationship between government
consumption expenditure and unemployment is in line with the study conducted by
Murwirapachena et al (2013) but contrary to that of Holden and Sparrman (2016) and
Matsumae and Hasumi (2016) who discovered a negative relationship of government
consumption expenditure on unemployment.
The relationship between government consumption and unemployment goes
against the null hypothesis of a negative relationship assumed earlier. However, it is
plausible in the sense that consumption expenditure mainly comprises the purchases of
goods and services as well as employee compensation, these spending may not have an
immediate effect on employment. The growing rate of government consumption
expenditure can, therefore, be identified as the reason for the failure of public spending to
significantly affect unemployment in sub-Saharan Africa. Most governments have high
consumption expenditure relative to investment expenditure. Since consumption spending
does not generate immediate employment, the unemployment situation continues to persist
despite the increased spending.
Government investment expenditure, however, complies with our a priori
expectation by bearing a negative sign. This indicates an inverse relationship between
government investment and unemployment and so as government investment rises,
unemployment is reduced. Thus, around the mean values, a 1% increase in investment

57
spending reduces unemployment by 0.0764%, ceteris paribus. This is significant at a 1%
significance level. Consistently, the sign of the coefficient was statistically significant and
negative across the three models. The estimated result is consistent with the studies
conducted by Holden and Sparrman (2016) and Murwirapachena et al (2013). Investment
spending is more employment enhancing relative to consumption spending. These two
findings, therefore, suggest that governments should target investment spending if it hopes
to reduce unemployment significantly.
The estimated impact of Private investment spending as a percentage of GDP on
unemployment is found to be positive, although the relationship is statistically insignificant
in all three models. In line with the a priori expectation, agriculture value-added as a
percentage of GDP is also found to reduce unemployment in the Pooled OLS model but
not in the fixed effect and random effect model. The agriculture variable was not significant
in the random effect model. The coefficient of agriculture variable in the fixed effects
model is significant at 10% thus, other variables held constant, a 1% increase agricultural
value-added as a percentage of GDP results in a 0.0703% increase in unemployment
around the mean values. This outcome, though unexpected is reasonable. It reflects the fact
that agriculture is fast losing its role as a leading source of employment in Africa. There
are several problems that beset the agricultural sector in Africa which has greatly hindered
its development. Subsistence agriculture is still very much a practice in several parts of
Africa. Mechanization is still very low in this sector. These several bottlenecks could
explain this positive relationship found in the fixed effects results.
Further, population growth is found to increase unemployment as expected and it
follows the findings of Meier (1995), Herrin and Pernia (2014) and Folawewo and Adeboje

58
(2017). However, the coefficient is not statistically significant. External debt stock is found
to decrease unemployment as expected but the coefficient is also not statistically
significant.
Lastly, the results show that there exists an inverse relationship between foreign direct
investment and unemployment which implies that a rise in FDI as a percentage of GDP has
an employment development impact in SSA countries. This complies with our a priori
expectation and it was consistent in all three models. Based on the elasticities computed at
the means, a 1% increase in foreign direct investment reduces unemployment by 0.013%,
ceteris paribus. The coefficient is statistically significant at 1% level of significance. This
result is in consonance with studies undertaken by Jude and Silaghi (2015), Ogbeide et al.
(2016) and Folawewo and Adeboje (2017). Inflows of investment into countries have the
tendency of creating job opportunities to reduce unemployment in a country but it should
be noted that such benefits are derived depending on the type of FDI inflow, the kind of
production technology in the sector and the overall characteristic feature of such sector
(Folawewo and Adeboje, 2017).
Notwithstanding the relevance of this outcome highlights on FDI promoting employment;
it should be alerted of which type of FDI plays a key role in employment generation.
Greenfield investments are noted to have significant and positive effects on the
employment rate than the Brownfield ones, which have no or even negative effects on
employment (Strat et al., 2015). Jeppesen and Mainguy (2007) argued in their research that
most of the FDI inflows into many African countries have centralized on natural resources,
a typical example of Brownfield investments with very low elasticity of labor employment.

59
It is thus imperative for diversification of the economies of SSA region into the
Greenfield investments, more importantly in the market seeking ones, to attract foreign
investors into the sectors. It is very essential for governments of the region to enact policies
that will attract FDI which is more labor engrossing. This can be possible if the
governments elevate local investments (private and public) and channel them towards the
productive sectors of their economies that have higher labor absorptive capacity
(Anyanwu, 2013).

60
CHAPTER SIX
CONCLUSION AND POLICY RECOMMENDATION
6.0 Introduction
This chapter is divided into two sections. The first section presents the summary
and conclusion of the findings of the research. The second part expounds policy
recommendations based on the empirical results.
6.1 Summary and Conclusion of Findings
Unemployment is one of the social cankers that hampers the economic development
of most countries in the world and government policy intervention that can help control
unemployment situations is regarded as very essential. Thus, this study investigated
government expenditure in its disaggregated forms (government consumption expenditure
and investment expenditure) and how these expenditures affect unemployment in 34 Sub-
Saharan African countries for the period of 1990 to 2017.
Employing the panel data analysis technique with fixed effect and random effect
estimations, the study revealed some interesting results that uncover the relationship
between government expenditure and unemployment. Based on the fixed effect model
estimation outcome, it was found that government consumption expenditure positively
affects unemployment in SSA countries that is as government consumption expenditure
increases, unemployment also increases, all things being equal. Stated differently,
government consumption expenditure does not increase employment in the region. And
61
this is attributed to the fact that such government expenditure comprises purchases of goods
and services as well as employee compensations. This kind of government spending may
not have an immediate effect on employment. On the other hand, government investment
expenditure showed an inverse relationship with unemployment. The inverse relationship
(an increase in investment expenditure reduces unemployment) of government investment
expenditure on unemployment is relatively ascribed to the immediate effect such
expenditures have on the labor market. For instance, when the government embarks on
investments like the construction of roads, schools, hospitals, and other infrastructure,
employment extends right from the laborers to the people who would be working directly
in the completed infrastructure. This makes government investment expenditures an
obvious channel via which jobs can be generated.
Furthermore, the empirical results indicated a positive relationship between private
investment and unemployment, but the effect was not statistically significant. In the same
line, there was not enough statistical evidence to support the effect of population growth
and external debt on unemployment in the selected SSA countries although population
growth confirmed a positive effect and external debt a negative impact as expected earlier
in the study.
The agricultural sector estimate did not support the a priori expectation of the study
by showing a positive effect on unemployment (increases in agriculture value-added
increases unemployment). Agriculture is one of the largest sectors in the economies of most
sub-Saharan African countries but the relevant fact is that it is still an unattractive venture
due to its nature in SSA countries (low mechanization, fewer rewards, poor market for
produce). Although value-added in the sector may be rising, that does not necessarily imply

62
the sector is employing more labor. Thus the results presented by the analysis reflect the
existing problem of the agriculture sector of most SSA countries.
Foreign direct investment (FDI) also followed the prior anticipation of the study;
it showed an inverse relationship with unemployment. Thus, the inflow of foreign
investment into the region increases employment. Although FDI is proven to be relevant
in employment generation in SSA countries, it does depend on the type of investment
inflows. The known types, Greenfield and Brownfield investments have their effects
differently on job creation. According to Strat et al., (2015), Brownfield investments have
no or even negative effects on employment.
6.3 Policy Recommendations
Despite the evidence of moderate improvements in the economic growth of certain
parts of the sub-Saharan region, unemployment is persistent and increasing in the region.
Therefore, this study’s core objective was to examine how government expenditure affects
unemployment in the selected countries in sub-Saharan Africa. Grounded on the results of
the study, some policy recommendations are put forward which when taken into
consideration can aid in controlling this social menace, unemployment, which is stagnating
economic development in the region.
In view of the policy relevance of the study, it is recommended that governments
in the region accentuate more on capital investments and give preference to investments
that will spark employment generation by shifting more resources to investment
expenditures than consumption expenditure. Focusing on infrastructural investments such
as the construction of roads, railways, schools, and hospitals can help improve the lives of
people as well as create jobs. Such projects should be done without neglecting the rural

63
areas which most often lack such improvements, and this can go a long way to develop
such areas in the economy.
Again, agricultural development should be a target of economies in the region. The
government can initiate programs that will make agriculture enticing to people, especially
the youth since youth unemployment is rampant in the region. Subsidies, good
infrastructure, lower-priced agricultural materials, and available and ready markets for
agriculture produce are initiatives that can be taken to improve the agriculture sector as
well as entice the youth to engage in agricultural projects. This has a huge tendency to
reducing the unemployment challenge in SSA countries since agriculture is a huge
advantage in sub-Saharan Africa.
Moreover, the study suggests that a consistent enabling environment should be
created in the countries in the region to attract investors both foreign and domestic. Basic
amenities such as portable water and stable power is very crucial alongside internal
security. Reduction in corporate taxes, as well as tax holidays, are strategies, the
government can adopt to attract investors. Private or self-employment can also be
harnessed and elevated through training programs and also financial institutions can play
key roles by providing loans at reduced interest rates payable over a long-time duration to
individuals who have feasible and sustainable projects. Foreign investments especially the
Greenfield investments which are more market seeking and labor absorbing should be
encouraged.
Further, due to its possible beneficial impact on employment creation, external debt
funds should be managed appropriately and channeled to productive ventures. There was
no statistical support of the relevance of external debt in the study and this could be adduced

64
to mismanagement of funds from external debt in the SSA region. Thus, to control and
reduce unemployment, governments in the region should place the maximum effort in
ensuring that such funds are put their right use. Although corruption was not discussed in
the study, it is germane on the side of those in authority to put in place measures that will
eradicate corruption since it is one crucial problem in Africa hampering the continent’s
development.
Finally, it is imperative for governments to enact policies that have the potential of
diversifying the economy, most importantly the diversion from over-dependence on natural
resources into other subsectors of the economies in the SSA region. This will go a long
way in enormous job creation.

65
REFERENCES
Abubakar, A. B. (2016). Dynamic effects of fiscal policy on output and unemployment in
Nigeria: an econometric investigation. CBN Journal of Applied Statistics, 7(2),
101-122.
Adamu, P., Kaliappan, S. R., Bani, Y., & Nor, M. N. (2017). Impact of Globalization on
Unemployment in Sub-Saharan African (SSA) Countries. Governance and
Sustainability of Global Business Economics, 302-310.
Adefeso, H. A. (2016). Productive Government Expenditure and Economic Performance
in sub-Saharan Africa: An Empirical Investigation. Zagreb International Review
of Economics and Business, 19(2), 1-18.
Ahmed, E. M., & Hanif, C. M. (2018). Sub-Saharan African Countries Public
Expenditure and Economic Growth: Wagner’s Panel Cointegration and Causality
Applications.
Anayochukwu, O. B. (2012). Fiscal deficits and inflation in Nigeria: The causality
approach. International Journal of Scientific & Technology Research, 1(8), 6-12
Andrews, M. (2010). How far have public financial management reforms come in
Africa?.
Anyanwu, J. C. (2013), ‘Characteristics and Macroeconomic Determinants of Youth
Employment in Africa’, African Development Review, Vol. 25, No. 2, pp. 107–
29

66
Arnold, J. M., & Javorcik, B. S. (2009). Gifted kids or pushy parents? Foreign direct
investment and plant productivity in Indonesia. Journal of International
Economics, 79(1), 42-53
Auerbach, A. J. (1995). Tax Projections and the Budget: Lessons from the 1980s (No.
w5009). National Bureau of Economic Research.
Baker, F. (2007). The South African labor market: Theory and practice.
Bassanini, A., & Duval, R. (2009). Unemployment, institutions, and reform
complementarities: re-assessing the aggregate evidence for OECD countries.
Oxford Review of Economic Policy, 25(1), 40–59.
https://doi.org/10.1093/oxrep/grp004
Baxter, M., & King, J. (1993). ‘Fiscal Policy in General Equilibrium’, American
Economic Review, 83, pp. 315 – 34.
Blanchard, O., & Quah, D. (1989). The dynamic effects of aggregate supply and demand
shocks. American Economic Review, 79(4).
Blanchard, O., & Perotti R., (2002). “An Empirical Characterization of the Dynamic
Effects of Changes in Government Spending and Taxes on Output”, Quarterly
Journal of Economics 177: 1329-1368
Bova, E., Kolerus, C., & Tapsoba, S. J. (2015). A fiscal job? An analysis of fiscal policy
and the labor market. IZA Journal of Labor Policy, 4(1), 13.
Bruckner, M., & Pappa, E. (2012), Fiscal Expansions, Unemployment, and Labor Force
Participation, International Economic Review 54, 1205–1228.

67
Central Bank of Nigeria (CBN) Annual Reports for Various Years, Nigeria.
http://www.cenbank.org/Documents/annualreports.asp
Coniglio, N. D., Prota, F., & Seric, A. (2015). Foreign Direct Investment, Employment,
and Wages in Sub‐Saharan Africa. Journal of International Development, 27(7),
1243-1266.
Conyon M.J, Girma S, Thompson S, & Wright P. (2002). The Productivity and Wage
Effects of Foreign Acquisition in the United Kingdom. Journal of Industrial
Economics 50(1): 85-102
Egbulonu, K. G., & Amadi, K. W. (2016). Effect of fiscal policy on unemployment in the
Nigerian economy. International Journal of Innovative Finance and Economics
Research, 4(3), 1-7.
Fatás, A., & Mihov, I. (2001). The effects of fiscal policy on consumption and
employment: theory and evidence. CEPR Discussion 2760.
Folawewo, A. O., & Adeboje, O. M. (2017). Macroeconomic determinants of
unemployment: empirical evidence from the economic community of West
African states. African Development Review, 29(2), 197-210.
Galí, J., Smets, F., & Wouters, R. (2012). Unemployment in an Estimated New
Keynesian model. NBER macroeconomics annual, 26(1), 329-360.
Girma S., & Görg H. (2007). Multinationals’ Productivity Advantage: Scale or
Technology? Economic Inquiry 45(2): 350-362.

68
Hausman, J. A. (1978), ‘Specification Tests in Econometrics’, Econometrica, Vol. 46,
No. 6, pp. 1251–71
Herrin, A., & E. Pernia (2014), ‘Population, Human Resource and Employment’, in A.
Balisacan and H. Hill (eds.), The Philippine Economy: Development Policies and
Challenges, Ateneo University Press, Quezon City
Herrin, A., & E. Pernia (2014), ‘Population, Human Resource and Employment’, in A.
Balisacan and H. Hill (eds.), The Philippine Economy: Development Policies and
Challenges, Ateneo University Press, Quezon City
Holden, S., & Sparrman, V. (2016). Do Government Purchases Affect Unemployment?
The Scandinavian Journal of Economics, 36. https://doi.org/10.1111/sjoe.12214
Huidrom, R., Kose, M. A., & Ohnsorge, F. L. (2016). Challenges of fiscal policy in
emerging and developing economies. The World Bank.
Huidrom, R., Kose, M. A., & Ohnsorge, F. L. (2018). Challenges of Fiscal Policy in
Emerging and Developing Economies. Emerging Markets Finance and Trade,
54(9), 1927–1945. https://doi.org/10.1080/1540496X.2017.1328354
International Labor Organization Newsroom. (2016). Global unemployment projected to
rise in both 2016 and 2017. Retrieved from http://www.ilo.org/global/about-the-
ilo/newsroom/news/WCMS_443500/lang--en/index.htm
International Labour Organisation. (2018). World Employment and Social Outlook:
Trends 2018. Ilo.
Investopedia. (2017). Unemployment. Retrieved December 9, 2017, from

69
https://www.investopedia.com/terms/u/unemployment.asp
Jeppesen, S., & Mainguy C. (2007), ‘Foreign Direct Investment in Africa: Searching for
Impact in Mali and South Africa’, CBDS Working Paper no. 6, Centre for
Business and Development Studies, Denmark
Jude, C., & Silaghi M. (2015), ‘Employment effects of Foreign Direct Investment: New
Evidence from Central and Eastern European Countries’, International
Economics, Vol. 145, pp. 32–49
Magazzino, C. (2016). Fiscal variables and growth convergence in the ECOWAS.
African Journal of Economic and Management Studies, 7(2), 147-163.
Mahdavi, S., & Alanis, E. (2013). Public expenditures and the unemployment rate in the
American states: panel evidence. Applied Economics, 45(20), 2926-2937.
Matsumae, T., & Hasumi, R. (2016). Impacts of Government Spending on
Unemployment: Evidence from a Medium-scale DSGE Model (No. 329). ESRI
Discussion Paper Series.
Meier, G. M. (1995), Leading Issues in Economic Development, Oxford University
Press, New York
Monacelli, T., Perotti, R., & Trigari, A. (2010). Unemployment fiscal multipliers.
Journal of Monetary Economics, 57(5), 531-553.
Mouhammed, A. H. (2012). Important theories of unemployment and public policies. The
Journal of Applied Business and Economics, 13(2), 156.

70
Mountford, A., & Uhlig, H. (2009). What are the effects of fiscal policy shocks? Journal
of applied econometrics, 24(6), 960-992.
Mulas-Granados, C. A. R. L. O. S. (2004). Economics or Politics? A theoretical review of
the determinants of fiscal policy. Hacienda Publica Espanola, Monografia.
Murwirapachena, G., Choga, I., Maredza, A., & Mavetera, N. (2013). Fiscal Policy and
Unemployment in South Africa: 1980 – 2010. Mediterranean Journal of Social
Sciences, 10. https://doi.org/10.5901/mjss.2013.v4n6p579
N’guessan, C.F. (2017). Threshold Effect of Government Consumption on Employment:
Evidence from African Countries.
Nwosa, P. I. (2014). Government Expenditure, Unemployment And Poverty Rates In
Nigeria. JORIND, 12(1), 1596–8308. Retrieved from
www.transcampus.org/journals; OECD (2002), OECD Best Practices for Budget
Transparency. OECD Journal on Budgeting, 1(3), pp. 7-14
OECD (2013), "Government investment spending", in Government at a Glance 2013,
OECD Publishing, Paris, https://doi.org/10.1787/gov_glance-2013-23-en.
Ogbeide, F. I., Kanwanye H., & S. Kadiri (2016), ‘Revisiting the Determinants of
Unemployment in Nigeria: Do Resource Dependence and Financial Development
Matter?’, African Development Review, Vol. 28, No. 4, pp. 430–43.
Ogundipe, A. A. (2013) Does Government Expenditure Spur Growth In ECOWAS? Does
Government Expenditure Spur Growth In ECOWAS?
Orji, A., Orji, O., Nchege, J., & Okafor, J. (2015). Manufacturing Output and Foreign

71
Direct Investment in Nigeria : A New Evidence. International Journal of Academic
Research in Economics and Management Sciences, 4(3), 16–28.
https://doi.org/10.6007/IJAREMS/v4-i3/2016
Pappa, E. (2009). The effects of fiscal shocks on employment and the real wage.
International Economic Review, 50(1), 217-244.
Pappa, E. (2011). Fiscal expansions, unemployment and labor force participation: theory
and evidence.
Park, H. M. (2011). Practical guides to panel data modeling: a step-by-step analysis using
Stata. Public Management and Policy Analysis Program, Graduate School of
International Relations, International University of Japan, 1-52.
Peterson, S. B. (2010). Reforming Public Financial Management in Africa.
Rehman, J., Iqbal, A., & Siddiqi, M. W. (2010). Cointegration-causality analysis between
public expenditures and economic growth in Pakistan. European Journal of
Social Sciences, 13(4), 556-565.
Strat, V. A., Davidescu A., & M. A. Paul (2015), ‘FDI and Unemployment-A Causality
Analysis for the Latest EU Members’ Procedia Economics and Finance, Vol. 23,
pp. 635–43.
Tagkalakis, A. O. (2013). The unemployment effects of fiscal policy: recent evidence
from Greece. IZA Journal of European Labor Studies, 2(1), 11.
https://doi.org/10.1186/2193-9012-2-11

72
Tulsidharan, S. (2006). Government expenditure and economic growth in India.
Government Expenditure and Economic Growth in India (1960 to 2000), 20(1),
169-179.
Ugwuanyi, U. B., & Ugwunta, O. D. (2017). fiscal policy and economic growth: An
Examination of selected countries in Sub-Saharan Africa. International Journal of
Academic Research in Accounting, Finance and Management Sciences, 7(1), 117-
130.
Unal, U. (2015). The Unemployment Effects of Fiscal Policy in the Netherlands.
United Nations, Department of Economic and Social Affairs, Population Division (2019).
World Population Prospects 2019: Highlights (ST/ESA/SER.A/423).
Wang, S., & Abrams, B. A. (2011). The effect of government size on the steady-state
unemployment rate: A dynamic perspective (No. 11-12).
Wiktionary. (2016). classical unemployment - Wiktionary. Retrieved December 10, 2017,
from https://en.wiktionary.org/wiki/classical_unemployment
World Bank (2015), World Development Indicators, World Bank. Washington, DC,
available at http://data.worldbank.org/data-catalog/world-development-indicators
World Bank (2019), World Development Indicators, World Bank. Washington, DC,
available at http://data.worldbank.org/data-catalog/world-development-indicators
Yasin, M. (2011). Public spending and economic growth: an empirical investigation of
Sub-Saharan Africa. Southwestern Economic Review, 30, 59-68.

73
Zhang, T., & Zou, H. F. (1998). Fiscal decentralization, public spending, and economic
growth in China. Journal of public economics, 67(2), 221-240.

74
APPENDIX
Appendix 1A
34
56
78
un
em
p
1990 2000 2010 2020year
Cameroon
.51
1.5
22.5
un
em
p1990 2000 2010 2020
year
Chad
2.5
33.5
44.5
un
em
p
1990 2000 2010 2020year
Congo DPR
10
12
14
16
18
20
un
em
p
1990 2000 2010 2020year
Congo Republic
17
18
19
20
21
un
em
p
1990 2000 2010 2020year
Gabon
Author's construction using unemployment data (ILO estimate); WDI 2018
Central Africa
Unemployment (% of total Labor force)9
9.5
10
un
em
p
1990 2000 2010 2020year
Kenya
22.5
33.5
un
em
p
1990 2000 2010 2020year
Tanzania
12
34
un
em
p
1990 2000 2010 2020year
Uganda
.2.4
.6.8
11.2
un
em
p
1990 2000 2010 2020year
Rwanda
66.2
6.4
6.6
6.8
7
un
em
p
1990 2000 2010 2020year
Eritrea
22.5
33.5
4
un
em
p
1990 2000 2010 2020year
Mozambique
45
67
un
em
p
1990 2000 2010 2020year
Zimbabwe
3.5
44.5
5
un
em
p
1990 2000 2010 2020year
Comoros
1.4
1.6
1.8
22.2
un
em
p
1990 2000 2010 2020year
Burundi
78
910
un
em
p
1990 2000 2010 2020year
Mauritius
56
78
9
un
em
p
1990 2000 2010 2020year
Malawi
13
14
15
16
17
un
em
p
1990 2000 2010 2020year
Sudan
Author's construction using unemployment (ILO estimate): WDI 2018
East Africa
Unemployment (% of total Labor force)

75
.511
.522
.53
un
em
p
1990 2000 2010 2020year
Benin
23
45
67
un
em
p
1990 2000 2010 2020year
Burkina Faso
23
45
67
un
em
p
1990 2000 2010 2020year
Cote D'lvoire
99.51010
.5 11
un
em
p
1990 2000 2010 2020year
Gambia
46
810
un
em
p
1990 2000 2010 2020year
Ghana
3.63
.844
.24.44
.6
un
em
p1990 2000 2010 2020
year
Guinea
3.8
44.24
.44.64
.8
un
em
p
1990 2000 2010 2020year
Guinea Bissau
24
68101
2
un
em
p
1990 2000 2010 2020year
Mali
9101
1121
3
un
em
p
1990 2000 2010 2020year
Mauritania
01
23
un
em
p
1990 2000 2010 2020year
Niger
46
8101
2
un
em
p
1990 2000 2010 2020year
Senegal
33.5
44.5
5
un
em
p
1990 2000 2010 2020year
Sierra Leone
1.6
1.8
22.2
un
em
p
1990 2000 2010 2020year
Togo
Author's construction using Unemployment data (ILOestimate): WDI 2018
West Africa
Unemployment (% of total Labor force)
14
16
18
20
22
24
un
em
p
1990 2000 2010 2020year
Botswana
20
22
24
26
28
un
em
p
1990 2000 2010 2020year
Eswatini
20
25
30
35
un
em
p
1990 2000 2010 2020year
South Africa
02
46
un
em
p
1990 2000 2010 2020year
Madagascar
Author's construction with unemployment data (ILO estimate): WDI2018
Southern Africa
Unemployment (% of total Labor force)

76
Appendix 1B
10
11
12
13
14
go
vcon
gd
p
1990 2000 2010 2020year
Cameroon
46
810
go
vcon
gd
p
1990 2000 2010 2020year
Chad
05
10
15
go
vcon
gd
p
1990 2000 2010 2020year
Congo DPR
10
15
20
25
30
go
vcon
gd
p
1990 2000 2010 2020year
Congo Republic10
12
14
16
go
vcon
gd
p
1990 2000 2010 2020year
Gabon
Author's construction using data from WDI 2018
Central Africa
Government Consumption Expenditure (%GDP)12
14
16
18
go
vcon
gd
p
1990 2000 2010 2020year
Benin
20
22
24
26
go
vcon
gd
p
1990 2000 2010 2020year
Burkina Faso
101
2141
618
go
vcon
gd
p
1990 2000 2010 2020year
Cote D'lvoire
68
101
214
go
vcon
gd
p
1990 2000 2010 2020year
Gambia
681
0121
416
go
vcon
gd
p
1990 2000 2010 2020year
Ghana
510
15
20
go
vcon
gd
p
1990 2000 2010 2020year
Guinea
510
15
20
go
vcon
gd
p
1990 2000 2010 2020year
Guinea Bissau
101
2141
618
go
vcon
gd
p
1990 2000 2010 2020year
Mali
101
5202
530
go
vcon
gd
p
1990 2000 2010 2020year
Mauritania
101
2141
618
go
vcon
gd
p
1990 2000 2010 2020year
Niger
12
14
16
18
go
vcon
gd
p
1990 2000 2010 2020year
Senegal
68
101
214
go
vcon
gd
p
1990 2000 2010 2020year
Sierra Leone
05
10
go
vin
v
1990 2000 2010 2020year
Togo
Author's construction with data from WDI 2018
West Africa
Government Consumption Expenditure (%GDP)

77
12
14
16
18
20
go
vcon
gd
p
1990 2000 2010 2020year
Kenya
510
15
20
go
vcon
gd
p
1990 2000 2010 2020year
Tanzania
810
12
14
16
go
vcon
gd
p
1990 2000 2010 2020year
Uganda
10
12
14
16
18
20
go
vcon
gd
p
1990 2000 2010 2020year
Rwanda20
30
40
50
60
go
vcon
gd
p
1990 2000 2010 2020year
Eritrea
10
15
20
25
30
go
vcon
gd
p
1990 2000 2010 2020year
Mozambique
05
10
15
20
25
go
vcon
gd
p
1990 2000 2010 2020year
Zimbabwe
9.5
10
10
.511
11
.5
go
vcon
gd
p
1990 2000 2010 2020year
Comoros
10
15
20
25
go
vcon
gd
p
1990 2000 2010 2020year
Burundi
12
13
14
15
16
go
vcon
gd
p
1990 2000 2010 2020year
Mauritius
10
15
20
25
30
go
vcon
gd
p
1990 2000 2010 2020year
Malawi
510
15
go
vcon
gd
p
1990 2000 2010 2020year
Sudan
Author's construction using data from WDI 2018
East Africa
Government Consumption Expenditure (%GDP)
15
20
25
30
go
vcon
gd
p
1990 2000 2010 2020year
Bostwana
14
16
18
20
22
24
go
vcon
gd
p
1990 2000 2010 2020year
Eswatini
18
19
20
21
go
vcon
gd
p
1990 2000 2010 2020year
South Africa
78
910
11
12
go
vcon
gd
p
1990 2000 2010 2020year
Madagascar
Author's construction using data from WDI 2018
Southern Africa
Government Consumption Expenditure (%GDP)

78
12
34
56
go
vin
v
1990 2000 2010 2020year
Cameroon
46
810
12
go
vin
v
1990 2000 2010 2020year
Chad
02
46
go
vin
v
1990 2000 2010 2020year
Congo DPR0
10
20
30
go
vin
v
1990 2000 2010 2020year
Congo Republic
05
10
15
go
vin
v
1990 2000 2010 2020year
Gabon
Author's construction using data from WDI 2018
Central Africa
Government Investment Expenditure (%GDP)
24
68
10
go
vin
v
1990 2000 2010 2020year
Kenya
05
10
15
20
go
vin
v
1990 2000 2010 2020year
Tanzania
24
68
go
vin
v
1990 2000 2010 2020year
Uganda
05
10
15
20
go
vin
v
1990 2000 2010 2020year
Rwanda
510
15
20
25
go
vin
v
1990 2000 2010 2020year
Eritrea
05
10
15
20
go
vin
v
1990 2000 2010 2020year
Mozambique
01
23
45
go
vin
v
1990 2000 2010 2020year
Zimbabwe
67
89
10
go
vin
v
1990 2000 2010 2020year
Comoros
24
68
10
12
go
vin
v
1990 2000 2010 2020year
Burundi
46
810
12
go
vin
v
1990 2000 2010 2020year
Mauritius
510
15
go
vin
v
1990 2000 2010 2020year
Malawi
02
46
8
go
vin
v
1990 2000 2010 2020year
Sudan
Author's computation with data from WDI 2018
East Africa
Government Investment Expenditure (%GDP)

79
510
15
20
go
vin
v
1990 2000 2010 2020year
Bostwana
46
810
go
vin
v
1990 2000 2010 2020year
Eswatini2
34
56
go
vin
v
1990 2000 2010 2020year
South Africa
24
68
10
go
vin
v
1990 2000 2010 2020year
Mdagascar
Author's construction using data from WDI 2018
Southern Africa
Government Investment Expenditure (%GDP)
34
56
78
go
vin
v
1990 2000 2010 2020year
Benin
681
0121
416
go
vin
v
1990 2000 2010 2020year
Burkina Faso
24
68
10
go
vin
v
1990 2000 2010 2020year
Cote D'lvoire
46
8101
2
go
vin
v
1990 2000 2010 2020year
Gambia
810
12
14
go
vin
v
1990 2000 2010 2020year
Ghana
05
10
15
go
vin
v
1990 2000 2010 2020year
Guinea
010
20
30
go
vin
v
1990 2000 2010 2020year
Guinea Bissau
24
68
10
go
vin
v
1990 2000 2010 2020year
Mali
05
10
15
go
vin
v
1990 2000 2010 2020year
Mauritania
46
8101
2
go
vin
v
1990 2000 2010 2020year
Niger
34
56
7
go
vin
v
1990 2000 2010 2020year
Senegal
05
10
15
go
vin
v
1990 2000 2010 2020year
Sierra Leone
05
10
go
vin
v
1990 2000 2010 2020year
Togo
Author's construction with Data computed from WDI 2018
West Africa
Government Investment Expenditure (%GDP)

80
Appendix 1C
List of Countries
SSA Countries used for the Study SSA Countries used for the Study
Benin Cameroon
Burkina Faso Chad
Cote d’Ivoire Congo D.R.
The Gambia Congo
Guinea Gabon
Guinea Bissau Kenya
Ghana Tanzania
Mali Uganda
Mauritania Eritrea
Niger Mozambique
Senegal Zimbabwe
Sierra Leone Comoros
Togo Burundi
Botswana Mauritius
Eswatini Malawi
South Africa Sudan
Madagascar Rwanda