government and economics: an emerging field of study
TRANSCRIPT
1
Government and Economics: An Emerging Field of Study1
David Daokui Li2
Eric S. Maskin3
June 2021
Abstract
In this paper, we discuss the field of government and economics, an emerging body of
work that aims to better understand government’s role, incentives and behavior in a
modern market economy, as well as how government actions shape the economy’s
performance.
In the first part of the paper, we present evidence that the size and scope of government
in market economies have grown much larger since the industrial revolution. We then
briefly examine particular periods in the histories of the U.S., Germany, Japan, South
Korea, and China when these countries’ governments played an especially vigorous
role in promoting rapid economic growth. We also provide statistical evidence that,
across countries, more robust market-supporting behavior from governments is
associated with higher per capita income and faster growth.
The second part begins with a review of existing areas of economic research suggesting
that, so far, the discipline has neglected some significant questions concerning
government as an active player in a modern market economy.
1 We are grateful for comments and suggestions by Meixin Guo, Zhangkai Huang, Bing Li, and Lin Lu as well as for capable research assistance from Emily Finkelstine, Yuntao Hou, Kun Lang, Zihang Wang, and He Zhang. We alone are responsible for all errors. 2 Tsinghua University 3 Harvard University and Higher School of Economics
2
Finally, we propose a number of possible future research topics that we think are
tailored for the new field of government and economies.
1. Introduction
If Adam Smith could see today’s world, he would undoubtedly be surprised to find how
dramatically the size and the role of government have expanded during the past 250
years. In most pre-industrial revolution economies, the government sector typically
correspond to 15% of GDP at most, whereas today, government budgets typically
correspond to anything between 30% to 50% of GDP in market economies. Along with
this much larger budget, government’s scope of operation has also greatly increased.
Besides national defense, today’s governments provide extensive social welfare and
social insurance services, regulate markets, invest in companies, produce and maintain
public goods, and in some cases, directly supply private goods and services. Given this
prominence, we hold out great hope for the emerging field of research called
government and economics, which aims to study the government’s role, behavior, and
incentives in a modern market economy, as well as how government action shapes the
economy’s performance.
In part 1 of this paper, we first cite evidence that confirms the increased size and scope
of government. We show that government has become a major player—if not the most
important player—in many market economies. Next, we use historical cases and cross-
country statistics to illustrate that government behavior has been crucial to the
performance of market economies. In the second part, we argue that existing fields of
economics such as public finance, public choice, and political economy ignore some
significant questions concerning government as an active player in a modern market
economy. Finally, we mention a few research topics for future investigation.
3
2. Government has Become an Active and Influential Participant in Modern
Market Economies
To consider how large the size and scope of government have become in modern market
economies can be eye-opening.
2.1 Increased Government Size
Let’s first look at the size of government budgets. Governments raise their revenue from
taxes, fees, investment returns, and bonds. In Table 1, we display the ratio of
government expenditure relative to GDP over time for key countries—including OECD
countries and emerging market economies—as well as the world average. Three general
stylized facts emerge.
First, in the 250 years since the industrial revolution, the size of government has greatly
expanded. Before the industrial revolution, government budgets around the world made
up 10% of GDP on average. Now, the worldwide average is around 33%. In the case of
the U.S., during the period directly following the Civil War, the budget of the federal
and local governments accounted for 7% of GDP. Today, the ratio is 38%.
(Insert Table 1 here)
(Insert Figure 1 here)
(Insert Figure 2 here)
Second, across countries in today’s world, high-income countries on average have
larger governments per capita than low-income countries. The average ratio of
government budget to GDP among developing countries in 2018 was around 32%,
whereas the average for high-income countries was about 44%. Just to make one
4
comparison: the 2010 budget of the government of India, a large and low-income
emerging market economy was 27% of GDP, whereas the U.S. government budget that
year was around 43% of GDP.
The third stylized fact is that for the past three decades, high-income countries have
demonstrated a relatively stable government size as measured by the share of
government budget in GDP. When an economy reaches an income level of around
$10,000 to $12,000 USD per capita, the ratio tends to stabilize. For most industrialized
countries as shown in Figure 1, this stabilization occurred around the late 1970s and
early 1980s. In the case of developing countries, we have witnessed a steady increase
in government size during the past several decades, especially in the BRICS countries.
Another measure of government size is government employment. From Table 2 and
Figure 3, it is clear that it has grown as a share of total employment.
(Insert Table 2 here)
(Insert Figure 3 here)
A third measure of government’s economic role is the ratio of productive assets under
government control to GDP. There are limited data on this measure and so Tables 3 and
4 and Figures 4 and 5 provide evidence only for select countries.
(Insert Table 3 here)
(Insert Table 4 here)
(Insert Figure 4 here)
5
(Insert Figure 5 here)
2.2 The Expanded Scope of Government
There is widespread evidence that the scope of government today is much larger than
before the twentieth century, although some of this is difficult to quantify. First, let us
examine national defense. Today's national governments bear almost sole responsibility
for national defense, although certain logistical services are sometimes outsourced to
private companies. Modern governments rarely hire mercenaries to fight for national
interests, in contrast with historical practice. For example, the Dutch East India
Company (1602-1799), as a commercial company, had 40 battleships and an army of
10,000 soldiers which it used to perform military services on behalf of the Netherlands.
Second, let us consider law and order, including the police force, court system, and
immigration management (Razin and Sadka, 2021). In this area, modern governments
are much larger today than 150 years ago. In the U.K., government expenditure on
police, fire and rescue, and administration of justice only accounted for 0.25% of GDP
in 1870, rising to 2% by 2004.4 In the case of the U.S., government expenditure on
public order and safety was 0.8% of GDP in 1959, but reached 1.9% by 2019.5
Next, are government operations intended to ensure the proper function of the market:
regulating financial markets, managing the monetary system, maintaining adequate
market competition, protecting consumers, negotiating trade and investment
agreements, and establishing and enforcing technical standards for products. Except for
international trade (historically, governments of European city-states negotiated trade
agreements and protected trade routes), almost all of these operations did not even exist
two hundred years ago. Indeed, government’s role continues to expand. In China,
4 Lee, C. (2011). The growth of public expenditure in the United Kingdom from 1870 to 2005. Springer. 5 Data source: NIPA Table 1.1.5 and 3.16, Bureau of Economic Analysis, U.S. Department of Commerce.
6
Europe, and the U.S., for example, there is currently intense pressure for government
to regulate the behavior of internet platform companies such as Facebook and Tencent.
The fourth category of government functions comprises perhaps the largest expansion
of all, that is, social welfare and social insurance. Historically, sovereign governments
have attempted to provide relief for the population in case of natural disasters. But
modern governments go far beyond disaster relief by conducting vast programs of
social security and social insurance, including healthcare and programs for citizens who
are elderly, low income, unemployed, or disabled. For high-income market economies,
on average one-half of the government budget is spent on such welfare programs. They
are now at the core of government operations.
2.3 Why the Increased Size and Expanded Scope?
Why has government involvement in the economy grown so much in size and scope?
There is a wide range of answers, which we group into four major categories.
The first sort of explanation centers on the crucial role of government in promoting
development of markets. We will look at several historical case studies in Section 3.
A different kind of answer focuses on the idea that modern economies are much more
complicated than those of the industrial revolution. In contemporary economies,
transactions take place between people who scarcely know one other, and this requires
regulation by government. Modern economies demand much knowledge on the part of
citizens and industry, both so that they can adequately function in a complicated
environment and also produce the new ideas that lead to growth. Hence, government
has become heavily involved in public education and funding for scientific research.
A third sort of explanation starts from the fact there is less social tolerance today for
extreme inequities in income and economic opportunity than there was hundreds of
7
years ago. Hence, governments have been pushed to establish programs to help the
disadvantaged. Along this line, Rodrik (1998) shows there is a positive correlation
between an economy's exposure to international trade and the size of its government,
since international trade introduces risk, which especially affects the poor. In prior eras,
governments ignored such risk.
Fourth, as noted before, contemporary governments are essentially the sole provider of
national defense. And modern military equipment is extremely expensive, so military
budgets loom large in most countries’ GDPs.
Finally, there is an argument that government itself is the reason for government
expansion. Governments consist of people who self-interestedly try to expand their own
influence. Therefore, government tends to expand endogenously, which may occur at
the expense of social welfare. In this paper, we don’t attempt to evaluate this line of
argument. However, we note that it constitutes one more reason for the discipline of
economics to include government as an essential player in the market economy. That
is, it strengthens the argument for a new research field devoted to government and
economics.
3. Government’s Role in Five Historical Episodes of Rapid Economic Growth:
The U.S., Germany, Japan, South Korea, and China
Not only has government’s role in the economy grown, it has been critical to bringing
many countries to the economic forefront. Below we give several prominent examples.
8
3.1 The U.S. Economy after the Civil War
The thirty years after the U.S. Civil War, from 1865 to 1894 were perhaps the most
important period of U.S. economic development. The U.S. economy expanded rapidly
during this time, rising to become the largest industrial economy in the world by 1894,
with a GDP of $227 billion (in 1990 International Dollars), overtaking the U.K. ($156
billion). During this period, the U.S. federal and local governments played an essential
role in the economy. There are at least five areas in which the government intervened.6
Facilitating infrastructure investment
First, the U.S. government facilitated infrastructure investment, especially railroad
construction. The period of 1868 to 1892 saw the fastest pace of railroad construction
in U.S. history. In 1860, the total length of U.S. railroads was 30,000 miles, accounting
for about half of the world total. Between the 1860s and 1890s, 140,000 miles of
railroad were added, allowing railroad transportation volume to multiply by a factor of
30.7
The U.S. government contributed to railroad construction in two major ways: (i)
through provision of land and (ii) financial support.
In the Pacific Railroad Act of 1862, the federal government authorized two companies
to construct the Pacific Railroad and granted them the land to do so. From 1862 to 1871,
the federal government granted a total of nearly 200 million acres of land (about 30
times the size of the state of Massachusetts) for railroad construction. 8 This land
proved to be more than enough—about one-third remained unused and was returned to
6 Maddison, A. (2007). Contours of the world economy 1-2030 AD: Essays in macro-economic history. Oxford University Press. 7 Engerman, S. L., & Gallman, R. E. (Eds.) (1996). The Cambridge economic history of the United States: Vol 2, Ch 12&13. Cambridge University Press. 8 Engerman, S. L., & Gallman, R. E. (Eds.) (1996). The Cambridge economic history of the United States: Vol 2, Ch 13. Cambridge University Press.
9
the government.
As for financial support, federal and state governments provided about $350 million in
railroad construction subsidies between 1862 and 1873—about 5% of the total
investment.9 Of this $350 million, $65 million was given in federal loan credits while
the rest consisted of local subsidies. Subsidies mostly took the form of stock and bond
purchases financed by state governments by issuing tax-based municipal bonds.
During this time, state and local governments also invested on a huge scale in other
infrastructure projects, including roads, waterworks, schools, hospitals, recreational
parks, etc. In 1860, the total outstanding local debt, not including state debt, was about
4.6% of GDP. By 1880, it had grown to about 7.9% of GDP in the amount of $821
million. 10 Innovative debt financing approaches were used, in which local
governments issued income bonds and special assessment bonds. Public services like
schools and parks were recognized as a special types of governmental institutions with
debt-financing powers. Thus, these public services were able to raise their own debt
independent of government.
Promoting education and human capital accumulation
Second, government facilitated education and training. The Morrill Act of 1862
expanded tertiary education in agricultural modernization. Federal and local
governments granted over 17 million acres of land to be sold to raise money for the
establishment of land-grant colleges11, which specialized in agriculture, engineering,
and the sciences. Most of these colleges gradually became state universities that grew
to offer a full spectrum of educational opportunities, and made higher education
9 Engerman, S. L., & Gallman, R. E. (Eds.) (1996). The Cambridge economic history of the United States: Vol 2, Ch 12&13. Cambridge University Press. 10 Engerman, S. L., & Gallman, R. E. (Eds.) (1996). The Cambridge economic history of the United States: Vol 2, Ch 12. Cambridge University Press. 11 Engerman, S. L., & Gallman, R. E. (Eds.) (1996). The Cambridge economic history of the United States: Vol 2, Ch 7&12. Cambridge University Press.
10
available to ordinary people. The introduction of agriculture and engineering education
in universities greatly increased in the educated population and proved crucially
important for the U.S. economy.
Facilitating technological innovation
Third, the U.S. government facilitated technological innovation by establishing the
world’s first modern patent system. The government passed the first patent act in 1790
and later revised it in 1793 and 1836. By 1836, the law established clearly defined
administrative review procedures and set only modest fees for patent registration. It
gave ownership rights to innovators, thus encouraging invention and promoting the
creation of new technologies. The U.S. experienced a patent boom between 1865 and
the late 1880s, coinciding with the rapid growth of manufacturing. 12,13
(Insert Figure 6 here)
International economic policies to promote industrialization
Finally, the U.S. federal government adopted sophisticated international policies to
promote industrialization. First, the U.S. maintained an open-door policy toward
foreign investment, which provided much-needed capital for U.S. industrialization.
Between 1861 and 1870, the net inflow of foreign capital into the U.S. economy was
about $87.5 million per year, around 1-2% of GDP. By today's standards, this is
remarkably high. Between 1881 and 1890, the net capital inflow was at 2% of GDP. As
a result, the U.S. was able to accumulate international liabilities amounting to about 19%
of GDP by 1890. Between 1860 and 1869, most foreign capital was invested in federal
12 USPTO. (2019). U.S. patent activity calendar years 1790 to the present. USPTO. Retrieved May 7, 2021, from https://www.uspto.gov/web/offices/ac/ido/oeip/taf/h_counts.htm 13 NBER. (2004). U.S. industrial production index (1790-1915). NBER. Retrieved May 7, 2021, from http://www2.nber.org/data/industrial-production-index/

11
bonds, while after 1869, it gradually moved into the infrastructure sector. Through 1880,
about 72% of long-term foreign investment was in the railroad sector. After 1880,
during the development of the western US, considerable foreign capital moved to
mining, agriculture, and the oil sector – growing from less than 1% to about 10% of
investments in these sectors.14
In contrast to its policy on foreign investment, the government protected its growing
industries by maintaining high tariffs on foreign goods. During the Civil War, the
government raised tariff rates from about 15% to about 30%, and after the war, these
rates remained in place. From the 1860s through the 1890s, the average tariff rate was
over 30%. This especially benefited the iron and steel industry,15 whose competition
from imports fell from 12% in 1869 to about 1.5% by 1909 amid a rapid increase in the
demand for iron and steel. In the early 1900s, when protectionist tariffs were no longer
needed, the government lowered tariff rates dramatically (although, during the early
Great Depression, the government misguidedly attempted to use protective tariffs as a
damage control measure, provoking retaliation by European countries). In 1934, the
U.S. Congress passed the Reciprocal Tariff Act to promote trade liberalization. Since
then, the U.S. generally has maintained a policy of free trade, with low tariff rates.16
3.2 The Case of Germany’s Economic Emergence after 1871
After Germany was united in 1871, its economy grew very rapidly. The average annual
growth rate of GDP was 1.9% from 1875 to 1891 and 3.2% from 1892 to 1913.
Meanwhile, the index of industrial production increased from 18.8 in 1870 to 61.4 in
1900 (with 1913 as the base year). From 1880 to 1913, exports grew from 2.923 billion
14 Engerman, S. L., & Gallman, R. E. (Eds.) (1996). The Cambridge economic history of the United States: Vol 2, Ch 7&16. Cambridge University Press. 15 Engerman, S. L., & Gallman, R. E. (Eds.) (1996). The Cambridge economic history of the United States: Vol 2, Ch 11. Cambridge University Press. 16 United States. Bureau of the Census. (1975). Historical statistics of the United States, colonial times to 1970 (No. 93). US Department of Commerce, Bureau of the Census.
12
marks to 10.097 billion marks, an increase of 245%.17,18
International Tariffs
The German government aggressively promoted this economic development. First, it
vigorously supported its infant industries through trade protectionism. Before 1879,
Germany had pursued a free trade policy, conducive to agricultural exports. However,
in the late 1870s, the country switched to a protectionist trade system for its domestic
industries—a decision directly triggered by the world economic crisis of 1873-1874,
during which numerous German enterprises went bankrupt. In 1879, in order to protect
infant industries, the Reichstag (Germany’s parliament) raised tariffs (to 18% on pig
iron and 15%~30% on textiles19) and raised them twice more in the following years.
High tariffs caused widespread dissatisfaction among German consumers, who had to
buy most of their industrial and agricultural products at prices above the international
market. They were also met with retaliatory measures from other countries. Therefore,
the German government arranged a series of agreements with surrounding agricultural
countries wherein Germany agreed to reduce import tariffs on agricultural products in
exchange for more purchases of German industrial exports.
As a result of protectionism, Germany was able to balance its trade and, more important,
protect its industries. In 1872, Germany imported 3.262 billion marks and exported 2.31
billion marks worth of goods. By 1880, the country imported 2.83 billion marks and
exported 2.9 to 3 billion marks, showing a trend of surplus.20 With the help of trade
protectionism, Germany developed strong, competitive industrial sectors. Once this
17 Habakkuk, H. J. (1965). The Cambridge economic history of Europe(p. III): Vol 7&8. M. M. Postan (Ed.). The University Press. 18 Hoffmann, W. G. (2013). Das Wachstum der deutschen Wirtschaft seit der Mitte des 19. Jahrhunderts. Springer-Verlag. 19 Habakkuk, H. J. (1965). The Cambridge economic history of Europe(p. III): Vol 8. M. M. Postan (Ed.). The University Press. 20 Habakkuk, H. J. (1965). The Cambridge economic history of Europe(p. III): Vol 8. M. M. Postan (Ed.). The University Press.
13
advantage was firmly established, German industries were re-exposed to foreign
competition, as the country returned to free trade in the 1890s.
Promoting scientific research and technological progress
The German government also helped promote the economy through active investment
in and support for scientific research. Soon after unification, the government
established a series of scientific research institutions. It also invested in national
research institutes and helped universities and enterprises set up research centers,
institutes, and laboratories. A series of new inventions such as generators, the gas engine,
electrical furnaces, and automobiles were born out of these scientific research
institutions. Many of the world’s leading scientists also emerged from the German
system. In the 14 years from 1900 to 1913, 13 German scientists won the Nobel Prize,
including 4 in medicine, 4 in physics, and 5 in chemistry.
To further promote technological progress, the German government also passed the
patent law of 1879 and revised it in 1895. Consequently, the number of patents granted
increased steadily, from 550 in 1860, to 6,280 in 1894, to 12,100 in 1910.21 Through
this strategy, Germany was able to catch up with and later surpass the industrial
technologies of Britain and France. By the late 19th century, Germany had become the
world leader in the production of acids, alkalis, dyes, and other chemicals. The electrical
industry provides a particularly vivid example: in the 22 years from 1891 to 1913, the
total output of Germany’s electrical industry increased 28-fold. By 1913, German
electrical products accounted for 34% of global production of similar products, while
the United States’ share stood at around 29%.22,23
21 Khan, B. Z. (2008). An economic history of patent institutions. EH. Net Encyclopedia. http://eh. net/encyclopedia/article/khan. patents. 22 Habakkuk, H. J. (1965). The Cambridge economic history of Europe(p. III): Vol 7. M. M. Postan (Ed.). The University Press. 23 Kiesewetter, H. (1996). Industrielle Revolution in Deutschland: 1815-1914. 3. Auflage 1996. Suhrkamp.
14
Investing in education
Education is another area in which the German government invested heavily. By the
end of the 1840s, 82% of school-aged children were enrolled in school. By the end of
the 1860s, the enrollment rate stood at 97.5%. In comparison, Britain’s enrollment rate
in 1903 was only 88%. The German government also worked to enhance secondary
education, which greatly improved the quality of the German labor force. In order to
strengthen the technical education of young workers and apprentices, It set up many
technical schools, vocational schools, amateur technical night schools, and Sunday
schools.24
The social security program
The German government was the first in the world to establish a nationwide social
security system to alleviate the pains of rapid industrialization. Industrialization
resulted in health problems for many working-class people, and shocks from market
fluctuations spurred frequent labor protests in the 1880s. In response, the German
government took the lead in social security by introducing a series of social insurance
programs, including medical insurance, industrial-injury insurance, endowment
insurance, and unemployment insurance. Social security mitigated the pains of
industrialization, alleviated social tensions, and helped stabilize society throughout the
rapid industrialization process.
3.3 The Case of Japan after the Meiji Restoration
The Japanese economy rapidly industrialized after the Meiji Restoration of 1868.
Before this, the economy had been heavily agricultural. In 1870, the per capita output
24 Habakkuk, H. J. (1965). The Cambridge economic history of Europe(p. III): Vol 7. M. M. Postan (Ed.). The University Press.
15
of Japan was only about 25% of that of Britain.25 In 1872, 72% of Japan’s employed
population worked in the agricultural sector, compared with 19% in the U.K. At that
time, Japan was forced to sign a sequence of unequal treaties with Western powers.
Against this background, the Japanese government implemented a series of reforms to
establish a vigorous market economic system.
Establishing a unified domestic market
First, the Japanese government unified the country in order to create a unified market.
It abolished the han system and established a system of prefectures in its place, which
facilitated this unification. The government also helped direct social resources to
industrialists (and away from gentry). In addition, it abolished the rigid hierarchical
system among gentry, farmers, workers, and merchants, thereby promoting the free
flow of labor across the country.
As a result, the annual growth rate of non-agricultural employment reached over 4%
between 1875 and 1891, while that of Great Britain was no more than 1.6%.26 This
rapid increase occurred mainly because farmers were now free to leave their land and
work in industry. But the government also attended to agriculture: it initiated reform to
establish private land ownership, which improved agricultural productivity, and it
expanded cultivated land area by 22% between 1874 and 1890. Agricultural production
and real income rose by more than 2% per year during 1868-1911, i.e., more than twice
the rate of population growth.27
Establishing state-owned enterprises as showcases
25 Maddison, A. (2007). Contours of the world economy 1-2030 AD: Essays in macro-economic history. Oxford University Press. 26 Umemura, M. (1965). Agriculture and labour supply in Japan in the Meiji Era. The Developing Economies, 3(3), 269-285. 27 Umemura, M. (1965). Agriculture and labour supply in Japan in the Meiji Era. The Developing Economies, 3(3), 269-285.
16
To demonstrate how modern industries should work, the Japanese government
established state-owned enterprises as showcases in the railway, mining metallurgy and
ship building industries. Later, when private entrepreneurs were convinced of the value
of modern business methods, the government privatized these enterprises on terms
favorable to investors. In traditional East Asian societies like Japan, the most talented
people had historically been concentrated in government, so this strategy helped bridge
the gap between the public and private sectors.
State-owned enterprises promoted modern management by employing foreign
specialists and adopting the latest machinery. These enterprises also helped train
Japanese technical specialists, which laid the groundwork for the rapid growth of
private-sector factories. To quote Toshimichi Okubo, one of the leaders of the Meiji
Restoration, “The strength of a country depends on the wealth of the people, and the
wealth of the people depends on the quantity of products. Although the quantity of
products depends on whether the people devote themselves to industry or not, the root
of it depends on the guidance and encouragement from government officials.”
Following this logic, government-owned factories were used as examples to guide and
encourage the development of private enterprises.
Between 1884 and 1893, 21 state-owned factories were sold to private enterprises,
including Sumitomo, Mitsui, and other leading companies that still exist today.28 ,29
Subsequently, the government's direct operations were limited to sectors such as mining,
printing, railroad, telecommunications, and postal services.
In sectors where private enterprises were weak, the Japanese government provided
support until they could stand on their own. The case of Mitsubishi is a good illustration.
Before the Meiji Restoration, Japanese maritime trade was mainly dominated by British
28 Ōkubo, T. (1965). Historical source of modern history of Japan. Yoshikawa Kobunkan. 29 Andō, Y (1979). An overview of modern Japanese economic history. Tōkyō: University of Tōkyō Press.

17
and U.S. companies, while Japanese domestic shipping was nearly nonexistent. In the
early Meiji era, the shipping industry in Japan was still based on traditional sailboats.
For example, in 1870 there were only 35 steamships and 11 Western-style sailboats
registered nationwide in Japan—far below the level of Western companies. Then, the
Japanese government decided to help Mitsubishi compete with foreign companies
along the Yokohama-Shanghai route. 30 Between 1875 and 1876, the government
supplied over 30 ships for Mitsubishi to use free-of-charge and provided a shipping
subsidy of 250,000 yen to help Mitsubishi cut its prices and compete with the Pacific
Mail Steamship Co., its U.S.-based competitor. The government also provided
Mitsubishi with preferential loans of 800,000 yen, which ultimately pushed Pacific
Mail out of the Yokohama-Shanghai route. It even imposed cumbersome boarding
procedures on Japanese passengers taking foreign ships, thus inducing them to choose
domestic options. The Japanese government also provided special convenience and low
freight rates for Mitsubishi’s goods, while enacting tariffs and transportation barriers
against British goods. In August 1876, the Peninsular and Oriental Steam Navigation
Company, Mitsubishi’s main British competitor, also withdrew from the Yokohama-
Shanghai route. Since then, although many foreign merchant ships have continued to
engage in maritime activities along the coast of Japan, they no longer pose a
competitive threat to Mitsubishi.
Investing in infrastructure
Beginning in 1870, the Japanese government made a great effort to promote
infrastructure development, including the rapid construction of railroads. Nippon
Railway, Japan’s first private railway company, was founded in 1881 with the direct
support of the government, which raised 20 million yen for railway construction.
Japan’s railways grew from a total length of only 138 miles in 1881 to 3,855 miles by
30 Yamamura, K. (1967). The founding of Mitsubishi: a case study in Japanese business history. The Business History Review, 141-160.
18
1900.31 The Japanese government raised the funds necessary for this accomplishment
by issuing public debt and reforming. In 1870, 4.88 million yen was raised in Britain to
build the Tokyo-Yokohama line, the first modern railway of Japan. In 1878, 12.5 million
yen in public debt was issued expressly to finance construction of railways, mines, ports,
and roads. From 1870 to 1880, public debt issued by the Japanese government
amounted to 237 million yen, about 9.6% of GDP in 1874.32,33
Consolidating public finance for industrialization
At the beginning of the Meiji Restoration, Japan consolidated its public finance for
industrialization, which the government accomplished through land tax reform. Unlike
in the U.S., the Meiji government could not rely on tariffs to raise revenue since this
option had been eliminated by treaties with Western powers. Thus, the Meiji
government implemented a land tax reform. Previously, Japan’s land rent was paid in
kind, which made tax collection difficult and costly. In 1873, Japan announced the
abolition of physical land rent and stated that all land taxes were to be collected in yen
at 3% of the assessed land value. This improved tax collection and improved tax
revenue. The land rent reform of 1873 raised land tax revenue from approximately 20
million yen in 1872 to about 68 million yen in 1875, which markedly strengthened the
financial basis of the Meiji government. In 1877, the 3% tax rate was lowered to 2.5%
in response to pressure from landowners, but nevertheless, from 1873 until 1878, land
taxes accounted for 88% of total central government taxes. Even by the end of the 1880s,
land taxes continued to account for more than 60% of total government revenue.34
Establishing a modern financial system
31 Ike, N. (1955). The pattern of railway development in Japan. The Far Eastern Quarterly, 14(2), 217-229. 32 Ike, N. (1955). The pattern of railway development in Japan. The Far Eastern Quarterly, 14(2), 217-229. 33 Takao, T. (1965). The financial policy of the Meiji Government. The Developing Economies, 3(4), 427-449. 34 Bird, R. M. (1977). Land taxation and economic development: the model of Meiji Japan. The Journal of Development Studies, 13(2), 162-174.
19
To further support economic development, the Japanese government promoted a
modern monetary and financial system. In November 1872, the National Bank Act
established four national banks in Tokyo, Yokohama, Niigata, and Yokohama. Then, in
August 1876, Japan revised its national banking regulations to support privately-owned
commercial banks. At the time of these revisions, there were only six state banks and
one private bank, with a total capitalization of 4.5 million yen. By 1880, the number of
total banks had reached 312, with a total capitalization of 50.5 million yen.35 After the
Bank of Japan was established in 1882, it began to play the role of central bank, and
the former national banks gradually stopped issuing banknotes until they were merged
or reorganized into ordinary commercial banks. Meanwhile, in 1878, the Japanese
government established two securities markets – the Tokyo and Osaka Stock Exchanges
– along with the necessary rules and guidelines to manage them. When many state-
owned enterprises were sold to the private sector between 1884 and 1893, stock trading
increased accordingly.
3.4 The Case of the South Korean Economic Miracle
The Republic of Korea experienced extremely rapid economic growth between 1960
and 1990 in an episode often called the South Korean Economic Miracle. This growth
was made possible by government efforts under President Park Chung-hee, who
prioritized key industries for rapid development and implemented an export-oriented
strategy.
Identifying key industrial sectors for support
South Korea’s first five-year plan began in 1961, when the government established an
economic planning board to coordinate production, consumption, and investment in
35 Nakamura, J. I. (1966). Meiji land reform, redistribution of income, and saving from agriculture. Economic Development and Cultural Change, 14(4), 428-439.
20
various economic sectors. The board also set an ambitious goal of rapid
industrialization and export growth. To accomplish this, the government first
nationalized privately-owned commercial banks and took control of the credit supply.
The idea was to funnel investment into key industrial firms, which remained in private
hands and continued to compete in the free market.
Between 1960 and 1962, the focus industries were cement, electricity, and coal mining.
Between 1967 and 1971, the priority shifted to automobiles and fertilizers. From 1971
to 1976, shipbuilding, iron and steel, nylon, and machinery became the most crucial.
Between 1977 and 1981, the industries of electronics, petrochemistry, shipbuilding,
iron and steel, and machinery took center stage. The growth rates of these favored
industries significantly outpaced the rest of the economy. For instance, from 1977 to
1981, South Korean GDP grew by 79%. However, the iron and steel industry grew by
246%, the machinery industry grew by 300%, the electronics industry grew by 338%,
the shipbuilding industry grew by 211%, and the petrochemical industry grew by
311%.36
The government promoted this remarkable growth in several ways. First, as already
mentioned, through finance. In particular, the national pension service and the Korean
Development Bank provided low-interest loans for key industries. Second, through tax
reductions for these industries and protectionist import tariff rates. Third, through
land—the government built industrial parks and sold them directly to large enterprises.
Fourth, to build human capital, the government also established many universities and
colleges to train engineers.
Export-oriented policy
Before 1963, South Korea mainly implemented an import substitution strategy, whereas
36 Kim K S. The Korean miracle (1962-1980) revisited: myths and realities in strategy and development[M]. Helen Kellogg Institute for International Studies, University of Notre Dame, 1991.
21
an export-oriented strategy was formally proposed in a supplement to the country’s first
five-year plan published in 1964. At first, South Korea focused on cultivating labor-
intensive light industries and handicraft exports. Later, it gradually turned to heavy and
high-tech industries. Along the way, multiple policies were used to support exports. For
example, the government controlled and maintained a stable exchange rate and actively
manipulated the value of the Korean won. Financial support was also provided through
export promotion funds, foreign exchange loans, tax breaks, and tariff reductions for
export industries importing raw materials from overseas. In addition, the government
lowered shipping and transportation fees for exporting firms and encouraged exporting
industries to form export associations.
3.5 China’s Rapid Economic Growth During the Era of Reform and Opening Up,
1978-2018
China’s development over the last 40 years constitutes the most rapid period of
economic growth in history. China’s share of world GDP increased from 4.9% in 1978
to 18.3% in 2017 (the second-fastest growth occurred in the U.S. after the Civil War:
the U.S. share of world GDP increased by about 10%). Throughout this period of
growth, the Chinese government, at both the central and local levels, has played a
significant role in promoting the market economy. Of course, market forces themselves
have clearly been the decisive force, but government has been crucial in kickstarting
market forces and mitigating excessive market fracture during the economic takeoff.
There are five specific areas in which the Chinese government’s contribution to growth
has been particularly noteworthy.
Facilitating the rapid entry of new enterprises
The Chinese government played a notable role in facilitating the rapid entry of new
enterprises. Before the era of reform, most enterprises had been state-owned. This
22
began to change after 1979, but almost all new private enterprises have received help
from local governments.37
Help has taken various forms. The most common approach has been for local
governments to set up industrial parks in which necessities such as electricity, steam
power, water, roads, and waste collection are pre-established. As of 2017, there were
more than 5,000 industrial parks in China, all competing with one another to provide
the most enticing incentives to attract new enterprises.
The second approach has been for provincial and local governments to help private
enterprises adapt to the changing economic environment. For example, before the early
1990s, many private enterprises had been initially organized as cooperatives in which
the employees owned shares. However, government realized that these enterprises
could provide better incentives if they were owned by management. Consequently, it
promoted the privatization process by helping management borrow enough from banks
to buy out the other shareholders.
The Chinese government has also introduced various incentives to attract foreign
enterprises to China. One example is the case of Tesla in 2019, when the municipal
government of Shanghai wooed the company with free land and tax breaks. As a result,
Tesla was able to begin production in 2020, after only one year of investment—a
remarkably quick rollout.
Rapid land conversion
Assisting with rapid land conversion has been a notable policy of the Chinese
government. In China, there are two types of land: agricultural land (which is typically
owned by collectives in the countryside) and non-agricultural land. In most other
37 Li, D. D., Li, K., Jin, X., Wang, H., Xu, X., & Lang, K. (2021). Rapid entry and development of enterprises. Economic Lessons from China’s Forty Years of Reform and Opening-up, 9.
23
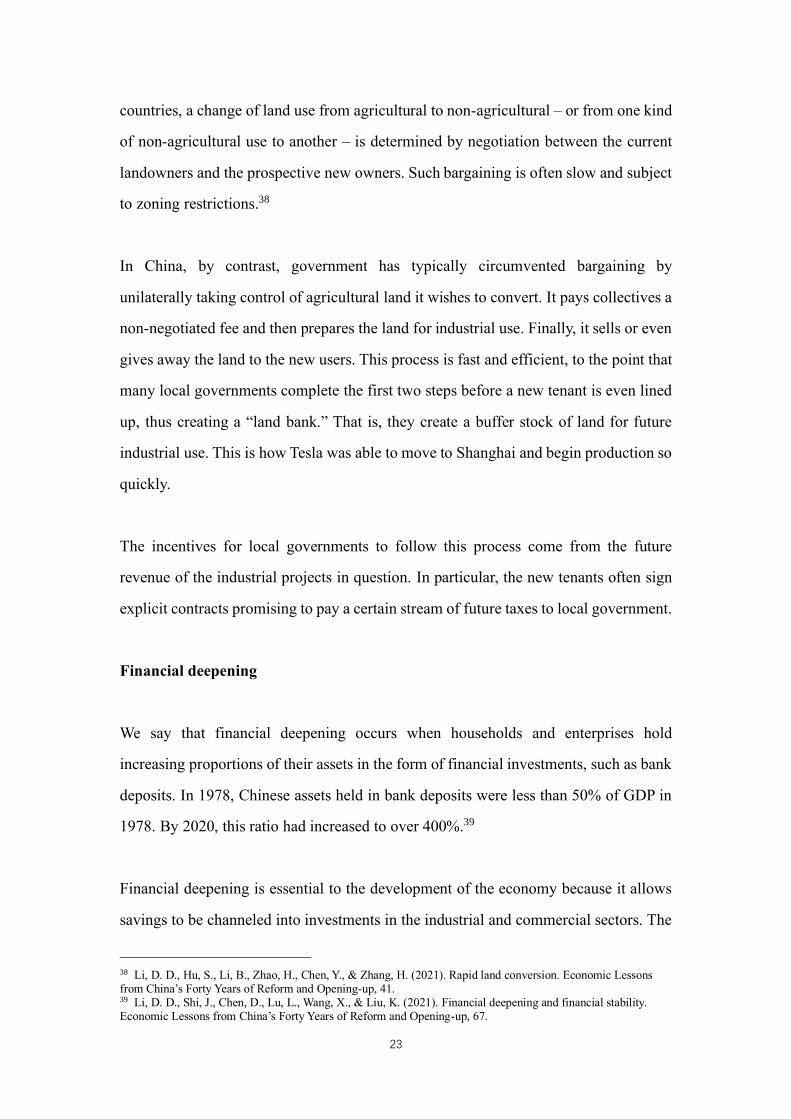
countries, a change of land use from agricultural to non-agricultural – or from one kind
of non-agricultural use to another – is determined by negotiation between the current
landowners and the prospective new owners. Such bargaining is often slow and subject
to zoning restrictions.38
In China, by contrast, government has typically circumvented bargaining by
unilaterally taking control of agricultural land it wishes to convert. It pays collectives a
non-negotiated fee and then prepares the land for industrial use. Finally, it sells or even
gives away the land to the new users. This process is fast and efficient, to the point that
many local governments complete the first two steps before a new tenant is even lined
up, thus creating a “land bank.” That is, they create a buffer stock of land for future
industrial use. This is how Tesla was able to move to Shanghai and begin production so
quickly.
The incentives for local governments to follow this process come from the future
revenue of the industrial projects in question. In particular, the new tenants often sign
explicit contracts promising to pay a certain stream of future taxes to local government.
Financial deepening
We say that financial deepening occurs when households and enterprises hold
increasing proportions of their assets in the form of financial investments, such as bank
deposits. In 1978, Chinese assets held in bank deposits were less than 50% of GDP in
1978. By 2020, this ratio had increased to over 400%.39
Financial deepening is essential to the development of the economy because it allows
savings to be channeled into investments in the industrial and commercial sectors. The
38 Li, D. D., Hu, S., Li, B., Zhao, H., Chen, Y., & Zhang, H. (2021). Rapid land conversion. Economic Lessons from China’s Forty Years of Reform and Opening-up, 41. 39 Li, D. D., Shi, J., Chen, D., Lu, L., Wang, X., & Liu, K. (2021). Financial deepening and financial stability. Economic Lessons from China’s Forty Years of Reform and Opening-up, 67.
24
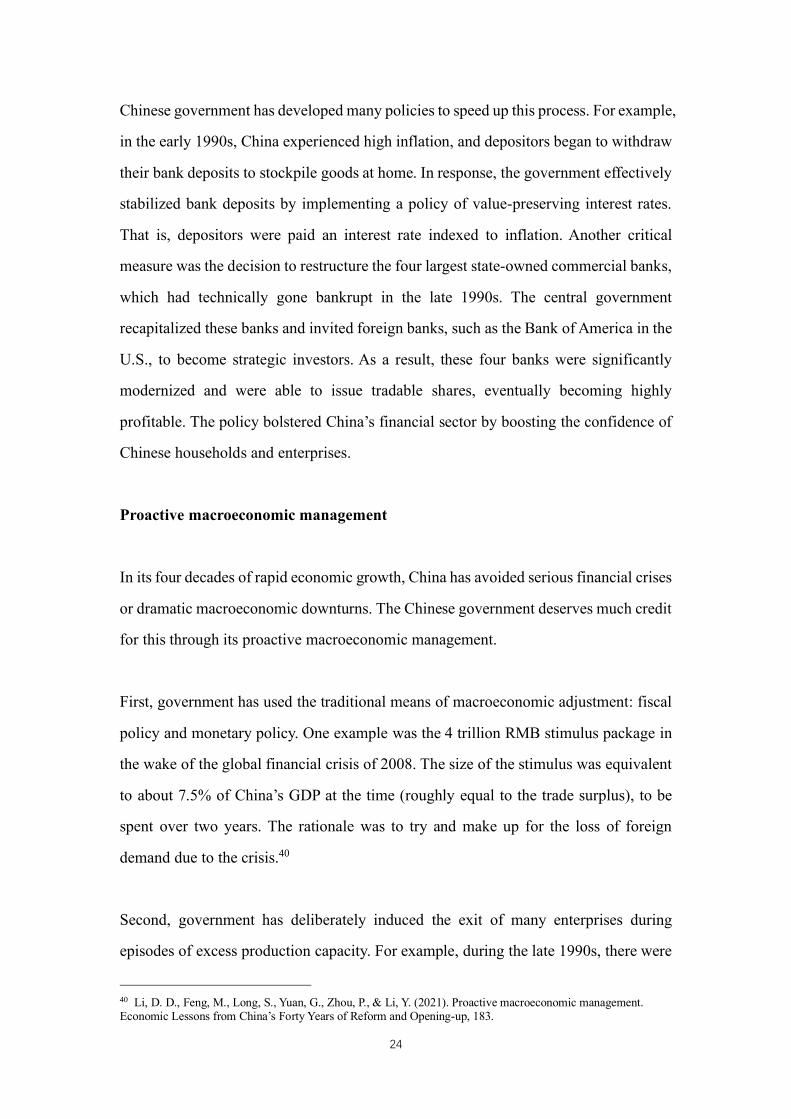
Chinese government has developed many policies to speed up this process. For example,
in the early 1990s, China experienced high inflation, and depositors began to withdraw
their bank deposits to stockpile goods at home. In response, the government effectively
stabilized bank deposits by implementing a policy of value-preserving interest rates.
That is, depositors were paid an interest rate indexed to inflation. Another critical
measure was the decision to restructure the four largest state-owned commercial banks,
which had technically gone bankrupt in the late 1990s. The central government
recapitalized these banks and invited foreign banks, such as the Bank of America in the
U.S., to become strategic investors. As a result, these four banks were significantly
modernized and were able to issue tradable shares, eventually becoming highly
profitable. The policy bolstered China’s financial sector by boosting the confidence of
Chinese households and enterprises.
Proactive macroeconomic management
In its four decades of rapid economic growth, China has avoided serious financial crises
or dramatic macroeconomic downturns. The Chinese government deserves much credit
for this through its proactive macroeconomic management.
First, government has used the traditional means of macroeconomic adjustment: fiscal
policy and monetary policy. One example was the 4 trillion RMB stimulus package in
the wake of the global financial crisis of 2008. The size of the stimulus was equivalent
to about 7.5% of China’s GDP at the time (roughly equal to the trade surplus), to be
spent over two years. The rationale was to try and make up for the loss of foreign
demand due to the crisis.40
Second, government has deliberately induced the exit of many enterprises during
episodes of excess production capacity. For example, during the late 1990s, there were
40 Li, D. D., Feng, M., Long, S., Yuan, G., Zhou, P., & Li, Y. (2021). Proactive macroeconomic management. Economic Lessons from China’s Forty Years of Reform and Opening-up, 183.
25
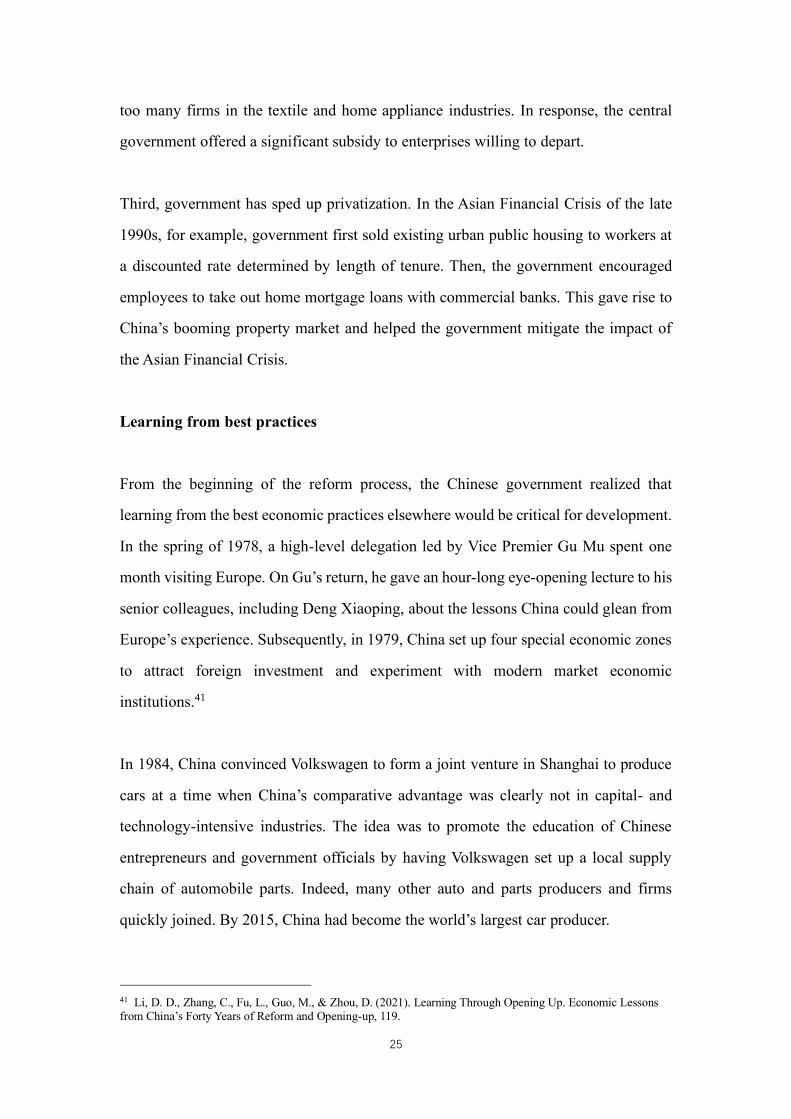
too many firms in the textile and home appliance industries. In response, the central
government offered a significant subsidy to enterprises willing to depart.
Third, government has sped up privatization. In the Asian Financial Crisis of the late
1990s, for example, government first sold existing urban public housing to workers at
a discounted rate determined by length of tenure. Then, the government encouraged
employees to take out home mortgage loans with commercial banks. This gave rise to
China’s booming property market and helped the government mitigate the impact of
the Asian Financial Crisis.
Learning from best practices
From the beginning of the reform process, the Chinese government realized that
learning from the best economic practices elsewhere would be critical for development.
In the spring of 1978, a high-level delegation led by Vice Premier Gu Mu spent one
month visiting Europe. On Gu’s return, he gave an hour-long eye-opening lecture to his
senior colleagues, including Deng Xiaoping, about the lessons China could glean from
Europe’s experience. Subsequently, in 1979, China set up four special economic zones
to attract foreign investment and experiment with modern market economic
institutions.41
In 1984, China convinced Volkswagen to form a joint venture in Shanghai to produce
cars at a time when China’s comparative advantage was clearly not in capital- and
technology-intensive industries. The idea was to promote the education of Chinese
entrepreneurs and government officials by having Volkswagen set up a local supply
chain of automobile parts. Indeed, many other auto and parts producers and firms
quickly joined. By 2015, China had become the world’s largest car producer.
41 Li, D. D., Zhang, C., Fu, L., Guo, M., & Zhou, D. (2021). Learning Through Opening Up. Economic Lessons from China’s Forty Years of Reform and Opening-up, 119.
26
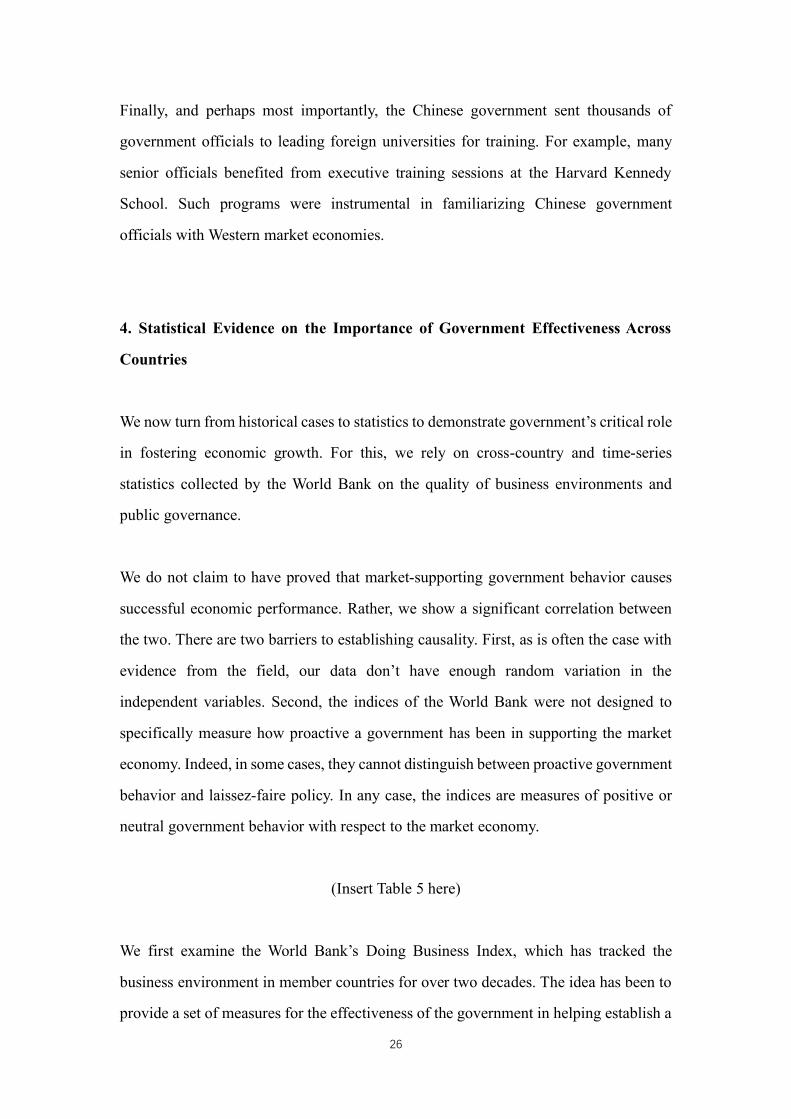
Finally, and perhaps most importantly, the Chinese government sent thousands of
government officials to leading foreign universities for training. For example, many
senior officials benefited from executive training sessions at the Harvard Kennedy
School. Such programs were instrumental in familiarizing Chinese government
officials with Western market economies.
4. Statistical Evidence on the Importance of Government Effectiveness Across
Countries
We now turn from historical cases to statistics to demonstrate government’s critical role
in fostering economic growth. For this, we rely on cross-country and time-series
statistics collected by the World Bank on the quality of business environments and
public governance.
We do not claim to have proved that market-supporting government behavior causes
successful economic performance. Rather, we show a significant correlation between
the two. There are two barriers to establishing causality. First, as is often the case with
evidence from the field, our data don’t have enough random variation in the
independent variables. Second, the indices of the World Bank were not designed to
specifically measure how proactive a government has been in supporting the market
economy. Indeed, in some cases, they cannot distinguish between proactive government
behavior and laissez-faire policy. In any case, the indices are measures of positive or
neutral government behavior with respect to the market economy.
(Insert Table 5 here)
We first examine the World Bank’s Doing Business Index, which has tracked the
business environment in member countries for over two decades. The idea has been to
provide a set of measures for the effectiveness of the government in helping establish a
27
healthy business environment. There are about 10 sub-indices, including the ease of
starting a business, obtaining construction permits, getting access to electricity,
registering a piece of property, obtaining credit, protecting minority investors, paying
taxes, conducting trade across borders, enforcing contracts, and resolving insolvency.
Although there has been some criticism of the accuracy and reliability of the data, the
Index is a widely-used measure of government effectiveness.
We first show that a country’s Doing Business Index score is closely correlated with its
income level. Figure 7 demonstrates the single variable correlation between a country’s
absolute score on the Doing Business Index and the logarithm of per capita GDP,
showing a positive correlation.
(Insert Figure 7 here)
Next, we run a set of regressions to show how economic performance is positively
correlated with a country’s Doing Business Index score. We control for other factors
affecting economic performance, such as the ratio of fixed asset investment to real GDP,
the ratio of urban population to total population, and industrial value-added as a share
of real GDP. Moreover, we introduce country fixed effects to control for other country-
specific unmeasured factors and year fixed effects to control for global macro factors.
(Insert Table 6 here)
After controlling for these factors, we focus on the GDP growth rate, an important
indicator of economic performance. We find that this growth rate is positively
correlated with the Doing Business Index score. The same pattern holds for the
regression on the growth rate of per capita income. Overall, we can conclude that a
country’s Doing Business Index score is closely correlated with a country’s growth rate
as well as its income level.
28
(Insert Table 7 here)
Next, we consider another set of indices evaluating government behavior. The
Worldwide Governance Indicators (WGI) by the World Bank report the quality of
governance according to performance in six sub-components, covering 215 countries
from 1996 to 2019. The WGI sub-indices we use include the voice and accountability
of the government, political stability and absence of violence, government effectiveness,
quality of regulation, quality of the rule of law, and control of corruption.
(Insert Figure 8 here)
We redo the regressions from above using each of the six indices to explain the growth
rates of GDP and of per capita GDP. Again, we find economic performance to be
positively correlated with the quality of government. The most robust indicator among
all sub-indices is that for government effectiveness.
5. Existing Fields of Study on Government and Markets
So far, we have demonstrated that government has become a prominent and influential
participant in the modern market economy. In addition, we have shown that the
behavior of a government is critical to economic performance. That is, the most
prominent historical episodes of rapid economic growth have been spurred by the
government’s active involvement in the development of the market economy.
Furthermore, across many countries in recent decades, more effective government is
statistically correlated with higher per capita income and faster economic growth.
In this section, we briefly discuss the fields of study within economics that examine
government and the economy, but argue that, taken together, they paint an incomplete
picture.
29
5.1 Public economics
Public economics, sometimes referred to narrowly as public finance, is a major area of
modern economic research. According to the Journal of Economic Literature (JEL),
public economics is one of the 20 primary categories of economic research, with eight
secondary subcategories ranging from the structure and scope of the government to
state and local governments and inter-governmental relations.
At the risk of over-generalizing, we would assert that most research in public economics
begins with the assumption that some consequences of a market economy are
undesirable, and that the government, as guardian of social welfare, can step in to
correct or mitigate these consequences. Therefore, research in public economics mainly
focuses on the following questions: How can government mitigate economic inequality
at the smallest cost to efficiency? How can government make up for incomplete
insurance markets? How can the government help bring about the most socially
desirable market equilibrium when there are multiple market equilibria? How can the
government deal with externalities? And, how should the government provide public
goods? Where public economics makes behavioral assumptions, it presumes that
government is acting to maximize social welfare.
In reality, of course, government often does not act to maximize social welfare. That
doesn’t mean that public economics is useless; it serves the valuable function of laying
out the possible policies that government could choose. However, it does not predict or
explain which policies government actually will choose. For example, it typically
ignores how the desire to get re-elected affects politicians’ behavior.
5.2 Public choice
By contrast, the field of public choice (pioneered by James Buchanan and Gordon
Tullock; see Buchannan and Tullock 2003) assumes that government is self-interested,
30
just like consumers and private entrepreneurs. Simply put, public choice is the
economic study of political decision-making, (Mueller, 1989). However, it focuses on
the behavior of government without paying much attention to the rich interactions
between government and the economy and how such interactions shape economic
outcomes.
Moreover public choice focuses mainly on the mature market economies of Western
countries. It largely ignores emerging market economies.
5.3 Industrial organization
Research in the field of industrial organization often studies market outcomes that are
not socially optimal. A common research approach is to first analyze the most socially
desirable outcome as a benchmark and then identify a key feature in the actual market
arrangement preventing the optimum from occurring. The analysis often goes on to
propose possible policies for government. If monopoly power is the problem, the
proposals often entail antitrust measures. If externalities are the issue, then government
regulation may be the solution. Whatever the recommended policy, the literature
typically presumes that government can implement it. Thus, like public economics,
industrial organization focuses on market failure and (unlike public choice) ignores the
possibility of government failure. What we are calling for, by contrast, is a new field
that studies the interaction between both kinds of failure.
5.4 Political economy
Political economy is the area of economic research that studies how strategic political
interactions influence economies function. In fact, political economy is the origin of
modern economics. In the 19th century, when Adam Smith followers analyzed
economic issues, they usually referred to their studies as explorations in political
economy. Nowadays, political economy focuses on how politics interacts with the

31
market economy, e.g., how politicians can win elections by promising particular
economic policies or how interest groups and lobbies can influence the economic
decisions of a legislature42 (Grossman and Helpman, 1994).
As valuable as modern political economy studies are, they generally neglect the fact
that many governmental actors are mostly shielded from politics. Specifically,
bureaucrats in government agencies are largely free from the influence of elections,
lobbies, and other political games. Moreover, these career government officials often
have more power over the economy than elected politicians. Therefore, we need to go
beyond political economy as it now stands to understand the effect of government on
the economy.
6. Government and Economics as an Emerging Field of Study
Now that we have argued that existing fields if economics do not adequately cover the
relationship between government and the economy, we wish to propose a new research
agenda to fill the gap. Below is a selection of topics for future study in the emerging
field of government and economics.
6.1 Positive Research Issues
Incentives of government officials
A government consists of government officials, and officials are people with their own
personal goals. Through theory, empirical research and case studies, we think it would
be valuable to understand how different ways of assembling these people to form a
government will affect that government’s economic decisions.
42 For a survey of political economy, as it stood 25 years ago, see Alt and Alesina (1996).
32
For people seeking elected office, one obvious personal goal is winning election and
(once in office) winning reelection. For bureaucrats, a common goal is internal
promotion. Most officials in China, face this latter sort of goal (as do bureaucrats in the
U.S., Europe, the U.K., and Japan). Indeed, it can be argued that competition for
promotion among local and regional officials had much to do with the Chinese success
story (Li and Zhou 2005 and Maskin, Qian, and Xu 2000).
Entry and exit of enterprises
The entry and exit of enterprises have a significant impact on the performance of a
market economy. For a country attempting to catch up with its competitors, rapid entry
of new enterprises is a key to success. And the same is true for the case of new industries.
Normally, entry depends not only on the behavior of investors and entrepreneurs, but
on government. Indeed, government usually has multiple instruments to speed up or
impede the entry process. For example, local government can offer tax breaks or land
to woo companies to their cities.
Exit of enterprises is also greatly affected by government decisions. In many cases,
governments tend to impede the exit of enterprises. Kornai (1980) named this
phenomenon the “soft budget constraint,” and there is a large literature on the topic.
Dewatripont and Maskin (1995) showed that the phenomenon results when the
government cannot commit to refrain from refinancing a state-owned firm once the
sunk costs, needed to set the firm up have already been incurred. That is, even though
the firm was a bad idea in the first place, the government may stick with it, even if it
can’t recoup its losses. There can also be other reasons for government to interfere in
the exit decision, e.g., protecting employment. Our main point here is merely to suggest
that examining government’s role in entry and exit while taking into account
government’s own peculiar objectives seems an important item for the research agenda.

33
Market Development and regulation of markets
Development and regulation of markets is another area in which government behavior
has a critical impact on an economy. A modern market economy grows when new
markets arise, such as online retail, mobile communications and music streaming.
Government has played a significant role in all three of these examples.
Many high-tech markets require prior government investment; the internet itself was
created by government. And the mobile telephone industry could not possibly have
been so successful had not government auctioned off large bands of radio frequencies.
In emerging market economies, government can greatly speed up development of new
markets. In China, for example, the central government helped kickstart the stock
market by setting down basic regulations and preventing fraud. Local Chinese
governments provided the physical infrastructure and the rulebook that made possible
the establishment of wholesale hubs for low-value commodities such as clothing,
buttons, shoelaces, and zippers. These hubs have since grown to global prominence.
Governments have multiple motives for establishing markets: revenue, employment,
political popularity, and so on. As for market regulation, the situation is even more
complicated. Sometimes government acts in the interests of consumers represented by
elected officials. Sometimes it acts to protect the interests of small enterprises against
larger rivals. In other cases, a government may act in response to international pressure.
Regardless, its behavior, we believe, it is worthy of deeper analysis.
Macroeconomic fluctuations and crises
All governments deal with macroeconomic fluctuations and major disruptions to the
economy such as the global financial crisis of 2008-9 and the spread of COVID-19 in

34
2020-21. 43 However, their strategies differ greatly. Some governments prefer to
stabilize the production side during an economic downturn, e.g., by subsidizing
enterprises to help them maintain employment. The Chinese and German governments
tend to follow this pattern, whereas other governments (e.g., that of the U.S.) prefer to
stabilize or stimulate the demand side by directly issuing bank checks to consumers.
There are yet other strategies, such as attempting to stabilize the financial sector and
asset prices.
Why do governments have such different macroeconomic approaches? The literature
usually assumes that a government will use the best instruments available to promote
social welfare. In reality, the motivations of different governments are quite distinct. In
the Chinese and German cases, governments seek to protect jobs and future tax bases
by preventing the premature exit of enterprises. In the U.S. case, the government
typically chooses to stabilize household consumption—a decision motivated by the
need for popular support during an economic downturn. Thus, standard
macroeconomic analysis is not enough. Analysis of government’s motivations is needed
too.
State-owned assets
State-owned assets are much more extensive than most people realize. The U.S.
government for example, owns, the U.S. Postal Service, Amtrak, and a vast amount of
federal land. In Germany, the government owns significant shares in many enterprises,
(including, for example, Volkswagen) giving them powerful voting rights. In China, the
government controls about 40% of all enterprises (contributing about 30% of GDP),
although this number has been rapidly decreasing. The Chinese government also holds
significant shares in commercial banks and in other financial assets.
43 On the topic of the post Covid recovery, Stiglitz (2021) makes a strong case why the government has an important role to play.

35
What are the reasons for and consequences of state ownership of assets? Not enough
research has been conducted on this topic, especially considering its high prevalence.
In particular, more needs to be learned about the implications of state-owned assets for
government budgets. State assets change government incentives and government
decisions. We need to understand exactly what these changes are.
Infrastructure investment and public good provision
Infrastructure investment and public good provision have been widely debated in many
countries. How they are driven by underlying government incentives is an understudied
subject. For example, some governments seem able to adopt a long-term perspective
and to commit to long-term investment projects even when these result in many years
of financial losses before paying off. Others are stuck with taking a short-term
perspective.
The way these investment projects are financed also varies a lot across countries. In
some countries, government officials are happy to use debt financing to borrow money
because they know the responsibility of paying off the debt will fall on their successors.
In other cases, officials may be overly cautious because they worry the country’s credit
rating will fall, damaging their own reputations. There is much to do to disentangle
these opposing forces.
Government and economic openness
To what extent an economy should be opened to world markets is one of government’s
most important decisions. Much research has already been devoted to understanding
the politics behind tariffs, (e.g., Grossman and Helpman, 1992). One recent stylized
fact that has emerged is that in countries with competitive new industries such as
telecommunications, internet-related businesses, and electric vehicles, government
seems to push more for economic openness. Further research is required in order to
36
determine whether this is indeed the case and, if so, to identify the factors behind the
correlation.
6.2 Normative Research Issues in Government and Economics
In addition to positive topics, there are also a number of big issues for normative
research in government and economics. Here the goal is to determine the best
institutional arrangements for government in order to achieve socially optimal
economic outcomes. Below, we list a few questions in the hope of stimulating further
study.
Optimal size and scope of government
Given a set of political and economic institutions, what is the optimal size and scope of
government? This is a highly stylized question. The answer provides a benchmark
against which reality can be measured. An oversized government will draw too many
resources from the private sector, detracting from efficiency. A government that is too
small may have insufficient capacity to adequately support a market economy.
Similarly for proper government scope.
Optimal structure of taxation
Research in government and economics should also yield insights into optimal taxation.
Traditional research in public economics typically assumes that government
motivations are independent of the form and level of taxes and therefore focuses on the
behavior of economic agents. In reality, however, a government’s behavior is shaped
by the nature of the of taxes it collects. For example, if government collects value-added
taxes from enterprises and can retain a significant proportion for its own operations, it
tends to be pro-business. This brings us to an important research question: Taking into
account the consequent behavior of government, what structure of taxation is the most

37
socially desirable overall?
Optimal structure of government and compensation for government officials
Here are a few of the leading questions that interest us:
What offices in government should be decided by election? Should there be term limits
for offices? What kind of positions should be assigned to long-term career officials?
How should career officials be evaluated and promoted in order to give them the most
effective incentives for good performance (a preliminary analysis can be found in
Maskin and Tirole 2004)?
What should be the relationship and discussion of responsibility between central and
local governments? Should local governments collect most tax revenue from their own
regions, or should taxes be collected by the central government and then transferred
back to regions? These alternative arrangements would presumably have different
effects on the behavior of local governments. For example, when local governments
collect most taxes on their own, they might have greater incentive to support the local
economy. When revenue is transferred from the central government, local officials
might be expected to be more supportive of a unified national market.
Finally, what is the best way for a government to reward officials for good performance?
Even if officials are not primarily interested in pecuniary benefits, we know that the
government sector finds attracting talented people harder when salaries and benefits are
low (Makridis, 2021). Moreover, underpaid government officials seem more vulnerable
to bribery and improper influence. Such considerations prompt the questions: Should
compensation of government officials be similar to that of comparable positions in the
business sector? 44 Should government officials be given fixed incomes or should
44 Garibaldi, Gomes, and Sopraseuth (2021) recently examined a related issue why government hires disportionately highly educated people.
38
compensation be tied to economic performance? Answers to these questions are not
only of academic interest but of practical value.
7. Concluding Remark
We hope that this paper has convincingly made the case that government plays a critical
role in a modern economy and that the interaction between government and the
economy deserves wider and deeper study. We look forward to seeing how the emerging
field of government and economies develops.

39
References
[1] Adelman, I. (1969). Practical approaches to development planning: Korea's second five-
year plan.
[2] Advisory Commission on Intergovernmental Relations (Estados Unidos). (1962). State
constitutional and statutory restrictions on local government debt. Advisory Commission
on Intergovernmental Relations.
[3] Alt, J. E., & Alesina, A. (1996). Political economy: an overview. In A new handbook of
political science (pp. 645-674), edited by RE Goodin and HD Klingemann. Oxford UK:
Oxford University Press.
[4] Andō, Y (1979). An overview of modern Japanese economic history. Tōkyō: University of
Tōkyō Press.
[5] Atkinson, A. B., & Stiglitz, J. E. (2015). Lectures on public economics. Princeton
University Press.
[6] Bernhofen, D. M., & Brown, J. C. (2005). An empirical assessment of the comparative
advantage gains from trade: evidence from Japan. American Economic Review, 95(1),
208-225.
[7] Billings, R. D. (2012). The homestead act, pacific railroad act and Morrill act. N. Ky. L.
Rev., 39, 699.
[8] Bird, R. M. (1977). Land taxation and economic development: the model of Meiji Japan.
The Journal of Development Studies, 13(2), 162-174.
[9] Buchanan, J. M., & Tullock, G. (2003). What is public choice theory?. Rationalizing
capitalist democracy: The cold war origins of rational choice liberalism, 133.
[10] Chandler Jr, A. D. (1954). Patterns of American railroad finance, 1830-50. The Business
History Review, 248-263.
[11] Clapham, J. H. (1955). The economic development of France and Germany, 1815-1914.
CUP Archive.
[12] Dewatripont, M., & Maskin, E. (1995). Credit and efficiency in centralized and
decentralized economies. Review of Economic Studies, 62(4), 541-555.
[13] Drazen, A. (2018). Political economy in macroeconomics. Princeton University Press.
40
[14] Engerman, S. L., & Gallman, R. E. (Eds.). (1996). The Cambridge economic history of the
United States. Cambridge University Press.
[15] Garibaldi, P., Gomes, P., & Sopraseuth, T. (2021). Public employment redux. Journal of
Government and Economics, 1(1), in press.
[16] Goldsmith, R. W. (1982). The national balance sheet of the United States, 1953-1980. The
University of Chicago Press.
[17] Goldsmith, R. W., & Lipsey, R. E. (1963). Studies in the national balance sheet of the
United States. Princeton University Press.
[18] Goodrich, C. (1960). Government promotion of American canals and railroads 1800-1890.
Columbia University Press.
[19] Grossman, G. M., & Helpman, E. (1994). Protection for sale. American Economic Review.
84(4), 833-850.
[20] Habakkuk, H. J. (1965). The Cambridge economic history of Europe (p. III). M. M. Postan
(Ed.). The University Press.
[21] Heo, U., Jeon, H., Kim, H., & Kim, O. (2008). The political economy of South Korea:
economic growth, democratization, and financial crisis. Maryland Series in Contemporary
Asian Studies, 2008(2), 1.
[22] Hoffmann, W. G. (2013). Das Wachstum der deutschen Wirtschaft seit der Mitte des 19.
Jahrhunderts. Springer-Verlag.
[23] Hibbard, B. H. (1924). A history of the public land policies (Vol. 5). Macmillan.
[24] Ike, N. (1955). The pattern of railway development in Japan. The Far Eastern Quarterly,
14(2), 217-229.
[25] Jackson, P. M. (Ed.). (1992). Current issues in public sector economics. Macmillan
International Higher Education.
[26] Jensen, E. J., & Waldman, D. E. (2019). Industrial organization: Theory and practice.
Routledge.
[27] Kiesewetter, H. (1996). Industrielle revolution in Deutschland: 1815-1914. 3. Auflage
1996. Suhrkamp.
[28] Kim, K. S. (1991). The Korean miracle (1962-1980) revisited: myths and realities in
strategy and development. Helen Kellogg Institute for International Studies, University of

41
Notre Dame.
[29] Koch, H. W. (2014). A history of Prussia. Routledge.
[30] Kornai, J. (1980). Economics of shortage. v. AB.
[31] Kuznets, P. W. (1988). An east Asian model of economic development: Japan, Taiwan, and
South Korea. Economic development and cultural change, 36(S3), S11-S43.
[32] Lee, C. (2011). The growth of public expenditure in the United Kingdom from 1870 to
2005. Springer.
[33] Li, D. D. (2021). Economic lessons from China’s forty years of reform and opening-up.
Springer Nature.
[34] Li, D. D., & Liang, M. (1998). Causes of the soft budget constraint: Evidence on three
explanations. Journal of Comparative Economics, 26(1), 104-116.
[35] Li, H., & Zhou, L. A. (2005). Political turnover and economic performance: the incentive
role of personnel control in China. Journal of public economics, 89(9-10), 1743-1762.
[36] Li, Y., Zhang, X. J. & Chang, X. (2018), China’s national balance sheet 2018, China Social
Sciences Press (in Chinese).
[37] Lockwood, W. W. (2015). Economic development of Japan (Vol. 2161). Princeton
University Press.
[38] Maddison, A. (2007). Contours of the world economy 1-2030 AD: Essays in macro-
economic history. Oxford University Press.
[39] Maddison, A. (2003). Development centre studies the world economy historical statistics:
historical statistics. OECD publishing.
[40] Makridis, C. A. (2021). (Why) Is there a public/private pay gap?. Journal of Government
and Economics, 1(1), in press.
[41] Maskin, E., Qian, Y., & Xu, C. (2000). Incentives, Information, and Organizational Form.
The Review of Economic Studies, 67(2), 359-378.
[42] Maskin, E. & Tirole, J. (2004). “The Politician and the Judge: Accountability in
Government,” American Economic Review, 94(4):1034-1054.
[43] Mauro, M. P., Romeu, R., Binder, M. A. J., & Zaman, M. A. (2013). A modern history of
fiscal prudence and profligacy (No. 13-15). International Monetary Fund.
[44] Mosk, C. (2004). Japanese industrialization and economic growth. Economic History
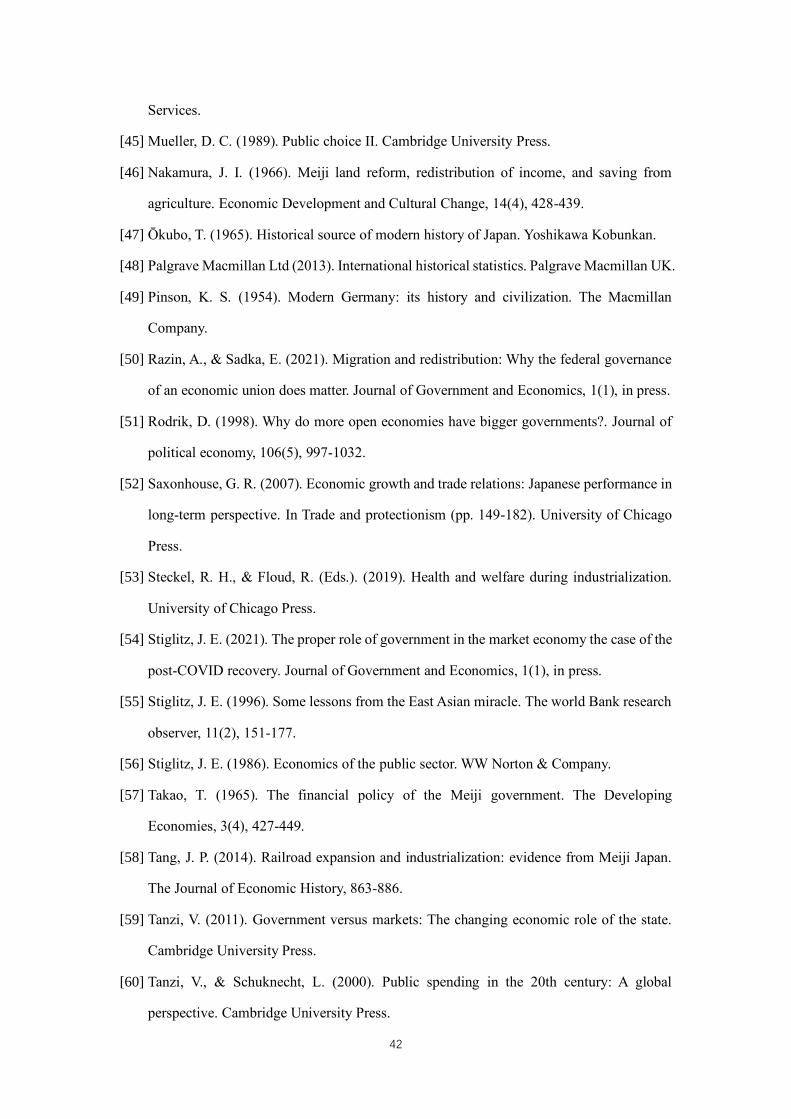
42
Services.
[45] Mueller, D. C. (1989). Public choice II. Cambridge University Press.
[46] Nakamura, J. I. (1966). Meiji land reform, redistribution of income, and saving from
agriculture. Economic Development and Cultural Change, 14(4), 428-439.
[47] Ōkubo, T. (1965). Historical source of modern history of Japan. Yoshikawa Kobunkan.
[48] Palgrave Macmillan Ltd (2013). International historical statistics. Palgrave Macmillan UK.
[49] Pinson, K. S. (1954). Modern Germany: its history and civilization. The Macmillan
Company.
[50] Razin, A., & Sadka, E. (2021). Migration and redistribution: Why the federal governance
of an economic union does matter. Journal of Government and Economics, 1(1), in press.
[51] Rodrik, D. (1998). Why do more open economies have bigger governments?. Journal of
political economy, 106(5), 997-1032.
[52] Saxonhouse, G. R. (2007). Economic growth and trade relations: Japanese performance in
long-term perspective. In Trade and protectionism (pp. 149-182). University of Chicago
Press.
[53] Steckel, R. H., & Floud, R. (Eds.). (2019). Health and welfare during industrialization.
University of Chicago Press.
[54] Stiglitz, J. E. (2021). The proper role of government in the market economy the case of the
post-COVID recovery. Journal of Government and Economics, 1(1), in press.
[55] Stiglitz, J. E. (1996). Some lessons from the East Asian miracle. The world Bank research
observer, 11(2), 151-177.
[56] Stiglitz, J. E. (1986). Economics of the public sector. WW Norton & Company.
[57] Takao, T. (1965). The financial policy of the Meiji government. The Developing
Economies, 3(4), 427-449.
[58] Tang, J. P. (2014). Railroad expansion and industrialization: evidence from Meiji Japan.
The Journal of Economic History, 863-886.
[59] Tanzi, V. (2011). Government versus markets: The changing economic role of the state.
Cambridge University Press.
[60] Tanzi, V., & Schuknecht, L. (2000). Public spending in the 20th century: A global
perspective. Cambridge University Press.
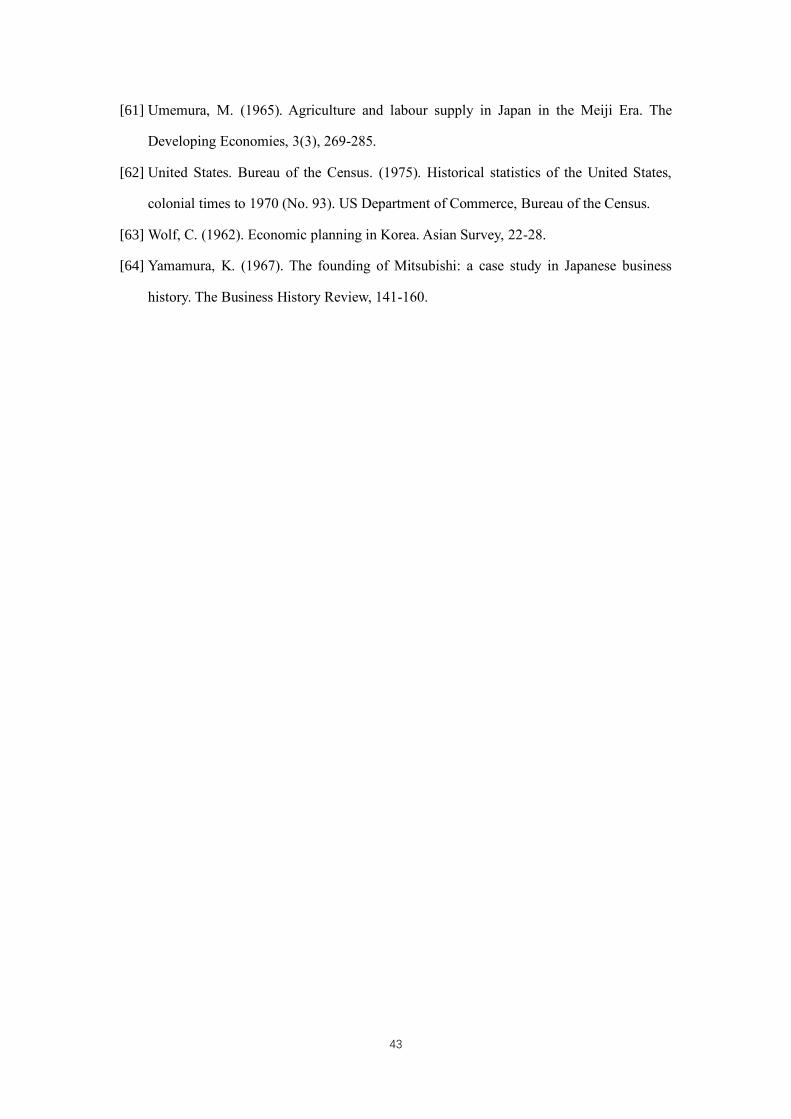
43
[61] Umemura, M. (1965). Agriculture and labour supply in Japan in the Meiji Era. The
Developing Economies, 3(3), 269-285.
[62] United States. Bureau of the Census. (1975). Historical statistics of the United States,
colonial times to 1970 (No. 93). US Department of Commerce, Bureau of the Census.
[63] Wolf, C. (1962). Economic planning in Korea. Asian Survey, 22-28.
[64] Yamamura, K. (1967). The founding of Mitsubishi: a case study in Japanese business
history. The Business History Review, 141-160.

44
Figures and Tables
Figure 1: General Government Expenditure to GDP Ratio (%): OECD Countries
Note: General government includes central government and local governments.
Figure 2: The Ratio of General Government Expenditure to GDP (%): Emerging
Markets
Note: General government includes central government and local governments.
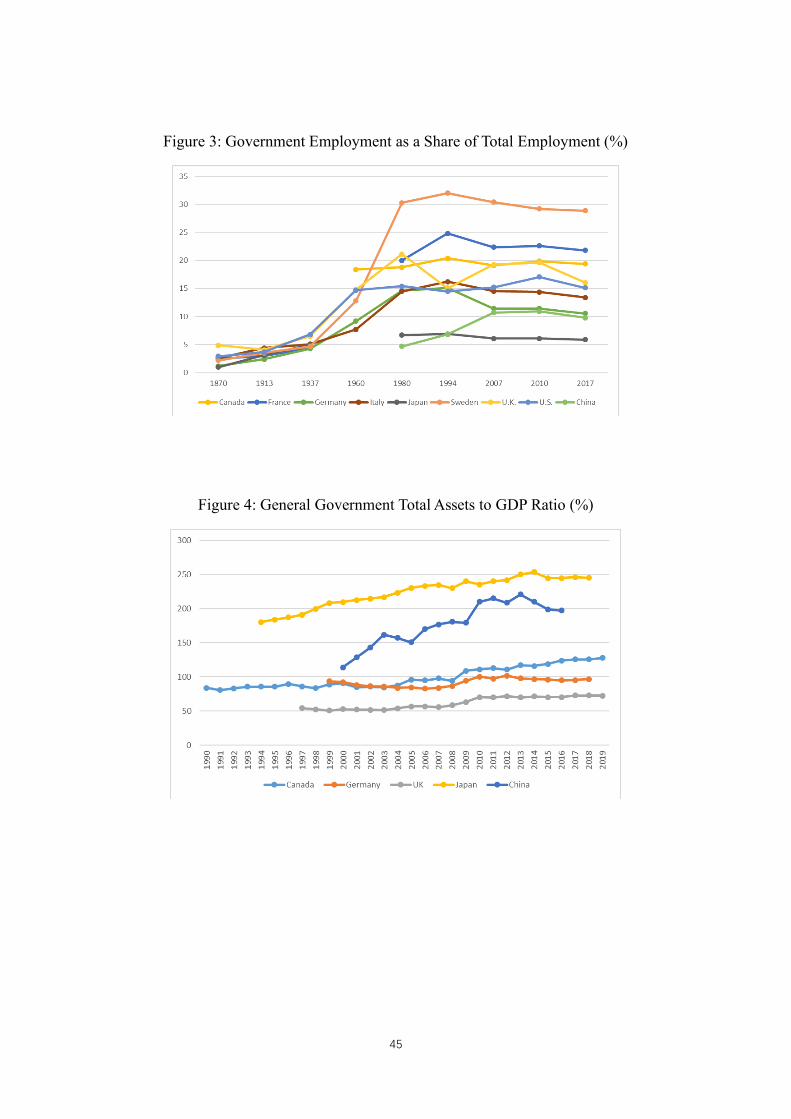
45
Figure 3: Government Employment as a Share of Total Employment (%)
Figure 4: General Government Total Assets to GDP Ratio (%)
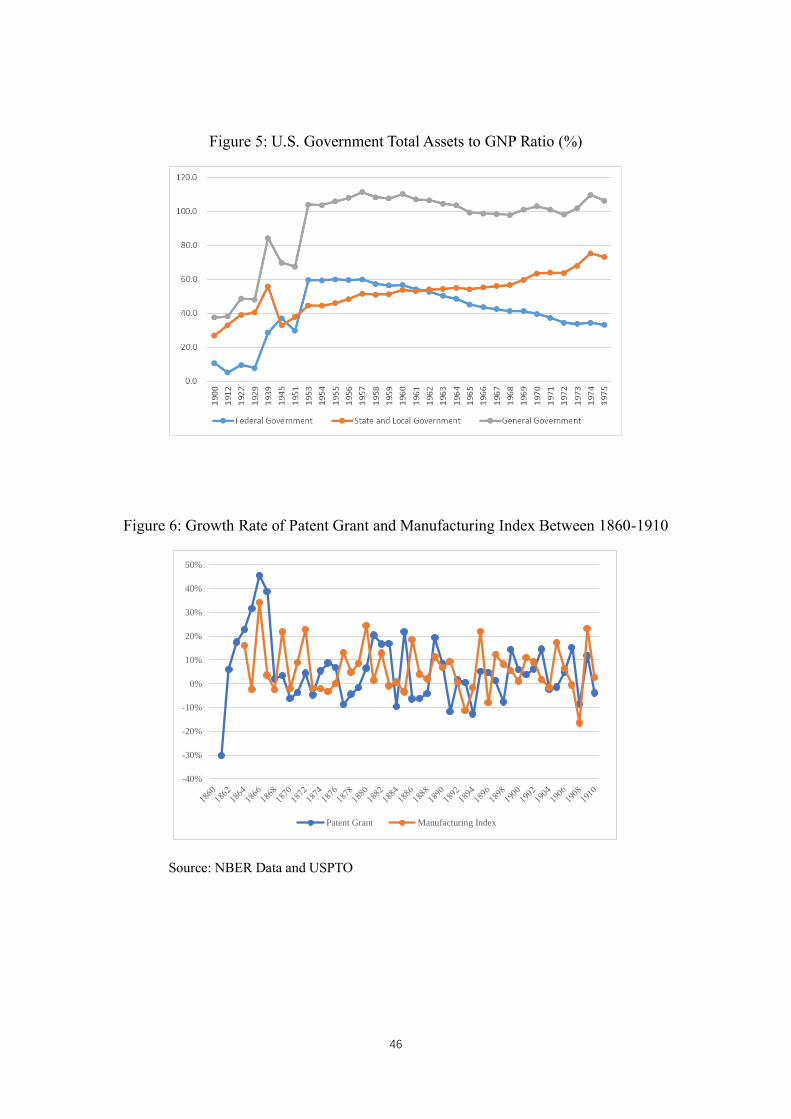
46
Figure 5: U.S. Government Total Assets to GNP Ratio (%)
Figure 6: Growth Rate of Patent Grant and Manufacturing Index Between 1860-1910
Source: NBER Data and USPTO
-40%
-30%
-20%
-10%
0%
10%
20%
30%
40%
50%
Patent Grant Manufacturing Index
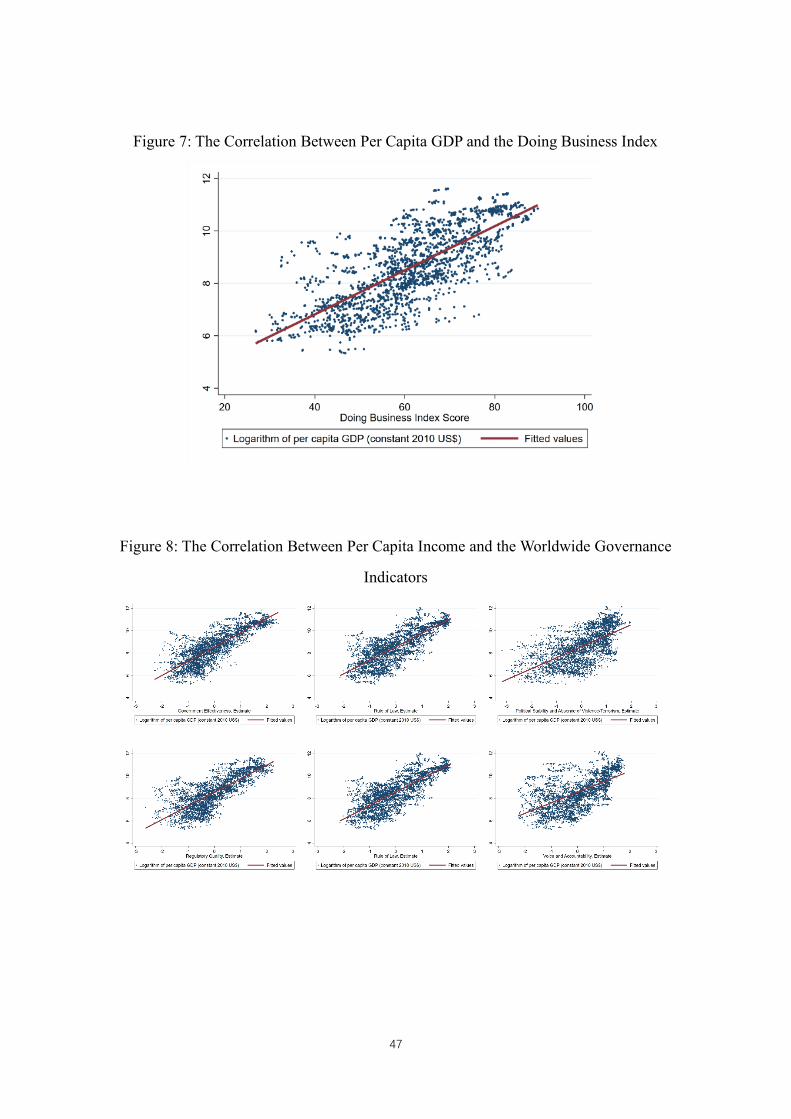
47
Figure 7: The Correlation Between Per Capita GDP and the Doing Business Index
Figure 8: The Correlation Between Per Capita Income and the Worldwide Governance
Indicators
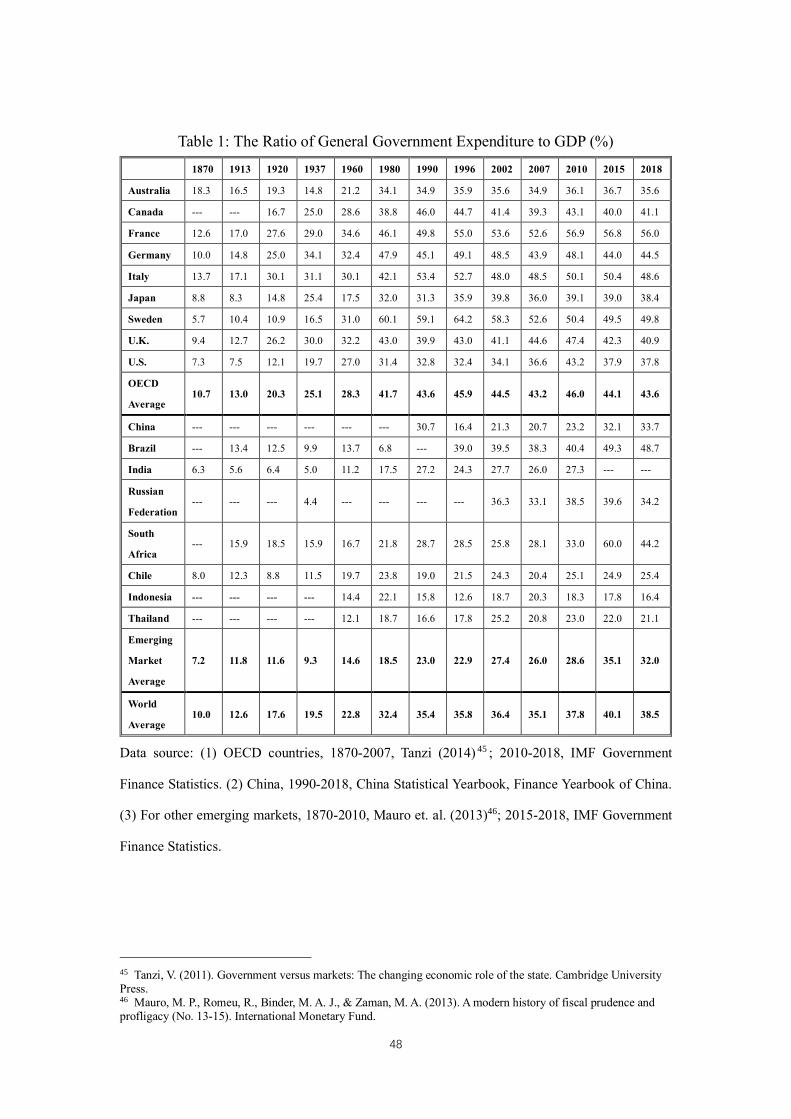
48
Table 1: The Ratio of General Government Expenditure to GDP (%)
1870 1913 1920 1937 1960 1980 1990 1996 2002 2007 2010 2015 2018
Australia 18.3 16.5 19.3 14.8 21.2 34.1 34.9 35.9 35.6 34.9 36.1 36.7 35.6
Canada --- --- 16.7 25.0 28.6 38.8 46.0 44.7 41.4 39.3 43.1 40.0 41.1
France 12.6 17.0 27.6 29.0 34.6 46.1 49.8 55.0 53.6 52.6 56.9 56.8 56.0
Germany 10.0 14.8 25.0 34.1 32.4 47.9 45.1 49.1 48.5 43.9 48.1 44.0 44.5
Italy 13.7 17.1 30.1 31.1 30.1 42.1 53.4 52.7 48.0 48.5 50.1 50.4 48.6
Japan 8.8 8.3 14.8 25.4 17.5 32.0 31.3 35.9 39.8 36.0 39.1 39.0 38.4
Sweden 5.7 10.4 10.9 16.5 31.0 60.1 59.1 64.2 58.3 52.6 50.4 49.5 49.8
U.K. 9.4 12.7 26.2 30.0 32.2 43.0 39.9 43.0 41.1 44.6 47.4 42.3 40.9
U.S. 7.3 7.5 12.1 19.7 27.0 31.4 32.8 32.4 34.1 36.6 43.2 37.9 37.8
OECD
Average 10.7 13.0 20.3 25.1 28.3 41.7 43.6 45.9 44.5 43.2 46.0 44.1 43.6
China --- --- --- --- --- --- 30.7 16.4 21.3 20.7 23.2 32.1 33.7
Brazil --- 13.4 12.5 9.9 13.7 6.8 --- 39.0 39.5 38.3 40.4 49.3 48.7
India 6.3 5.6 6.4 5.0 11.2 17.5 27.2 24.3 27.7 26.0 27.3 --- ---
Russian
Federation --- --- --- 4.4 --- --- --- --- 36.3 33.1 38.5 39.6 34.2
South
Africa --- 15.9 18.5 15.9 16.7 21.8 28.7 28.5 25.8 28.1 33.0 60.0 44.2
Chile 8.0 12.3 8.8 11.5 19.7 23.8 19.0 21.5 24.3 20.4 25.1 24.9 25.4
Indonesia --- --- --- --- 14.4 22.1 15.8 12.6 18.7 20.3 18.3 17.8 16.4
Thailand --- --- --- --- 12.1 18.7 16.6 17.8 25.2 20.8 23.0 22.0 21.1
Emerging
Market
Average
7.2 11.8 11.6 9.3 14.6 18.5 23.0 22.9 27.4 26.0 28.6 35.1 32.0
World
Average 10.0 12.6 17.6 19.5 22.8 32.4 35.4 35.8 36.4 35.1 37.8 40.1 38.5
Data source: (1) OECD countries, 1870-2007, Tanzi (2014) 45 ; 2010-2018, IMF Government
Finance Statistics. (2) China, 1990-2018, China Statistical Yearbook, Finance Yearbook of China.
(3) For other emerging markets, 1870-2010, Mauro et. al. (2013)46; 2015-2018, IMF Government
Finance Statistics.
45 Tanzi, V. (2011). Government versus markets: The changing economic role of the state. Cambridge University Press. 46 Mauro, M. P., Romeu, R., Binder, M. A. J., & Zaman, M. A. (2013). A modern history of fiscal prudence and profligacy (No. 13-15). International Monetary Fund.
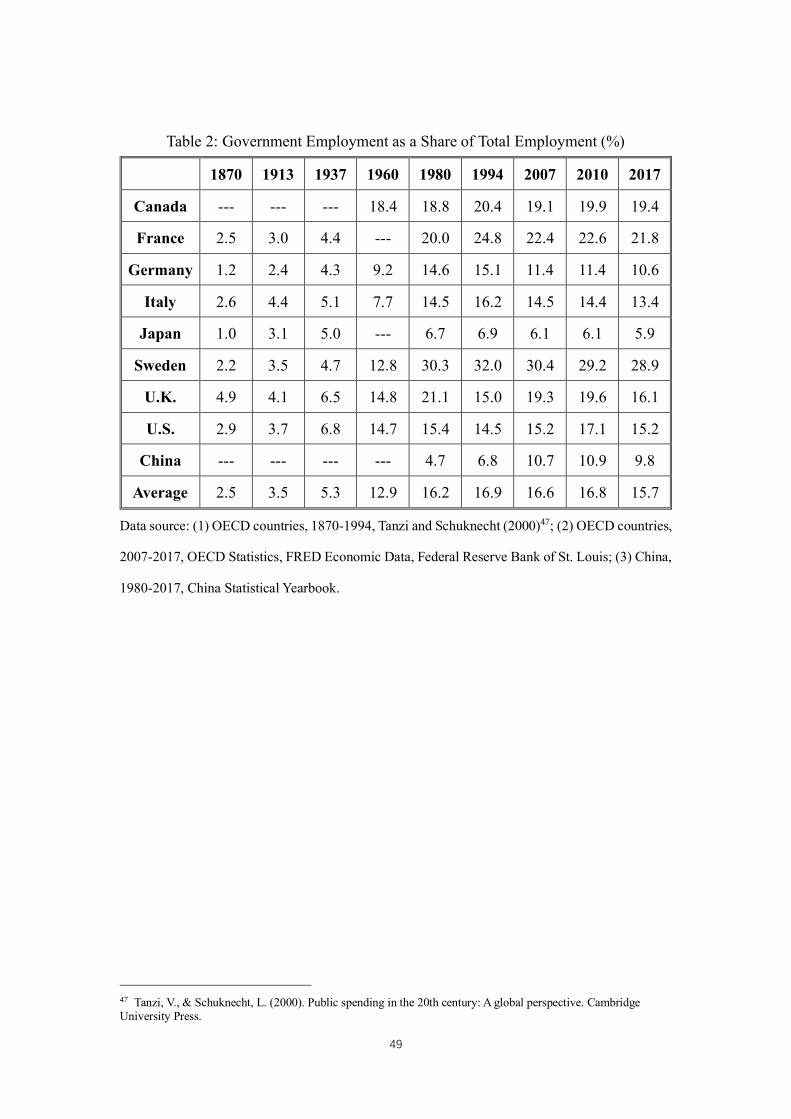
49
Table 2: Government Employment as a Share of Total Employment (%)
1870 1913 1937 1960 1980 1994 2007 2010 2017
Canada --- --- --- 18.4 18.8 20.4 19.1 19.9 19.4
France 2.5 3.0 4.4 --- 20.0 24.8 22.4 22.6 21.8
Germany 1.2 2.4 4.3 9.2 14.6 15.1 11.4 11.4 10.6
Italy 2.6 4.4 5.1 7.7 14.5 16.2 14.5 14.4 13.4
Japan 1.0 3.1 5.0 --- 6.7 6.9 6.1 6.1 5.9
Sweden 2.2 3.5 4.7 12.8 30.3 32.0 30.4 29.2 28.9
U.K. 4.9 4.1 6.5 14.8 21.1 15.0 19.3 19.6 16.1
U.S. 2.9 3.7 6.8 14.7 15.4 14.5 15.2 17.1 15.2
China --- --- --- --- 4.7 6.8 10.7 10.9 9.8
Average 2.5 3.5 5.3 12.9 16.2 16.9 16.6 16.8 15.7
Data source: (1) OECD countries, 1870-1994, Tanzi and Schuknecht (2000)47; (2) OECD countries,
2007-2017, OECD Statistics, FRED Economic Data, Federal Reserve Bank of St. Louis; (3) China,
1980-2017, China Statistical Yearbook.
47 Tanzi, V., & Schuknecht, L. (2000). Public spending in the 20th century: A global perspective. Cambridge University Press.
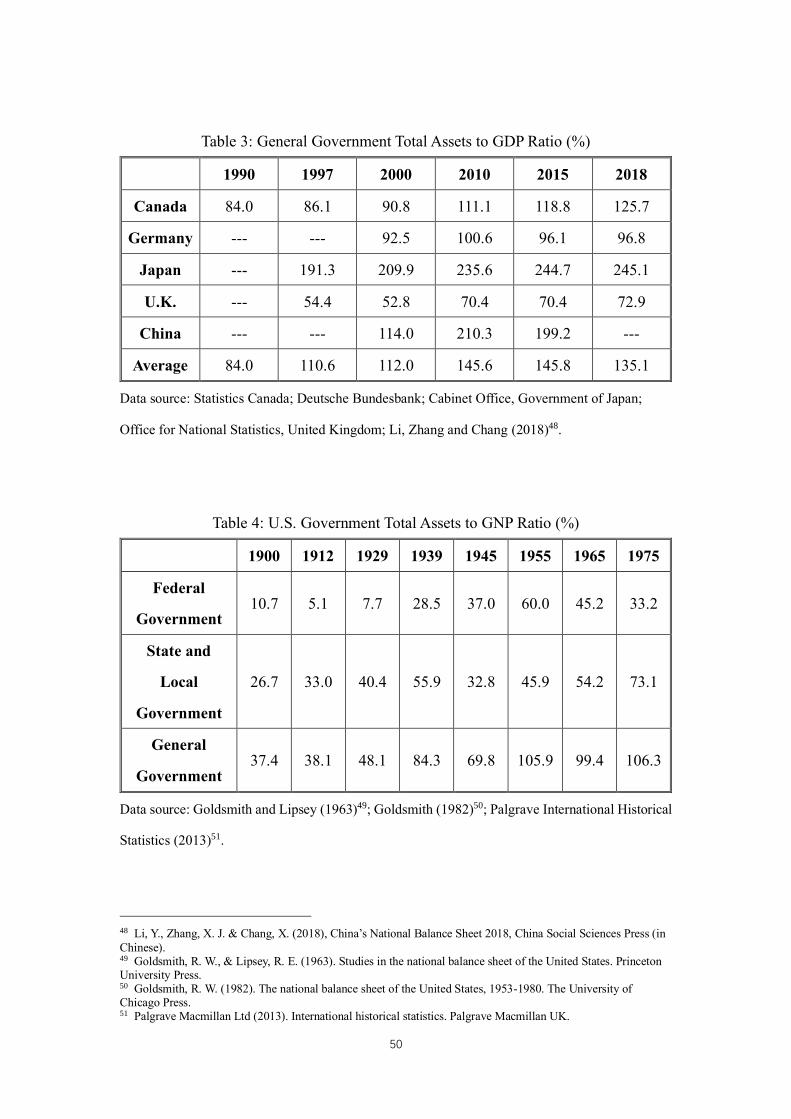
50
Table 3: General Government Total Assets to GDP Ratio (%)
1990 1997 2000 2010 2015 2018
Canada 84.0 86.1 90.8 111.1 118.8 125.7
Germany --- --- 92.5 100.6 96.1 96.8
Japan --- 191.3 209.9 235.6 244.7 245.1
U.K. --- 54.4 52.8 70.4 70.4 72.9
China --- --- 114.0 210.3 199.2 ---
Average 84.0 110.6 112.0 145.6 145.8 135.1
Data source: Statistics Canada; Deutsche Bundesbank; Cabinet Office, Government of Japan;
Office for National Statistics, United Kingdom; Li, Zhang and Chang (2018)48.
Table 4: U.S. Government Total Assets to GNP Ratio (%)
1900 1912 1929 1939 1945 1955 1965 1975
Federal
Government 10.7 5.1 7.7 28.5 37.0 60.0 45.2 33.2
State and
Local
Government
26.7 33.0 40.4 55.9 32.8 45.9 54.2 73.1
General
Government 37.4 38.1 48.1 84.3 69.8 105.9 99.4 106.3
Data source: Goldsmith and Lipsey (1963)49; Goldsmith (1982)50; Palgrave International Historical
Statistics (2013)51.
48 Li, Y., Zhang, X. J. & Chang, X. (2018), China’s National Balance Sheet 2018, China Social Sciences Press (in
Chinese). 49 Goldsmith, R. W., & Lipsey, R. E. (1963). Studies in the national balance sheet of the United States. Princeton University Press. 50 Goldsmith, R. W. (1982). The national balance sheet of the United States, 1953-1980. The University of Chicago Press. 51 Palgrave Macmillan Ltd (2013). International historical statistics. Palgrave Macmillan UK.
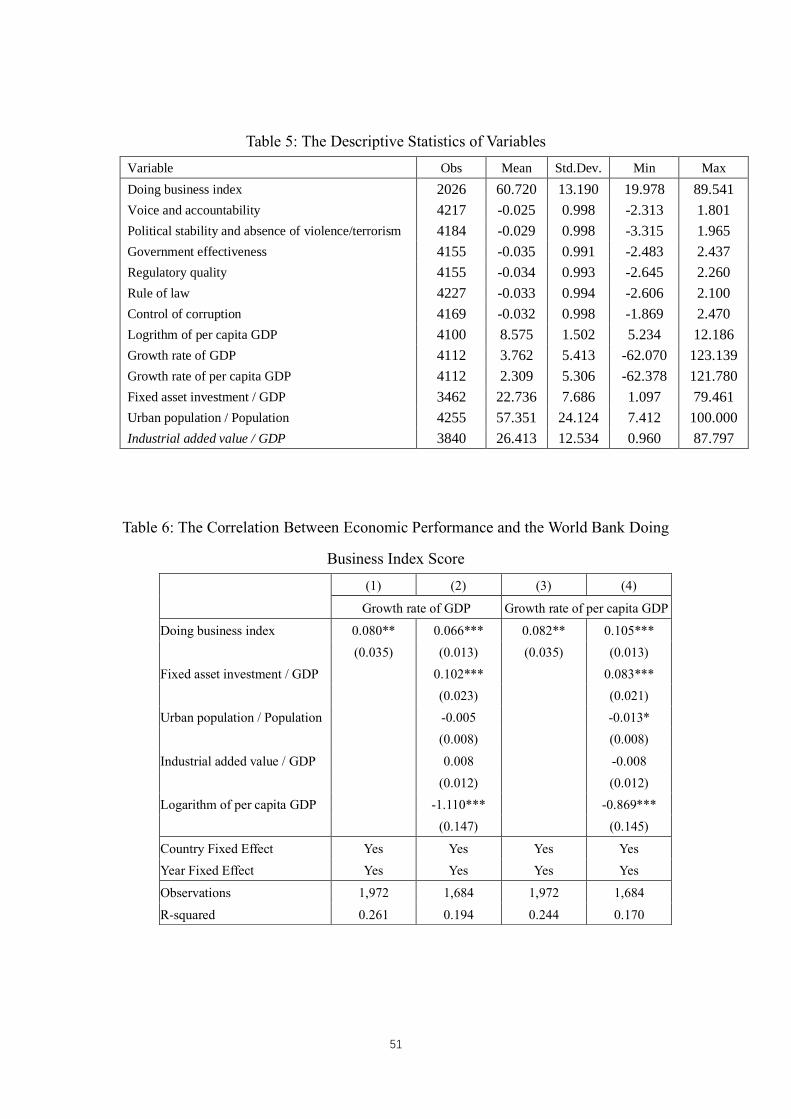
51
Table 5: The Descriptive Statistics of Variables
Variable Obs Mean Std.Dev. Min Max
Doing business index 2026 60.720 13.190 19.978 89.541
Voice and accountability 4217 -0.025 0.998 -2.313 1.801
Political stability and absence of violence/terrorism 4184 -0.029 0.998 -3.315 1.965
Government effectiveness 4155 -0.035 0.991 -2.483 2.437
Regulatory quality 4155 -0.034 0.993 -2.645 2.260
Rule of law 4227 -0.033 0.994 -2.606 2.100
Control of corruption 4169 -0.032 0.998 -1.869 2.470
Logrithm of per capita GDP 4100 8.575 1.502 5.234 12.186
Growth rate of GDP 4112 3.762 5.413 -62.070 123.139
Growth rate of per capita GDP 4112 2.309 5.306 -62.378 121.780
Fixed asset investment / GDP 3462 22.736 7.686 1.097 79.461
Urban population / Population 4255 57.351 24.124 7.412 100.000
Industrial added value / GDP 3840 26.413 12.534 0.960 87.797
Table 6: The Correlation Between Economic Performance and the World Bank Doing
Business Index Score
(1) (2) (3) (4)
Growth rate of GDP Growth rate of per capita GDP
Doing business index 0.080** 0.066*** 0.082** 0.105***
(0.035) (0.013) (0.035) (0.013)
Fixed asset investment / GDP 0.102*** 0.083***
(0.023) (0.021)
Urban population / Population -0.005 -0.013*
(0.008) (0.008)
Industrial added value / GDP 0.008 -0.008
(0.012) (0.012)
Logarithm of per capita GDP -1.110*** -0.869***
(0.147) (0.145)
Country Fixed Effect Yes Yes Yes Yes
Year Fixed Effect Yes Yes Yes Yes
Observations 1,972 1,684 1,972 1,684
R-squared 0.261 0.194 0.244 0.170
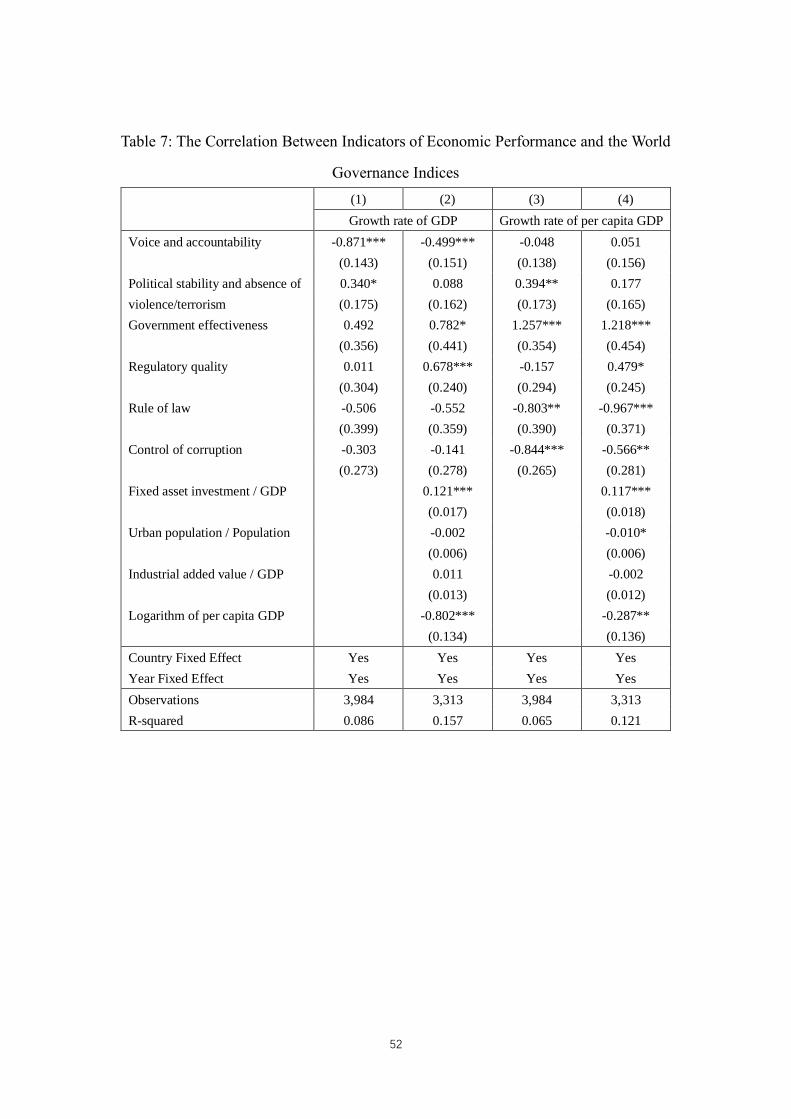
52
Table 7: The Correlation Between Indicators of Economic Performance and the World
Governance Indices
(1) (2) (3) (4)
Growth rate of GDP Growth rate of per capita GDP
Voice and accountability -0.871*** -0.499*** -0.048 0.051
(0.143) (0.151) (0.138) (0.156)
Political stability and absence of
violence/terrorism
0.340* 0.088 0.394** 0.177
(0.175) (0.162) (0.173) (0.165)
Government effectiveness 0.492 0.782* 1.257*** 1.218***
(0.356) (0.441) (0.354) (0.454)
Regulatory quality 0.011 0.678*** -0.157 0.479*
(0.304) (0.240) (0.294) (0.245)
Rule of law -0.506 -0.552 -0.803** -0.967***
(0.399) (0.359) (0.390) (0.371)
Control of corruption -0.303 -0.141 -0.844*** -0.566**
(0.273) (0.278) (0.265) (0.281)
Fixed asset investment / GDP 0.121*** 0.117***
(0.017) (0.018)
Urban population / Population -0.002 -0.010*
(0.006) (0.006)
Industrial added value / GDP 0.011 -0.002
(0.013) (0.012)
Logarithm of per capita GDP -0.802*** -0.287**
(0.134) (0.136)
Country Fixed Effect Yes Yes Yes Yes
Year Fixed Effect Yes Yes Yes Yes
Observations 3,984 3,313 3,984 3,313
R-squared 0.086 0.157 0.065 0.121