governance, social development, conflict and humanitarian
TRANSCRIPT

Governance, Social Development, Conflict and Humanitarian PEAKS Consortium led by Coffey International Development
PEFA Report Public Expenditure and Financial Accountability (PEFA) Assessment in Sierra Leone Central Government Systems, 2010-2012

PEFA Report v. 3.0
Commissioned by: Department for International Development (DFID)
Public Expenditure and Financial Accountability (PEFA) Assessment in Sierra Leone Central Government Systems, 2010-2012
Contract Number: PO 40076050
Implemented by:
REPIM
May 2014
Coffey International Development Ltd
The Malthouse 1 Northfield Road Reading Berkshire RG1 8AH United Kingdom
T (+44) (0) 1189 566 066 F (+44) (0) 1189 576 066 www.coffey.com
Registered Office: 1 Northfield Road Reading Berkshire RG1 8AH United Kingdom
Registered in England No. 3799145 Vat Number: GB 724 5309 45
This document has been approved for submission by Coffey’s Project
Director, based on a review of satisfactory adherence to our policies on:
• Quality management
• HSSE and risk management
• Financial management and Value for Money (VfM)
• Personnel recruitment and management
• Performance Management and Monitoring and Evaluation
(M&E)
Principal: Jeremy Swainson

Disclaimer
This report is provided on the basis that it is for the use of DFID only.
Coffey International Development Ltd will not be bound to discuss,
explain or reply to queries raised by any agency other than the intended
recipients of this report. Coffey International Development Ltd disclaims
all liability to any third party who may place reliance on this report and
therefore does not assume responsibility for any loss or damage
suffered by any such third party in reliance thereon.

i
Public Expenditure and Financial Accountability (PEFA)
Assessment in Sierra Leone
Central Government Systems, 2010-2012
Public Financial Management
Performance Assessment Report
REPIM
For Coffey Ltd.
May 2014

ii
CURRENCY EQUIVALENTS
(Exchange Rate Effective as of February 18th, 2014)
Currency Unit = Leone
US$1.00= Le 4,338
FISCAL YEAR
January 1 – December 31
Preface
This Public Financial Management (PFM) Performance Assessment Report is based on the PEFA
PFM Performance Measurement Framework (revised 2011), which includes a performance rating on
31 indicators covering the entire PFM cycle in the central government of Sierra Leone, and assesses
impact on budget goals.
This work was jointly led by the Multi Donor Budget Support Partners comprising UK Department
for International Development, World Bank, European Commission and African Development Bank
and the Government of Sierra Leone.
A team of consultants was contracted to carry out the detailed technical work for the study.1 The team
assessed the current situation by reviewing background documents, collecting necessary data and
interviewing key Government and development partner officials during January and February 2014.
We are grateful to the many officials of the Government of Sierra Leone who interacted with the
team, provided the information needed and assisted in organization of the study, as well as the
representatives of the Sierra Leonean private sector and civil society.
This final report draws on comments from GoSL, DFID, AfDB and the PEFA Secretariat on the
earlier draft version of this report. We are grateful to the various reviewers for the useful comments
and suggestions.
1 Paul Harnett (Team Leader), Sharon Hanson Cooper and Buffy Bailor (national consultant) of REPIM
(www.repim.eu) on behalf of Coffey Ltd.

iii
Table of Contents Preface ....................................................................................................................................... ii
Table of Contents .................................................................................................................... iii
Glossary ................................................................................................................................... iv
Overview of the Indicator Set ................................................................................................ vi
Summary Assessment ........................................................................................................... viii
A. Background...................................................................................................................... viii
B. Integrated Assessment of PFM Performance ............................................................... viii
C. Assessment of the Impact of PFM Weaknesses ............................................................. xii
D. Prospects for Reform Planning and Implementation .................................................. xiii
E. Institutional Factors Supporting Reform Planning and Implementation .................. xiv
F. Key Changes from 2010 to 2014 ...................................................................................... xv
1. Introduction ......................................................................................................................... 1
2. Country Background Information .................................................................................... 2
2.1. Description of the Country Economic Situation ........................................................... 2
2.2. Description of Budgetary Outcomes............................................................................... 5
2.3. Legal and Institutional Framework for PFM ................................................................ 7
3. Assessment of the PFM Systems, Processes and Institutions ........................................ 10
3.1. Budget credibility ........................................................................................................... 10
3.2. Comprehensiveness and Transparency ....................................................................... 21
3.3. Policy-based budgeting .................................................................................................. 29
3.4. Predictability and control in budget execution ............................................................ 33
3.5. Accounting, recording and reporting ........................................................................... 61
3.6. External scrutiny and audit .......................................................................................... 71
3.7. Donor related practices ................................................................................................. 80
4. Government Reform Process ........................................................................................... 85
4.1. Recent and on-going reform measures ......................................................................... 85
Annex 1. Persons met for PEFA 2014 ................................................................................. 91
Annex 2. Documents Consulted ........................................................................................... 93

iv
Glossary
AfDB African Development Bank
AG Auditor General
AGA Autonomous Government Agency
AGD Accountant General’s Department
ASSL Audit Service Sierra Leone
ASYCUDA Automated System for Customs Data
BB Budget Bureau
BCC Budget Call Circular
BoSL Bank of Sierra Leone (Central Bank)
CG Central Government
COFOG Classification of the Functions of Government
DAC Development Assistance Committee
DACO Development Assistance Coordination Office, MoFED
DAD Development Assistance Database
DBOC District Budget Oversight Committee
DFID Department for International Development
DSA Debt Sustainability Analysis
EC European Commission
EITI Extractive Industries Transparency Initiative
EPRU Economic Policy Research Unit
EU European Union
GBAA Government Budget and Accountability Act
GBS General Budget Support
GFS Government Financial Statistics
GoSL Government of Sierra Leone
GST Goods and Services Tax
HRMO Human Resource Management Office
IAD Internal Audit Division
IFMIS Integrated Financial Management Information System
IMF International Monetary Fund
INTOSAI International Organization of Supreme Audit Institutions
IPFMRP Integrated Public Financial Management Reform Project
IPRP Independent Procurement Review Panel
IPSAS International Public Sector Accounting Standards
LC Local Council
Le Leone (national currency)
LG Local Government

v
LGA Local Government Act
LGFD Local Government Finance Department
MDAs Ministries, Departments and Agencies
MDBS Multi-Donor Budget Support
MoFED Ministry of Finance and Economic Development
MOU Memorandum of Understanding
MPD Multilateral Projects Division
MTDS Medium Term Debt Management Strategy
MTEF Medium Term Expenditure Framework
NaSCA National Commission for Social Action
NASSIT National Social Security Insurance Trust
NCP National Commission for Privatisation
NGO Non-Governmental Organisation
NPPA National Public Procurement Agency
NRA National Revenue Authority
NSA Non State Actors
PAC Public Accounts Committee
PDMD Public Debt Management Division
PE Public Enterprise
PEFA Public Expenditure and Financial Accountability
PETS Public Expenditure Tracking Survey
PFM Public Financial Management
PFMRU Public Financial Management Reform Unit
PIM Public Investment Management
PIU Project Implementation Unit
PPP Public Private Partnership
PWC Price Waterhouse Coopers
RRM Revenue Resource Management
SAI Supreme Audit Institution
SLIMM Sierra Leone Integrated Macroeconomic Model
SN Sub National
SOE State Owned Enterprises
STA Single Treasury Account
TA Technical Assistance
TBD To be Determined
TIN Tax Identification Number
TOGAS Treasury and Other Government Accounts Service
TOR Terms of Reference

vi
Overview of the Indicator Set
Score 20142 Score 2010
Indicator Dimension Indicator Dimension Change
A. PFM-OUT-TURNS: Credibility of the budget (i) (ii) (iii) (iv) (i) (ii) (iii) (iv) PI-1 Aggregate expenditure out-turn compared to original approved
budget
D D B B ↓
PI-2 Composition of expenditure out-turn compared to original
approved budget
D+ D A C C ↓
PI-3 Aggregate revenue out-turn compared to original approved budget D D C C ↓
PI-4 Stock and monitoring of expenditure payment arrears B+ A B D+ D C ↑
B. KEY CROSS-CUTTING ISSUES: Comprehensiveness and
Transparency
PI-5 Classification of the budget C C C C →
PI-6 Comprehensiveness of information included in budget
documentation
A A A A →
PI-7 Extent of unreported government operations D D D↑ Not Rated NR D ↑
PI-8 Transparency of inter-governmental fiscal relations B A D B A A A A ↓
PI-9 Oversight of aggregate fiscal risk from other public sector entities. C+ C A C+ C B →
PI-10 Public access to key fiscal information B B B B →
C. BUDGET CYCLE C(i) Policy-Based Budgeting PI-11 Orderliness and participation in the annual budget process C C C C D+ C C D ↑
PI-12 Multi-year perspective in fiscal planning, expenditure policy and
budgeting
C C A D D C C A D D →
C(ii) Predictability and Control in Budget Execution PI-13 Transparency of taxpayer obligations and liabilities B B A D B C↑ A C↑ →
PI-14 Effectiveness of measures for taxpayer registration and tax
assessment
B+ B B A B B B B ↑
PI-15 Effectiveness in collection of tax payments B+ A B A D+ D B A ↑
PI-16 Predictability in the availability of funds for commitment of
expenditures
D+ C C D C+ C B C ↓
PI-17 Recording and management of cash balances, debt and guarantees C+ C C B C+↑ B↑ C C↑ →
2 It should be noted that PI-2, 3 and 19 were revised after the 2010 PEFA thereby rendering comparisons difficult for these indicators
vii
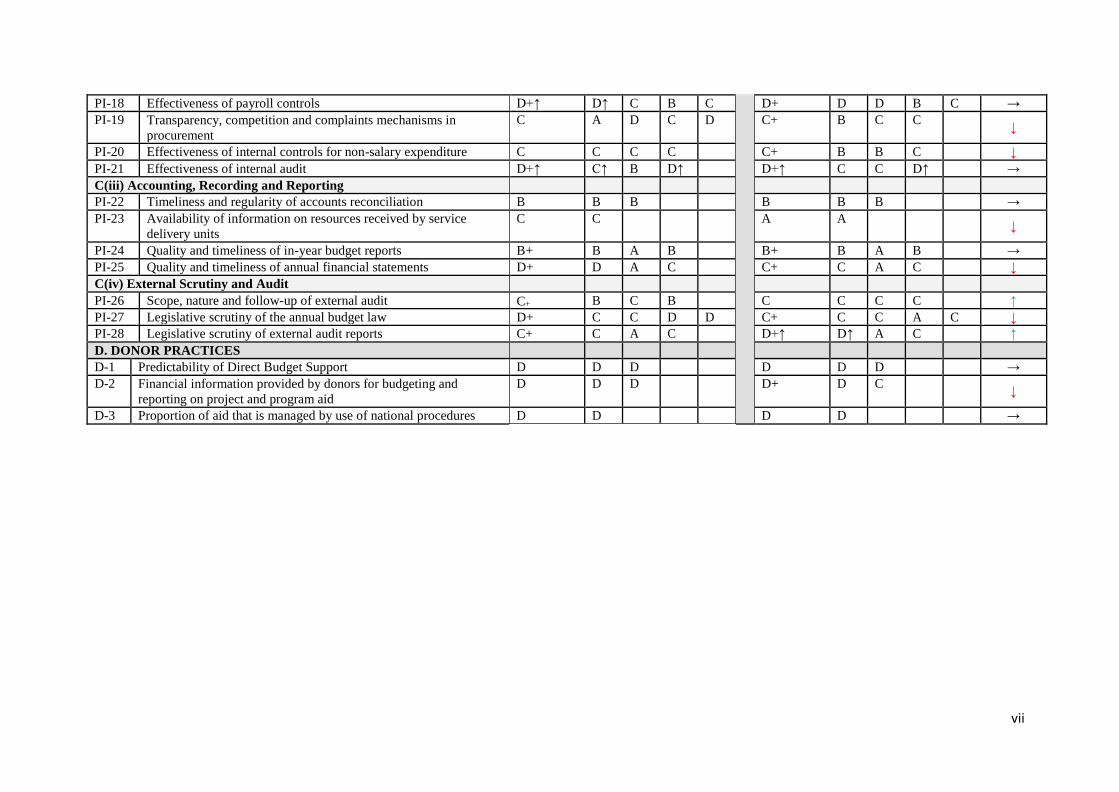
PI-18 Effectiveness of payroll controls D+↑ D↑ C B C D+ D D B C →
PI-19 Transparency, competition and complaints mechanisms in
procurement
C A D C D C+ B C C ↓
PI-20 Effectiveness of internal controls for non-salary expenditure C C C C C+ B B C ↓
PI-21 Effectiveness of internal audit D+↑ C↑ B D↑ D+↑ C C D↑ →
C(iii) Accounting, Recording and Reporting PI-22 Timeliness and regularity of accounts reconciliation B B B B B B →
PI-23 Availability of information on resources received by service
delivery units
C C A A ↓
PI-24 Quality and timeliness of in-year budget reports B+ B A B B+ B A B →
PI-25 Quality and timeliness of annual financial statements D+ D A C C+ C A C ↓
C(iv) External Scrutiny and Audit PI-26 Scope, nature and follow-up of external audit C+ B C B C C C C ↑
PI-27 Legislative scrutiny of the annual budget law D+ C C D D C+ C C A C ↓
PI-28 Legislative scrutiny of external audit reports C+ C A C D+↑ D↑ A C ↑
D. DONOR PRACTICES D-1 Predictability of Direct Budget Support D D D D D D →
D-2 Financial information provided by donors for budgeting and
reporting on project and program aid
D D D D+ D C ↓
D-3 Proportion of aid that is managed by use of national procedures D D D D →

viii
A. Background
SUMMARY ASSESSMENT
1. The regulatory framework for PFM has been positively transformed by the adoption
of a number of new laws.
2. The Government of Sierra Leone is improving the legislative framework in a number
of ways, most important of which is the proposed new PFM Law replacing the GBAA 2005,
and the Public Debt Law passed in 2011. New institutions and functions have been
established (e.g. the Public Investment Planning Unit of MoFED,); and capacity increases
and improvements were made in the number and quality of staff within the Ministry of
Finance, the Accountant-General’s Department and the Office of the Auditor-General.
Revisions to the Public Procurement Act are also in preparation.
3 Weaknesses include: a further weakening of budget credibility and predictability for both expenditures and revenues (underestimated); minor gains in comprehensiveness not impacting on fiscal management challenges; weaknesses in expenditure control (including
payroll); and low levels of transparency. The Government3
considers that much remains to be done to move the system to a level that is capable of directing resources to priority areas and
supporting high quality expenditure outcomes.
4. This 2014 PEFA represents the most recent independent comprehensive assessment of
PFM.
B. Integrated Assessment of PFM Performance
Credibility of the budget
5. Budget credibility has proved to be a serious weakness over the review period, though
there are signs that 2013 demonstrated improvements. Inflated growth estimates4
of 51% for
2012 were used as the basis for planning expenditures in 2010, with the GoSL initiating
public investments from the government budget. These long term contracts resulted in over
expenditures during the review period, impacting negatively on aggregate financial
discipline. On the domestic revenue side, there remains a tendency to under-estimate expected revenues relative to actual revenue. In addition, non-transparent discretionary
exemptions have undermined the tax base. Budget support from donors has not been
predictable, though the cancelling of the IMF programme early in 2013 has not impacted
negatively on donor support, as the new programme was signed in October 2013. IFMIS is
being used to control commitments, so that the overhang of arrears that built up during the
war as well as the outstanding obligations which built up over the review period, are now
being addressed.
3 Integrated PFM Reform Project (IPFMRP) Annual Report 2013
4 This initial estimate was endorsed by the IMF, based on the physical inspection of iron ore mines and their
export infrastructure. Actual growth proved to be in the region of 15% as iron ore prices dipped and extraction
rates were affected by an adverse rainy season. This demonstrates the fragility of the economy, when growth
can be so affected by the performance of companies extracting one mineral.
ix
Comprehensiveness and transparency
6. GoSL has achieved some improvements on individual scores within this range. Of
great significance is the limited improvement made in the Treasury and Other Government
Accounts Service (TOGAS), whose improved reporting of AGAs, together with the audited
accounts of the “big five” AGAs not covered by TOGAS, has enabled a “D” score to be
awarded. Major weaknesses remain in this area but this improvement establishes a basis for
further improvements.
7. The classification system/chart of accounts uses GFS/COFOG compliant economic
and administrative classification only. Despite the ability of the software to translate all
codes to GFS/COFOG (in particular the poverty related codes used for functional
classification), this is not carried out in budget documentation.
8. The Local Governments Equitable Grants Distribution Formulae provides clear and
timely information on allocations to each of the 19 local councils for each of the devolved
services (though the timing of transfers remains predictable they have become “reliably late”
usually between 3 and 6 months). Follow up on the monitoring of budget execution is in
place and local councils report regularly and are audited annually. However, the focus of
reporting is on the use of the CG transfer, and not own source revenues. A system for
overseeing fiscal risk from PEs is in place, but does not consolidate overall fiscal risk.
9. MDAs still display weak capacity for the preparation of costed sector strategies which
are constrained by the resource envelope provided by the MTEF. Public Investment
Management is in its infancy after the establishment in 2013 of the Public Investment
Department within MoFED.
10. Civil society’s role in PFM oversight has improved as a result of the efforts of the
NSA coordinator and associated NGOs involving widespread community and civil society
sensitisation meetings on budgetary and public financial matters, including the preparation of
the first Citizen’s Budget in 2012. District level budget oversight committees still monitor
local expenditures. Public access to key information can still be improved by some simple
management changes. In-year budget execution reporting takes some six weeks compared to
the four weeks considered ideal. Audit reports have seen improvements in coverage and
timing.
Policy-based budgeting
11. The BCC provides a calendar for the preparation of the MTEF and Budget as a
combined process. However, ceilings are often revised after issuance as the Autumn IMF
mission revises the resource envelope, rendering some planning redundant. Cabinet is not
consulted formally on original ceilings and only becomes involved in budget preparation in
late September when it is sent the Budget Framework Paper.
12. Budget approval now occurs before the end of the FY with the exception of the 2013
budget which was delayed as a result of late cabinet formation after the 2012 election.
13. An MTEF exists, but in practice the budget is annual and the medium term forecasts
are weak and poorly linked to policy or plans. There are no costed sector strategies linked to
MTEF resource ceilings and investment is not linked to its recurrent expenditure

x
implications, though the establishment of a Public Investment Unit in MoFED may improve
public investment management (PIM) in the future.
14. The Debt Sustainability Analysis is now conducted biannually with focus shifting to
the annual Medium Term Debt Management Strategy. The IMF still conducts an annual DSA
in agreement with the GoSL.
Predictability and control in budget execution
15. With the 2010 GST and 2011 Customs Act, all taxes now have a separate,
consolidated, single, and easy-to-follow piece of legislation. The NRA still exercises
discretionary powers, particularly waivers of customs duties, though these are decreasing
significantly. Transfers from commercial banks to the NRA are often delayed but should be
somewhat addressed in the light of recent agreements between the banks and MoFED. Funds
for revenues outside of NRA, in particular extractive industries, are to be addressed in a new
Act and the NRA has already established Units to cater for these prospective revenues.
16. The control over procurement established by the Procurement Act 2004 and the
Public Procurement Regulations 2006 is overseen by the National Public Procurement
Agency (NPPA). Each year since its establishment in 2006, the NPPA has extended its
scrutiny to an increasing number of procurement entities in line with its mandate. The
prescribed system for procurement commences with the requirement for all MDAs and other
agencies to produce a Procurement Plan as part of the budget cycle. The NPPA scrutiny,
whilst thorough in terms of the entities and contracts captured by its monitoring system, still
has some way to go in terms of completeness of all procuring entities and comprehensiveness
of all procurements.
17. The Procurement Act regulatory requirements have established criteria for the use of
open competition and the avoidance of non-competitive practices such as the potential for
contract splitting to avoid thresholds and the inappropriate use of single source suppliers.
Such practices will become harder as procurement planning and implementation is more
widely applied. The Act also provides for complaints and appeals. Significant levels of
capacity building and resources will be required to establish the process more credibly and
with actual and perceived independence of the Independent Procurement Review Panel
(IPRP).
18. System controls within IFMIS continue to provide hard budget control to ensure that
spending does not exceed overall quarterly budget allocations5
– the focus being to keep
payments within approved limits. The AGD is able to produce monthly statements
comparing approved budget with the total of the executed budget and the outstanding
contractual commitments. The central processing controls operated within AGD – Other
Controls Unit - do not allow the budget/cash limits to be exceeded. Training and internal
control guidance to MDAs is provided by this Unit.
19. AGD has a central payments role in respect of payroll and a number of different
control levels exist over changes affecting the payroll. Therefore, the on-going control
environment over changes to payroll and human resource files appears to be sound. The
significant weakness appears to be in the integrity of the total historic database of civil
servants and public servants which has not been subjected to a full audit.
5 Since 2013 allocations are made half-yearly

xi
20. Whilst IFMIS does provide a significant number of system controls there are
challenges to the extent to which this can be considered consistent such as connectivity issues
and frequent loss of power which undermine some aspects of control.
21. The development of public sector internal audit continues in Sierra Leone. Since the
last PEFA exercise this function has been strengthened in numbers. There are examples of
IADs which are more established and function better than others but overall it is not yet a
strong institutional platform. Part of the internal audit governance structure is the
establishment of an Audit Committee in each MDA although these do not appear to be
functioning. In day to day line management terms, these IADs report directly to Vote
Controllers, with the Head of Internal Audit in MoFED disseminating internal audit policies
and procedures. The first Annual Report of internal audit activity was prepared in 2012 and
an ASSL review of the internal audit function in 2012 concluded that the function “… has
sustainable internal audit practices and procedures but these are not yet well established
throughout the public sector’’
Accounting, recording and reporting
22. Reconciliations continue to be carried out on a regular basis, although changes to
BoSL software in June 2013 did have an impact on timeliness during that period. More
recently, the implementation of the activity based budgeting module has delayed the upload
of the 2014 budget into IFMIS which means the January 2014 reconciliation of Treasury
accounts by the AGD cannot be undertaken. In the wider context of bank reconciliation in
Sierra Leone, this has featured as a concern in the Auditor General’s reports during the three
year period since the last PEFA.
23. The last Public Expenditure Tracking Surveys were undertaken in 2010 and 2011, but
they are no longer completed on an annual basis. It is not clear whether there will be a PETS
exercise during 2014. Therefore they cannot be considered as a regular feature of the
monitoring system.
24. The in-year budget reports produced by the IFMIS system provide an extensive
budget reporting system on a monthly basis with ever-improving quality and accuracy of
information. The reports encompass budgetary integrity and indicate whether resources have
been used in conformity with legal authorisations and mandatory requirements. The reports
also show the status of resources and expenditures (uncommitted balances and undisbursed
commitments), and take into account the needs of different users. In addition, monthly “flash
reports” can be produced at any time.
25. The improvements in timeliness of the Financial Statements which were achieved
previously have been sustained.
External scrutiny and audit
26. Audit Service Sierra Leone (ASSL) has seen a significant increase in the coverage of
audit work performed on CG expenditures from 69.3% in 2009 to 83.7% in 2013. The Audit
Service has now completed nine performance audits of which seven have been subject to
PAC hearings to date. Performance audit now appears to be a regular aspect of the external
auditor’s scope.

xii
27. The Finance Committee carries out the scrutiny function on the budget and the Public
Accounts Committee on audited accounts. Delays in the submission of the budget to the
Finance Committee remain, negatively impacting on the time available for effective budget
scrutiny.
28. The submission on 16th December 2013 of the 2012 Accounts met the Auditor
General’s constitutional mandate to submit to Parliament her report on the accounts to the
Legislature within twelve months of the end of the period covered. In addition, all of the
Value for Money (VFM) reports undertaken by ASSL are submitted to Parliament and
subjected to PAC hearings. Two performance reports completed in 2013 have yet to be
subject to PAC hearings. These are Ministry of Lands ''Allocation of Lands'' Review
presented to Parliament on 18th December 2013, and one in respect of ''Sierra Leone Roads
Authority'' which has yet to be tabled before Parliament.
Donor Practices
29. Budget support disbursements appear to be less volatile for the period currently under
assessment compared to estimates for the previous PEFA.
30. The process of financial information, including its completeness and timeliness,
provided by the donors for budgeting and reporting on project and programme aid is not
consistent. Also, the recent emergence of non-traditional donors that concentrate on
providing assets and building projects which are not monetised should be noted in terms of
completeness of data captured.
31. In terms of the proportion of aid that is managed by national resources, the best proxy
is still to use the budget support figures as there was little evidence found of other aid using
IFMIS.
C. Assessment of the Impact of PFM Weaknesses
32. Weaknesses can be summarized as:
• Budget Planning o Lack of capacity in planning and budget formulation in line ministries
which results in lack of aggregate fiscal discipline as demonstrated during the review period. Allocation of resources has also been compromised as
some priority expenditures have witnessed shortfalls as other priorities have been locked into medium term contracts. Efficiency has also been
negatively affected as the reining in of expenditures has impacted
disproportionately on goods and services.
• Budget Execution
o The process of budget ceilings revision linked to IMF missions hinders
allocative efficiency and service delivery.
• Budget Accounting and Controls o Approximately 40% of procurement is operated under non-competitive
bidding, which more than likely impacts negatively on costs and therefore efficient service delivery in the first place as well as suboptimal resource allocation and fiscal indiscipline. The appeals process requires significant additional effort and resources to be fully implemented and independent.

xiii
• Budget Reporting and External Audit
o The Single Treasury Account is still not operational in practice with many
accounts still not being reported centrally and monitored, constraining the
capacity of the GoSL to control fiscal discipline, the allocation of
resources and ultimately the planning and management of services..
o There are many AGA and project accounts outside the ambit of the IFMIS. o AG reports are not acted on in a timely manner and sometimes are not
forthcoming at all.
• External Scrutiny
o Despite significant improvements, ASSL still does not cover all of general government expenditure, leading to less pressure on the GoSL to allocate and execute the budget according to its policies, leading to inefficient service delivery.
D. Prospects for Reform Planning and Implementation
33. This PEFA assessment has been produced during a period in the deepening of reform
of PFM in Sierra Leone covering:
• Budget Formulation – the creation of a Public Investment Planning Unit as well as
the strengthening of the SLIM model for macro forecasting under EPRU.
• Budget Execution and Accounting – the continued roll out of the IFMIS and the
production of timely financial reporting.
• Significant payroll verification exercises (indicating the likelihood of significant
numbers of ghost workers).
• Increases in the IT platform of systems, in particular, software in HRMO.
• External Audit – the publication of more timely audit reports and Auditor
General’s Opinion on the Financial Statements
These reforms have been supported by technical assistance from a range of bilateral and
multilateral donors, particularly towards the Integrated PFM Reform Project.
34. In 2014, this reform project will enter a new phase with an emphasis on revenue
management, in particular Resource Revenue Management (RRM) in the expectation that
mining revenues will significantly increase from 2015. It will also strengthen PFM capacity
at local council level, thereby contributing to the deepening of decentralisation.
The challenge of fully implementing such an ambitious set of PFM reforms should not be
underestimated, in particular during a period of potential rapid economic growth based on the
extractive industries sector and in particular, iron ore and later, petroleum.
35. The PEFA assessment has pointed to weaknesses in policy and planning and as a
result in budget formulation which focuses on aggregate expenditures rather than sectoral
allocations that reflect robust policies and plans. Improving control systems is important but
should be carried out with a focus on service delivery to improve effectiveness and
efficiency. The architecture for reforms exists to a large extent, but their implementation will
require a number of years to take effect.
36. The establishment of the Public Investment Planning Unit is a positive step to
improve PIM both domestically and donor financed, and will, if carried out correctly, inform
budget preparation.
37. IFMIS has not been significantly rolled out since 2007 (technical problems saw a
rollback in 3 ministries), but there are plans in the new reform phase to ensure that this

xiv
happens in the near future. This would be critical to deepen the control environment in
MDAs (a continuing concern of AG reports) as well as allowing for the introduction of a
Single Treasury Account.
38. The Single Treasury Account (STA) is a key target in the forthcoming phase and the
survey which revealed over 1000 government bank accounts outside the BoSL will assist
greatly in ensuring the STA covers all public expenditures. Cooperation between MoFED,
NRA and BoSL on the establishment of the STA has already started and will be key in
developing the STA, as well as satisfying AG concerns with respect to cooperation between
the MoFED and NRA (the head of which is a Presidential appointee). Recent improvements
in TOGAS reporting (compliance has improved as sanctions have been used on occasion),
though still remaining weak, also forms the basis for drawing in many off-budget
expenditures (both AGAs and donor PIUs) onto the STA.
E. Institutional Factors Supporting Reform Planning and
Implementation
39. PFM reform in Sierra Leone is directed at all six dimensions of the PFM system:
• Budget Credibility is being addressed primarily through the introduction of the STA
and the associated comprehensive reporting of all AGAs and PEs, which, although
improved, requires continued efforts. This will primarily improve fiscal discipline,
but also have positive secondary effects on resource allocation and therefore efficient
service delivery
• Comprehensiveness and transparency. The main reform targeted in this area is the
continued rollout of the IFMIS to all MDAs and LCs.
• Policy-based budgeting still requires the strengthening of sectoral strategies in line
with GoSL policy. A major effort in this regard will be the strengthening of the
newly formed Public Investment Unit of MoFED, which can supervise both
domestically financed and donor financed investments, with a view to improving
value for money.
• Predictability and control in budget execution will continue to focus on
improvements in taxation, in particular the efficient collection of extractive industry
revenues. This will be of utmost importance if continued domestic investment is to
be financed. If these revenues are not transparently collected then the opportunities
for corrupt practices, leakages and patronage are likely to be high. Similarly, efforts
to improve procurement practices will reduce opportunities for similar negative
practices.
• Accounting, recording and reporting will focus on the resurrection of the PETS,
thereby directly looking to impact on efficient service delivery at the point of service.
• Effective external scrutiny and audit. Plans focus on the continued strengthening and therefore scope of the AG’s office. In addition there will be focus on follow up to
reports.
40. The main institutional driver for reform in PFM is the PFMRU. It is due to enter a
new phase in its operations in 2014, informed by the 2010 PEFA. A more detailed description
of the forthcoming phase can be found in Section 4.1. In summary its focus is to streamline
PFM processes to ensure the transparent receipt of expected royalties from mining and the
efficient use of said receipts. The rollout of the IFMIS and the linked introduction of a STA

xv
will be key in this regard as more SOEs and AGAs are brought into government PFM
systems.
41. In terms of the overall donor context, various co-mechanisms exist within Sierra
Leone to foster the partnership and dialogue between GoSL and development partners and for
the better co-ordination of aid. At the strategic level there is the Development Partnership
Committee (DEPAC) and Multi Donor Budget Support Group (MDBS). Below DEPAC are
sector working groups.
42. It is understood that a structure for Inter-Ministerial coordination and collaboration on
the implementation of the Agenda for Prosperity has recently been discussed and agreed
upon. And that it was agreed that a framework for monitoring adherence to the Mutual
Accountability Framework is to be developed by DACO for consideration by the DEPAC
Committee.
F. Key Changes from 2010 to 2014
43. Progress in the quality of PFM systems and processes has been mixed between 2010
and 2014, as measured by the PEFA methodology. This is shown in Figure 1 below.
Figure 1: Sierra Leone:
Summary Comparison of PEFA Scores 2010 and 2014
Indicator 2010 (No.) 2014 (No.)
A 3 1
B or B+ 6 8
C or C+ 12 10
D or D+ 9 12
Not Rated 1 0
Upward Arrows 3 2
Improved Scores 10 7
Reduced Score 4 11
Dimension 2010 (No.) 2014 (No.)
A 12 14
B or B+ 14 16
C or C+ 28 24
D or D+ 14 22
Not Rated 1 0
Upward Arrows 6 4
Improved Scores 16 13
Reduced Score 8 17
44. Improved scores figure less than reduced scores whether looking at indicators or
dimensions. The fact that there are 7 indicators and 13 dimensions with improved scores

xvi
indicates that the PFM reform programme is having an impact, particularly in Tax
Administration, the Audit Service, and some improvement in the recording of “off-budget”
expenditures, whether that be donor funded projects or other government accounts, which
bodes well for the proposed STA.
45. The Assessment Team noted 13 indicators where the scores had not changed.
However, the 3 upward arrows are a good indicator of positive trajectory of change even if
these have yet to feed into improved scores.
46. Reduced scores were found for 11 indicators and 17 dimensions. A major reason for
these reduced scores can be traced to the overspending of the government as noted above.
Budget credibility has suffered over the review period and has had an impact on the
predictability of the availability of funds. Accounts reconciliation may simply have suffered
as end of year accounts take longer to reconcile given the holiday period. Scarce resources
also impacted on the regularity of PETS and therefore the availability of information at
service delivery units. Some indicators also suffered due to infrastructural constraints in
Sierra Leone, whereby IFMIS connections were hampered and restricted its rollout and use.

1
Section 1: Introduction
47. The 2014 PEFA is the third assessment of Central Government PFM in Sierra Leone,
after reports in 2007 and 2010. As such it follows the PEFA recommended interval for a
repeat assessment being just over 3 years. It is also finalised in time to inform the next phase
of the PFM reform process as the IPFMRP is planned to start its next phase shortly.
Furthermore, it comes at a time of robust economic growth, albeit dependent on a narrow
resource base, in particular the start of iron ore exports, which is estimated to spur real GDP
growth to about 10% over the 2013-18 period. Translating government revenues from such
mining activities into effective and efficient service delivery and inclusive growth will
depend to a large extent on building on PFM improvements since 2007.
48. The Ministry of Finance and Economic Development anchored this repeat assessment
as it did in 2010 and 2007. The Multidonor Budget Support Group (WB, EU, AfDB and
DFID) provided technical assistance and DFID financed the consultancy services. The
PFMRU within MoFED assisted the consultancy team in briefings and meeting organisation,
as well as organising the Training Workshop and debrief. The PFMRU was therefore the key
liaison point for the consultants although it was not the first point of call for information,
which were the respective departments of MoFED and other institutions. However, PFMRU
did supplement information provided with their perspective during regular briefing meetings.
49. The government has collaborated extensively by providing necessary information and
assigning MoFED staff to work alongside the team. A Training Workshop was held in early
January 2014 for all GoSL and donor stakeholders and fieldwork commenced immediately
after. Discussions were also held with donor partners and some external stakeholders
including civil society, private businesses and the Chamber of Commerce. The draft scores
and assessments were discussed during a debriefing with a core team of officers from
MoFED, other stakeholders and development partners on February 20th
2014.
50. The PEFA methodology is set out in the Public Finance Management Performance
Measurement Framework (available at www.pefa.org). It is based on 28 indicators covering a
country’s PFM system, and 3 indicators addressing the interaction of donors with a country’s
budget process and PFM system. PEFA assessments provide cross-country comparable
indications of the effectiveness of PFM systems, and of their improvements over time. They
do not provide, however, for an analysis of the causes of existing weaknesses. It should be
emphasised that PEFA is an essentially backward-looking process, based on evidence about
actual public sector financial management from 2010 to 2012. Recent developments that
occurred in 2013-14 are generally not taken into account when rating the PIs as budgetary
information for 2013 is not audited yet and furthermore the MoFED has indicated that
expenditures from some MDAs has still not been confirmed. However, such developments
are part of the narrative that describes the on-going reforms.
51. Each indicator is scored on a scale from A to D. The bases for these ratings are the
minimum requirements set out in the methodology. Many indicators include two or more
dimensions, which are “added up” using PEFA-specific methods M1 or M2. For method M1
the weakest link is decisive, i.e. the overall rating is based on the dimension with the lowest
score. For M2 an average of the sub-ratings is used to arrive at the score for the overall
indicator.6
6 see the PEFA Framework, “Scoring Methodology”

2
52. The assessment is based on an analysis of evidence gathered by the Assessment
Team, which was triangulated with government officials who took a keen and diligent view
of all aspects of the assessment process; including critical evaluations of the Team’s
preliminary findings. The process was supported by an initial one-day training workshop for
key government officials, many of whom participated in the assessment process. This PEFA
has benefited from other studies conducted earlier, including the 2007 and 2010 PEFAs.
53. The methodology of the assessment relied on extensive interviews with members of
GoSL institutions as mentioned above, together with civil society and the private sector.
Data was sourced from government departments.
54. The Summary Assessment presented to GoSL and donors on February 20th
2014
benefitted from comments from both GoSL and donors.
55. The Draft Report submitted on March 4th
2014 benefitted from comments from GoSL,
DFID, AfDB and the PEFA Secretariat. Quality assurance was provided by Coffey
International Development Ltd. for both the draft and final reports.
56. In Sierra Leone, public finances cover the Central Government and transfers to the
Local Councils and any transfers to subvented organisations and parastatals. The analysis of
PFM in this report focuses on central government, which, as can be seen from the table
below, dominates public expenditures.
The table below provides a breakdown of the relative importance of each in 20107.
Institutions Number of
entities
% of total public
expenditures
Central Government* 60 88.9
Autonomous Government Agencies 32 4.8
Sub-National Governments 19 6.3
*includes ministries, departments and agencies. Source: Budget Bureau (MoFED) - 2009 Budget Estimates
Section 2: Country Background Information
2.1. Description of the Country Economic Situation
2.1.1 Country context
57. The last population census in Sierra Leone was carried out in 2004. Projections for
2014 indicate an estimate of 6.4 million people. The next census is expected to be carried out
in December 2014. Life expectancy in Sierra Leone has significantly improved since the
UNDP DHDR 2006, increasing from 41.8 to 48.1 years in 2012. The most recent
Demographic & Health Survey 2013 (Preliminary Report) also indicates significant
improvements in social indicators: the “Maternal Mortality Ratio and Infant Mortality Rate of
Sierra Leone in 2008 stood at 857/100,000 live births and 89/1000 respectively. The Child
Mortality Rate was 140/1000 live births [DHS 2008] and one quarter of all under-five deaths
occurred during the neonatal period”. According to the DHS 2013 preliminary report,
successive Multi-Indicator Cluster Surveys (MICS) conducted in 2005 and 2010 show that
7 Despite the improvement in the reporting of AGAs, the GoSL could not provide a breakdown for this table in
2014, and so the table from the 2010 PEFA report is used.

3
infant mortality has reduced from 170/1000 live births to 128/1,000 live births and child
mortality reduced from 286/1000 live births to 217/1000 live births, respectively.
58. In addition, the report indicates that the General Fertility Rate (GFR) (the estimated
annual number of births per 1,000 women age 15-44) has improved to 169 births / 1000
women, and the Crude Birth Rate (CBR) (the total number of births occurring in a given year
per 1,000 population), is 36 births/1,000 population.
Table 1: Sierra Leone: Social Indicators
Population (2004 Census projection for 2014) 6.4 Million
Urban 39.1 per cent
Rural 60.9 per cent
Aged 20 and above 46.3 per cent
Crude Birth Rate (2012 estimates) 37.0/ 1000
Crude Death Rate (2012 estimates) 15.0 /1000
Infant Mortality Rate 2012 104/ 1000
Under Five Mortality Rate 2012 157.9/ 1000
Maternal Mortality Rate 2010 890 / 100,000 live births
Life Expectancy at Birth (2012) 48.1 years
Total Fertility Rate 2012 4.8 births / woman
Contraceptive Prevalence Rate, 2012 (Women) 21.5%
Disability Prevalence 7.0 per thousand
Underweight Prevalence (Children under 5 years) 21 per cent
Stunting Prevalence (Children under 5 years) 36 per cent
Prevalence of HIV 1.5 per cent
Access to Health Services 40 percent
Access to Safe Water 57 per cent
Access to Sanitation 66 per cent
Source: SLDHS (2008), 2004 Census & updated estimates
2.1.2 Poverty Profile
59. Since the last Sierra Leone Integrated Household Survey 2003 report which identified
that 66.4% of the population is poor, the 2011 Sierra Leone Integrated Household Survey
report revealed a reduction from that figure to 52.9%. This figure is still relatively very high
but the reduction is seen as a positive step and can be attributed to the strong growth of the
economy during the post conflict period.
60. According to the report, poverty declined from 86.0 to 61.3% in the Eastern region,
from 80.6 to 61.0% in the Northern region, and from 64.1 to 55.4% in the Southern region.
Poverty increased in the Western region from 20.7 to 28.0%. This increase is likely driven by
large numbers of economic migrants, moving to the Western region, in particular Freetown,
seeking employment opportunities. The decline in poverty was most pronounced in the urban
areas outside Freetown, with a reduction from 70.9% in 2003 to 39.5% in 2011. Poverty in
Freetown increased from 13.6% to 20.7% in 2011. Despite the increase in poverty in
Freetown, urban poverty as a whole decreased from 46.9% in 2003 to 31.2% in 2011. Rural
poverty also declined from 78.7% to 66.1% but remained high relative to urban poverty over
the same period. Hence, poverty remains pervasive in rural areas.

4
61. According to the report and as shown in Table 2 below, district level poverty rates for
2011 show the geographic divisions of prosperity and poverty. It indicates that the lowest
levels of poverty were in the capital city of Freetown. It also indicates that poverty levels
were consistent across the country outside of the capital Freetown where 11 out of 13 districts
had a poverty headcount which ranged between 50% and 62%. The highest levels of poverty
was in Tonkolili with 76.4% followed by Moyamba 70.8%, and the lowest recorded in Bo
district with 50.7%.
2.1.3 Extreme poverty
62. Poverty is extreme in the rural areas where the average individual in poverty is below
21% of their basic needs. The SLIHS 2011 reports revealed that the average person’s total
consumption falls short of the minimum consumption level necessary in order not to be
considered “poor” by 16% (the “poverty gap”). The report further revealed that the average
urban poor could afford about 92% of their basic needs in 2011 compared to 84% in 2003.
However, at the regional level, poverty is extreme in the Northern region whose poor can
only meet up to 81% of their basic needs, compared to 83% for the Southern region, 82% for
the Eastern region and 92% for the Western Area, indicating that poverty is less deep in the
Western Area. At the District level, poverty is worst in Bombali District with the poverty gap
estimated at 22.7%, implying that the poor in the Bombali District can only afford up to 77%
of their basic needs. This is followed by Moyamba, PortLoko, Tonkolili and Kenema with
poverty gaps estimated at 24.2%, 21%, and 19.1%, respectively. The poor in Freetown can
afford up to 95% of their basic needs, indicating that they are not far away from the poverty
line – the expenditure level required to take them out of poverty.
Table 2: Poverty Regional Distribution
Absolute Poverty Incidence Gap Severity % of Population
2003 2011 2003 2011 2003 2011 2003 2011
National 66.4 52.9 27.0 16.1 14.0 6.7 100.0 100.0
Rural 78.7 66.1 33.8 21.1 18.0 9.1 61.3 62.3
Urban 46.9 31.2 16.3 7.7 7.7 2.8 38.7 37.7
Freetown 13.6 20.7 2.5 4.9 0.8 1.8 16.2 16.6
Other Urban 70.9 39.5 26.3 10.0 12.7 3.5 22.5 21.5
Eastern Region 86.0 61.3 38.9 18.4 21.0 7.5 22.5 22.5
Kailahun 93.0 60.9 45.1 16.9 25.1 6.5 7.4 7.5
Kenema 88.1 61.6 39.3 19.3 20.9 8.2 9.9 10.2
Kono 71.8 61.3 28.9 19.0 14.9 7.7 5.1 4.9
Northern Region 80.6 61.0 32.8 18.9 17.0 8.1 35.7 34.1
Bombali 86.1 57.9 43.8 22.7 25.8 11.7 8.4 7.8
Kambia 71.2 53.9 22.9 13.6 9.6 4.6 5.8 5.3
Koinadugu 77.5 54.3 32.8 14.5 17.6 5.0 4.9 5.2
Port Loko 80.8 59.9 30.0 21.0 13.9 10.0 9.5 8.8
Tonkolili 83.5 76.4 31.4 19.1 16.2 6.5 7.2 6.9
Southern Region 64.1 55.4 24.2 17.4 12.0 7.4 22.3 22.7
Bo 63.2 50.7 25.0 16.1 13.1 6.7 9.5 10.4
Bonthe 89.3 51.4 39.7 12.9 21.1 4.4 2.7 2.7
Moyamba 68.2 70.8 24.2 22.4 11.3 10.1 5.3 4.3
Pujehun 47.4 54.1 13.9 17.9 5.7 7.9 4.8 5.3
Western Region 20.7 28.0 6.2 7.5 2.8 2.9 19.6 20.7
Western Rural 54.9 57.1 23.8 18.2 12.7 7.2 3.4 4.1

5
Western Urban 13.6 20.7 2.5 4.9 0.8 1.8 16.2 16.6
Source: Sierra Leone Integrated Household Survey Report 2011
63. The Human Development Index (HDI) is a summary measure of three dimensions of
human development: leading a long and healthy life (measured by life expectancy at birth),
being knowledgeable (measured by literacy and school enrolment) and having a decent
standard of living (measured by GDP per capita).
64. In the Human Development Report 2013, it was indicated that from 2000-2012 Sierra
Leone’s Human Development Index (HDI) score improved by 3.4% per year, the second
fastest in the world. Sierra Leone is now ranked 177 out of 186 (up from 180 out of 182 in
the 2009 report. Despite this rise, Sierra Leone still remains low in terms of Human
Development (0.359) though life expectancy has risen to 48.1 years from 41.8 in 2008, and
GNI has risen to $880, up from $713 in 2008.
2008 2012
Human Development Index 0.365 0.359
Life Expectancy 47.3 48.1
Expected Years in School 7.3
Gross National Income per capita $713 $880
Source: UNDP-“The Rise of the South” HDI Report 2013, HDI Report 2008
2.1.4 Employment Trends between 2009 and 2012
65. Sierra Leone continues to face challenges despite the rise in GDP over the period
2008 – 2012. It has a very youthful population with about 53% of the population below the
age of 20 (2004 Census), which is projected to reach 70% in the next few years. The flagship
reform program of the government, The Agenda for Prosperity, recognises this challenge and
the first pillar of the eight (8) pillars, Pillar I – Economic diversification and Inclusive growth
and aims to make progress towards the inclusive growth in a stable macroeconomic
environment.
2.2 Description of Budgetary Outcomes
66. Despite the increase in growth witnessed in recent years, Sierra Leone’s fiscal
performance over the review period has been poor, largely as a result of embarking on long
term domestically financed capital projects in the expectation that growth rates would near
the 51% estimate of growth for 2012 made in 2010. Although growth reached 15.2%, the
fiscal damage was done. Only in 2013 can we see signs of a return to fiscal prudence, with
the deficit decreasing, though it is budgeted to increase again in 2014.
Central Government Budget (in % of GDP) 2010 2011 2012* 2013**
Total Revenue 15.2 17.1 16.3 16.0
• Own revenue 9.9 11.5 12.2 12.4
• Grants 5.3 5.6 4.1 3.6
Total Expenditure 20.2 21.6 21.9 19.1

6
• Non-interest expenditure 18.6 19.6 20.0 17.2
• Interest Expenditure 1.6 2.0 1.9 1.9
Aggregate Deficit (including grants) -5.0 -4.6 -5.6 -3.1
Primary Deficit -5.9 -3.8 -3.8 -1.8
Net Financing 5.0 4.6 5.6 3.1
• External 1.6 2.4 3.4 2.6
• Domestic 3.5 2.2 2.2 0.5
Source: MoFED, IMF * Preliminary Figures
** Estimate
67. Sierra Leone has recorded strong economic growth between 2009 and 2012. Real
GDP growth for non-iron ore averaged 5.2% during this period driven mainly by increased
activity in agriculture, mining, construction and services sector. The mining of iron ore
commenced towards the end of 2011, and as a result there was a spike in the GDP for 2012,
estimated at 15.2%, therefore over the period including iron ore real GDP averaged 8.2%
overall.
68. The mining sector contribution to GDP is projected to increase substantially from 4%
in 2011 to around 22% in 2014 and 30% by 2017, due mainly to large scale iron ore
operations. Agriculture which includes forestry and fisheries are still the largest contributors
to the GDP, but declining from 52% in 2011 to 42% in 2013.
69. The challenging global economic environment during this period resulted in
inflationary pressure on the economy, mainly resulting from higher international food and
fuel prices and increased imports that were passed through into the domestic prices. The
introduction of the Goods and Services Tax (GST) added to the pressure on prices and,
together with expansionary monetary policy, inflation reached 18.4% in 2011. However by
the end of 2012 inflation had fallen to 12.0%, attributed to monetary and fiscal measures
undertaken by the government to keep prices at affordable levels, including the passing of
legislation in 2011 limiting borrowing to 5% of the previous year’s revenue. Such measures
included temporarily removing the import duties on petroleum and rice and also reducing the
excise duty on petroleum, as well as a new ceiling on central bank borrowing. 70. Domestic
revenue increased from 8.9% of GDP in 2008 to 12.2% in 2012. Such improvements were
attributed to reforms that improved tax administration and broadening of the tax base, i.e.
GST was introduced, Domestic Tax Department was established (integrating the Income Tax
Department and the Goods and Services Department), and the Automated Systems for
Customs Data (ASYCUDA++) was introduced at the Customs department.
71. Government expenditure increased during this period from 16.5% of GDP in 2008, to
22% in 2012. Capital expenditure was mainly attributed for this growth including those
funded from domestic revenue. Exports grew to a record 143.7% mainly driven by the iron
ore production and exports by two main iron ore companies, and also increased exports from
both rutile and diamonds.
Actual Budgetary Allocations by principal sectors (as % of total Expenditures)
2010 2011 2012
Health 5.7 7.4 5.5
Education 13.0 12.0 14.3

7
Agriculture 4.1 5.5 4.5
Mining 1.0 0.5 0.6
General Services 17.8 17.6 18.6
Security Services 9.8 9.1 9.5
Energy 4.1 9.7 7.0
Roads 14.0 9.8 12.4
Local Council Transfer 6.7 5.4 3.8
Source: Budget Bureau MoFED
72. There are no discernible trends in sectoral expenditure which correlate with
government policy. During the review period, as mentioned above, capital expenditures in
the roads (and to some extent energy) sectors have been the main driver of GoSL
expenditures. Fluctuations in this sector’s expenditures have resulted in increases or
decreases in the share of other sectors. Worryingly, despite the emphasis of the government
on decentralisation, the transfer to Local Councils has decreased as a sectoral share over the
review period.
Actual Budgetary Allocations by economic classification (as % of total Expenditures)
2010 2011 2012 2013 2014
Recurrent expenditures 61 55 64 62 63
• Wages and salaries 26 23 28 31 33
• Goods and services 18 14 13 13 14
• Interest Payments 8 7 9 11 8
• Transfers 0 0 0 0 0
• Others 0 0 0 0 0
Capital Expenditures 39 45 36 38 38
Source: Budget Bureau, MoFED
73. The cuts experienced by many sectors during the review period resulting from the
over-expenditures we can witness from PI-1 have been borne largely by goods and services
as its allocation has decreased from 17.6% to 12.8% of expenditure. It is to be expected that
this reduction would have a significant impact on the efficiency of service delivery.
2.3 Legal and Institutional Framework for PFM
74. The 1991 Constitution sets out the overall legal jurisdiction in Sierra Leone. The laws
of Sierra Leone comprise:
• The Constitution;
• Laws made by or under the authority of Parliament as established by the Constitution;
• Any orders, rules, regulations and other statutory instruments established by the
Constitution or any other law;
• Existing law which comprises the written and unwritten laws of Sierra Leone as they
existed immediately before the coming into force of the Constitution and any statutory instrument; and
• Common law which comprises the rules of law generally known as the doctrines of
equity, and the rules of customary law (applicable to particular communities)
including those determined by the Superior Court of Judicature.

8
75. With respect to PFM, the Constitution sets out the legal and institutional framework in
Part VI sections 110 to 120 covering the supremacy of Parliament with respect to matters of
taxation (though in practice Parliament delegates some powers to the President and the
Ministry of Finance) and expenditure, as well as the role of the Auditor General. Taxation
(and waivers) must be approved by Parliament (Article 110) as well as borrowing (Article
118). The Consolidated Fund as the recipient of revenue (save for earmarked revenue) is the
subject of Article 111 as is the withdrawal of funds authorised by an Act of Parliament.
Article 112 provides for the annual and supplementary budgets, and Article 144 for the
authorisation of expenditure warrants by the President. Section 114 (2) c allows the President
to authorize warrants under his signature for extra-budgetary expenditure when he considers
that there is such an urgent need to incur the expenditure that it would not be in the public
interest to delay.
76. Individual laws and regulations covering PFM implement the general provisions of
the Constitution. These are described in the relevant indicator and include:
• The Local Government Act, 2004 and supporting Statutory Instrument. This is
currently being reviewed and is expected to be ready for enactment by December
2014.
• National Commission for Privatisation Act 2002.
• The Income Tax Act (2000) and amendments through the annual Finance Bill. The latest is the Finance Act of 2011 and 2013. In the 2013 Finance Act, there has been a clear dissection of the SME regime from all other regimes in this act.
• Extractive Industry Revenue Act – at bill stage and to be enacted December 2014.
• Good and Services Tax Act 2010 (replacing Sales Tax Decree, 1995 and Finance Acts
2006 and 2007).
• The Excise Act, 1982.
• A new Customs Tariff Act 2011 and ECOWAS Common External Tariff.
• The Government Budgeting and Accountability Act, 2005. This is to be replaced by the PFM Act which is currently at bill stage and expected to be enacted by December 2014.
• Financial Administration Regulations (replaced by the Financial Management
Regulations of June 2007)
• National Revenue Authority Act, 2002
• Public Procurement Act, 2004 – Currently being reviewed and the revised act is
currently with the Minister of Finance for onward submission to cabinet then
parliament.
• Social Security Act of 2001
• The Audit Service Act, 1998
77. The Government Budgeting and Accountability Act and the Financial Administration
Regulations establish the Ministry of Finance as the principal agent in Government on PFM
matters. The stated Mission statement of the Ministry is to formulate and implement sound
economic policies and public financial management, ensure efficient allocation of public
resources to promote stable economic growth and development in the context of a stable
macroeconomic environment. The Minister of Finance has the ultimate responsibility with
the Financial Secretary as his principal agent. The Ministry of Finance and Economic
Development houses the Budget Bureau, which is responsible for budget preparation, and the
Accountant-General’s Department. Budget execution (payment) and supervision are through

9
the Treasury and the Accountant General though there are Vote Controllers and Chief
Financial Officers in each of the MDAs who are the first line of responsibility for PFM at the
MDA level. There is an Internal Audit department in each MDA, which is supervised by the
Ministry of Finance and Economic Development (Internal Audit Department). As well as a
Department of Administration, the Ministry also has departments covering Economic Policy
and Research, Information Communication and Technology, Central Planning Monitoring &
Evaluation, Development Assistance Coordinating, Regional Integration and South-South
Cooperation, Debt Management Unit, Revenue and Tax Policy, and Public Financial
Management Reform.
78. External Audit is carried out though the office of the independent Auditor General
which has the following mission statement “to continue to be a respected, agile, merit-based
and ethically transparent institution dedicated to assuring the productive stewardship of the
investments of taxpayers and other stake-holders, and safe-guarding of the citizen's interest in
the public sector." The Audit Service Act of 1998 is the initial legal basis for External Audit
and the Government Budgeting and Accountability Act 2005 also outlines roles and
responsibilities.
79. Under the 2005 Act: “the Auditor-General shall, within twelve months of the end of
the immediate preceding financial year submit his report to Parliament and shall, in that
report, draw attention to irregularities in the accounts audited and to any other matter which
in his opinion ought to be brought to the notice of Parliament.”
80. “Parliament shall consider the report of the Auditor-General and either refer it to the
Public Accounts Committee or any other committee in the public interest, to deal with any
matters arising there from and such committee shall review the Auditor-General’s report and
publish its own report.” The practice is that the Public Accounts Committee of Parliament
issues its own report to the House on the ASSL Report.
81. There is an active Non State Actors (NSA) group that provides oversight to PFM
relating to budget management, accounting and management in the use of public funds.

10
Section 3: Assessment of the PFM Systems, Processes and
Institutions
3.1 Budget credibility
PI-1 Aggregate expenditure out-turn compared to original approved budget
(i) The difference between actual primary expenditure and the originally budgeted
primary expenditure (i.e. excluding debt service charges, but also excluding externally
financed project expenditure).
Aggregate Government Expenditure Million Leone
(excluding debt servicing and donor funded projects)8
Budget Actual +,- %
2010 1,138,339.52 1,488,282.83 350,078.1 30.7%
2011 1,371,167.82 1,594,971.9 318,835.4 16.3%
2012 1,754,034.6 2,169,121.4 300,814.4 23.7%
Source: Ministry of Finance; Budget Bureau/IFMIS
The deviations shown above between actuals and budgeted reflect a period in Sierra Leone
initiated by optimistic growth estimates of 51% for 2012 made in 2010.9
Much of the over-
expenditure was accounted for by domestic capital expenditures. The erroneous growth
figure initiated the start of a large scale domestically financed capital investment programme
(in particular road building), which was of a multiyear nature. It was not until 2013 that expenditures were reined in as evidenced by a provisional fall in over-expenditure to less than
8%.
Score D: the deviation from budget has exceeded 15% in all of the 3 review years
2014 Score and PEFA Scoring
Criteria met (scoring Method M1)
2010 Score
PI-1 Aggregate
expenditure out-turn
compared to
original approved
budget
Overall Score: D.
• Dimension (i) Score D: The
deviation from budget has
exceeded 15% in all of the 3
review years
Overall Score: B
• Dimension (i) Score B
The deterioration in overall budget credibility since 2010 has been triggered by over-
optimistic estimates of growth in 2010 and therefore future revenue, as noted above.
PI-2. Composition of expenditure out-turn compared to original approved budget
(i) Extent of the variance in expenditure composition during the last three years,
excluding contingency items.
8 2013 figures were not used for the assessment as they were still not finalised but remained estimates, with
some ministry expenditures still not verified. 9 These growth estimates were corroborated by the IMF and were made on the assumption that iron ore exports
would increase dramatically. Unfortunately adverse weather conditions impacted on expected production and
revenues were further dampened by a fall in the international price of iron ore.

11
The budgeted and actual expenditure data (excluding interest and donor funded projects) and
the variances in PI-1 above are as follows
Year Total expenditure
deviation (PI-1)
Total expenditure
variance Contingency Share of the budget
2010 30.7% 24.1% 3.0%
2011 16.3% 20.4% 2.3%
2012 23.7% 14.2% 3.0%
These variances have been derived from the 20 largest voted expenditures in each year with
the rest grouped together to form a twenty-first category. Detailed calculations are presented
below in the annex to indicator 2.
Score: D. Variance in expenditure composition has exceeded 15% in 2 of the last 3 years
(ii) The average amount of expenditure actually charged to the contingency vote
over the past 3 years.
As can be seen in the table above, the contingency vote actually charged for the past 3 years
has been 3%, 2.3% and 3% for 2010, 2011 and 2012 respectively. This results in an average
of 2.77% for the review period. Whilst this is encouraging, it should also be noted that the
miscellaneous budget line is routinely overspent e.g. in 2013 it was budgeted at Leone 750
million and the estimated outturn is Leone 15 billion.
Score: A. Actual expenditure charged to the contingency vote has been an average of 2.77%
over the past 3 completed years.
2014 Score and PEFA Scoring Criteria
met (scoring Method M1)
2010 Score
PI-2. Composition of
expenditure
out-turn
compared to
original
approved
budget
Overall Score: D+
• Dimension (i) Score: D Variance in
expenditure composition has
exceeded 15% in 2 of the past 3
years
• Dimension (ii) Score: A. Actual
expenditure on the contingency
vote has averaged 2.77% over the
past 3 years
Overall Score: C
• Dimension (i) Score C
Dimension (i) is roughly comparable between 2010 and 2014. Any deterioration in the score
is accounted for by the overall overspending in PI-1, and the subsequent attempts to reign in
expenditures in various sectors resulting in multiple virements. It is expected that
improvements will be seen in 2013.

12
Annex to PI-2
Table 1
Data for year = 2010
Administrative Or
Functional Head
Budget
Actual
Adjusted
Budget
Deviation
Absolute
Deviation
Percent
301 Ministry of Education,
Science & Technology -
Including Teachers
230,070.26
237,290.26
294,724.6
-57,434.4
57,434.4
19.5%
201 Ministry of Defence
91,118.07
98,040.12
116,724.1
-18,684.0
18,684.0
16.0%
408 Ministry of Works
Housing and Infrastructure
83,818.43
147,434.65
107,373.1
40,061.6
40,061.6
37.3%
701 Grants to Local Councils
76,732.55
95,866.51
98,295.9
-2,429.4
2,429.4
2.5%
304 Ministry of Health and Sanitation
74,830.13
104,894.79
95,858.9
9,035.9
9,035.9
9.4%
206 Sierra Leone Police
64,815.86
68,036.79
83,030.4
-14,993.6
14,993.6
18.1%
411 Transfer to Road
Maintenance Fund
57,285.20
51,972.40
73,383.5
-21,411.1
21,411.1
29.2%
406 Ministry of Energy and
Power/Water Resources
55,036.52
183,194.66
70,502.9
112,691.8
112,691.8
159.8%
128 Ministry of Foreign
Affairs & International Co-
operation
51,758.83
66,625.19
66,304.1
321.1
321.1
0.5%
401 Ministry of Agriculture and Food Security
39,436.81
35,996.97
50,519.3
-14,522.4
14,522.4
28.7%
110 Office of the President
28,698.17
28,287.29
36,762.9
-8,475.6
8,475.6
23.1%
342 Contributions to Social 33,882.9 803.5 803.5 2.4%

13
Security 26,449.90 34,686.35
130 National Revenue Authority
25,104.70
24,983.30
32,159.6
-7,176.3
7,176.3
22.3%
129 Ministry of Finance and
Economic Development
23,286.75
34,300.10
29,830.8
4,469.3
4,469.3
15.0%
341 Pensions, Retiring
Allowances and Gratuities
21,128.71
34,722.26
27,066.3
7,656.0
7,656.0
36.2%
101 Charged Emoluments
14,050.70
17,552.08
17,999.2
-447.1
447.1
3.2%
207 Prisons Department
13,935.08
14,525.78
17,851.1
-3,325.3
3,325.3
23.9%
404 Ministry of Transport and Aviation
5,812.50
2,338.24
7,445.9
-5,107.7
5,107.7
87.9%
116 Parliament
9,912.62
11,485.05
12,698.3
-1,213.2
1,213.2
12.2%
134 National Electoral Commission
10,723.53
12,655.29
13,737.1
-1,081.8
1,081.8
10.1%
21 (= sum of rest)
131,302.30
149,463.80
168,200.9
-18,737.1
18,737.1
14.3%
allocated expenditure
1,135,307.62
1,454,351.88
1,454,351.9
0.0
350,078.1
contingency
3,031.90
33,930.95
total expenditure 1138339.522 1488282.83
overall (PI-1) variance 30.7%
composition (PI-2) variance 24.1%
contingency share of budget 3.0%
Table 2
Data For Year = 2011

14
Administrative Or
Functional Head
Budget
Actual
Adjusted
Budget
Deviation
Absolute
Deviation
Percent
301 Ministry of Education,
Science & Technology -
Including Teachers
244,125.05
314,804.60
279,882.8
34,921.8
34,921.8
12.5%
201 Ministry of Defence
110,328.24
110,204.60
126,488.3
-16,283.7
16,283.7
12.9%
408 Ministry of Works
Housing and Infrastructure
97,575.35
182,622.10
111,867.5
70,754.6
70,754.6
63.2%
701 Grants to Local Councils
103,446.49
90,008.40
118,598.6
-28,590.2
28,590.2
24.1%
304 Ministry of Health and Sanitation
118,851.99
134,998.20
136,260.6
-1,262.4
1,262.4
0.9%
206 Sierra Leone Police
71,235.84
79,419.10
81,670.0
-2,250.9
2,250.9
2.8%
411 Transfer to Road
Maintenance Fund
64,800.00
12,282.20
74,291.4
-62,009.2
62,009.2
83.5%
406 Ministry of Energy and
Power/Water Resources
95,686.49
104,077.70
109,702.0
-5,624.3
5,624.3
5.1%
128 Ministry of Foreign Affairs & International Co-
operation
57,346.93
69,255.40
65,746.7
3,508.7
3,508.7
5.3%
401 Ministry of Agriculture and Food Security
33,862.79
31,625.40
38,822.8
-7,197.4
7,197.4
18.5%
110 Office of the President
29,754.32
32,159.80
34,112.5
-1,952.7
1,952.7
5.7%
342 Contributions to Social Security
34,217.02
48,607.60
39,228.9
9,378.7
9,378.7
23.9%
130 National Revenue Authority
33,053.10
26,801.70
37,894.5
-11,092.8
11,092.8
29.3%
129 Ministry of Finance and 25,763.3 4,287.7 4,287.7 16.6%

15
Economic Development 22,471.82 30,051.00
341 Pensions, Retiring
Allowances and Gratuities
28,050.08
32,588.70
32,158.7
430.0
430.0
1.5%
101 Charged Emoluments
14,753.83
25,551.20
16,914.9
8,636.3
8,636.3
58.5%
207 Prisons Department
14,592.52
16,817.60
16,729.9
87.7
87.7
0.6%
404 Ministry of Transport and Aviation
4,787.29
32,900.60
5,488.5
27,412.1
27,412.1
572.6%
116 Parliament
10,960.26
12,332.00
12,565.6
-233.6
233.6
2.1%
134 National Electoral Commission
24,403.49
22,603.40
27,977.9
-5,374.5
5,374.5
22.0%
21 (= sum of rest)
149,721.43
154,105.60
171,651.6
-17,546.0
17,546.0
11.7%
allocated expenditure
1,364,024.33
1,563,816.90
1,563,816.9
0.0
318,835.4
contingency
7,143.49
31,155.00
total expenditure 1371167.815 1594971.9
overall (PI-1) variance 16.3%
composition (PI-2) variance 20.4%
contingency share of budget 2.3%
Table 3
Data For Year = 2012
Administrative Or
Functional Head
Budget
Actual
Adjusted
Budget
Deviation
Absolute
Deviation
Percent
301 Ministry of Education,
Science & Technology -
Including Teachers
384,739.80
449,163.30
469,119.5
-19,956.2
19,956.2
4.3%

16
201 Ministry of Defence
118,783.33
124,473.50
144,834.4
-20,360.9
20,360.9
14.1%
408 Ministry of Works
Housing and Infrastructure
165,822.71
248,058.40
202,190.3
45,868.1
45,868.1
22.7%
701 Grants to Local Councils
98,105.30
127,116.20
119,621.4
7,494.8
7,494.8
6.3%
304 Ministry of Health and Sanitation
107,481.59
140,720.60
131,054.1
9,666.5
9,666.5
7.4%
206 Sierra Leone Police
93,289.89
97,338.80
113,749.9
-16,411.1
16,411.1
14.4%
411 Transfer to Road
Maintenance Fund
44,307.00
17,860.40
54,024.2
-36,163.8
36,163.8
66.9%
406 Ministry of Energy and
Power/Water Resources
86,777.04
122,435.00
105,808.7
16,626.3
16,626.3
15.7%
128 Ministry of Foreign
Affairs & International Co-
operation
69,543.96
68,847.10
84,796.1
-15,949.0
15,949.0
18.8%
401 Ministry of Agriculture and Food Security
33,936.82
38,049.90
41,379.7
-3,329.8
3,329.8
8.0%
110 Office of the President
37,898.64
45,112.00
46,210.4
-1,098.4
1,098.4
2.4%
342 Contributions to Social Security
44,848.44
75,533.90
54,684.4
20,849.5
20,849.5
38.1%
130 National Revenue Authority
30,771.20
30,471.10
37,519.8
-7,048.7
7,048.7
18.8%
129 Ministry of Finance and
Economic Development
26,331.41
35,404.80
32,106.3
3,298.5
3,298.5
10.3%
341 Pensions, Retiring
Allowances and Gratuities
27,600.00
50,209.40
33,653.1
16,556.3
16,556.3
60.0%
101 Charged Emoluments
36,240.25
40,085.30
44,188.3
-4,103.0
4,103.0
11.3%
207 Prisons Department 24,468.7 -2,643.8 2,643.8 13.2%

17
20,067.52 21,824.90
404 Ministry of Transport and Aviation
11,538.92
11,798.60
14,069.6
-2,271.0
2,271.0
19.7%
116 Parliament
13,857.68
13,920.60
16,896.9
-2,976.3
2,976.3
21.5%
134 National Electoral Commission
88,651.00
89,998.50
108,093.6
-18,095.1
18,095.1
20.4%
21 (= sum of rest)
194,530.79
267,241.80
237,194.6
30,047.2
30,047.2
15.4%
allocated expenditure
1,735,123.28
2,115,664.10
2,115,664.1
0.0
300,814.4
contingency
18,911.31
53,457.30
total expenditure 1754034.598 2169121.4
overall (PI-1) variance 23.7%
composition (PI-2) variance 14.2%
contingency share of budget 3.0%

18
PI-3. Aggregate revenue out-turn compared to original approved budget.
(i) Actual domestic revenue collection compared to domestic revenue estimates in the
original, approved budget.
Outturn and budgeted revenue data for 2010, 2011, 2012 and 2013 (provisional) are
presented in the table below. Actual revenues are higher than that forecast in the budget in
each of the three review years. There is an improvement in the 2013 provisional figures.
Central Government Revenue (Leone Million)
Budget Outturn +,- %
2010 844,110.13 1,007,626.2
5 163,516.1
2 119.4%
2011 1,156,570.00 1,462,099.8
6 305,529.8
6 126.4%
2012 1,606,931.70 1,869,204.8
3 262,273.1
3 116.3%
2013* 2,066,076.00 2,318,243.2
0 252,167.2
0 112.2%
Source: Ministry of Finance; Budget Bureau / IFMIS
*Provisional figures
Explanations for the increases in revenues above estimates include: the introduction of GST
(akin to VAT) in 2010 which was not budgeted for. In 2011 increases in mining revenues
explained 45% of the overestimation and mining companies (in particular African Minerals
and London Mining both involved in iron ore extraction) accounted for more of the
overestimate as their employees increased and therefore the amount of Personal Income Tax
paid. In 2012, if the Le107 billion from petroleum signature bonuses and Le73 billion from
Sierra Rutile (both one-off revenues), and Le76 billion raised from the restoration of the fuel
pricing formula were to be removed from the 2012 collection (i.e. Le1,869 billion-Le256
billion = Le1,613), the total domestic revenue would have been Le1,617 billion, only 0.4%
above the original budgetary target of Le1,606 billion.
It should be noted that there remains a degree of uncertainty regarding the data in that the AG
reports of 2010 indicated “uncertainly over domestic revenue disclosed” and in 2011 there
was failure to give an opinion as there was insufficient audit evidence provided to form an
opinion.
Again, it can be seen that the degree of overestimate has been reduced in 2013.
Annex to PI-3 Table 3 shows the breakdown of tax revenue over the past four years (Le
Millions)
Category 2009 2010 2011 2012
Le M % Le % Le % Le %
Domestic
Taxes
213,043 30.4 549,388 57.5 860,599 60.2 1,122,009 59.0
Customs &
Excise
419,191 59.9 322,818 33.8 283,334 19.8 341,258 18.0
Non Tax 68,094 9.7 83,456 8.7 284,848 20.0 439,508 23.0

19
Revenue
Total 700,328 100.0 955,662 100.0 1,428,781 100.0 1,902,775 100.0
Source: 2011 NRA Annual Report & Financial Statements 2010, 2011 & 2012(unaudited)
Domestic taxes have displaced Customs and Excise levies as the largest domestic revenue
source. Domestic taxes have moved from 30.4% of total revenue in 2009 to 60.2% in 2011
and 59.0% in 2012 with Customs and Excise levies moving from 59.9% in 2009, to 18% of
the total in 2012, ranking it below Non-Tax Revenue for the 2011 and 2012 respectively.
This increase in revenue collections is no doubt attributable to economic growth. The ratio of
revenue to gross domestic product (GDP) is used by some experts as a crude indicator of tax
effort or performance. The tax-to-GDP ratio is an economic measurement that compares the
amount of taxes collected by a government to the amount of income that country receives for
its products. However, as mentioned above, the reliability of revenue figures is questionable.
Score D: Actual domestic revenue collection was above 116% of budgeted domestic revenue
estimates in all of the last three years.
Score 2014 and PEFA Scoring
Criteria met (Scoring Method M1)
Score 2010
PI-3. Aggregate
revenue out-turn
compared to
original approved
budget.
Overall Score: D.
• Dimension (i) Score D: Actual
domestic revenue collection was
above 116% of budgeted
domestic revenue estimates in all
of the last three years
Overall Score: C
• Dimension (i) Score C
The deterioration in revenue forecasting since 2010 can be largely explained by windfall
gains as noted above. The 2010 review period saw overestimates of revenue. Sierra Leone’s
estimates are particularly susceptible to changes in royalty payments in the extractive
industry sector, given its narrow economic base.
PI-4. Stock and monitoring of expenditure payment arrears.
(i) Stock of expenditure payment arrears (as a percentage of actual total expenditure for
the corresponding fiscal year) and any recent change in the stock.
Le Million 2011 (end) 2012 (end) 2013 (end)
Arrears 13,187 11,312 10,419
Expenditure 1,714,743* 2,201,984* 2,208,412*
% 0.77 0.51 0.47
Source: Public Debt Management Division/Audited Accounts - *MoFED Budget Bureau
estimates
Not only has the stock of arrears been kept under 1% of expenditure in recent years, the stock
has also been decreasing over recent years, as seen in the table above, as a result of a
prioritisation of the eradication of arrears by GoSL.

20
It should be noted, however, that the definition of arrears in Sierra Leone remains a grey area.
Arrears are only verified by the AG at year end and so it is possible that potential arrears in
fact may not be registered as such until year end. Certainly unpaid cheques at the BoSL
represent a significant proportion of expenditure and other calculations of arrears10
have
taken these unpaid cheques into account and perhaps represented a more accurate picture of
the non-transparent financing that one would expect during a review period that has
experienced significant over expenditure.
Score A: The stock of arrears was under 2% of total expenditure at the end of 2013
(ii) Availability of data for monitoring the stock of expenditure payment arrears.
The significant build-up of arrears since the end of the war 10 or so years ago has been
addressed as far as possible. Arrears include domestic payment arrears, forex arrears and
arrears to ex-diplomats. Figures on the stock of arrears are in the first instance generated by
the IFMIS and then subject to a verification exercise by the AG carried out annually. Any
arrears not entered by MDAs into the IFMIS are not captured by the PDMD which is entirely
possible as IFMIS has not been fully rolled out to MDAs. In Sierra Leone, arrears are not
classified as such unless verified by the AG. Commitments not honoured as a result of non-
availability of cash are rolled over quarter by quarter for payment with the final quarter
payments being sufficient to prevent any accumulation of arrears into the following financial
year. As a result the stock has been consistently falling in recent years.
An age profile of arrears can be determined on a one by one basis from the IFMIS. However
an overall record of the age profile is not available. Current arrears are held on an excel
spreadsheet in the MoFED Public Debt Management Division.
Score B: Information on arrears has been produced through a verification exercise but may
not be complete.
Score 2014 and PEFA Scoring Criteria
met (scoring Method M1)
Score 2010
PI-4. Stock
and
monitoring
of
expenditure
payment
arrears.
Overall Score B+
• Dimension (i) Score: A The stock of
arrears was under 2% of total
expenditure at the end of 2013
• Dimension (ii) Score: B Information
on arrears has been produced
through a verification exercise but
may not be complete.
Overall Score D+ • Dimension (i) Score: D
• Dimension (ii) Score: C
10
The 2013 Performance Assessment Framework calculated arrears as 7.6% of expenditure including unpaid
cheques. The IMF (Article IV Report, October 2013) has indicated that "The larger-than programmed deficits
were financed with: (i) direct financing from the Bank of Sierra Leone (BoSL) in 2010; (ii) unpaid bills to
domestic suppliers in 2011 and; (iii) over-borrowing from the government securities market, as well as
accumulation of significant unpaid bills to domestic suppliers in 2012."
21
The improvement in the stock of arrears since 2010 reflects the continued payment of arrears
built up during the civil war. However, it is feared that the accumulation of unpaid bills
during the review period would constitute a significant stock of arrear if verified.
Improvements to verifying arrears reflect the eficiency of the AG.
3.2 Comprehensiveness and Transparency
PI-5. Classification of the budget
(i) The classification system used for formulation, execution and reporting of the central
government’s budget.
The classification system and chart of accounts used by the IFMIS for formulation, execution
and reporting of the central government’s budget uses GFS/COFOG compliant classification.
Reporting uses GFS 2001. However for formulation and execution GFS 1986 is used.
The revenue and expenditure accounts use a 27-digit code broken down into: organisation,
fund source, PRSP activity/project code, location, and object (nature of revenue or
expenditure). This system was introduced together with the IFMIS, but then revised in 2006
to align the budget with the PRSP. It is still the case that activity/project codes are used to
generate poverty reducing and MDG expenditure information.
IFMIS is capable of producing functional and sub-functional categories consistent with GFS
2001 Chart of Accounts by way of “bridging” software. Nevertheless, the functional
classification is not used in budget documents and instead poverty related expenditures are
used.
As noted in the 2010 PEFA, the standard requirement for all countries is now GFSM 2001.
The IFMIS can apply GFSM 2001 for cash basis accounts. Using the functional
classification as well as the poverty related expenditures would give an A score even using
GFS 1986, though it is recommended that GFSM 2001 be an objective when the
classification system is adjusted to attain an “A” score.
2014 Score and PEFA Scoring Criteria
met (scoring Method M1)
2010 Score
PI-5. Classification
of the budget
Overall Score: C. Dimension (i) Score: C The budget
formulation and execution is based on
administrative and economic using GFS
Standards or a standard that can produce
consistent documentation according to
those standards.
Overall Score: C
Dimension (i) Score: C
No change has been noted since 2010 despite similar recommendations being made at that
time to improve to an “A”
PI-6. Comprehensiveness of information included in budget documentation.
(i) Share of listed information in the budget documentation most recently issued by the
central government (in order to count in the assessment, the full specification of the
information benchmark must be met).
Score C.: GFS/COFOG standards are being used, but only economic and administrative
categories.

22
The Annual Budget Speech and the Estimates of Revenues and Expenditures along with the
previous two years actual and budget and the current years provisional outturn are the
documents which are submitted to parliament for scrutiny and approval.
The following elements are included in the Budget Documentation.
Element Location
1. Macro-economic assumptions, including at least estimates
of aggregate growth, inflation and exchange rate.
Yes Budget Speech and
Estimates
2. Fiscal deficit, defined according to GFS or other
internationally recognized standard.
Yes Budget Speech and
Estimates
3. Deficit financing, describing anticipated composition. Yes
4. Debt stock, including details at least for the beginning of
the current year.
No
5. Financial Assets, including details at least for the beginning
of the current year.
No
6. Prior year’s budget outturn, presented in the same format as
the budget proposal.
Yes in 2 volumes Budget
Speech and Estimates
7. Current year’s budget (either the revised budget or the
estimated outturn), presented in the same format as the budget
proposal.
Yes in 2 volumes Budget
Speech and Estimates
8. Summarized budget data for both revenue and expenditure
according to the main heads of the classifications used (ref.
PI-5), including data for the current and previous year.
Yes Budget Speech and
Estimates
9. Explanation of budget implications of new policy
initiatives, with estimates of the budgetary impact of all major
revenue policy changes and/or some major changes to
expenditure programs.
Yes
Score A: Seven of the nine information benchmarks are used.
Score 2014 and PEFA Scoring
Criteria met (scoring Method
M1
Score 2010
PI-6. Comprehensiveness of
information included in
budget documentation.
Overall Score:A.
• Dimension (i) Score: A
Recent budget documentation fulfills 7 of
the 9 information
benchmarks.
Overall Score: A •Dimension (i) Score: A
Interestingly, both Debt Stock and Financial Assets information was included in Budget
documentation in 2009. However, qualifications in AG reports for both items has rendered
the information less than reliable and so neither item is now included in budget documents.
One improvement since 2010 is that there is now an explanation of the budget implications of
new policy initiatives e.g. the establishment of new MDAs after the 2012 election. Although
there is a net decrease of 1 type of budget information, the “A” score is maintained.

23
PI- 7 Extent of Unreported Government Operations.
(i) The level of extra budgetary expenditure (other than donor funded projects) which is
unreported i.e. not included in fiscal reports.
Sierra Leone has about 130 AGAs asked to report to the Treasury and Other Government
Accounts Service (TOGAS) in the Accountant General’s Department of the MoFED.
Quarterly data is collected for:
• Projects administered by Project Implementation Units (PIUs)11
• Subvented agencies12
• Departmental revenues not brought into account 13
• Local Councils (though this work is still under development
The TOGAS has seen some recent staffing changes and now comprises four officials – the
Head of Unit, a deputy and two accountants who all joined the unit since May 2011. The
TOGAS data capture system comprises a spreadsheet and database into which printed
statements received from the organisations to be monitored and bank balance details,
received from the BoSL and commercial banks, are manually entered. This is the raw data on
which the Unit’s reconciliation of monetary data14
and fiscal15
data is based.
TOGAS reports reconciliations of monetary and fiscal data to the Accountant General on a
quarterly basis.
Coverage has increased in recent years as a result of increased capacity and also sanctions
since 2011 (withholding of transfers) applied to subvented agencies which do not report.
However, these sanctions do not apply to self-financing AGAs (e.g. Sierra Leone Road
Transport Authority), which still do not generally report. TOGAS has also developed an
annual action plan.
There is not a regular discipline of the required agencies submitting the schedules and bank
statements on time. Ongoing problems remain in obtaining bank statements in respect of
those agencies using commercial bank accounts. The proposed STA, together with a 100%
rollout of the IFMIS and a clear legal mandate would improve reporting.
The extent to which data is regularly introduced into the accounts of the AGD and then the
fiscal reporting of the Budget Bureau is not evident.
Extra-budgetary Expenditure 201216
GOSL
BudgetedTransfer
Total Extra-
budgetary
Expenditure
Under/(Over)Expenditure
810,293,102,503.00 (190,991,494,602.00)
11 Donor funded projects which go through the MoFED should be captured by the TOGAS analyses 12
Autonomous government agencies reporting their accounts to the AGD 13
Those not collected by the NRA 14
Independent bank balances received from BoSL and some commercial banks and copies of bank statements
provided by some PIU’s and subvented agencies 15
The statements of income and expenditure received on a quarterly basis from PIU’s and subvented agencies 16
Those AGAs that did not report in 2012 included: Strategy and Policy Unit, National Social Security & Insurance Trust, Sierra Leone Road Transport Authority, National Agricultural Response Programme, National
Telecommunications, Sierra Leone Roads Authority, Sierra Leone Broadcasting Corporation, , Extractive
Industry Transparency Initiative

24
521,493,218,712.00
Given that total government expenditure amounted to Le Million 2,201,984 in 2012 it is
possible to calculate that unreported expenditure amounted to Le 810,293 million or at least
36% of expenditure.
Dimension (ii) Income /expenditure information on donor-funded projects which is
included in fiscal reports.
The TOGAS collects only partial information in respect of projects managed by PIUs. The
record of projects managed by PIUs held by the TOGAS as at February 2014 showed 46
projects. A list obtained from DACO based on the DAD’s database indicated 174 projects in
their system and an estimate of over 300 projects in total.
This represents increased coverage since 2010 but is still far from comprehensive. TOGAS
targets projects that are more likely to report to them and so does not attempt to achieve
comprehensive coverage.
MPD has responsibility for the reporting of loan financed projects and covers 100% of those
passing through MoFED. DACO reports that loans passing through MDAs represent about
10% of loan financed operations, though they do not capture them.
Score D↑: Only about 90% of loan financed operations are captured by DACO
Score 2014 and PEFA Scoring
Criteria met (Scoring Method M1).
Score 2010
PI-7. Extent of
unreported
government
operations
Overall: Score D
• Dimension (i) Score: D. The level of unreported expenditure is
over 10% of the total budget
• Dimension(ii) Score: D↑.
Information on donor-financed
projects included in fiscal reports
has improved but is still seriously
deficient and does not even cover
all loan financed projects.
Score: Not Rated
• Dimension (i) Score:
NR
• Dimension (ii) Score:
D
Major improvements have been made to the reporting of other government accounts enabling
a score to be made for the first time. Although DACO is collecting reports from a greater
number of projects, it still does not capture all loan financed operations.
PI-8. Transparency of Inter-Governmental Fiscal Relations
(i) Transparent and rules based systems in the horizontal allocation among SN
governments (ATUs) of unconditional and conditional transfers from central
government (both budgeted and actual allocations).
Inter-government fiscal relations are regulated by The Local Government Act, 2004 (Act No
1 of 2004) (LGA) and the supporting Statutory Instrument which provides the Regulations.
Every year, local councils receive a transfer for both the discharge of the devolved functions;
and towards their administrative costs. The total amount of annual grants to local councils
Score D: The level of unreported expenditure is over 10% of the total budget

25
each year forms part of the national budget and is published by Government Notice and in the
national newspapers.
Each year a seminar is held with all relevant stakeholders (including NSAs and numbering
over 100 persons) to determine the weightings for the forthcoming budget cycle. Examples
of weightings are population size and level of infrastructure. The seminar was held in
October 2013 for the 2014 FY budget. This approach uses allocation criteria and criteria
weights to determine the distribution of grants across the 19 local governments. The type and
number of criteria has depended on the kind of grants to be transferred and the function to
which it is to service. The factors differ from devolved function to devolved function, but
each of the formulae incorporates the principles of equity. The formulae are revised annually
and updated as necessary. In 2010 to 2012, the formulae and allocation to individual councils
for the upcoming budget were published in February of the respective year.
Two components of the vertical resource pool are allocated – covering recurrent and
development components.
Score A: The rules for transfers to local councils are transparent.
(ii) Timeliness of reliable information to Sub National (SN) governments (Local
Councils (LC)) on their allocations from central government for the coming year.
The LGA states that every local council has to prepare a budget for each financial year three months before the beginning of that year. This does not occur. The BCC which includes a reliable estimate of transfers to LCs has been issued in September in recent years, requesting
a budget to be submitted by 30th
September. Invariably, the budget is not submitted until much later. LGFD recognises that not enough time is provided and informs the LCs that the
budget should arrive before the end of the FY. This is again not necessarily respected as
there is no incentive for councils to do so, in particular as transfers are made in a “reliably
late” manner.
The above process covers the recurrent budget for LCs. However, development grants are
not determined until after approval by Parliament – usually after January 1st, though these are
not devolved.
It should also be noted here that whilst the amounts of the transfers budgeted are usually
adhered to, the timing of the transfers has proved “reliably late” over the past few years, to
the extent that actual transfers have been made biannually rather than quarterly. Plans are in
process to formalise a biannual transfer and thereby try to adhere to budgeted transfer times.
Score D: Information on transfers is not provided in time for Local Councils to prepare their
budgets.
(iii) Extent to which consolidated fiscal data (at least on revenue and expenditure) is
collected and reported for general government according to sectoral categories.
Local councils are required by the LGA to report monthly to the LGFD, quarterly and
annually and they do. The information in the financial statements provides information by
devolved service and can allow a consolidated general government report. This information
from individual councils was consolidated by the LGFD in February 2014 from the FY 2012
LC reports.

26
Score B: Annual statements from councils are consolidated into a report within 18 months of
the end of the fiscal year.
Score 2014 and PEFA Scoring Criteria
met (Scoring Method M2).
Score 2010
PI-8. Transparency of
Inter-
Governmental
Fiscal Relations
Overall: Score B
• Dimension (i) Score: A. The
horizontal allocation of almost all
transfers (at least 90% by value)
from central government is
determined by transparent and rules
based systems.
• Dimension (ii) Score: D.
Information on transfers,
particularly for the Development
budget, is not provided in time for
Local Councils to prepare their
budgets.
• Dimension (iii) Score: B. Fiscal
information (ex-ante and ex-post)
that is consistent with central
government fiscal reporting is
collected for 90% (by value) SN
government expenditure and
consolidated into annual reports
within 10 months of the end of the
fiscal year.
Overall: Score A
Dimension (i) Score: A
Dimension (ii) Score: A
Dimension (iii) Score: A
Whilst the transfer is still determined in a transparent fashion, it is now not communicated to
LCs in time for budget preparation, and not at all with respect to the development budget
resulting in deterioration from an “A” to “D” score at dimension (ii). MoFED’s LGFD has
not prioritised the consolidation of LC expenditures into a report in recent years though a late
report was made during the assessment mission mitigating the decrease in score from “A” to
“B” for dimension (iii).
PI-9. Oversight of aggregate fiscal risk from other public sector entities.
(i) Extent of central government monitoring of AGAs and PEs.
The National Commission for Privatisation has oversight responsibilities for 12 PEs. Others
remain under the purview of respective MDAs. Most PE accounts are audited by private
auditing companies. The information generated by the big 5 (accounting for about 95% of the
value of PEs) is satisfactory and their annual statements and audited accounts are timely.
Although capacity exists in the NCP to consolidate reports, including a consolidation of fiscal
risk, this is not carried out either for those PEs under its portfolio or those outside.
The Public Debt Management Division (PDMD) in 2012 conducted a survey of contingent
liabilities in 1217
State owned Enterprises to enable GoSL to record, measure and monitor the build-up of contingent liabilities in some SOEs and develop a database of these contingent
17 These excluded large SOEs such as NASSIT, Sierra Leone Commercial Bank and Rokel Bank
27
liabilities. Exposure was aggregated to Le 248.3 billion, of which Le 84.5 billion was long
term and the balance short term. This represented 13.3% of government revenues. Default
was deemed unlikely. This exercise has not been repeated or widened to include all major
PEs.
Score C: There is no complete consolidated overview of fiscal risk produced in a report.
(ii) Extent of central government monitoring of SN (LCs) governments’ fiscal position.
LCs do not contract loans, though they are entitled to do so with MoFED consent. An
unexpected overdraft run up by Freetown City Council in 2009-10 (without MoFED
knowledge) has been closely monitored and would not be able to be repeated under present
legislation.
The Public Debts Law 2011 required that there should be monitoring of contingent liabilities.
The Public Debt Management Division (PDMD) in 2012 conducted a survey of contingent
liabilities in local councils and confirmed that loans were not taken, though arrears (in
particular to NASSIT) were significant and short term overdrafts sometimes taken to
accommodate expenditures in the light of late CG transfers, which are always paid off in the
short term.
Score A: Local councils have not contracted loans though they are entitled to do so with the
Minister of Finance’s approval. The loan contracted by Freetown City Council is closely
monitored.
Score 2014 and PEFA Scoring
Criteria met (Scoring Method M1).
Score 2010
PI-9. Oversight of
aggregate fiscal
risk from other
public sector
entities
Overall: Score C+
• Dimension (i) Score: C. (i) Most
major AGAs/PEs submit fiscal
reports to central governments at
least annually, but a consolidated
overview is missing or
significantly incomplete.
• Dimension (ii) Score: A. LCs do
not generate fiscal liabilities for
central government and central
government has consolidated
overall fiscal risk into a report in
2012.
Overall: Score C+
Dimension (i) Score: C
Dimension (ii) Score: B
The consolidation of AGA/PE risk remains unsatisfactory, though the PDMD has for the first
time started on this activity for a few PEs and for all local councils resulting in an
improvement in dimension (ii).
PI-10. Public Access to key fiscal information
(i) Number of the listed elements of public access to information that is fulfilled (in
order to count in the assessment, the full specification of the information benchmark
must be met).

28
Public access to key fiscal information is assessed through the six criteria for the indicator as
follows. There has been no change since 2010.
Element Where and when
(i) Annual budget documentation: A
complete set of documents can be obtained
by the public through appropriate means
when it is submitted to the legislature.
Yes. Available from the Government
printers. The budget speech is available on
the day. The estimates are available shortly
afterwards in limited numbers (given its size).
The Budget Speech and summary budget
tables are placed on the MoFED website
shortly after the speech .
(ii) In-year budget execution reports: The
reports are routinely made available to the
public through appropriate means within
one month of their completion.
No. The quarterly releases and actual
expenditures are posted on the MoFED
website, however not within the alloted time.
The January – March expenditure report was
not authorised for posting until 12 May and
January - June six monthly expenditure report
was not authorised for posting until 23rd
August. (iii) Year-end financial statements: The
statements are made available to the public
through appropriate means within six
months of completed audit.
Yes. The unaudited annual Financial Statements are posted on the web and in hard copy. The financial statements are presented by end March of the follwing year i.e 2012 on
31st
March 2013. The audited accounts for
FY 2012 were not available until December
2013.
(iv) External audit reports: All reports on
central government consolidated
operations are made available to the public
through appropriate means within six
months of completed audit.
Yes. The Auditor General posts the audited
financial statements on the web and as a
document.
(v) Contract awards: Award of all contracts
with value above approx. USD 100,000
equiv. are published at least quarterly
through appropriate means.
No. Tenders are published on the official website but only limited information on
awards18
.
(vi) Resources available to primary service
units: Information is publicized through
appropriate means at least annually, or
available upon request, for primary service
units with national coverage in at least two
sectors (such as elementary schools or
primary health clinics).
No. PETS reports used to be published
annually but have not been carried out since
2011. They cover primary schools and
primary health clinics though this covers only
a sample of operations. Some local councils
post transfer information on school and clinic
notice boards, but this is not done
systematically and is more of an ad hoc
nature.19
.
18 Only information on prisons awards is currently posted.
19 As reported by LGFD and validated in SN PEFA 2010. The Bo Council sets a standard that all 19 councils
should follow.

29
Score B: Three of the six listed types of information is made available to the public.
Score 2014 and PEFA Scoring
Criteria met (Scoring Method M1)
Score 2010
PI-10. Public
Access to key
fiscal
information
Overall Score: B.
• Dimension (i) Score: B The
government makes available to the
public 3 of the 6 listed types of
information.
Overall Score: B.
There has been little change to the Public’s access to key fiscal information since 2010, the
only change to note is that PETS are now not carried out on an annual basis.
3.3 Policy-based budgeting
PI-11 Orderliness and participation in the annual budget process
(i) Existence of and adherence to a fixed budget calendar.
There is now a generic budget calendar (as laid out in the 2012 MTEF Guidelines) for the
preparation of the MTEF and Budget as a combined process. The Financial Year runs from
January 1st. The main elements and dates of this Budget calendar are:
Element/Activity Dates Effective
Develop Macro-Fiscal Framework Jan-Feb Yes
Preparation of Budget Framework Paper Mid Feb-
Mid-Apr
Yes
MoFED seeks Cabinet Approval of BFP, Resource
Envelope and ceilings
By May
15th Did not happen until
September
Issuance of Budget Call Circular to MDAs and LCs By May
31st 23/07/13 for MDAs.
Sept 13th
for LCs
MDAs and LCs Submit Strategic Plans and budget
estimates
30/08/13 Partial. MDAs submit
estimates – not all
strategic plans. LCs
much later
Submission of Cabinet Paper on the budget to
Cabinet
By Oct
15th Yes
Appropriation Bill and Finance Bill gazetted by
MoFED
By Oct
10th Yes
Minister of MoFED presents budget to parliament By Oct
31st No. 25/11/13
MDAs and LCs submit their procurement plans to
NPPA & MoFED
By Nov
30th No
Parliament debates and approves the Budget and
passes the Appropriation and Finance Bills into Law
Early Nov – Mid Dec
Yes
Presidential Assent Mid-late
Dec
Yes

30
Score C: An orderly budget calendar exists, but there were substantial delays in its
implementation and many MDAs and LCs do not submit according to the timetable.
(ii) Clarity/comprehensiveness of and political involvement in the guidance on the
preparation of budget submissions (budget circular or equivalent).
The Ministry of Finance determines the ceilings which are sent to the MDAs in the Budget
Call Circular. The Budget Call Circular is not formally sent/presented to Cabinet. Cabinet is
not formally involved in budget preparation until it is sent the Budget Framework Paper (at
beginning of September in 2013). This could result in only 5 weeks for cabinet to review the
budget framework before the budget speech. There are bilateral discussions between the
Minister of Finance and individual ministers regarding their own MDA and its budget, but
this is informal rather than within Cabinet.
Score C: Cabinet review of the budget is limited.
(iii) Timely budget approval by the legislature or similarly mandated body (within the
last three years).
For 2013 the budget was approved after the start of the financial year requiring a Presidential
warrant to allow expenditures to be incurred, thus not adhering to the Government Budgeting
and Accountability Act (GBAA) passed on the 3rd
February 2005. This delay was largely due
to a highly contested election in 2012 which resulted in a cabinet not being formed until
March 2013.
Budget Year Budget Speech Approval by Parliament
2012 25th
Nov 2011 December 2011
2013 21st
Dec 2012 26th
March 2013
2013 (supplementary) 4th
July 2013 4th
July 2013
2014 29th
Nov 2013 December 2013
Source: Budget Bureau, Ministry of Finance
Score C: The legislature has approved the budget before the start of the fiscal year, but a
delay of over two months has happened in one of the last three years.
Score 2014 and PEFA Scoring Criteria met
(Scoring Method M2).
Score 2010
PI-11.
Orderliness
and
participation
in the annual
budget process
Overall Score: C
• Dimension (i) Score: C An annual budget
calendar exists, but is rudimentary and
substantial delays may often be experienced
in its implementation, and allows MDAs so
little time to complete detailed estimates,
that many fail to complete them timely.
• Dimension (ii) Score: C. A budget circular
is issued to MDAs, including ceilings for
individual administrative units or functional
areas. The budget estimates are reviewed
Overall Score: D+
Dimension (i) Score: C
Dimension (ii) Score: C
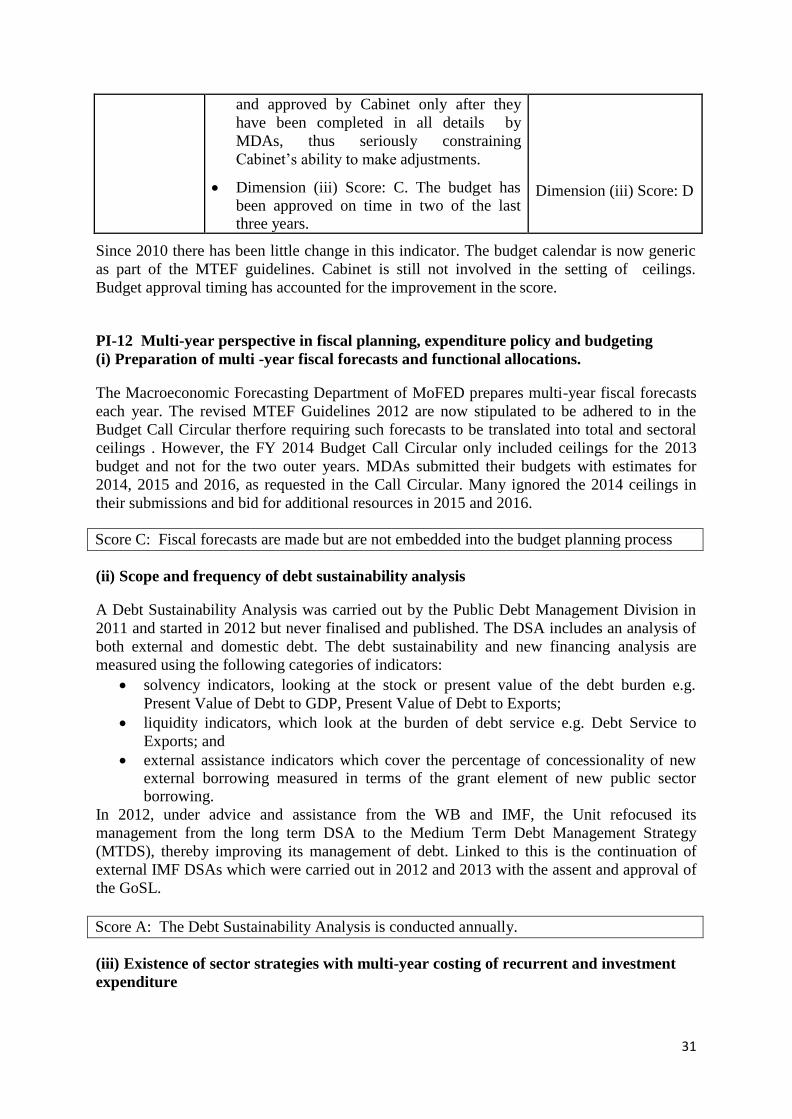
31
and approved by Cabinet only after they
have been completed in all details by
MDAs, thus seriously constraining
Cabinet’s ability to make adjustments.
• Dimension (iii) Score: C. The budget has
been approved on time in two of the last three years.
Dimension (iii) Score: D
Since 2010 there has been little change in this indicator. The budget calendar is now generic
as part of the MTEF guidelines. Cabinet is still not involved in the setting of ceilings.
Budget approval timing has accounted for the improvement in the score.
PI-12 Multi-year perspective in fiscal planning, expenditure policy and budgeting
(i) Preparation of multi -year fiscal forecasts and functional allocations.
The Macroeconomic Forecasting Department of MoFED prepares multi-year fiscal forecasts
each year. The revised MTEF Guidelines 2012 are now stipulated to be adhered to in the
Budget Call Circular therfore requiring such forecasts to be translated into total and sectoral
ceilings . However, the FY 2014 Budget Call Circular only included ceilings for the 2013
budget and not for the two outer years. MDAs submitted their budgets with estimates for
2014, 2015 and 2016, as requested in the Call Circular. Many ignored the 2014 ceilings in
their submissions and bid for additional resources in 2015 and 2016.
Score C: Fiscal forecasts are made but are not embedded into the budget planning process
(ii) Scope and frequency of debt sustainability analysis
A Debt Sustainability Analysis was carried out by the Public Debt Management Division in
2011 and started in 2012 but never finalised and published. The DSA includes an analysis of
both external and domestic debt. The debt sustainability and new financing analysis are
measured using the following categories of indicators:
• solvency indicators, looking at the stock or present value of the debt burden e.g.
Present Value of Debt to GDP, Present Value of Debt to Exports;
• liquidity indicators, which look at the burden of debt service e.g. Debt Service to
Exports; and
• external assistance indicators which cover the percentage of concessionality of new external borrowing measured in terms of the grant element of new public sector borrowing.
In 2012, under advice and assistance from the WB and IMF, the Unit refocused its
management from the long term DSA to the Medium Term Debt Management Strategy
(MTDS), thereby improving its management of debt. Linked to this is the continuation of
external IMF DSAs which were carried out in 2012 and 2013 with the assent and approval of
the GoSL.
Score A: The Debt Sustainability Analysis is conducted annually.
(iii) Existence of sector strategies with multi-year costing of recurrent and investment
expenditure

32
The 2012 MTEF Guidelines requests MDAs to submit sector strategies along with the
budget. These should include key policy developments, service delivery objectives and key
performance indicators. The introduction of activity based budgeting during the review
period has proved difficult for many MDAs in that activities (and outputs and outcomes etc.)
are not well defined.
Sector strategies have been developed in Education, Health, Justice, Security, Energy and
Water, but are financially unconstrained with financing gaps expected to be filled by donor
resources.
Score D: Sector strategies are mostly not fully costed, and where they are they are
unconstrained by budget ceilings
(iv) Linkages between investment budgets and forward expenditure estimates.
The preparation of the Development and Recurrent budgets has been under the Budget
Bureau in the MoFED under the supervision of the Financial Secretary. In 2013 a Public
Investment Management Division was established within the MoFED with a view to improve
Investment management in the light of recent initiatives to fund elements of investment
(particularly the roads sector) from the domestic budget for the first time in recent years. Ths
division is currently under establishment and has not as yet, contributed significantly to
budget planning and management, but is establishing a database of projects sector by sector.
There is little formal linkage between the two budgets. The Development Budget contains
projects of a current as well as of a capital nature and its focus is on source of funding;
donors. No mechanism is in place to link the recurrent cost implications of investments into
forward expenditure estimates.
Score D: Investment and recurrent expenditure are not fully linked.
• Score 2014 and PEFA Scoring Criteria
met (Scoring Method M2).
Score 2010
PI-12. Multi-
year
perspective in
fiscal
planning,
expenditure
policy and
budgeting
Overall Score: C
• Dimension (i) Score: C. Forecasts of
fiscal aggregates (on the basis of the main
categories of economic classification) are
prepared for at least two years on a
rolling annual basis.
• Dimension (ii) Score: A. DSA for external and domestic debt is undertaken
annually.
• Dimension (iii) Score: D. Sector
strategies may have been prepared for
some sectors, but none of them have
substantially complete costing of
investments and recurrent expenditure.
• Dimension (iv) Score: D. Budgeting for
investment and recurrent expenditure are
Overall Score: C
• Dimension (i) Score: C
• Dimension (ii) Score:
A
• Dimension (iii) Score:
D

33
separate processes with no recurrent cost
estimates being shared. • Dimension (iv) Score:
D
There has been little change regarding the multi-year perspective in PFM; though the
establishment of a Public Investment Management Division bodes well for future linkage of
investment and recurrent expenditure.
3.4 Predictability and control in budget execution
PI-13 Transparency of Taxpayer Obligations and Liabilities
(i) Clarity and comprehensiveness of tax liabilities
The main taxes in Sierra Leone are income taxes (including Company Tax) Goods and
Services Tax (GST) which is akin to VAT, Excise Tax and Import Duties.
The 2013 Finance Bill has improved clarity of information to taxpayers as evidenced by the
2013 AG report. However, customs and domestic taxes are still under separate legal
frameworks. A Single Revenue Administration Act has been proposed to streamline all GoSL
revenues. Alongside this is a proposed Extractive Revenues Act to be passed in the coming
year, with a view to making transparent the receipt of revenues from the major increase in
revenues expected from iron ore extraction. Currently these are collected outside of NRA,
but a desk has been established in NRA in readiness for changes proposed in the Act.
The 2011 Consolidated Customs Act has amalgamated the separate Customs and Excise Acts
and brings Sierra Leone into line with international standards (Kyoto convention, HTO
valuation, HS system and World Customs Organisation Conventions). Most regulations have
been completed, though there are some outstanding in draft form. A countrywide
sensitisation of this Act was carried out in 2012.
The Goods and Services Tax (GST) was introduced on 1 January 2010. It currently stands at
15%, and was partially responsible for the underestimate of revenues in 2011.
The National Revenue Authority was created in 2003 and is responsible for both domestic
taxes and Customs. With the GST and Customs Acts, all taxes have a separate, consolidated,
single, and easy-to-follow piece of legislation.
The NRA itself has no discretionary powers. However, despite the Budget Speech indicating
that waivers should be routed through MoFED and Parliament, there has been and continues
to be a culture of exemption - though waivers have decreased by about 23% since 2008.
Details of waivers in recent years are shown in the table below. Between 2010 and2013,
discretionary waivers averaged 2.2% of total domestic revenue, and even dropped to only
0.3% of total domestic revenue in 2013. The President declared the stopping of discretionary
waivers in 2012 which contributed significantly to the notable drop witnessed in 2012 and
2013

34
Total
Duty
Waiver
Discretionary
Waiver
Discretionary
Waiver as %
of Total Duty
Waiver
Total
Domesti
c
Revenue
Discretionary Waiver as
% of Total Domestic
Revenue
2013 453,437 7,505 1.7% 2,318,243 0.3%
2012 589,079 25,538 4.3% 1,873,506 1.4%
2011 585,987 76,427 13.0% 1,462,100 5.2%
2010 268,578 19,544 7.3% 1,007,627 1.9%
Funds for revenues outside of NRA such as Extractive Industries are to be addressed in a new
Act.
Score B: The introduction of the 2011 Consolidated Customs Act and the 2013 Finance Bill
has improved comprehensiveness and clarity, with the exemptions regime now largely under
control.
(ii) Taxpayer access to information on tax liabilities and administrative procedures.
A NRA website exists (www.nra.gov.sl). Documents are available for download (such as
GST registration Application Form, Income Tax returns) and it provides details of relevant
Acts.
There is a Public Affairs and Taxpayer Education Department (PATE) which is responsible
for Stakeholder outreach, including taxpayer education, media relations, publicity,
publications and internal communications. NRA issues up-to-date tax information leaflets
and uses the various forms of the media.
Individual departments also carry out taxpayer education. The Customs Department holds
regular meetings with importers, and the introduction of ASYCUDA has improved
transparency and information to importers. The Harmonised System code on customs tariffs
is widely available.
Score A: The provision of information is up-to-date covering most taxes with a new website
that contains relevant information. This is complemented by active taxpayer education
campaigns.
(iii) Existence and functioning of a tax appeals mechanism.
Section 138 of the Income Tax Act provides for an appeal mechanism. This is a two stage
process whereby objections are first heard by senior managers of the Domestic Tax
Department (there were 8 objections in 2013). Should resolutions not be made at that stage,
an appeal should proceed to a Revenue Appellate Board where the Chair and six
Commissioners are appointed by the President. Finally, the process allows a party who is

35
dissatisfied with decision of the Board to appeal to the High Court, within sixty days of the
decision.
Although the Appellate Board was first provided funds for its functioning in 2007, no appeals
have ever been heard. Members of the British Chamber of Commerce suggested that they
had not heard of this appeals mechanism.
Score D: The independent appeals mechanism exists but is not functioning
Score 2014 and PEFA Scoring Criteria met
(Scoring Method M2).
Score 2010
PI-13 Transparency
of Taxpayer
Obligations
and
Liabilities
Overall Score: B
• Dimension (i) Score: B. Legislation and
procedures for some major taxes are
comprehensive and clear, and discretionary
powers have been significantly reduced..
• Dimension (ii) Score: A. Taxpayers have easy
access to comprehensive, user friendly and up-
to-date information tax liabilities and
administrative procedures for the major taxes.
• Dimension (iii) Score: D. A tax appeals system
of administrative procedures exists but has never been used.
Overall Score: B
• Dimension (i)
Score: C↑
• Dimension (ii)
Score: A
• Dimension (iii)
Score: C↑
The unchanged overall score masks significant improvements in the clarity of legislation and
the limiting of discretionary powers since 2010. The tax appeals system has not deteriorated
but the passage of time has enabled the assessment team to demonstrate that the system is not
functioning as there have been no appeals in the past 4 years.
PI-14 Effectiveness of measures for taxpayer registration and tax assessment
(i) Controls in the taxpayer registration system.
A Tax Identification Number (TIN) is used for all taxes and is needed for a Tax Clearance
Certificate and business registration (required for public procurement tenders), but as yet is
not linked to a business bank account. Registration is accompanied by a guidance interview.
Score B: There is a unique TIN linked to other databases.
(ii) Effectiveness of penalties for non-compliance with registration and declaration
obligations.
Penalties for all domestic taxes are levied for late tax submissions, non-compliance with
GST, and failure to register as a taxpayer. Late returns are forwarded to the NRA Debt
Enforcement Unit after one day. Evidence of payments of penalties suggests that
enforcement is swift and effective.
The payment of penalties into NRA bank accounts does not automatically indicate that the
payment was for a penalty and so after payment clients are expected to go to the NRA with
their bank payment slip for a NRA receipt. Many do not do this, rendering the reconciliation
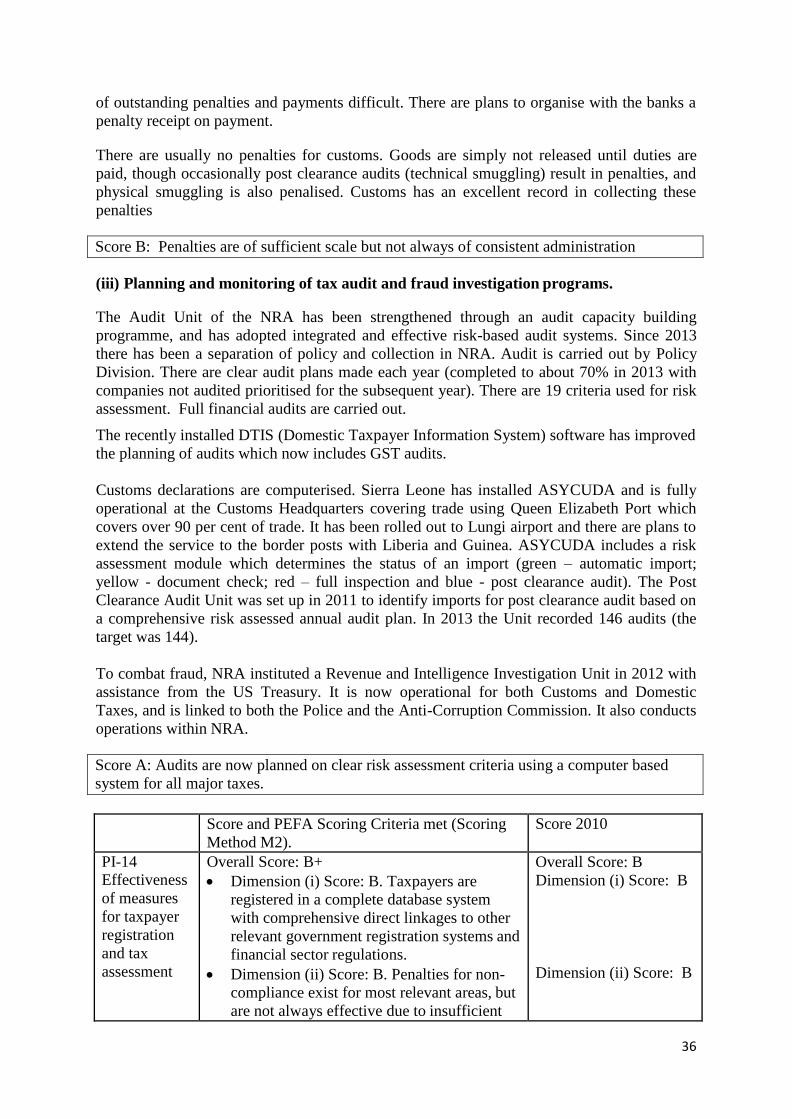
36
of outstanding penalties and payments difficult. There are plans to organise with the banks a
penalty receipt on payment.
There are usually no penalties for customs. Goods are simply not released until duties are
paid, though occasionally post clearance audits (technical smuggling) result in penalties, and
physical smuggling is also penalised. Customs has an excellent record in collecting these
penalties
Score B: Penalties are of sufficient scale but not always of consistent administration
(iii) Planning and monitoring of tax audit and fraud investigation programs.
The Audit Unit of the NRA has been strengthened through an audit capacity building
programme, and has adopted integrated and effective risk-based audit systems. Since 2013
there has been a separation of policy and collection in NRA. Audit is carried out by Policy
Division. There are clear audit plans made each year (completed to about 70% in 2013 with
companies not audited prioritised for the subsequent year). There are 19 criteria used for risk
assessment. Full financial audits are carried out.
The recently installed DTIS (Domestic Taxpayer Information System) software has improved
the planning of audits which now includes GST audits.
Customs declarations are computerised. Sierra Leone has installed ASYCUDA and is fully
operational at the Customs Headquarters covering trade using Queen Elizabeth Port which
covers over 90 per cent of trade. It has been rolled out to Lungi airport and there are plans to
extend the service to the border posts with Liberia and Guinea. ASYCUDA includes a risk
assessment module which determines the status of an import (green – automatic import;
yellow - document check; red – full inspection and blue - post clearance audit). The Post
Clearance Audit Unit was set up in 2011 to identify imports for post clearance audit based on
a comprehensive risk assessed annual audit plan. In 2013 the Unit recorded 146 audits (the
target was 144).
To combat fraud, NRA instituted a Revenue and Intelligence Investigation Unit in 2012 with
assistance from the US Treasury. It is now operational for both Customs and Domestic
Taxes, and is linked to both the Police and the Anti-Corruption Commission. It also conducts
operations within NRA.
Score A: Audits are now planned on clear risk assessment criteria using a computer based
system for all major taxes.
Score and PEFA Scoring Criteria met (Scoring
Method M2).
Score 2010
PI-14 Effectiveness
of measures
for taxpayer
registration
and tax
assessment
Overall Score: B+
• Dimension (i) Score: B. Taxpayers are
registered in a complete database system
with comprehensive direct linkages to other
relevant government registration systems and
financial sector regulations.
• Dimension (ii) Score: B. Penalties for non-
compliance exist for most relevant areas, but
are not always effective due to insufficient
Overall Score: B
Dimension (i) Score: B
Dimension (ii) Score: B

37
scale and/or inconsistent administration.
• Dimension (iii) Score: A. Tax audits and
fraud investigations are managed and
reported on according to a documented audit
plan, with clear risk assessment criteria for
audits in at least one major tax area that
applies self-assessment.
Dimension (iii) Score:
B
Since 2010 the major improvement has been in Tax Audits as an integrated and effective
risk-based audit system has been adopted, together with a separation of policy and collection
in NRA.
PI-15 Effectiveness in collection of tax payments
(i) Collection ratio for gross tax arrears, being the percentage of tax arrears at the
beginning of a fiscal year, which was collected during that fiscal year (average of the last
two fiscal years).
The bulk of arrears has been held by PEs, whether for corporation tax or GST. There are no
arrears on payments on imported items. The collection of arrears has improved over the
review period, in particular as a result of some high visibility cases as the NRA has sought to
shut down PE operations until arrears are paid. It seems that slowly but surely the tradition of
parastatals not paying their full tax burden is at least being addressed from the side of the
NRA. In 2010 an offsetting arrangement20
between government institutions and parastatals
was agreed which paved the way somewhat for all institutions to adhere to their full liabilities
whether tax or utilities invoices.
The NRA has also increased its capacity for arrears collection, in particular after the merger
of the GST and the Income Tax Departments to form the Domestic Tax Department (DTD) in
2011. Within this, restructuring the Large Taxpayers Office was reconstituted and
capacitated. There is a system to collect arrears the day after they are identified, as liabilities
and penalties are communicated to taxpayers, followed up by reminders and telephone calls
and eventually the imposition of sanctions, such as the withdrawal of a tax clearance
certificate and “naming and shaming”.
The status of tax arrears in 2012 and 2013 is shown in the table below.
Tax arrears
Leone
million
Arrears
Jan 1st
–
Dec 31st
2012
Collected
2012
Outstanding
Dec 31st
2012
Arrears
Jan 1st
–
Dec 31st
2013
Collected
2013
Outstanding
Dec 31st
2013
Large
Taxpayers
39,991.2 34,313.3 5,677.9 19,683.2 10,770.9 8,912.3
Small and
medium
taxpayers
3,477.1 1,059.6 2,425.6 8,575.0 1,891.1 6,683.0
Total 43,468.3 35,372.9 8,103.5 28,258.2 12,662.0 15,595.3
Collection 81.4 44.8
20 Some parastatals were owed payments by government budget units e.g. for telecoms and utilities. As a result
they did not pay their full tax burden in lieu of owed monies. This was addressed in 2010 to some extent by an
offsetting arrangement.

38
ratio %
Source: NRA
As can be seen, the amount of arrears has reduced significantly recently. Given that the total revenue of the NRA in 2012 was Leones 1,874,000 million (2013 was Leones 2,213,000
million), and arrears constituted Leones 28,258.2 million on December 31st
2012, the total amount of tax arrears is not significant (1.5% of total tax collections in 2013) in Sierra Leone.
Score: A Tax arrears are less than 2% of total collection – 1.5%
(ii) Effectiveness of transfer of tax collections to the Treasury by the revenue
administration.
In Freetown and Kenema, taxes collected are transferred to the Treasury account in the Bank
of Sierra Leone the following day. Some commercial banks holding NRA accounts do not
transfer immediately. NRA requires easy access to their accounts i.e. on line. This would
ensure the rapid transfer of funds to the treasury.
In other towns, transit accounts have been opened in commercial banks for payment of taxes
and these deposits are transferred to NRA transit account at the headquarter of the
commercial bank in Freetown the next day. These deposits are then transferred to the Bank
of Sierra Leone the following day.
The AG’s report 2012 identified serious problems in revenue collection, reporting and
reconciliation largely as a result of the system of collection through the banks. These
problems have now been addressed by a new MOU with the banks, aiming at improving the
system for recording and reconciling payment and receipts, plus agreement for rapid transfer
of funds to Treasury Accounts (with penalties for non-compliance). Recently, it has been
established that cash in transit accounts at banks has reduced from Le 20.5 billion in 2012 to
Le 4.5 billion in 2013.
It should also be noted that payments of royalties by the mining companies are made directly
to the Bank of Sierra Leone, which has been raised as an impediment in the reconciliation of
revenues from the sector and remains a significant reason for the non-attainment of EITI
compliance.
Score B: Some up-country transfers are not made on a daily basis.
(iii) Frequency of complete accounts reconciliation between tax assessments, collections,
arrears records and receipts by the Treasury.
Weekly reconciliation occurs between the Ministry of Finance, the Treasury and the NRA.
NRA payments are reconciled each month with the bank statement at the Bank of Sierra
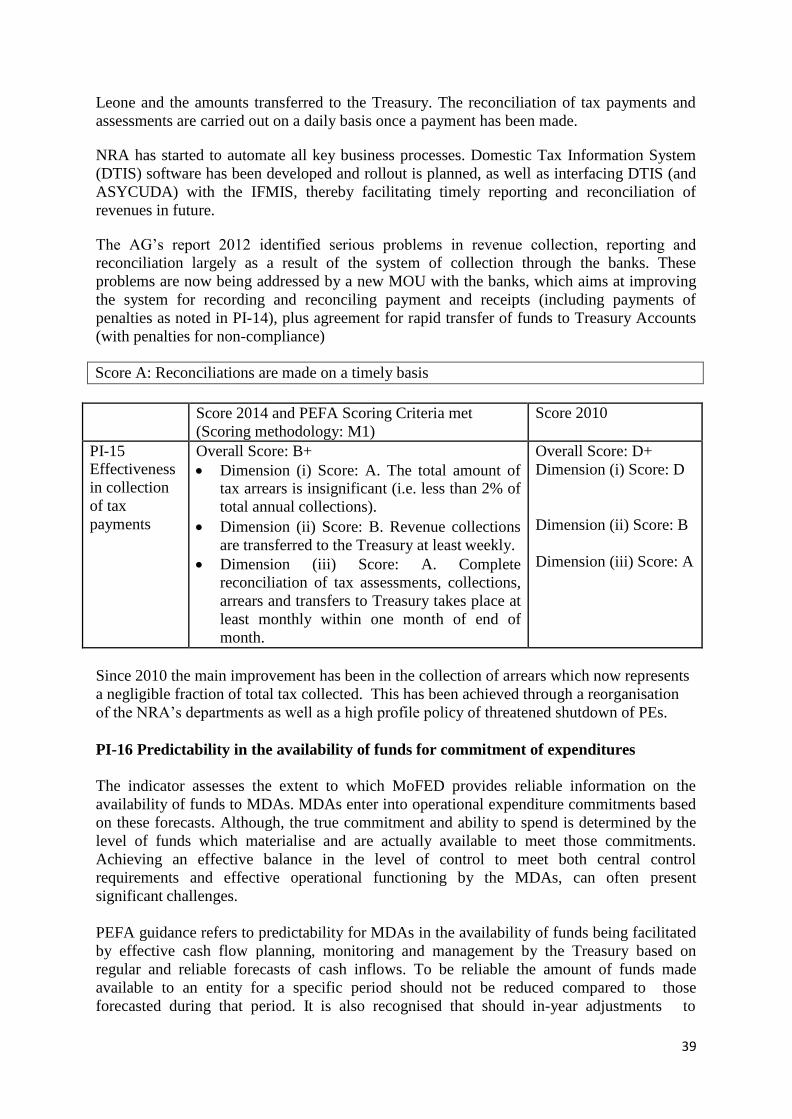
39
Leone and the amounts transferred to the Treasury. The reconciliation of tax payments and
assessments are carried out on a daily basis once a payment has been made.
NRA has started to automate all key business processes. Domestic Tax Information System
(DTIS) software has been developed and rollout is planned, as well as interfacing DTIS (and
ASYCUDA) with the IFMIS, thereby facilitating timely reporting and reconciliation of
revenues in future.
The AG’s report 2012 identified serious problems in revenue collection, reporting and
reconciliation largely as a result of the system of collection through the banks. These
problems are now being addressed by a new MOU with the banks, which aims at improving
the system for recording and reconciling payment and receipts (including payments of
penalties as noted in PI-14), plus agreement for rapid transfer of funds to Treasury Accounts
(with penalties for non-compliance)
Score A: Reconciliations are made on a timely basis
Score 2014 and PEFA Scoring Criteria met
(Scoring methodology: M1)
Score 2010
PI-15 Effectiveness
in collection
of tax
payments
Overall Score: B+
• Dimension (i) Score: A. The total amount of tax arrears is insignificant (i.e. less than 2% of
total annual collections).
• Dimension (ii) Score: B. Revenue collections
are transferred to the Treasury at least weekly.
• Dimension (iii) Score: A. Complete
reconciliation of tax assessments, collections,
arrears and transfers to Treasury takes place at
least monthly within one month of end of
month.
Overall Score: D+
Dimension (i) Score: D
Dimension (ii) Score: B
Dimension (iii) Score: A
Since 2010 the main improvement has been in the collection of arrears which now represents
a negligible fraction of total tax collected. This has been achieved through a reorganisation
of the NRA’s departments as well as a high profile policy of threatened shutdown of PEs.
PI-16 Predictability in the availability of funds for commitment of expenditures
The indicator assesses the extent to which MoFED provides reliable information on the
availability of funds to MDAs. MDAs enter into operational expenditure commitments based
on these forecasts. Although, the true commitment and ability to spend is determined by the
level of funds which materialise and are actually available to meet those commitments.
Achieving an effective balance in the level of control to meet both central control
requirements and effective operational functioning by the MDAs, can often present
significant challenges.
PEFA guidance refers to predictability for MDAs in the availability of funds being facilitated
by effective cash flow planning, monitoring and management by the Treasury based on
regular and reliable forecasts of cash inflows. To be reliable the amount of funds made
available to an entity for a specific period should not be reduced compared to those
forecasted during that period. It is also recognised that should in-year adjustments to

40
allocations need to be made then the impact on predictability, and on the integrity of original
budget allocations, is minimised by specifying in advance an adjustment mechanism that
relates any adjustment to the budget priorities in a systematic and transparent manner. If, in
practice, adjustments can and do take place informally without clear rules this is likely to
impose further unquantifiable delays on new commitments.
In Sierra Leone there is a high level of central control exercised over the forecasting and
actual disbursement of available funds by MoFED and whilst this can be effective at a
Government-wide level in ensuring total budget ceilings are not exceeded - some
unsatisfactory management and operational consequences for individual MDAs, and
government suppliers, can result.
In practice variations in the availability of funds imposes delays on MDAs in incurring new
commitments and making related payments when cash flow problems arise. This is
particularly so for goods and services which are regarded as expenditures and which receive a
lower priority than statutory payments and priority projects.
(i) Extent to which cash flows are forecast and monitored
The Cash Management Committee meets on a weekly basis to monitor the cash position. The
GoSL’s cash flow projections are updated twice yearly in line with the timing of the IMF
discussions.
Score C: The cash position is centrally monitored on a weekly basis although cash flow
projections are only updated twice a year.
(ii) Reliability and horizon of periodic in-year information to MDAs on ceilings for
expenditure commitment
MoFED Budget Bureau is responsible for formally notifying MDAs of their cash allocations
based on the approved budget. Since the 2013 fiscal year it has notified MDAs of their
ceilings and anticipated allocations twice yearly. Previously, quarterly fiscal allocations based
on the budget were given. The move to the half yearly notification of allocations is now in
alignment with the fact that whilst quarterly allocations to MDAs was the practice, in fact
MoFED did not actually revise the forecasts except in the March and September negotiations
with the IMF.
The half yearly allocations appear to afford some administrative benefits such as a more
realistic timeframe within which MDAs can prepare the relevant expenditure vouchers and
secure the necessary approvals. Previously, with quarterly notifications it appeared as though
there was a relatively short period of time to prepare accounting documents only to have a
proportion of commitments met because revenue streams had not been secured – particularly
during the early part of the fiscal year.
As the IMF programme has increasingly tightened borrowing through the banking system the
extra-budgetary expenditures moved to being financed by the accumulation and carryover of
arrears in the form of unpaid cheques held either at the Accountant General’s Department or
the Bank of Sierra Leone.

41
Budget execution does appear to have been hindered by carry-overs since 2010 although we
have been advised that there has been some improvement in 2013. Cheques from 2012 (to the
value of Le 241billion printed cheques, plus Le 10 billion cheques payable) were carried over
into the fiscal year 2013 as a result of revenue shortfalls (Le 183billion) extra-budgetary
expenditures (Le 206 billion) and the clearing of obligations brought forward from FY 2011
(Le 183 billion)21
In January 2013 the Budget Bureau did undertake an exercise which analysed the extent of
the problem, presented this together with a strategy to restore fiscal discipline and strengthen
expenditure control. The guidelines reiterated ‘’…that the very first step to ensure fiscal
discipline is to adhere to the budget as approved by Parliament…’’
Overall, the main challenge to reliability for MDAs’ expenditure commitments is the
availability of cash which was also identified in a 2012 IPFMRP review22
. This manifests
itself in a high level of arrears which occur when the BoSL cannot honour printed cheques,
and invoices cannot be processed by AGD because of cash shortages.
Ongoing evidence23
of progress ‘’…suggests that cutbacks in the quarterly releases remained
large thus leading to mounting unpaid expenditure bills throughout the second half of 2012
(the stock of domestic arrears equal to 15% of total expenditure in 2012, from 16% in 2011
and 9% in 2008) which in turn eroded the credibility and the predictability of the budget
process further…. The Mission reiterates the pledge for BB and AGD authorities to adopt a
procedure in the FMR with which to streamline and reduce the practice of protracted
MOFED approvals after the MDA cash plans have been approved (and the PETS approvals
have been given)…’’
Score C: Since 2013 MDAs are notified of the ceilings twice a year (previously quarterly).
Although the cash position is centrally monitored on a weekly basis by MoFED this does not
always appear to translate into a high level of predictability and reliability at the MDA
operational level. Informal cash control and allocation mechanisms towards priorities
determined at a level above MDAs can be used during periods of cash flow problems.
(iii) Frequency and transparency of adjustments to budget allocations, which are
decided above the level of management of MDAs
A formal process for the consideration of Supplementary Budgets to be submitted to
Parliament is provided for (Constitution (Section 111 subsection (3) (b) (ii), and Section 112
subsection (3) and (4). Section 114 (2) c allows the President to authorize warrants under his
signature for extra-budgetary expenditure when he considers that there is such an urgent need
to incur the expenditure that it would not be in the public interest to delay.
MoFED does impose reductions on MDAs because of recurring and significant revenue
shortfalls, and when extra-budgetary expenditures are authorized. The Budget Bureau has
developed procedures to protect priority and statutory expenditures including poverty related
21 MoFED Budget Bureau analysis of carry overs 2010-2013 22 Mid Term Supervision Mission of the Sierra Leone Integrated Public Financial Management Reform Project carried out 18th -27th June
2012 (paragraph 22) 23 Mid Term Supervision Mission of the Sierra Leone Integrated Public Financial Management Reform Project carried out 25th -27th March 2013 (paragraph 14)
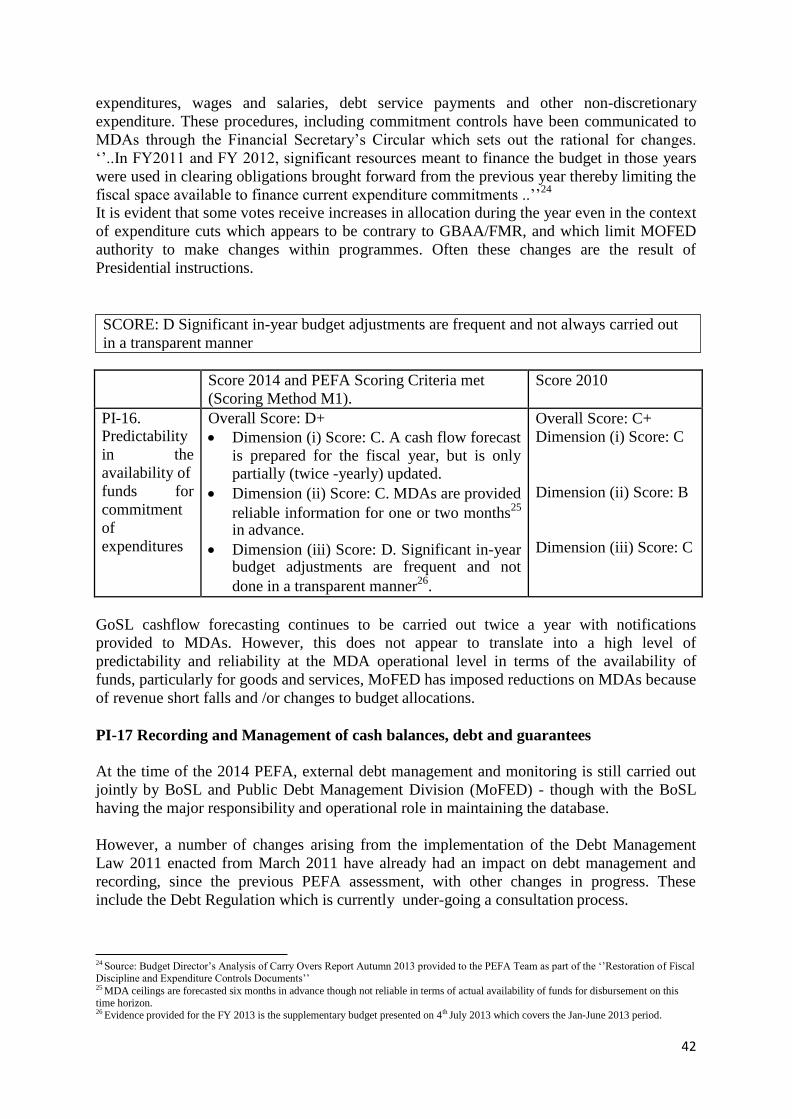
42
expenditures, wages and salaries, debt service payments and other non-discretionary
expenditure. These procedures, including commitment controls have been communicated to
MDAs through the Financial Secretary’s Circular which sets out the rational for changes.
‘’..In FY2011 and FY 2012, significant resources meant to finance the budget in those years
were used in clearing obligations brought forward from the previous year thereby limiting the
fiscal space available to finance current expenditure commitments ..’’24
It is evident that some votes receive increases in allocation during the year even in the context
of expenditure cuts which appears to be contrary to GBAA/FMR, and which limit MOFED
authority to make changes within programmes. Often these changes are the result of
Presidential instructions.
Score 2014 and PEFA Scoring Criteria met
(Scoring Method M1).
Score 2010
PI-16. Predictability
in the
availability of
funds for
commitment
of
expenditures
Overall Score: D+
• Dimension (i) Score: C. A cash flow forecast
is prepared for the fiscal year, but is only partially (twice -yearly) updated.
• Dimension (ii) Score: C. MDAs are provided
reliable information for one or two months25
in advance.
• Dimension (iii) Score: D. Significant in-year budget adjustments are frequent and not
done in a transparent manner26
.
Overall Score: C+
Dimension (i) Score: C
Dimension (ii) Score: B
Dimension (iii) Score: C
GoSL cashflow forecasting continues to be carried out twice a year with notifications
provided to MDAs. However, this does not appear to translate into a high level of
predictability and reliability at the MDA operational level in terms of the availability of
funds, particularly for goods and services, MoFED has imposed reductions on MDAs because
of revenue short falls and /or changes to budget allocations.
PI-17 Recording and Management of cash balances, debt and guarantees
At the time of the 2014 PEFA, external debt management and monitoring is still carried out
jointly by BoSL and Public Debt Management Division (MoFED) - though with the BoSL
having the major responsibility and operational role in maintaining the database.
However, a number of changes arising from the implementation of the Debt Management
Law 2011 enacted from March 2011 have already had an impact on debt management and
recording, since the previous PEFA assessment, with other changes in progress. These
include the Debt Regulation which is currently under-going a consultation process.
24 Source: Budget Director’s Analysis of Carry Overs Report Autumn 2013 provided to the PEFA Team as part of the ‘’Restoration of Fiscal Discipline and Expenditure Controls Documents’’ 25 MDA ceilings are forecasted six months in advance though not reliable in terms of actual availability of funds for disbursement on this time horizon. 26 Evidence provided for the FY 2013 is the supplementary budget presented on 4th July 2013 which covers the Jan-June 2013 period.
SCORE: D Significant in-year budget adjustments are frequent and not always carried out
in a transparent manner

43
In November 2013 MoFED and BoSL commenced the transitional period of transfer of
responsibility from BoSL to MoFED for the recording of debt in the CS- DMRS. This is in
line with the new Law.
Overall, the Debt Management Act reiterates the objectives of public debt management as
being:
‘’….to ensure that the Government’s financing needs and its payment obligations are met at
the lowest possible cost over the medium to long term, with a prudent degree of risk, and to
promote development of the domestic debt market…’’
(i) Quality of debt data recording and reporting.
A Public Debt Management Division under the supervision of the Financial Secretary, with
proposed strengthened capacity, has replaced the Debt Management Unit. We understand that
this increased organisational status provided by the Act will receive a commensurate increase
in resources to address the additional responsibilities.
External debt continues to be recorded in the Commonwealth Secretariat Debt Recording and
Management Systems (CS-DRMS)27. Domestic debt is recorded by the BoSL on the
Scriptless Securities System. Future plans to integrate and link these systems to IFMIS, also
reported in the 2010 PEFA, remain to be progressed.
The Public Debt Management Division of the MoFED produces the annual Public Debt
Bulletin providing comprehensive information on Sierra Leone’s public debt profile and
operations (covering both external and domestic debt and risk analysis on the debt portfolio).
It also produces comprehensive reports for IMF Review Missions.
Reconciliations were reported to be carried out on an annual basis because of the (large)
volume of data. The key reconciliation is that for the Accountant General for the update of
the fiscal table, and reconciliations are also prepared at the time of IMF missions. In January
2013 the Division was working on the 2013 reconciliation - though with a time lag and delay
attributed to outstanding information required from the Accountant General. The Auditor
General’s Report on the Accounts for the year ended 31st December 2012 makes a number of
adverse comments on the accuracy of the recording of public debt28.
The new Law requires quarterly reporting of PEs total liability to be sent to the Debt Management Division but this is not happening systematically and PDMD reported that they have to physically get the data and in the absence of audited financial statements for these
organisations interim management accounts are used29
.
27 BoSL and MoFED each have this system. BoSL are operating it and inputting data with MoFED Debt Management Division having
viewing status only up to 31st December 2013. From 1st January 2014 the transition period of these respective roles being reversed started. 28
External Public Debt disclosed in the financial statements was materially understated by Le 93.4 billion. In addition foreign exchange
gains and losses, in respect of External Public Debt, as recorded in the financial statements are incorrect. However, in this case I was unable
to estimate a potential amount of the misstatement because of insufficient information presented for audit inspection. We had encountered
similar problems with Public Debt in 2011 which led us to conduct a review of the CS-DRMS computer system and the procedures around it
used to manage public debt issues.’’
29 An estimate of liabilities of SoE’s as at 31st December 2012 was provided to the review team. This included the key SoE’s (12) out of a total of 23.

44
Score: C. External debt recording and monitoring and debt management are carried out by
MOFED (Debt Division, Accountant General’s Department) and the BoSL. Debt data covers
both external and domestic debt. Quarterly reports are produced internally and for the IMF.
(ii) Extent of consolidation of the government’s cash balances
GoSL does not operate a Single Treasury Account which consolidates all GoSL accounts.
Currently, the 61 Treasury Accounts, maintained at the BoSL managed by the Accountant
General’s Department are consolidated and therefore excludes many of the departmental
bank accounts, mainly for externally assisted projects and sub-vented agencies. Consolidation
of these balances into the Treasury system would be a major improvement in the present cash
management arrangements in Sierra Leone –this is considered separately in PI-22.
Score C: Significant numbers of departmental accounts are not consolidated with the
Treasury’s STA
(iii) System for contracting loans and issuance of guarantees
Subject to section 118 of the Constitution, ‘’…the Minister shall have sole authority to
borrow money on behalf of Government by concluding loan agreements, issuing Government
securities, or entering into supplier’s credit agreements and to issue Government guarantees,
both in Sierra Leone and elsewhere and in local and foreign currencies…’’
Prior to the Act we were informed that it was possible for ministries to enter into loans and
other liabilities without MoFED knowledge. The current situation is the Minister of Finance
has sole authority for the issue of loans and guarantees within well-defined measures, criteria
and ceilings.
Score 2014 and PEFA Scoring Criteria met
(Scoring Method M2).
Score 2010
PI-17 Recording
and
management
of cash
balances,
debt and
guarantees.
Overall Score: C+
• Dimension (i) Score: C. Domestic and
foreign debt records are complete, updated
and reconciled at least annually. Data
quality is considered fair, but some gaps
and reconciliation problems are
recognised. Reports on debt stocks and
service are produced only occasionally or
with limited content
• Dimension (ii) Score: C. Calculation and
consolidation of most government cash
balances take place at least monthly, but
the system used does not allow
Overall Score: C+↑
Dimension (i) Score: B↑
Dimension (ii) Score: C
SCORE: B. A debt management strategy is drafted and approved by Cabinet. The period of
assessment covers the last fiscal year (2013) and since the new Debt Management Law
2011 no borrowing is permitted without Minister of Finance approval.
45
consolidation of bank balances.
• Dimension (iii) Score: B. Central
government’s contracting of loans and
issuance of guarantees are made within
limits for total debt and total guarantees,
and always approved by a single
responsible government entity.
Dimension (iii) Score: C↑
The overall score remains the same at C+ although this reflects an improvement in dimension
(iii) arising from the implementation of the Debt Management Law 2011, offset by slippage
in dimension (i) due to the problems with reconciliation including the adverse comments
regarding the accuracy in the recording of public debt referred to in the Auditor General’s
annual reports.
PI-18 Effectiveness of payroll controls
The Secretary to the Cabinet is the Head of the Civil Service. HRMO’s mandate covers civil
servants but it should be noted that there are also other categories of employees and payrolls
outside of this definition for which GoSL provides the funding. The scope of payroll assessed
here includes all payrolls30
of central government including all MDAs and autonomous
government agencies (AGAs).
The GoSL wage bill is a significant item within the GoSL budget. It accounts for 48% of
domestic revenues collected each year and has been increasing due to a number of factors
such as in-year implementation of pay increases for public workers as part of the on-going
pay reform programme, and also for health sector workers as part of the FHCI. Subvented
agencies have no ‘cap’ on the size of their workforce and they have been increasing their
payroll numbers each year with higher cost implications given that they have better
conditions of service. The payment of salaries for other quasi-agencies like SLBC, SLRA and
SALPOST should not come from the central government budget31
.
Two controls on recruitment exist with HRMO determining the establishment and MoFED
determining the number of funded posts. The AGD is the branch of MoFED which composes
the payroll and instructs the transfer of funds to the individual accounts of public servants
held in commercial banks. Thus the personnel and payroll functions are segregated for
control purposes.
A new software system Civil Service Management (CSM) replaced HCA in October 2013
after a short period of parallel running. Future developments in personnel include plans to roll
out the input tasks of personnel data to MDAs (currently undertaken centrally by HRMO’s
Data Input Unit).
In addition to direct salary costs through the payroll, there is payroll related expenditure such
as contracted staff, casual labour and discretionary allowances which are not reflected here.
31 Source Budget Bureau : ‘’Guidelines and Strategy to Restore Fiscal Discipline and Strengthen Expenditure Control’’ Note, Dated January
2013 (received from MoFED Budget Bureau February 2014)

46
Any staff related costs that do not form part of the payroll system are included in the
assessment of general internal controls (see PI-20).
(i) Degree of integration and reconciliation between personnel records and payroll
data
HRMO interfaces with the payroll activity by ensuring that personnel files are properly
opened and maintained to allow employees to receive the correct pay and for proper records
management. The personnel and payroll functions are segregated for control purposes.
The processing and payment aspects of the payroll system remains highly centralised within
AGD though with different levels of mandated autonomy for the maintenance of personnel
records. Autonomous Government Agencies (subvented agencies) funded by the GoSL
operate their own accounting systems which have no system interface with IFMIS and other
records such as payroll.
However, central payroll controls exist and AGD check salary payment vouchers which are
submitted on a monthly or quarterly basis. Over recent years payroll, and other IT, system
improvements have been introduced together with organisational changes designed to
strengthen human resource management capacity.
A key control, and the verification required to ensure meaningful integration of the payroll
and personnel records, can only be attained when physical checks of employees are
established together with reconciliation of the personnel files held by MDAs, and the master
file held by HRMO and the corresponding IFMIS-CSM data.
(ii) Timeliness of changes to personal records and payroll data
Once changes to personnel records and the payroll are notified to HRMO and the AGD they
will normally be acted upon within a month. However, what is it not possible to verify is the
delay from MDAs and other bodies in the notifications to AGD. Discussions with HRMO
indicate that changes appear to be made within three months. Some delays can occur
including waiting for the issue of NASSIT numbers.
(iii) Internal controls of changes to personnel records and the payroll
• Score D↑: Various payroll verification exercises have been undertaken during 2011-
2013 but the conclusion remains that the integrity of the payroll is significantly
undermined by lack of complete personnel records and personnel database, or by
lacking reconciliation between them. GoSL’s ongoing efforts to date (such as
payroll verification) are acknowledged by the upward trajectory ↑ but these do not
yet impact sufficiently to fully revise the score. Hence the ongoing importance of
the completion of verification exercises and payroll audits which triangulate
personnel files, payroll records and physical verifications.
Score C: Delays in processing changes to the payroll and nominal roll do sometimes occur
but now appear to be made within three months
47
The Payroll Unit within AGD has the main responsibility to ensure that all Government
employees are paid on time and at the correct salary scale. In 2013 the Human Capital
Accountability (HCA) system was replaced by CSM and we understand that this has
additional system controls within it.
The three levels of autonomy previously mandated by the AGD continue:
• Full self-accounting for Sierra Leone Police (since 2007) and the Ministry of Defence
(since late 2009).
• A “rolled out status” has been given to ten MDAs of which nine benefit from a lower
level of autonomy than the self-accounting MDAs – these MDAs input and process
all payroll vouchers up to approval level prior to sending them to the AGD. The AGD
then undertakes a higher level of further scrutiny before the printing of cheques.
• For all other MDAs, AGD receives instructions for payroll input and amendments from HRMO except for teachers whose instructions come from the Ministry of
Education, Youth and Sports.
The overall comprehensive and multi-layered control environment referred to above
contributes to the internal controls which operate over changes to personnel records and the
payroll. Monthly checks are run on the central system as it captures data. Checks are run
against PIN numbers and the establishment list and a report produced for HRMO. This
IFMIS difference report is amended / confirmed against the HRMO archive list of personnel
files before AGD makes payment. Internal Audit Unit staff in HRMO and other MDAs also
have a control role to play over payroll.
Score B: Authority and basis for changes to the personnel records and the payroll are clear
and evidenced.
(iv) Existence of payroll audits to identify control weaknesses and /or ghost workers
The evidence base for this dimension is the level of activity in the last three years before
assessment so the key period for which there needs to be sufficient payroll audit activity is
2011-13. The following activities have been identified during this period:
A number of payroll audits and other verification exercises were reported during the PEFA
exercise. For example:
• A significant verification exercise was undertaken in 2013 by HRMO together with
the Public Services Reform Unit which reconciled the HRMO personnel files and
current payroll data. To date the report has not been received by the PEFA Team but
if the exercise was as extensive as described then it is an important piece of work in
this area and it will be important to ensure that follow up action is taken (this
appeared to indicate the overall potential for ghost workers)
• The teachers payroll clean up exercise (as required by PAF indicators, and funded by
ADB), initially identified 7,000 teachers to be removed from the payroll. 3,000
subsequently produced sufficiently credible supporting documents so as to be re-
instated onto the payroll. Of the 4,000 initially removed we understand that 2,000
were later reinstated. The outcome of these exercises has strategic significance as they
are assessed as part of the high level PAF indicators32
. The ADB has expressed the
32 The removal of 4,000 teachers from the payroll was specifically commented on in the UK Government’s letter to GoSL in support of the
Direct Budget Support for 2013.

48
view that these exercises, once undertaken, should be performed on an annual basis
by GoSL to ensure that the gains are sustained and not eroded.
• The health sector workers payroll also underwent a clean-up exercise which was
known about and reported in the last PEFA. The Ministry of Health and Sanitation
has carried out a DFID supported intervention which introduced a review /monitoring
system covering health workers before the health workers salary top ups commenced.
• Validation of Personnel Records in the CSM of the IFMIS Payroll. A validation
exercise of personnel data in the IFMIS was undertaken resulting in the correction of
data and the identification of 365 names to be removed from the payroll having
attained the statutory retirement age of 60 years (from IPFM,RP)
• Auditor General’s comments on payroll audits
• Internal audit payroll audits undertaken include those requested by the Financial
Secretary in respect of the Sierra Leone Agricultural Institute and the Sierra Leone
Roads Authority
This aspect of payroll remains deficient. Whist there is evidence of some audit and
verification exercises operating in respect of payroll these are not regular, systematic nor
comprehensive.
MoFED through its guidelines on improving expenditure controls has also identified some
improved payroll related fiscal disciplines:
• implement the findings and recommendations on the recently concluded AfDB funded
biometric teacher verification exercise;
• clean-up the payroll and ensure that all those who are due to proceed on retirement
should be effectively removed from the payroll and their benefits paid;
• ensure that all public servants (teachers, military, civil servants, police etc.) being paid
by the Accountant General have valid Social Security Numbers issued by NASSIT;
• carryout a comprehensive audit of all government pensioners being paid by NASSIT;
• all recruitment and promotions should be fully provided for within an Agency’s
budget for the year and in the case of the Civil Service, authorization should firstly be sought from MoFED;
• salary support to Parastatals and other Agencies that ought to be self-financing should
gradually be cut-off by helping these institutions design a short to medium term
strategy to improve on their revenue mobilization and reduce their administrative
costs so that they can be weaned off the central government budget within the next
two years;
• there should be established a ‘cap’ on the number of workers for each subvented
agency and a review should be carried out on the level of salaries they pay compared
to the market especially for similar professional jobs. The objective of this is to
harmonise pay schemes across all subvented agencies.
Score 2014 and PEFA Scoring Criteria met Score 2010
Score: C. Integrity of payroll continues to be undermined by lack of full verification and
reconciliation between the personnel database and payroll records. Significant verification
exercises of health workers and teachers have been undertaken. Both of these were donor led
and intended to give additional confidence ahead of donor support

49
(Scoring Method M1).
PI-18.
Effectiveness of
payroll controls
Overall Score: D+↑:
• Dimension (i) Score D↑: Integrity of the
payroll is significantly undermined by lack
of complete personnel records and
personnel database, or by lacking
reconciliation between the three lists.
• Dimension (ii) Score C: Up to three
months delay occurs in processing changes
to personnel records and payroll for a large
part of changes, which leads to frequent
retroactive adjustments
• Dimension (iii) Score B: Authority and
basis for changes to the personnel records
and the payroll are clear.
• Dimension (iv) Score C: Partial payroll
audits or staff surveys undertaken in the
past three years
Overall Score: D+:
Dimension (i) Score D:
Dimension (i) Score D:
Dimension (i) Score B:
Dimension (i) Score C:
The marginal increase in the overall scoring to D+↑ reflects the slight improvement in
dimension (i) resulting from the number of verification exercises undertaken, and the
improvement in dimension (ii) from D to C because of the improved timeliness of changes to
personnel records.
PI-19 Transparency, competition, and complaints mechanisms in procurement
In 2006 the National Public Procurement Authority (NPPA) was established by the Public
Procurement Act of 2004. Since inception there has been a marked improvement in both
Central and Local Government activities overseen by the Procurement Authority. The NPPA
was established, together with a regulatory and monitoring body the Independent
Procurement Review Panel (IPRP), serving as a complaints handling body. Institutional
arrangements were put in place for procurement within ministries and other government
institutions including Local Councils.
A CPAR review was carried out in 2013 and part of the follow up was that a Revised Public
Procurement Act should be introduced. The draft revised Act is currently with the Minister
of Finance for review and onward presentation to cabinet as a precursor to it being enacted in
late 2014 which would address pending and outstanding issues. The revision of the Public
Procurement Act of 2004 subsequently will be harmonized with the Procurement Manual and
the establishment of a procurement directorate.
The PEFA 2010 noted that the approach the NPPA took had been “to roll out its activities
and the related GoSL procurement controls starting with the largest MDAs in procurement
spending terms”. A spending analysis was undertaken in 2006 to identify an initial nine (9)
key spending agencies as pilots for improved procurement disciplines and NPPA oversight.
50
As of 2014, the number of MDAs has increased significantly to sixty (60) as well as all
nineteen (19) councils.
Developments in the procurement process have ensured that public procurement plans form
part of the budget formulation process and is articulated in the Budget Call Circular for 2013
and 2014. This however has had a low compliance level. The key weaknesses in procurement
are the failures to ensure compliance with the PPA/Manual and limited coordination of
procurement plans with budgeting and budget execution at both MDA and LC levels.
Public notices were issued for all procuring entities informing them that the deadline for the
2014 procurement planning process was 11th
September 2013 and for the 2013 planning
process it was 31st
December 2012. These deadlines however were not complied with. The
NPPA confirms that most MDAs were still submitting procurement plans up to late March
2013, for the 31st
December 2012 deadline.
The situation has not changed much for the deadline given to MDAs 11th
September 2013, to
submit their procurement plans and as of this review February 2014, only thirty six (36)
Institutions complied which represents sixty (60%) percent of the total.
To ensure that their roles are supervisory in nature and not to be actively involved at the
operational level, the NPPA has concentrated on building the capacity of procurement
officers. A cadre of 30 Procurement Officers were trained at the Institute of Public
Administration and Management IPAM, which also included five (5) senior officers in 2012.
The NPPA has also opted to give advice to the procuring entities when looking at individual
procurement cases, leaving the decisions to the procuring entity, as to whether or not
breaches in regulations have occurred, in order to guard against the NPPA’s over
involvement at operational level at the expense of its supervisory role. The most recent
initiative to build capacity and establish clear career paths, adequate remuneration and ensure
continuity, all within the civil service systems, is the proposed establishment of a
Procurement Directorate. A project document has been developed and this is expected to
come into fruition and completed by late 2014.
Local Councils are still considered as good examples of organisations where there has been a
90% retention rate of procurement officers because the specialism had been properly
acknowledged in status and grading terms from the outset.
(i) Transparency, Comprehensiveness and Competition in the Legal and regulatory
Framework
It is evident that the enactment of the Procurement Law 2004 and the provisions within
which include a regulatory and monitoring body, the Independent Procurement Review Panel
(IPRP), serving as a complaints handling body, provides the necessary legal and regulatory
framework for Public Procurement in Sierra Leone. The Procurement Act and Regulations
provide a solid legal and regulatory framework for the two tier appeals process. In the first
instance this is to the Head of the Procuring Entity and in the second instance referrals are

51
made to the Independent Procurement Review Panel (IPRP). The law is freely available at the
Government’s bookshop and is published on various websites including the NPPAs. The law
covers all central and local government activities and all PEs.
Part V of the Act sets out methods of procurement and section 37 states that “Public
procurement shall be undertaken by means of advertised open bid proceedings, to which
equal access shall be provided to all eligible and qualified bidders without discrimination,
subject only to the exceptions provided in sections which (38, 39, 40 and 41)” which clearly
defines situations in which other methods can be used and how this is to be justified. The
justifiable instances allowed by law where other procurement methods have been used other
than open competition have been in the area of (i) National Emergencies and (ii) State
Security. The NPPA website publishes bidding opportunities and evidence exists in published
newspapers of bidding opportunities. The NPPA has now established a Desk Officer for the
IPRP that deals with all issues pertaining to data on resolutions of procurement complaints.
At local council level, Procurement Officers have been employed and trained in all nineteen
(19) councils.
The legal and regulatory framework for procurement satisfies the requirements as laid out in
the table below.
Requirements Comments
i Be organised hierarchically and precedence is clearly
established
Yes
ii Be freely and easily accessible to the public through
appropriate means
Yes
iii Apply to all procurement undertaken using government
funds
Yes
iv Make open competitive procurement the default method
of procurement and define clearly the situations in which
other methods can used and how this to be justified
Yes
v Provide for public access to all off the following
procurement information: government procurement
plans, bidding opportunities, contract awards, and data
on resolution of procurement complaints
Yes, though financial data is
often missing from plans and
awards.
vi Provides for an independent administrative procurement
review process for handling procurement complaints by
participants prior to contract signature.
Yes, though flawed in
practice
Score: A. All six requirements are met by the SL legal and regulatory framework
(ii) The use of competitive procurement methods
Part 2 of the first schedule of the Procurement Act 2004 sets out the procurement thresholds
for open competition which are set below. (Everything beneath these thresholds is purchased
using ‘’national shopping’’. Under the Procurement Law, a minimum of three quotes must be
obtained.)

52
• Goods Le 60,000,000 circa ($13,830)
• Services Le 60,000,000 circa ($13,830)
• Works Le 150,000,000 circa ($344,580)
There is clear evidence of the existence of a recording and monitoring system for the
information received from public entities on procurement planning. The thresholds for each
procurement type were explicit and the control processes operating over the entities and
contracts included within the system appeared comprehensive.
As mentioned above, the NPPA now covers 123 public entities and therefore not all public
entities receive full scrutiny. This suggests that there may be instances where the threshold
for “national shopping” may be higher. Evidence exists that the limited capacity of
procurement officers to follow procedures results in instances of contract splitting. Also,
evidence exists that some donor and development partners have their own procurement
procedures which may differ from local regulations in terms of the threshold.
The table below reveals a downward trend in the total number of contracts above the
threshold which have been subject to open competition. On enquiry during discussions with
the NPPA, certain factors were proffered for the use of less competitive methods and these
include:
• Late disbursement of funds – the Ministry of Finance and Economic Development
(MoFED) over these periods has released funds much later in the year than stipulated
for activities that are time bound. The late disbursement on MoFED’s part leads to
tight deadlines and timeframes resulting in the use of less competitive methods.
• Size of budget allocations – the ceiling restrictions and the subsequent small budget
allocations and release of funds means that the entities do not have enough funds for large quantities requiring open competition.
• Donor thresholds – the low percentage score of the use of open competition may also
be attributed to the activities carried out by donors. Evidence suggests that some
donor and development partners have their own procurement procedures which may
differ in terms of the threshold from local regulations.
• The capacity of Procurement Officers to follow technical procedures – Evidence
exists that the limited capacity of procurement officers to follow procedures results in
instances of splitting.
• Issues of national emergencies – there is also evidence where situations arise when
responding to national emergencies that have led to use of restricted methods as the
best practice.
DATA ON USE OF OPEN COMPETITION 2010 TO 2012
YEA
R
TOTAL
CONTRAC
TS
CONTRAC
TS BELOW
THRESHO
LD
CONTRAC
TS AT OR
ABOVE
THRESHO
LD
CONTRACT
AWARDED
THROUGH
OPEN
COMPETITIO
N
% TOTAL
CONTRACT
ABOVE
THRESHOLD
SUBJECT TO
COMPETITION
2010 2439 2086 353 317 89.8

53
2011 1063 903 160 126 78.8
2012 1630 1389 241 153 63.5
SOURCE: NPPA
(iii) Public access to complete, reliable and timely procurement information
Procurement information (government procurement plans, bidding opportunities, contract
awards, and data on resolution of procurement complaints) is generally made available to the
public through appropriate means, i.e., through the NPPA website, in newspapers and also
abridged versions (because of the bulkiness of some bidding opportunities, summaries) posted
on the notice boards of local councils. However, in the case of Procurement Plans and
Contract Awards, financial information is not transmitted to the public
The NPPA website publishes bidding opportunities and examples also exist in published
newspapers. The NPPA has now established a Desk Officer that deals with all issues
pertaining to data on resolutions of procurement complaints. All decisions by the IPRP are
posted in several newspapers.
Currently, procurement plans are sent to key stakeholders and abridged versions (the
budgeted/estimated amounts are removed) before being posted on the website.
With respect to contract awards only limited information is published i.e. without the contract
amount. However steps to improve this are being implemented through the passing on of
Certificates of Clearance by MOFED to NPPA and this information on awards is to be posted
on the NPPA website, but has not yet happened.
The NPPA also monitors the timeliness of information to the public. In two instances where
local councils advertised procurement opportunities but failed to adhere to the 28 day period
for the advert, the NPPA to re-advertise respecting proper timing.
(iv) Existence of an independent administrative procurement complaints system
The NPPA was established, together with a regulatory and monitoring body - the Independent
Procurement Review Panel (IPRP) - by the Procurement Act 2004, serving as a complaints
handling body. This provides a solid legal and regulatory framework for the appeals process.
In the first instance appeals are made to the Head of the Procuring Entity and in the second
instance referrals are made to the Independent Procurement Review Panel (IPRP).
During the period 2010 to 2012, evidence was made available to confirm eleven (11) cases
where first level appeals have been made. The decisions reached were posted in several
newspapers. There has been no evidence provided to suggest that any referral to the IPRP has
been made. The low level of the utilisation of the appeals process is a sign that the issues
Score: D: Data on the justification for the non-use of open competition has not been provided
by NPPA
Score: C: Two of the key procurement information elements are complete and reliable for
government entities. This represents 50% of the procurement operations being made available
to the public in a timely manner through appropriate means.

54
identified in the PEFA 2010 report still exist. The report noted that “A number of factors may
contribute to the low level of use of the complaints mechanism:
• Perceived lack of independence of the IPRP due to the shared logistical arrangements
with the NPPA.
• Cultural reticence and understanding, in the sense that there is not a culture of
appeal.
The lack of resources available to the IPRP should be addressed. Currently, this must affect
the actual and perceived independence of the Panel. For example, the IPRP has no premises,
no website and no budget with which it can obtain the specialist advice it may require in
order to conduct a thorough hearing. Consequently, the IPRP relies on the NPPA to provide
specialist procurement advice; the NPPA website is used to post the IPRP appeal judgements;
and the lack of premises compromises the integrity of appeals files which are retained by
Panel members”.
This review has also noted that the membership of the IPRP is rotational, and that once the
term of the panel had expired, they have not been replaced. The panel consisted of three (3)
people, a Chairman who was not a procurement expert but given some training, and two (2)
other members drawn from the government and civil society. However, they had little or no
familiarity with the legal framework of procurement.
The view is that there are very few cases to review to warrant a permanent constituent of
IPRP members. It is also noted is that the membership does not have any procurement
background and they are not adequately trained. A desk officer has been recruited who deals
with all IPRP issues, but the record of implementation remains weak although the framework
itself is comprehensive.
Section 65(2) of the Act requires an administration fee to be levied in order for an application
to be considered by the IPRP. According to the regulation, this fee is Two Million (Le
2,000,000.00) Leones. The NPPA explained that this fee is also meant to forestall
unnecessary cases and complaints being brought to the appeals process. This fee is refunded
if the complainant wins the case.
IPRP Requirements Comments
(i) Is comprised of experienced professionals familiar
with the legal framework for procurement, and
includes members drawn from the private sector and
civil society as well as government
Not always
(ii) Is not involved in any capacity in procurement
transactions or in the process leading to contract
award decisions
Links with NPPA include the
use of NPPA offices, website
and reliance on advice.
(iii) Does not charge fees that prohibit access by
concerned parties Fee is less than 5% of
minimum contract size for
open competition in the case
of goods and services, and
1.5% for construction

55
(iv) Follows processes for submission and resolution of
complaints that are clearly defined and publicly
available
Yes – as per the law
(v) Exercises the authority to suspend the procurement
process Yes – according to the law
(vi) Issues decisions within the timeframe specified by
rules & regulations Yes
(vii) Issues decisions that are binding on all parties
(without precluding subsequent access to an external
higher authority)
Yes
Score 2014 and PEFA Scoring Criteria (Scoring
Method 2)
Score 2010
PI-19. Transparency,
competition,
and
complaints
mechanisms
in
procurement
Overall Score: C
• Dimension (i) Score A: Legislation meets all
6 requirements
• Dimension (ii) Score D: Data on
justification for use of non-competitive methods has not been provided
• Dimension (iii) Score C: 2 of 4 key
procurement information elements are made
available to the public
• Dimension (iv) Score D: The procurement
complaints mechanism is not always
composed of procurement professionals, is
not independent of NPPA and charges are
prohibitive to SMEs
Overall Score: C+
Dimension (i) Score B
Dimension (ii) Score C
Dimension (iii) Score C
Changes to this indicator restrict the ability to make comparisons between 2010 and 2014.
However, dimension (ii) in is comparable and shows a decrease in the justification for the use
of non-competitive procurement methods. Quite simply, in 2014 the NPPA could provide no
evidence (meeting minutes, verified data etc.) for its lack of use. Dimension (iv) in 2014 is
somewhat comparable to dimension (iii) in 2010. The decrease in the rating for a complaints
mechanism reflects the stricter criteria required under the revised indicator.
PI-20 Effectiveness of internal controls for non-salary expenditure
An effective internal control system is one that is:
• Relevant (i.e. based on an assessment of risks and the controls required to manage the
risks)
• Incorporates a comprehensive and cost effective set of controls (which address
compliance with rules in procurement and other expenditure processes, prevention
and detection of mistakes and fraud, safeguarding of information and assets, quality
and timeliness of accounting and reporting)
• Widely understood and complied with
• Circumvented only for genuine emergency reasons.
Score D: The procurement complaints system does not meet criteria (i), (ii) and (iii).

56
The basis of evidence supporting the assessment of the effectiveness of the internal control
system is derived from government financial controllers, regular internal and external audits
or other surveys carried out by management, such as error or rejection rates in routine
financial procedures.
(i) Effectiveness of expenditure commitment controls
Effectiveness of expenditure commitment controls is singled out as a separate dimension of
this indicator due to the importance of these controls for ensuring that the government’s
payment obligations remain within the limits of projected cash availability, thereby avoiding
the creation of expenditure arrears33
.
The IFMIS system incorporates the hard controls of budgets which ensure cash limits are not
exceeded, for those items which are on budget and go through the IFMIS system.34
However,
the system controls operate at the technical budget execution level and cannot mitigate
against practices which are not in line with established procedures or are used in emergency
circumstances.
In FY2010 extra-budgetary expenditures (over the approved budget) were about Le425.2
billion or 5.8% of GDPIn FY2011 it was Le319.3 billion or 3.7% of GDP; and in FY2012 it
was an estimated Le272.9 billion or 2.4% of GDP. Extra-budgetary expenditures have been
partly financed by unprogrammed or unbudgeted revenues and by borrowing through the
banking system.
However, according to the IMF, measures were taken over the period that: “…tightened
borrowing from the central bank (through adherence to the BSL Act), extra-budgetary
expenditures were financed by the accumulation and carryover of arrears in the form of
unpaid cheques held either at the Accountant General’s Department or the Bank of Sierra
Leone. As a result an increasing amount of obligations were carried forward to the
subsequent fiscal years35
…”
Cheques carried over to subsequent fiscal years Le 'm
Cheques from 2010 paid in 2011 51,962
Cheques from 2011 paid in 2012 183,495
Cheques from 2012 carried over to 2013 241,169
Score: C. Expenditure commitment control procedures exist through budget ceilings set within IFMIS and which should limit commitments to actual cash availability, but they may not comprehensively cover all expenditures such as those which are off budget, or they may
occasionally be violated. There is evidence of expenditure arrears building up36
.
(ii) Comprehensiveness, relevance and understanding of other internal control rules /
procedures
The Financial Management Regulations outline the basis of the internal control procedures,
the approval processes and levels of responsibilities of various officers. MDAs initiate the
34 Clarification of the remaining items which are off budget and do not go through IFMIS 35 Information sourced from Budget Bureau 36 The evident build-up of arrears in the 2010-2013 period partly due to extra budgetary spending is more strongly reflected in the scoring based on the 2012 PEFA Framework clarifications than previously and contributes to a lower score of ‘’C’’ for Dimension(i)

57
appropriate requisition and control documents in order to purchase goods, services or works
in line with the agreed budget ceilings. Extensive checklists exist covering the checks and
verifications to be made. Once these are prepared they are submitted to AGD (Other Charges
Unit) which undertakes further scrutiny and checks. The Other Charges Unit of the AGD is
responsible for the processing of payments (apart from payroll and pensions) from the
Consolidated Revenue Fund for all ministries, departments and agencies and reporting on
these payments; ensuring that the MDAs adhere to all financial regulations in force; to enable
the AGD to maintain a sound pre-audit verification process.
The control environment comprises a number of levels of detailed checks and verifications
aimed at Financial Management Regulations compliance. Currently, an accounting
procedures manual is in the process of being developed for the Accountant General's
Department and is now at an advanced stage. This addresses various issues including Human
Resources and Payroll, Purchasing and Stores, General Ledger and Revenue Accounting and
would be used by the respective MDAs in the conduct of their accounting responsibilities.
It is evident that a comprehensive set of controls exist which are designed to address
compliance with rules in procurement and other expenditure processes, prevention and
detection of mistakes and fraud, safeguarding of information and assets, and quality and
timeliness of accounting and reporting.
These controls do exhibit a high level of centralisation, possibly some duplication, multiple
signatories and they will almost certainly absorb significant amounts of officers’ time.
However, they should also be assessed in terms of their proportionality against the significant
and ongoing control problems and levels of corruption experienced in Sierra Leone.
At an administrative level there are many levels of control both within MDAs and centrally
operated by the AGD. Detailed processing checks are performed in respect of all budget
executions, firstly by the MDA and then by AGD Other Charges Unit. In 2009, the Other
Charges Unit, set up a database monitoring system which recorded error rejection rates.
However, in 2012 problems occurred with the database and a manual recording system was
designed to replace it - but this does not provide any analysis. Therefore, it is not possible to
compare current performance with that in 2010.
Score: C. “Other Charges” internal control rules and procedures incorporate a comprehensive
set of controls at a transaction level. The absence of up to date error rate monitoring statistics
does not permit at the draft report stage an assessment to be made about the extent of the
understanding and compliance by those who operate them. A new development is the drafting
of the Accounting Manual which is yet to be finalised and implemented.
(iii) Degree of compliance with rules for processing and recording transactions
This dimension considers the extent to which compliance with rules is generally strong or
weak and whether there is the availability of data on error or rejection rates. It also looks at
how widespread the unjustified use of procedures is.
At a strategic level, the Auditor General’s Annual Report on the Accounts and internal audit
reports continue to highlight areas of non-compliance with respect to internal control issues.
The existence of a recording system for query statistics to measure the accuracy of vouchers
and documents sent to the AGD for payment is useful management information, and can

58
providefeedback to controllers with a view to identify system improvements. However, the
automated analysis of these statistics which was available from this database during the last
PEFA is now being monitored manually due to system problems which occurred in 2012.
This is a backward step because the current approach does not facilitate strategic analysis of
management information on, for example, error rates by Ministry.
Score 2014 and PEFA Scoring Criteria
(Scoring Method 1)
Score 2010
PI-20. Effectiveness
of internal
controls for
non-salary
expenditure
Overall Score: C
• Dimension (i) Score C: Expenditure
commitment control procedures exist and
are partially effective, but they may not
comprehensively cover all expenditures
or they may occasionally be violated
• Dimension (ii) Score C: Other internal
control rules and procedures incorporate
a comprehensive set of controls which are
widely understood but may in some areas
be excessive.
• Dimension (iii) Score C: Rules are
complied with in a significant majority of
transactions but use of simplified or
emergency procedures in unjustified
situations is an important concern
Overall Score: C+
Dimension (i) Score B
Dimension (ii) Score B
Dimension (iii) Score C
The slight deterioration in the overall score has resulted from the absence of data on error
rates in the 2014 PEFA which had been available in 2010.
PI -21 Effectiveness of internal audit
The GBAA 2005 Act established the internal audit function and raised its profile by
codifying the function in statute. However, in organizational development terms internal
audit remains a relatively new function for MDAs. ‘’Internal Audit is a pillar for effective
public financial management …properly configured and with appropriate level of
independence, sound internal audit contributes to maintaining the system of internal control,
management, accountability and governance in the public sector37
…’’
There appears to be increasing understanding of the role within MDAs although there are
variable levels of acceptance and budgetary support for operational activities. Although the
salaries of the internal audit cadre are almost all paid from the MoFED budget, other
resources for operational activities depend on the vote controllers and insufficient resource
allocation can render them ineffective.
37 ASSL Report of the Government of Sierra Leone’s Financial Accounts for the Year Ended 31st December 2012
Score C: Rules appear to be are complied with in a significant majority of transactions, and
records of rejection rates are recorded but do not appear to be analysed to the same extent as
in 2010 PEFA due to problems with the database.

59
An Internal Audit Strategy has been drafted and shared internally with MoFED – the strategy
is driven by strategic objectives both within and across MDAs and seeks to deliver greater
integration of assurance and more effective engagement of key stakeholders on the roles of
the internal auditor38
.
An in-depth review of internal audit was undertaken by ASSL in 2013 using an international
model and assessment criteria39
.
(i) Coverage and quality of the internal audit function
The Internal Audit Unit of MoFED has the harmonisation and supervision role of internal
audit units. It has the statutory authority to co-ordinate and manage the internal audit cadre, to
set standards and monitor performance. Most internal auditors are funded by MoFED; but
some are funded by donor programs and are based in MDAs in order to review and report on
donor funded projects. These Internal Audit Units are established but are not necessarily
adequately resourced for all MDAs and are far from being fully implemented in a consistent
way..
At the time of the 2010 PEFA there had been a revision to the approved establishment and a
significant number of new staff with higher entry level qualifications was recruited. The
approved establishment in 2010 was 134 staff (which still applies) of which 69 posts are now
funded and filled across Central Government, as at February 2014. The Internal Audit
Department Annual Report for 2012 indicated that 38 MDAs had functioning internal audit
departments.
There is an audit manual ‘’Government of Sierra Leone: Internal Audit Manual for
Ministries, Department and Government Agencies’’ which was first issued in September
2006. This incorporates international audit standards and principles and as this is increasingly
implemented it should increase the coverage and quality of the internal audit function.
Currently, working papers and reports do not fully comply with the manual. In addition, the
review exercise conducted by ASSL has indicated that it is timely to give it a thorough
review as some sections are not up to date. Examples cited are the IT Audit section, and the
matter of placing audit working papers in the public domain and available to the media which
is at variance with international practice.
The Director of Internal Audit (MoFED) chairs quarterly meetings of the Heads of Audit
across MDAs. Annual audit planning at these meetings is in its infancy.
The establishment of functioning Audit Committees within MDAs remains to be fully
implemented although there appears to be a need for greater guidance on the composition of
such committees, and other matters, in order that they are established in an effective manner.
Score C↑: The internal audit function has been introduced for at least the most important
central government entities and undertakes some audits which comment on systems issues,
although in practice it does not yet fully meet recognised professional standards. The recent
ASSL review of internal audit concluded that there were sustainable internal audit practices
and procedures available but they were not yet well established throughout the public sector.
This demonstrates some improvement and further development since the 2010 PEFA though
not yet sufficient to warrant a “B’’ score.
38 Extract from IPFM,RP Strategy Document on the development of the internal audit strategy 39 Institute of Internal Audit Research Foundation’s Internal Audit Capability Model and Internal Audit Assessment Criteria derived from the Office of the Superintendent of Financial Institutions in Canada.

60
(ii) Frequency and distribution of reports
Since 2011 the Head of Internal Audit has produced Annual Reports. So, far there have been
annual reports covering activities for the fiscal years 2011 and 2012 and they are presented to
the Minister of Finance and Economic Development and the Financial Secretary.
We are advised that MDA internal audit reports are now routinely submitted to ASSL and to
MoFED’s Head of Audit which was not the case in 2010.
Score B: Reports appear to be issued with increasing regularity for most government entities.
The reports are submitted to the Head of Internal Audit, the vote controllers, with copies to
the central (MoFED) Audit Committee. Periodically copies are also sent to the ASSL
(iii) Extent of management response to internal audit findings
Most reports produced by the internal audit departments are eventually addressed by
management with partial implementation of recommendations in some instances. The
timeline for management’s response to reports in MDAs is three months on average but some
take much longer than that40
.
The Annual Report 2012 of the Head of Internal Audit comments that ‘’...most vote –
controllers do not implement the internal auditor’s recommendations and these eventually go
into the external auditor’s report...’’ - so the overall situation is somewhat conflicted.
However, there does appear to be improved evidence when compared to 2010 of more
systematic reporting and monitoring mechanisms with respect to audit findings and
recommendations.
Score D↑: There are examples of audit reports where management has responded to audit
findings and recommendations, but it is not a sufficiently clear and consistent picture to
improve the score at this stage as evidenced by the comments of ASSL and the Internal Audit
Department’s Annual Report 2012.
Score 2014 and PEFA Scoring Criteria
met (Scoring Method M1).
Score 2010
PI-21. Effectiveness
of Internal
Audit
Overall Score: D+↑
• Dimension (i) Score C↑: The
function is operational for at least
the most important central
government entities and undertakes
some systems review (at least 20%
of staff time), but may not meet
recognized professional standards.
• Dimension (ii) Score B: Reports are
issued regularly for most audited
entities government entities, and
distributed to the audited entity, the
Ministry of Finance and the SAI.
• Dimension (iii) Score D↑ Internal
audit recommendations are usually
ignored (with some exceptions).
Overall Score: D+↑
Dimension (i) Score C:
Dimension (i) Score C:
Dimension (i) Score D↑:
40 Conclusion of ASSL Review of Internal Audit

61
The Internal Audit function continues to develop and strengthen in the numbers and calibre of
auditors, the volume of reports produced and the understanding of the function by MDAs.
Action on audit findings appears to be improving though not yet quite sufficient to justify a
‘’C’’ score.
3.5 Accounting, recording and reporting
PI-22: Timeliness and regularity of accounts reconciliation
This indicator is concerned only with the 61 Treasury Accounts which are those managed by
the Accountant General.
However, it is worth noting in the wider context of bank reconciliation in Sierra Leone that
the bank reconciliation process has featured in the Auditor General’s reports during the three
year period since the last PEFA. The ASSL 2010 Report cited concerns over the lack of
availability of information to substantiate cash and bank balances with the commercial banks.
The strongest comments were in the ASSL 2011 Report for which systemic weak bank
reconciliation disciplines were cited as one of three reasons contributing to the Auditor
General’s ‘’Disclaimer of Opinion’’ for that year.
In the latest Report for 2012 the situation appeared to have improved with a more positive
audit narrative which recognises the current project to move towards the Treasury Single
Account (TSA) and the creation of a database which provides an inventory of bank accounts
in the Government’s name which currently number more than 1,100. Even with the existence
of the improved inventory of bank accounts, the Auditor General’s 2011 Report noted the
fact that not all bank accounts were included in the financial statements of Sierra Leone.
Additionally, it is recognised that delays in the daily transfers of receipts from commercial
banks, for various reasons ‘’…continues to severely hamper the integrity and accuracy of
AGD receipts, reports and bank reconciliations, and cause basic financial reporting to
monitor the GOSL cash position on a daily basis to remain flawed as a result, not enabling
sound cash flow forecasting and a better planning of short-term debt requirements…’’
Within the Accountant General’s structure the reconciliation of bank accounts is split
between those designated Treasury Accounts, managed and reconciled by the Accountant
General and those for which individual MDAs have the responsibility to reconcile.
Whilst this indicator deals only with Treasury Accounts managed by the Accountant General
as these number only 61 out of an identified (to date) total of 1133 it is important to
acknowledge that outside of this bank reconciliation process the overall discipline and
systematic reconciliation of other accounts by MDAs (and others) is not strong (reference
Auditor General’s reports )
GoSL has a plan for the introduction of a Single Treasury Account and the first stage of this
has been an exercise to identify all of the government bank accounts. To date 1,133 have
been identified although it is known that this is not a complete list and further work which

62
builds on the identification and rationalization of government related bank accounts will be
required.
(i) Regularity of bank reconciliations
The established routine within AGD is that there is a daily cash balance summary available of
all Treasury Accounts and a discipline of regular monthly reconciliations which are
completed by the 15th
day of the following month.At the time of this PEFA this routine had
been affected by some 2013 year end and start of 2014 disruption.
We were informed that BoSL introduced new software in June 2013 that appears to have caused some reconciliation and data matching problems for AGD’s reconciliation processes
in subsequent months.41
The reconciliation for the period ended 31st January 2014 was completed by 25th February
2014.
Score B. Bank reconciliation for all Treasury managed bank accounts take place at least
monthly , usually within 4 weeks from the end of month.
(ii) Regularity of reconciliation and clearance of suspense accounts and advances.
The system for the reconciliation and repayment of advances to employees appears to have
sound controls operating.
The Government does operate a system of salary advances on a ‘rolling’ basis. Examples of
the reasons for such advances are that they are given to cover college fees or for sickness.
There are controls over the maximum advances permitted and these must be repaid over a 36
month period before a further advance can be made. The Head of Entity / MDA approves any
advances which are then checked and verified by the AGD before the advance is made. There
is control over the repayments by AGD ensuring that these deductions from salary are made
every month and these deductions form part of the monthly accounting and reconciliation
disciplines. Maximum advances are Le 1.5 million for junior officers, Le 2.5 million for
senior officers and Le 4 million for parliamentarians.
AGD informed the PEFA team that there are no suspense accounts in operation which is the
same position as at the last PEFA.
Score B: There are no suspense accounts reported as existing and the procedure for
controlling advances appears to have sound controls operating.
Score 2014 and PEFA Scoring Criteria met
(Scoring Method M2).
Score 2010
PI-22. Timeliness
and regularity
of accounts
Overall Score: B
• Dimension (i) Score: B: Bank reconciliations for all Treasury Managed Bank Accounts
takes place at least monthly , usually within 4
Overall Score: B
Dimension (i) Score:
B
41 Problems with matching amounts between the GoSL cashbook and the figures shown on bank statements
(which included exchange rate differences); sometimes descriptions were vague; account numbers and legacy
accounts (T24)

63
reconciliation weeks from the end of month.
• Dimension (ii) Score: B: Reconciliation and
clearance of suspense accounts and advances
take place at least annually within two months
of end of period. Some accounts have
uncleared balances brought forward.
Dimension (ii) Score:
B
The level of performance has been sustained between the two assessments.
PI-23 Availability of information on resources received by service delivery units
The availability of information (financial and non-financial) which can be used to
demonstrate the resources (in kind and cash) that were actually received by front-line service
delivery units compared to the overall resources known to have been made available to the
sector(s) is vital to improving transparency and accountability.
The indicator is focussed on tracking the flow of relevant information, and in doing so
following the money, through all levels of government to determine whether the PFM
systems effectively support front -line service delivery by ensuring all intended resources are
received in a timely manner. The extent to which existing government information systems
are adequate to capture this information is considered together with any relevant alternative
information sources such as inspections, audits, ad hoc assessments and PETS that are able to
add value.
The PEFA focus is on primary schools and primary health care units although the same
tracking principles are relevant across all services. Overall, whilst PETS are a useful
diagnostic tool which can aid the identification of problems – they are not a substitute for the
on-going improvements to continuous monitoring systems which capture all resources.
In Sierra Leone, Public Expenditure Tracking Surveys (PETS) are the subject of paragraph
164D of the Financial Management Regulations 2007, which sets out the authority and
procedures for implementing recommendations though a Steering Committee. In 2001, the
Economic Policy Research Unit (EPRU) of the MoFED established the PETS Task Team
(i) Collection and processing of information to demonstrate the resources that were
actually received (in cash and kind) by the most common front-line service delivery
units (focus on primary schools and primary health clinics) in relation to the overall
resources made available to the sector(s), irrespective of which level of government is
responsible for the operation and funding of those units.
The results of GoSL PETS surveys were issued in 2010 which reported on fiscal years 2008
and 2009, and in November 2011 reporting on fiscal years 2010 and 2011. No tracking
survey was carried out in 2012 with the election cited as the reason and none in 2013. The
reasons indicated a prioritisation of other surveys (Democratic Survey, Household Survey,
Labour Market Survey) to explain why PETS are not currently a regular feature of the
monitoring system.
At local council level there appears to be increased use of the Channel Database for recording
and monitoring primary health supplies. Therefore, information and recording systems are

64
available alongside the IFMIS systems and other databases, albeit not integrated, which exist
to record financial and non-financial information. However, this is not compiled into reports
on at least an annual basis.
The November 2011 PETS tracking survey which considered the distribution of essential
drugs and the procurement and delivery of teaching and learning materials to local councils
raised a number of significant recommendations about the percentages of receipt of goods
compared to those issued, procurement concerns, distribution concerns, poor records
management.
It is not apparent the extent to which the PETS survey findings and recommendations are
circulated to relevant stakeholders. Although a monitoring mission in 201242
was informed that the PETS report would be finalised and submitted to Parliament.
In addition, it is worth noting that other information which can be used to triangulate also
exists. For example an extract from an external report43
in September 2012 states: ‘’…the
current system for supplying cost recovery drugs is in disarray, with some facilities denying
that they have any, others acknowledging that they have some but being totally vague about
issues of pricing and re-supply. In no case did the evaluation team encounter complete books
of accounts recording income and expenditure from fees or drug sales…’’
Score C: A PETS surveys was reported in 2011 but none in 2012 and 2013. It is not clear
whether there will be a PETS exercise during 2014 therefore they cannot be assessed as a
regular feature of the monitoring system. Data collection systems are not compiled into
reports at least annually
Score 2014 and PEFA Scoring Criteria met
(Scoring Method M1).
Score 2010
PI-23. Availability of
information on
resources
received by
service delivery
units
Score: C. Dimension (i) Score: C. Special surveys
undertaken within the last three years have
demonstrated the level of resources received in
cash and in kind by either primary schools or
primary health clinics covering a significant part
of the country or by primary service delivery units
at local community level in several other sectors.
Score: A Dimension (i) Score:
A
The deterioration in score arises from the fact that PETS are no longer being undertaken on a
regular basis compared to the situation in 2010. Also, the information captured by the various
data collection systems at local level is not analysed and compiled into strategic reports on
which action is taken.
42 Mid Term Supervision Mission of the Sierra Leone Integrated Public Financial Management Reform Project carried out 18th -27th June 2012
43 Evaluation of DFID Support to Healthcare Workers Salaries in Sierra Leone by Debbra Stevenson, Charles Kinyeki, Mark Wheeler. Dated
7th September 2012

65
PI-24 Quality and timeliness of in-year budget reports
This indicator focuses on the ability to produce comprehensive information from the Free
Balance (IFMIS) accounting system on all aspects of the budget including expenditure at the
payment and accounting stage.
The responsibility appears to rest principally with the Ministry of Finance (Accountant
General’s Department) who initiate the reports on a monthly and quarterly basis, including
the circulation of quarterly reports to MDAs.
(i) Scope of reports in terms of coverage and compatibility with budget estimates
The in-year budget execution fiscal reports are available from the IFMIS system. The reports
indicate whether resources have been used in conformity with legal authorisations and
mandatory requirements. The reports also show the status of resources and expenditures
(uncommitted balances and undisbursed commitments).
The regular reports take into account the needs of different users and in addition to standard
monthly reports, “flash reports” can be produced at any time. The level of centralisation in
GoSL gives MoFED the key role in producing the reports and dissemination to the MDAs
The reports listed below are the regular monthly reports produced and sent to the various
MDAs to help them with decision making:
• Allocation monitoring - the analysis of funds provided for and used by an MDA
during a specified period. The report normally indicates the variance between the
provision of funds and the use of funds and this is a measure of the capacity of an
MDA in budget planning and execution. The report is provided quarterly on a
cumulative basis to vote controllers though it can be provided on demand as well.
• Expense analysis report – shows the processed transactions by MDAs which can be
used to track all payments made on their behalf In addition, for the National Revenue Authority the ‘’Withholding Tax Report ‘’ is produced
on a quarterly basis.
All reports produced and circulated are sent with a letter which states that the MDA is
required to reconcile the information contained in the report with their own records and
highlight any discrepancies back to the AGD.
Score B: There is a systematic production system of regular in year budget monitoring
reports. Those produced are extensive in the detailed analysis; however, there is scope for
further improvement in terms of total coverage of all items of budget estimates.
(ii) Timeliness of the issue of reports
The regular fiscal performance reports are produced on a monthly and quarterly basis
initiated by the Financial Management and Accounts Unit. These are approved by the
Accountant General before publication on the website and in the printed Gazette on a
66
monthly and quarterly basis. The PEFA Team was advised that the reports were issued within
four weeks of the end of the accounting period44
.
Other MDA-level budget execution reports are produced on a monthly basis by AGD-Other
Charges Unit. All MDAs are able to access the various reporting modules as part of their
IFMIS access, at any time. For those MDAs who have ‘’rolled out ‘’ access to IFMIS this can
be done at their own ministry. There does not appear to be widespread use of these reporting
functions by MDAs with AGD-Other Charges Unit being the principal point of contact if
reports are required by line ministries.
Score A: In-year budget reports can be produced at any time and MDAs can request them at
any time
(iii) Quality of information.
The quality and accuracy of information is increasing. This is being achieved in a number of
ways including from the roll out of IFMIS and the additional accuracy and levels of
reconciliations which are inherent system improvements. There are increasingly tighter
controls and greater levels of scrutiny and data integrity being introduced into the separate
feeder systems although further control and integration improvements are required.
Completeness is one aspect where further work is required in particular the inclusion of
subvented agencies and donor funded projects. In addition, there are recognised inaccuracies
such as in revenue forecasts and outturns also referred to with PI-3 which considers the
previous three fiscal years during which there were significant variances, although in 2013
(the period assessed by indicator PI-24 the degree of over-estimation had been
reduced.45
There are further improvements to be made in the completeness and accuracy of
the information captured by the IFMIS management reports, however, on-going progress has
been made since the last PEFA. In addition, to the capture of data by MoFED from IFMIS
systems future improvements could include some analysis of completeness. The important
requirement is that data is sufficiently accurate to be of real use to all parties.
Score B: There are further improvements to be made in the completeness and accuracy of the
information captured by the IFMIS management reports, however, on-going progress has
been made since the last PEFA.
Score 2014 and PEFA Scoring Criteria met (Scoring
Method M1).
Score 2010
PI-24. Quality and
Timeliness of
Overall Score: B+
• Dimension (i) Score B: Classification of data
allows direct comparison to the original budget
Overall Score: B+
Dimension (i) Score
B
44 Evidence of the dates of reports uploaded to the website outstanding from AGD-ICT Unit 45
It should be noted that there remains a degree of uncertainty regarding the data in that the AG reports of 2010 indicated “uncertainly over
domestic revenue disclosed” and in 2011 there was failure to give an opinion as there was insufficient audit evidence provided to form an opinion.Again, it can be seen that the degree of overestimate has been reduced in 2013.

67
in-year
budget
execution
reports
but only with some aggregation. Expenditure is
covered at both commitment and payment
stages.
• Dimension (ii) Score A: Reports are prepared
quarterly or more frequently, and issued within 4 weeks of end of period.
• Dimension (iii) Score B: There are some
concerns about accuracy but data issues are
generally highlighted in the reports and do not
compromise overall consistency / usefulness.
Dimension (ii) Score
A
Dimension (iii) Score
B
No change in scoring between the PEFA assessments.
PI-25 Quality and timeliness of annual financial statements
(i). Completeness of the Financial Statements.
The Financial Statements reflect the financial performance of the GoSL on the basis of moneys received by, held in or paid out of the Consolidated Fund including amounts
allocated to Projects during the year under review. The Government through the Accountant
General’s Department (The Treasury) operates a centralised treasury function that accounts
for moneys collected by the National Revenue Authority and administers cash expenditures
incurred by all MDAs during the financial year.
The Annual Public Accounts of the Government of Sierra Leone include the results of
financial operations of all its MDAs that were processed through the National Treasury and
other public funds relating to donor funds, especially donor-financed development projects.
Income and expenditure submitted in respect of their operations during the financial year is at
least partially included in the financial statements.
Since PEFA 2010 the completeness of the financial statements has improved by the inclusion
of some fiscal information in respect of AGAs, although other public funds including many
aspects of donor funds and AGAs are still not fully included in the financial statements, or
not included as gross figures which would provide a more complete and accurate reflection of
the scale of operations.
The Auditor General’s 2012 Report states ‘’there is a need to address the nature of the
modified cash basis of accounting as well as both the quality and accuracy of
accounting…the very definition of what constitutes the government accounting entity
remains to be considered, as at present all government bank accounts are not included in the
Financial Statements of the Government of Sierra Leone…’’
Intermediate Outcome
Indicators:
M&E Framework of
the Mid Term
Supervision Missions
for IPFMRP
Baseline 2008:
18th
-27th
June
2012 Report
2010 Actual :
18th
-27th
June 2012
Report
2011 Actual :
18th
-27th
June 2012
Report
2012 Actual:
25th
-27th
March 2013
Report

68
2.3 Timely publication of
comprehensive annual
financial statements with
reference to PEFA
standards
Public
accounts omit
sub-vented
agencies
expenditure
(about 40% of
total
expenditure
captured);
incomplete
fiscal/monetary
reconciliation
Quarterly
returns
obtained by
AGD from
subvented
agencies and
PIU’s are yet
to be included
in the
financial
statements.
Efforts are
nevertheless
directed
towards
improving
the data
collection
rate by the
AGD
58% of project
expenditure
and 73% of
sub-vented
agencies
expenditures
were
recorded in
the system.
Achieved
indicator
No longer
assessed
under M&E
Framework
Challenges faced by AGD to improve the level of fiscal transparency and enable better
accountability in GoSL in accordance with the GBAA and more recently IPSAS reporting
requirements are acknowledged46
to be:
▪ The budget and treasury ledgering systems remaining largely fragmented into various
software applications
▪ Multiplicity of bank accounts and off-budget funds exist often with many accounts
per MDA
▪ The central government not being able to capture and report a large number of
receipts and expenditures on a regular basis and through a more unified and
consolidated reporting facility – thus resulting in various unexplained balances and
other un-reconciled items by spending
▪ Designated commercial banks contracted as fiscal agents by the Treasury to collect
revenue receipts do not transfer to the Treasury on a daily basis.
There has been improvement in the completeness of coverage within the financial statements,
as indicated by the analysis above, However, the Auditor General in her Annual Report on
the 2012 Accounts issued an adverse opinion which included the following issues and
necessitated a ‘’D’’ score.
▪ Government Bank Balances disclosed in the Public Accounts were not free from material misstatement
▪ Accounting for External Public Debt contained many inaccuracies
▪ Government Domestic Revenue for the Year ended 31st December, 2012 as presented
46 Mid Term Supervision Mission of the Sierra Leone Integrated Public Financial Management Reform Project carried out 25th -27th March
2013 (paragraph 14)

69
in the Public Accounts, did not include all moneys collected and was, therefore understated
(ii) Timeliness of submission of the financial statements
The improvements achieved and reported in the 2010 PEFA have been sustained for the years 2010, 2011, 2012 and we were informed that the Accountant General’s Office is
expecting to meet the 31st
March 2014 deadline for submission of the 2013 financial accounts:
Statement of Accounts Year
Ended
Submitted to Auditor
General
No. of Months after end of
Fiscal Year
31st
December 2012 26th
March 2013 < 3 months
31st
December 2011 27th
March 2012 < 3 months
31st
December 2010 31st
March 2011 < 3 months
The audited and unaudited accounts are posted on the website47
(iii) Accounting Standards Used
The evidence base for this indicator covers the last three financial years. The importance of
financial accounting standards is their contribution to transparency of presentation in year and
consistency of presentation between years. In particular, the International Public Sector
Accounting Standards are important for better financial reporting by governments and the
need for improvements in the management of public sector resources. Since 1997, the
International Public Sector Accounting Standards Board (IPSASB) has developed and issued
a suite of 32 accrual standards and a cash basis standard for countries moving towards full
accrual accounting. The cash basis standard encourages an entity to voluntarily disclose
accrual-based information by including particular accrual-based disclosures in the process of
transition. Where national standards are applied rather than full international standards –
those national standards should be aligned with recognised international standards.
The following table presents relevant extracts from the last three years audited accounts
indicating the basis of accounts preparation in Sierra Leone. AGD has considered the
implications for the adoption of IPSAS for Sierra Leone48
and in recent years there have been
efforts to improve the presentation of the annual accounts. The extent of what is involved in
any planned transition to IPSAS and accrual accounting is fully recognised by AGD
including the extent of the resources that would need to be committed and factors beyond
47 Dates of upload are outstanding from AGD-ICT Unit 48 AGD Concept Paper: The Roadmap for the Adoption of IPSAS in Sierra Leone’’
Score D: A consolidated government statement is not prepared annually, OR essential
information is missing from the financial statements OR the financial records are too
poor to enable audit
Score A: The Financial Statements are submitted in a timely manner and earlier years’
improvements have been sustained.
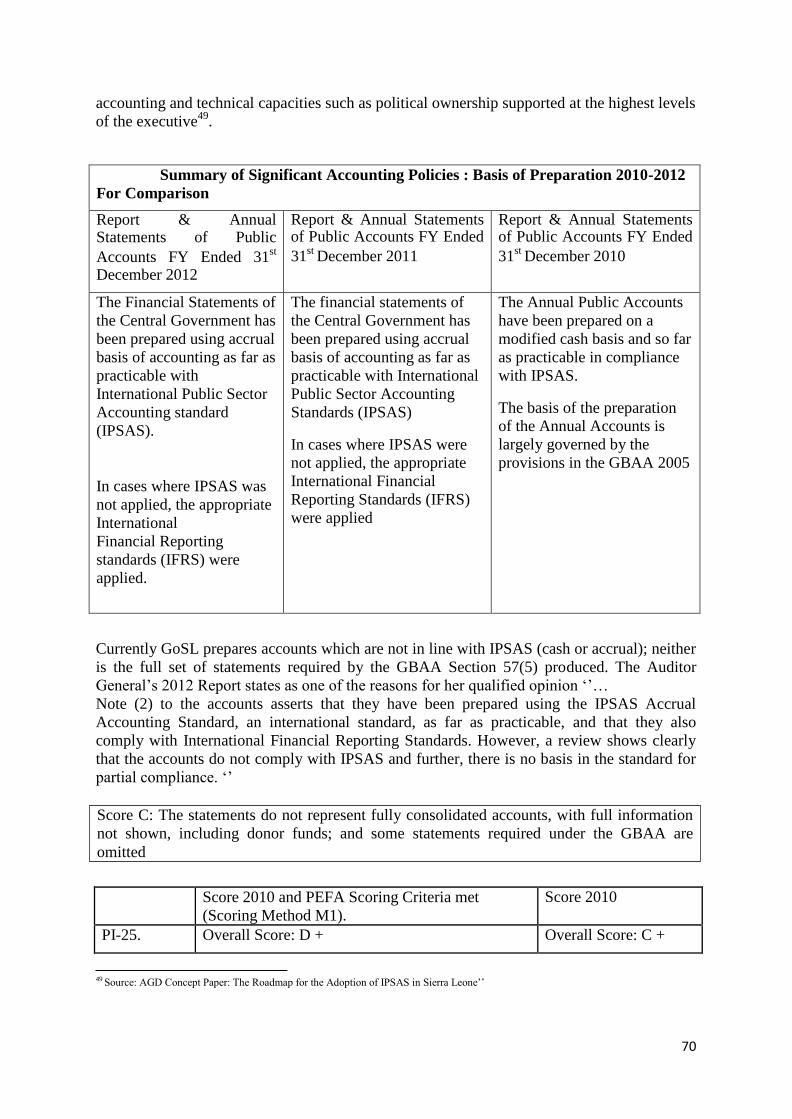
70
accounting and technical capacities such as political ownership supported at the highest levels
of the executive49
.
Summary of Significant Accounting Policies : Basis of Preparation 2010-2012
For Comparison
Report & Annual Statements of Public
Accounts FY Ended 31st
December 2012
Report & Annual Statements of Public Accounts FY Ended
31st
December 2011
Report & Annual Statements of Public Accounts FY Ended
31st
December 2010
The Financial Statements of
the Central Government has
been prepared using accrual
basis of accounting as far as
practicable with
International Public Sector
Accounting standard
(IPSAS).
In cases where IPSAS was
not applied, the appropriate
International
Financial Reporting
standards (IFRS) were
applied.
The financial statements of
the Central Government has
been prepared using accrual
basis of accounting as far as
practicable with International
Public Sector Accounting
Standards (IPSAS)
In cases where IPSAS were
not applied, the appropriate
International Financial
Reporting Standards (IFRS)
were applied
The Annual Public Accounts
have been prepared on a
modified cash basis and so far
as practicable in compliance
with IPSAS.
The basis of the preparation
of the Annual Accounts is
largely governed by the
provisions in the GBAA 2005
Currently GoSL prepares accounts which are not in line with IPSAS (cash or accrual); neither
is the full set of statements required by the GBAA Section 57(5) produced. The Auditor
General’s 2012 Report states as one of the reasons for her qualified opinion ‘’…
Note (2) to the accounts asserts that they have been prepared using the IPSAS Accrual
Accounting Standard, an international standard, as far as practicable, and that they also
comply with International Financial Reporting Standards. However, a review shows clearly
that the accounts do not comply with IPSAS and further, there is no basis in the standard for
partial compliance. ‘’
Score 2010 and PEFA Scoring Criteria met
(Scoring Method M1).
Score 2010
PI-25. Overall Score: D + Overall Score: C +
49 Source: AGD Concept Paper: The Roadmap for the Adoption of IPSAS in Sierra Leone’’
Score C: The statements do not represent fully consolidated accounts, with full information
not shown, including donor funds; and some statements required under the GBAA are
omitted

71
Quality and
timeliness of
annual
financial
statements.
• Dimension (i) D: A consolidated government
statement is not prepared annually, OR
essential information is missing from the
financial statements OR the financial records
are too poor to enable audit
• Dimension (ii) Score A: The statement is
submitted for external audit within six months
of the end of the fiscal year.
• Dimension (iii) Score C: Statements are
presented in consistent format over time with
some disclosure of accounting standards
Dimension (i) Score C:
Dimension (ii) Score
A:
Dimension (iii) Score
C:
The overall score has deteriorated to D+ from C+ because of the Auditor General’s adverse
opinion, but other improvements since the 2010 PEFA in the financial statements assessed
by dimensions (ii) and (iii) have been recognised.
3.6 External scrutiny and audit
PI-26 Scope, nature and follow up of external audit
A high quality external audit is recognised as an essential requirement for creating
transparency in the use of public funds.
ASSL has a mandate to perform financial audit in relation to the Public Accounts (the
consolidated fund), 19 local councils, and around 45 public enterprises, commissions and
public funds. Since the last PEFA there has been no change to the over-arching Constitutional
basis (Section 119(4) of the 1991 Constitution) or the Legislative basis (ASSL Act 1998) in
terms of the regulation of the external audit mandate in Sierra Leone.
(i) Scope/nature of audit performed (incl. adherence to auditing standards)
ASSL audits the financial statements of the public accounts (its primary responsibility) as
well as all other financial statements under its mandate which are received (e.g. for local
councils, public enterprises, commissions and public funds). However, a significant number
of these organizations fail to deliver their financial statements within statutory deadlines and
a number of them have not done so for a number of years50
. Inclusion in the Auditor
General’s report of findings from outsourced audits has improved over time although the
limiting factor appears to be where the public entities are required to submit annual financial
statements and audit reports within the deadlines set out in their respective legislation and are
not doing so. The audit of public enterprises represents an area requiring ongoing
improvement51
.
Performance Audit reports a consistent and new area of audit scope since 2009/2010. The
Auditor General’s report on the accounts has, since 2011, included a separate section on the
50 Source: IDI Draft SAI Performance Assessment Framework December 2012 51 Source:File review of PE’s indicated significant inadequacies in the audit files that needed to be tackled in order to provide an
international standard audit file and an adequately supported and appropriate audit opinion in future. There was considerable variation in
file quality, but some files were very poor, and represented a real risk to ASSL in terms of an incorrect opinion upon PE Financial
Statements
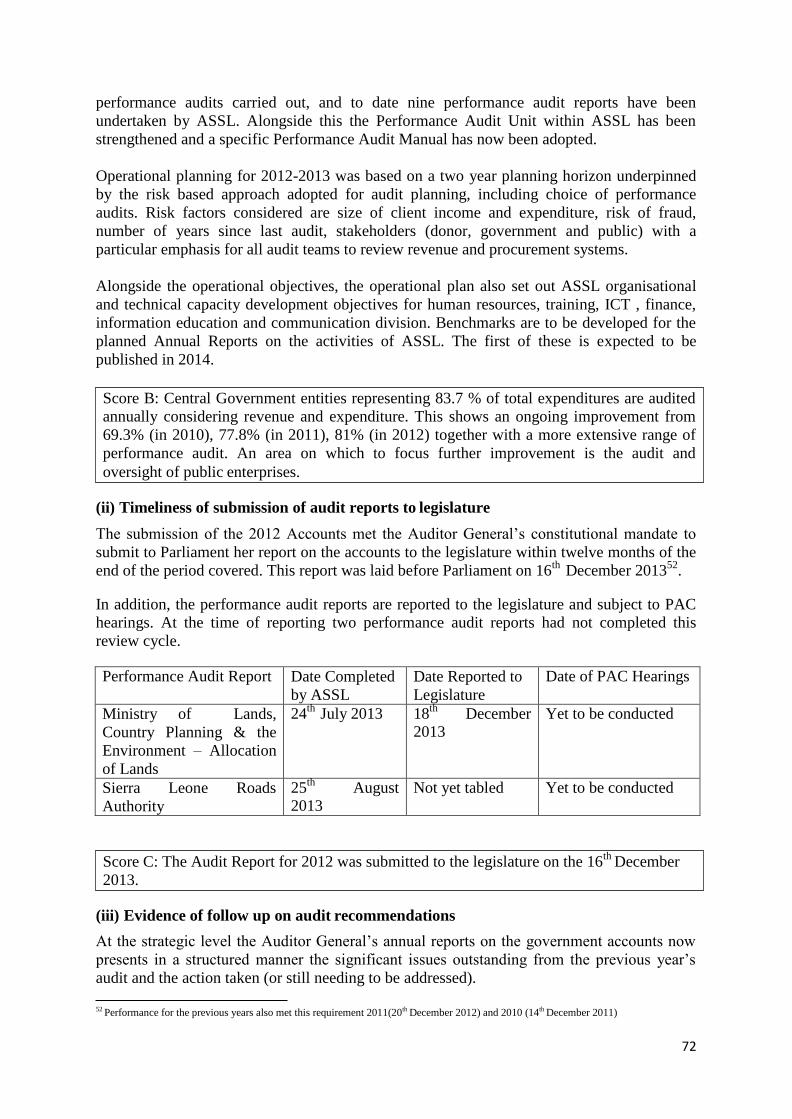
72
performance audits carried out, and to date nine performance audit reports have been
undertaken by ASSL. Alongside this the Performance Audit Unit within ASSL has been
strengthened and a specific Performance Audit Manual has now been adopted.
Operational planning for 2012-2013 was based on a two year planning horizon underpinned
by the risk based approach adopted for audit planning, including choice of performance
audits. Risk factors considered are size of client income and expenditure, risk of fraud,
number of years since last audit, stakeholders (donor, government and public) with a
particular emphasis for all audit teams to review revenue and procurement systems.
Alongside the operational objectives, the operational plan also set out ASSL organisational
and technical capacity development objectives for human resources, training, ICT , finance,
information education and communication division. Benchmarks are to be developed for the
planned Annual Reports on the activities of ASSL. The first of these is expected to be
published in 2014.
(ii) Timeliness of submission of audit reports to legislature
The submission of the 2012 Accounts met the Auditor General’s constitutional mandate to
submit to Parliament her report on the accounts to the legislature within twelve months of the
end of the period covered. This report was laid before Parliament on 16th
December 201352
.
In addition, the performance audit reports are reported to the legislature and subject to PAC
hearings. At the time of reporting two performance audit reports had not completed this
review cycle.
Performance Audit Report Date Completed
by ASSL
Date Reported to
Legislature
Date of PAC Hearings
Ministry of Lands,
Country Planning & the
Environment – Allocation
of Lands
24th
July 2013 18th
December 2013
Yet to be conducted
Sierra Leone Roads
Authority
25th
August 2013
Not yet tabled Yet to be conducted
(iii) Evidence of follow up on audit recommendations
At the strategic level the Auditor General’s annual reports on the government accounts now
presents in a structured manner the significant issues outstanding from the previous year’s
audit and the action taken (or still needing to be addressed).
52 Performance for the previous years also met this requirement 2011(20th December 2012) and 2010 (14th December 2011)
Score B: Central Government entities representing 83.7 % of total expenditures are audited
annually considering revenue and expenditure. This shows an ongoing improvement from
69.3% (in 2010), 77.8% (in 2011), 81% (in 2012) together with a more extensive range of
performance audit. An area on which to focus further improvement is the audit and
oversight of public enterprises.
Score C: The Audit Report for 2012 was submitted to the legislature on the 16th
December
2013.
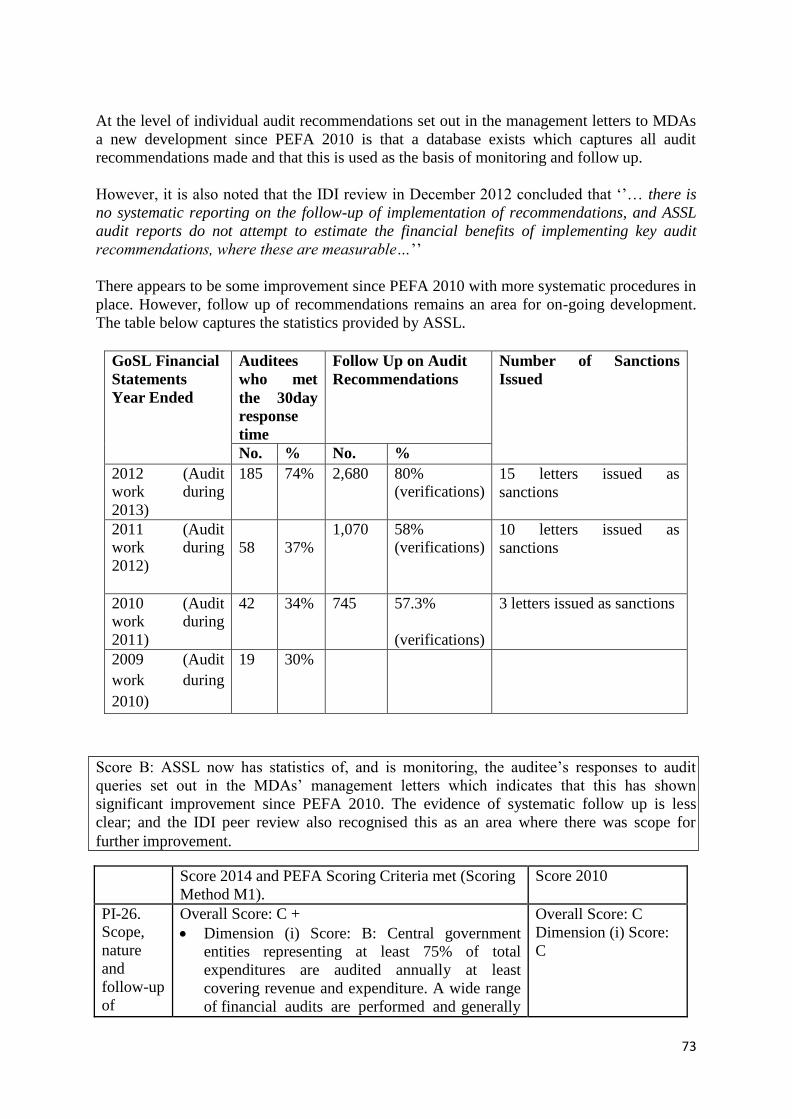
73
At the level of individual audit recommendations set out in the management letters to MDAs
a new development since PEFA 2010 is that a database exists which captures all audit
recommendations made and that this is used as the basis of monitoring and follow up.
However, it is also noted that the IDI review in December 2012 concluded that ‘’… there is
no systematic reporting on the follow-up of implementation of recommendations, and ASSL
audit reports do not attempt to estimate the financial benefits of implementing key audit
recommendations, where these are measurable…’’
There appears to be some improvement since PEFA 2010 with more systematic procedures in
place. However, follow up of recommendations remains an area for on-going development.
The table below captures the statistics provided by ASSL.
GoSL Financial
Statements
Year Ended
Auditees
who met
the 30day
response
time
Follow Up on Audit
Recommendations
Number of Sanctions
Issued
No. % No. %
2012 (Audit work during
2013)
185 74% 2,680 80% (verifications)
15 letters issued as
sanctions
2011 (Audit work during
2012)
58
37%
1,070 58% (verifications)
10 letters issued as
sanctions
2010 (Audit work during
2011)
42 34% 745 57.3%
(verifications)
3 letters issued as sanctions
2009 (Audit
work during
2010)
19 30%
Score 2014 and PEFA Scoring Criteria met (Scoring
Method M1).
Score 2010
PI-26. Scope,
nature
and
follow-up
of
Overall Score: C +
• Dimension (i) Score: B: Central government
entities representing at least 75% of total
expenditures are audited annually at least
covering revenue and expenditure. A wide range
of financial audits are performed and generally
Overall Score: C
Dimension (i) Score:
C
Score B: ASSL now has statistics of, and is monitoring, the auditee’s responses to audit
queries set out in the MDAs’ management letters which indicates that this has shown
significant improvement since PEFA 2010. The evidence of systematic follow up is less
clear; and the IDI peer review also recognised this as an area where there was scope for
further improvement.

74
external
audit.
adheres to auditing standards, focusing on
significant and systemic issues.
• Dimension (ii) Score: C: Audit reports are
submitted to the legislature with twelve months of the end of the period covered
• Dimension (iii) Score: B: A formal response is
made usually in a timely manner, but there is
little evidence of systematic follow up
Dimension (ii) Score:
C
Dimension (iii) Score:
C
The improvement between years reflects improved audit coverage, now 83.7% of total central
government expenditures, alongside a broader audit scope which includes a wide range of
performance audits. Improvements in the system of monitoring the follow up of audit
recommendations have commenced.
PI-27: Legislative Scrutiny of the Annual Budget Law
The power to give the government authority to spend rests with the legislature and is exercised through the passing of the annual budget law. If the legislature does not rigorously examine and debate the law, that power is not being effectively exercised and will undermine
the accountability of the government to the electorate53
.
(i) Scope of the legislature’s scrutiny
The Parliamentary Finance Committee is tasked with supervising the Ministry of Finance and
its subordinated institutions such as the Accountant General’s Department, the Bank of Sierra
Leone and other financial institutions, and the NRA, among others. It provides advice on
Bills and amendments as required.
The Committee examines the budget in the context of the legal statutes (Constitution, and
other relevant legislation). It scrutinises the budget proposed by the Minister of Finance by
examining the estimates for each MDA and the previous year’s actual expenditure. In
carrying out this function, the Committee has the power to summon relevant officials and
ministers to explain past performance. The focus of the review is to ensure that money is
spent as intended and allocations do not exceed budget. For debating the Budget, Parliament
splits itself into five Appropriation subcommittees
The policy implications are not specifically considered by the members of the Finance
Committee. Fiscal policy considerations are presented in the Budget Speech which is debated
for five days by the entire House. The detailed budget estimates are then considered by the
Finance Committee.
Score C: The Committee examines the detailed budget estimates in the context of the legal
statutes after it has been formulated and presented to Parliament.
53
PEFA Framework and Fieldguide

75
(ii) Extent to which the legislature’s procedures are well-established and respected
Parliament is constitutionally responsible for approving the fiscal policy including the
original budget and any supplementary budgets. A supplementary budget was submitted to
Parliament on 4th
July 2013, however, the PEFA Team understands that this was the first time
a supplementary budget was submitted to Parliament for a number of years54
.
There are examples of rules and procedures being breached in recent years.
One example where Parliament has been by-passed in recent times has been in the area of
duty waiver on imports which is indicative of a lack of parliamentary authority. Only
Parliament has the right to waive duty although it may delegate this power to the President as
it has done recently but even in this situation, waivers should be approved by Parliament and
this has not always been the case with individual Ministries granting waivers in their areas of
responsibility without ratification by Parliament. Clearly the general continued by-passing of
Parliament with respect to tax exemptions is damaging to the fiscal position and overrides the
established expenditure approval process.
Score C: Parliamentary authority is only partially respected and has been by-passed in
respect of supplementary estimates, extra-budgetary expenditures and tax exemptions.
(iii) Adequacy of time for the legislature to provide a response to budget proposals both
the detailed estimates and, where applicable, for proposals on macro-fiscal aggregates
earlier in the budget preparation cycle
The coverage of this dimension is based on the last financial year. For the purposes of this
PEFA it is the Budget for 2013. The MTR Mission55
reported that the budget calendar was
revised for the formulation of the 2013 Budget. This was acknowledged as an important
development which had the potential to facilitate the timely review and approval by
Parliament of the budget when compared to the situation in previous years.
In actuality, for the 2013 Budget process the national elections process contributed to a delay
in approval. The FY2013 Budget was presented to Parliament on 21st
December 2012. After
the debates on the detailed budget it was approved on 26th
March 2013. A Presidential
Warrant was therefore required and approved by the House on 21st
December 2012 to enable
the implementation of the 2013 budget ahead of formal approval.
Later, a further supplemental 2013 budget was required and this was presented to Parliament
on 4th
July 2013.
Score D: The 2013 Budget was submitted to Parliament on 21st
December 2012 and approved
on 26th
March 2013. The specific dates of parliamentary and subcommittee debates and hearings, which would facilitate assessment of the actual time allowed for debate, were not provided by the time of the finalization of the PEFA report.
55 Mid Term Supervision Mission of the Sierra Leone Integrated Public Financial Management Reform Project carried out 18th -27th June
2012

76
(iv) Rules for in year amendments to the budget without ex-ante approval by the
legislature
In-year budget amendments constitute a common feature of annual budget processes. In order
not to undermine the significance of the original budget, the authorisation of amendments that
can be done by the executive must be clearly defined and these rules must be adhered to56
.
The IMF Fiscal Affairs Department’s ‘Advancing PFM Reforms’ report stated in 2011:
‘‘Frequent unappropriated expenditures in the year are not subject to the supplementary
approval process required by the law. This practice has been ongoing without challenge from
the Parliament, which is severely lacking in the skill and knowledge to effectively analyze the
Budget documents57
’’
The relevant rules include:
▪ Section 27(2) of the GBAA 2005 states that ‘No payment shall be made in excess of
the amount granted under an appropriation for any service’
▪ Section 112(3) of the 1991 Constitution requires that a supplementary estimate should
be presented to Parliament for approval for expenditures that were not part of the
appropriation or for which funds are insufficient.
▪ Section 112 (4) of the 1991 Constitution also states that the supplementary estimate
approved in S112 (3) should be presented to Parliament the following financial year
in the form of a Supplementary Appropriation Bill.
▪ Section 114(2c) of the 1991 Constitution on the other hand, grants authority to the
President to approve expenditures which were not part of the Appropriation Act
approved by Parliament provided that the President considers the urgency of the
expenditure such that it would not be in the interest of the public to delay such
payments until a Parliamentary approval is sought.
Whilst Section 27(2) of the GBAA 2005 prohibits spending over the approved appropriation, the 1991 Constitution on the other hand prescribes the procedures which are to be adhered to if expenditures are to be incurred above the approved appropriation. However, over the past years, the Ministry of Finance and Economic Development have not been strictly adhering to
the provisions in these legislations as far as extra-budgetary expenditures are concerned58
.
Score D : Ministry of Finance and Economic Development have not been strictly adhering
to the provisions in these legislations as far as extra-budgetary expenditures are concerned.
There was a supplementary budget submitted in July 2013 which was an improvement over
previous years. However, information not received in respect of the period July to December
2013.
Score 2014 and PEFA Scoring Criteria met
(Scoring Method M1).
Score 2010
56 PEFA Framework and Fieldguide
57 Source: ‘’Budget Bureau Guidelines to Restore Fiscal Discipline 2013’’
58 Source: ‘’Budget Bureau Guidelines to Restore Fiscal Discipline 2013’’

77
PI-27. Legislative
scrutiny of the
annual budget
law.
Overall Score: D+
• Dimension (i) Score: C. The legislature’s
review covers details of expenditure and
revenue, but only at a stage where detailed
proposals have been finalized.
• Dimension (ii) Score: C. Some
procedures exist for the legislature’s budget review,
but they are not comprehensive and only
partially respected.
• Dimension (iii) Score ; D The time
allowed f or the legislature’s review is clearly
insufficient for a meaningful debate
(significantly less than one month)
• Dimension (iv) Score: D Rules regarding
in-year budget amendments may exist but
are either very rudimentary and unclear
OR they are usually not respected.
Overall Score: C+
Dimension (i) Score: C
Dimension (ii) Score: C
Dimension (iii) Score:
A
Dimension (iv) Score: C
The improved score has resulted from the timeliness of the scrutiny by PAC. This has been
consistent and sustained during the period between the PEFA assessments.
PI-28: Legislative scrutiny of external audit report
The Public Accounts Committee is charged with the responsibility for examining accounts of
bodies voted for by Parliament. In this way the legislature discharges its key role in
exercising scrutiny over the execution of the budget that it approved. This responsibility is
discharged by holding public sessions to take evidence on examination of reports produced
by the Auditor General each year. In Sierra Leone the Chair of the PAC is a member of the
ruling party and the Deputy Chair is from the major opposition party.
(i) Timeliness of examination of audit reports by the legislature
The timeliness in the hearings and review process by the Public Accounts Committee of the
Auditor General’s reports has been sustained since the improved situation reported in the
2010 PEFA.
PEFA clarifications now make it clear that the scrutiny by PAC should be tabled and ideally
debated in the full chamber of the legislature in order to constitute completed scrutiny of
budget execution. This process is usually necessary before the executive can formally
respond, though corrective action can be taken at any time.

78
Financial
Accounts
Year Ended59
ASSL Report on
the Accounts
Submitted to
Legislature (and
tabled before
Parliament)
Date of PAC Hearings
on the Auditor
General’s Report
Final PAC Report
tabled in the full
Chamber
31st
December 2012
16th
December 2013
(18th
December
2013)
On-going - commenced
12/2/14
Not applicable - hearings
are on-going
31st
December 2011
20th
December 2012
(15th
January 2013)
9th
April 2013 – September 2013
18th
December 2013
31st
December 2010
14th
December 2011
28th
February 2012)
March 2012 – September 2012
16th
November 2012
Score: C. Scrutiny of audit reports is usually completed by the legislature within 12 months
from receipt of the reports
(ii) Extent of hearings on key findings undertaken by the legislature
The definition of an in-depth hearing is one in which the accounting officer is formally
required by PAC to explain and justify the findings of the external audit on his performance.
Technical capacity is provided to PAC by ASSL officers. Hearings are held on the Auditor
General’s report on the Governments accounts and also performance audit reports. Hearings
for this dimension can only be considered in-depth if they include both representatives from
SAI to explain the observations and the audited entity. This is the practice in Sierra Leone.
The PAC hearings cover in depth the detailed findings of the Auditor General’s reports and
the PAC itself issues a detailed report on its own observations. ASSL auditors are available to
support the PAC prior to and during hearings so that there is ongoing verification of any
evidence presented by the auditees.
In the future, as there is more familiarity with the process, these hearings could be improved
and deepened by more experience in conducting the hearings particularly in respect of the
NSA and general public.
However, it is noted from the IPFMRP progress reports that the ASSL collaborated with the
NSA Secretariat in disseminating the 2011 audit report findings in forums organized in the
four regions that discussed the implications of the Audit findings for the success of the
overall PFM reform efforts. These included radio programmes aired which discussed the
report findings. The NSAs and District Budget Oversight Committees also participated in the
public hearings organized by PAC on the 2011 report of the Auditor General.
59 Period of time under review for this dimension is the Audit Reports submitted to the Legislature within the past three years

79
Score A: PAC holds timely hearings on the findings of the Auditor General’s report on the
Annual Financial Statements and in respect of Performance Audit Reports. These are open to
the public and include hearings held outside of Freetown.
(iii) Issuance of recommended actions by the legislature and implementation by the
executive
The implementation and follow up of the recommended actions of the PAC remains one of
the most challenging aspects in overall scrutiny and oversight. A significant number of
recommendations are made in the PAC’s report but there is less evidence of these being acted
upon. For example, it is reported that a long list of recoveries to be made is drafted after the
PAC clarifications but the extent to which these are implemented is not clear. The sustained
timeliness in the scrutiny process should facilitate improvements in enforcing PAC
recommendations and applying appropriate sanctions where irregularities have taken place. It
is understood that the last completed PAC Report was recently forwarded to the Attorney
General by the Deputy Speaker. The PEFA team was also advised that the report was
submitted to the President.
Currently, there is no systematic approach or database in place to monitor recommendations.
In the past the significant delays in consideration of the Auditor General’s reports would have
made enforcing any sanctions more problematical, as enforcement would have been many
years after the event. However, now that the scrutiny process is becoming timelier, attention
should be focused on improvements in enforcing PAC recommendations and applying
appropriate sanctions where irregularities have taken place.
Score C: Whilst actions are recommended there is no evidence of implementation of the
recommended actions based on PAC recommendations.
Score 2014 and PEFA Scoring Criteria met (Scoring
Method M1).
Score 2010
PI-28. Legislative
scrutiny of
external
audit report
Overall Score: C+
• Dimension (i) Score C: Scrutiny of audit reports
is usually completed by the legislature within 12
months from receipt of the reports
• Dimension (ii) Score A: In depth hearings on
key findings take place with responsible officers
from all or most audited entities which receive a
qualified or adverse audit opinion.
• Dimension (iii) Score C : Actions are
recommended but rarely acted upon by the Executive
Overall Score: D+↑
Dimension (i) Score
D↑
Dimension (ii) Score
A
Dimension (iii) Score
C
The improved score has resulted from the timeliness of the scrutiny by PAC. This has been
consistent and sustained during the period between the PEFA assessments.

80
3.7 Donor Related Practices
In terms of the overall donor context, various co-mechanisms exist within Sierra Leone to
foster the partnership and dialogue between GoSL and development partners and for the
better co-ordination of aid. At the strategic level there is the Development Partnership
Committee (DEPAC) and the Multi Donor Budget Support Group (MDBS). Below DEPAC
are sector working groups.
It is understood that a structure for Inter-Ministerial coordination and collaboration on the
implementation of the Agenda for Prosperity have recently been discussed and agreed upon.
And that it was agreed that a framework for monitoring adherence to the Mutual
Accountability Framework is to be developed by DACO for consideration by the DEPAC
Committee. An Annual Development Assistance Report is produced by DACO.
Development assistance / co-operation resource flows are at two levels: those through
MoFED- DACO/MPD; and those into the Ministry of Foreign Affairs60
(diplomatic levels)
which are not reflected in the DACO/MPD database. Overall, the international support takes
a number of forms.
This series of indicators looks specifically at
▪ Direct (general and specific sector) budget support – the aid provided direct to the
government’s Treasury. Multi-donor budget support group (MDBS)
▪ Donor support for projects and programs – aid transferred in cash (extra- budgetary
funding and / or through separate bank accounts) and aid provided in kind (for which
the government is dependent on donors for estimates and implementation)
▪ National systems (of banking, authorisation, procurement, accounting, audit,
disbursement & reporting arrangements) used to manage donor funds
D1: Predictability of Budget Support
Direct budget support is a significant source of revenue for GoSL and the three year period
under review for this assessment is 2010-2012. In line with GoSL’s aid policy the main
objective for the provision of budget support is to:
▪ Create additional fiscal space to fund implementation of the PRSP
▪ Minimise transaction costs for Government in managing aid
▪ Supporting reforms, especially in the public sector and in public financial
management reform
(i) Annual deviation of actual budget support from the forecast provided by the donor
agencies at least six weeks prior to the government submitting its budget proposals to
the legislature (or equivalent approving body).
Budget support has been provided to the Government of Sierra Leone over the last eleven
years by four donors: the African Development Bank, European Union, World Bank and
DFID. These donors entered into a MoU with GoSL in December 2009 establishing a
framework for multi donor budget support. This includes increased harmonisation between
the donors by the use of a jointly agreed PAF framework of key PFM indicators which are to
be assessed on an annual basis. However, in practice the results of these assessments for
60 Chinese EXIM 2013, $1.480 million; 2012, $2.220 million
81
DFID and EU are, since 2013, directly and proportionately linked to the performance tranche
of DBS - whereas this is not the case in respect of the World Bank and African Development
Bank. Therefore, the underlying approach to budget support disbursement and the
predictability for GoSL does vary between the major MDBS partners.
During the period under review (2010-2012) issues of predictability existed. It can, however,
be noted that there has been some improvement in predictability for GoSL since the
performance tranches were introduced by some of the MDBS partners but this does not yet
impact on the score for PEFA 2014.
Predictability of direct budget support forecasts and actual disbursements is essential for
GoSL strategic planning and control purposes. The release of direct budget support is linked
to the PAF assessment process and subject to progress and other assurances being received
from GoSL. Any delays in disbursement can also be as a result of donors not receiving
agreed information in a timely manner from GoSL. Overall, predictability of disbursements is
in part based on the actions of the donors; however, it is also subject to the responsiveness of
the Government in those matters which impact on the release of funds (timing and amounts).
This revised approach means that GoSL is informed in advance by each donor of what
triggers must be met for disbursement.
Score : D : In at least two out of the last three years DBS outturn fell short of the forecast by
more than 15%
(ii) In-year timeliness of donor disbursements (compliance with aggregate quarterly
estimates)
Some of the major donors provide budget support to Sierra Leone on the basis of one annual
payment which comprises a fixed and performance tranche – subject to agreed conditions
having been met. Therefore, not all of the donors providing budget support operate on a
quarterly disbursement basis.
Score D: Not all of the donors providing budget support operate on quarterly disbursements .
For example the EU and World Bank disburse a single one-off tranche on an annual basis. In
addition, the performance tranche from bi-laterals is not always consistently captured in the
budget because it is not guaranteed to be paid.

82
Score 2014 and PEFA Scoring Criteria met
(Scoring methodology: M1)
Score 2010
D-1 Predictability of
Direct Budget
Support
Overall Score: D
• Dimension (i) Score D: In at least two out of the last three years did direct budget support
outturn fall short61
of the forecast by more than 15% or no comprehensive and timely forecast for the year(s)was provided by the
donor agencies.
• Dimension (ii) Score D: The requirements
for a Score ‘’C’’ or higher are not met.
Overall Score: D
Dimension (i) Score D
Dimension (ii) Score D
There has been no change between PEFA assessments.
D2: Financial information provided by donors for budgeting and reporting on project
and program aid
The DACO Unit sits within MoFED and it comprises an Aid Co-ordination section and a
Monitoring and Evaluation Section which are responsible for the monitoring of project
implementation against development objectives. MPD also plays a significant role in the
provision of information on donor funded projects into the budget.
Since 2008 the DAD database has been used by some donors to directly upload information
on their aid commitments and disbursements. Some issues affecting comprehensiveness of
the total aid flow captured by DACO, which have been raised in previous PEFA’s still
remain.
For the majority of MPD donors, MPD supply DACO with the necessary information on an
annual basis.
The Government is dependent on the donors for budget estimates and reporting on
implementation for aid in-kind. Donor reports on cash disbursements are also important for
reconciliation between donor disbursement records and government project accounts.
(i). Completeness and timeliness of budget estimates by donors for project support
There appears to be little information available in respect of budget estimates provided by
donors. Some donors are in a position to provide medium term forecasts depending on their
own planning timescales, although often even these cannot be confirmed more than one year
in advance. Non-DAC donors tend towards providing assets and building projects that are not
monetised. Differences in donor partner and GoSL fiscal year ends can also be an issue.
Score D: Donors do not appear to submit complete budget estimates for disbursement of
project aid.
61 Fiscal tables in the audited accounts also show significant percentages more than the budget figures reported

83
(ii) Frequency and coverage of reporting by donors on actual donor flows for project
support.
The 2013 reconciliation exercise of the DAD database was underway at the time of the 2014
PEFA assessment. Clearly a significant amount of data was outstanding in order for the
database to be a complete record. Out of an estimated 304 projects recorded only information
on 175 had been received (57.3% based on number of projects). It seems that it is possible for
there to be duplicate reporting from donors in the case where there are joint projects.
The discipline of providing information from the donors and the timely request and follow up
of required information by DACO does not appear to be strong or consistent, and the
response rates by donors appear to be on an ad hoc basis or in response to DACO requests for
updates. The information provided does not uniformly provide a breakdown consistent with
the government budget classification. Equally from the DACO side data requests can be
sporadic with reporting deadlines either at very short notice or even with retrospective dates.
The MPD database reconciliation promotes discipline with discrepancies resulting in requests
for further information from donors. The PEFA Team was advised that the DAD database is
reconciled by the end of Q1 following the end of the financial year. Requests for information
from the larger donors are made on a quarterly basis.
Score D: The discipline of providing information from the donors and the timely request and
follow up of required information by DACO does not appear to be strong or consistent. Some
of the large donors take 1-2 months ‘’if requested’’ but others can take more than two
months.
Score 2014 and PEFA Scoring Criteria met
(Scoring methodology: M1)
Score 2010
D-2 Financial
information
provided by
donors for
budgeting and
reporting on
project and
program aid
Overall Score: D
• Dimension (i) Score D: Not all major donors
provide budget estimates for disbursement of
project aid at least for the Government’s
coming fiscal year and at least three months
prior to its start
• Dimension (ii) Score D: Donors do not
provide quarterly reports within two months
of end-of-quarter on all the disbursements
made for at least 50% of the externally
financed project estimates in the budget. The
information does not uniformly provide a
breakdown consistent with the government
budget classification
Overall Score: D+
Dimension (i) Score
D
Dimension (ii) Score
C
The overall slight reduction in score arises from the evidence base available in 2014 which
indicates that the submission of the required information by donors is incomplete and not
within required timescales.

84
D3: Proportion of aid that is managed by use of national procedures
(i) Overall proportion of aid funds to central government that are managed through
national procedures.
In terms of the proportion of aid that is managed by national procedures (banking,
authorisation, procurement, accounting, audit, disbursement and reporting arrangements) the
budget support figures are the best indicator since few other aid flows use national systems in
their entirety.
In Sierra Leone the last Paris Survey was in 201062
. The last reported figures for development
partner alignment to procurement systems showed a decrease from 38% (in 2007) to 21% (in
2010) and for the use of PFM systems an increase from 20% to 37% was reported. The
‘’Recording Aid on Budget’’ Actual was 52% in 2010 compared to 54% (2008).
It should be noted, however, that PARIS Survey indicators are different from PEFA
indicators so any comparisons are indicative only, rather than a strong proxy.
Score 2014 and PEFA Scoring Criteria met
(Scoring methodology: M1)
Score 2010
D-3 Proportion of
aid that is managed
by use of national
procedures
Score: D Less than 50% of aid funds to
central government are managed through
national procedures
Score: D
There has been no change since 2010.
62 This is currently being updated and the draft revised figures may be available in March 2014 (2014 Report International Engagement in
Fragile States)
Score D: The requirement of > 50% of aid funds to central government being managed
through national procedures is not met.

85
Country Specific Issues
Sub-National Government. Although the Local Councils have been promoted since 2004,
they still do not have significant autonomy. The transfer from Central government is largely
tied to devolved services. Line ministries still exert significant control over the devolved
spending of local councils through their insistence on allocating funds to achieve strategic
goals. This results in very little income for expenditure on local priorities. Furthermore,
although borrowing is theoretically possible with the assent of the Minister of Finance, it has
not happened in practice. A sub-national PEFA exercise was carried out in 2010 covering 5
local councils. It is planned that a self-assessment PEFA will take place in 2014 with the
assistance of the PFMRU.
Section 4: Government Reform Process
4.1. Recent and On-Going Reforms
The Government’s Agenda for Prosperity aims to build on the platform of the PRSP I and
PRSP II – Agenda for Poverty & Agenda for Change. Together with the PFM Strategic Plan
2014 – 2017 and Vision 2025, they provide the overarching policy framework for Sierra
Leone. They present the core strategic issues that provide the objectives for all plans, policies
and programmes and aims to contribute to the development of Sierra Leone, with the aim of
achieving middle income status as a country.
The Agenda for Prosperity (AfP) aims to achieve middle income country status. The AfP has
been developed around eight (8) Pillars:
Pillar 1 – Diversified Economic Growth
This pillar gives priority to promoting diversification towards the economic sectors with long
term potential for inclusive, sustainable growth, to increasing value-added in production, and
to remove constraints to women’s participation in the economy.
Pillar 2 – Managing Natural Resources
This pillar gives priority to the preservation of the environment and natural resources.
Priorities for resource management activities include mineral resources, fisheries and marine
resources, water resources, land management, forestry management, and oil and gas
development.
Pillar 3 – Accelerating Human Development
This Pillar seeks to develop human capital, to empower people in order to reduce poverty,
and to accelerate the achievement of the Millennium Development Goals following
significant strides during 2008-12. Strategies will accelerate human development, through
improving education quality and access, providing extensive health services, controlling
HIV/AIDS, providing safe water and improved sanitation, population policy including
reducing migration to the cities and slowing fertility, and mainstreaming gender parity.
Pillar 4 – International Competitiveness
This Pillar is giving priority to removing the wide range of identified constraints, and to
building the necessary supportive environment and infrastructure. It will emphasize a gender
responsive approach in all activities to develop competitiveness.
Pillar 5 – Labour and Employment

86
The AfP strategy is to encourage all economic actors to provide productive and adequately
remunerative employment opportunities, for all who are willing to work, including vulnerable
groups, while improving working conditions. Activities will include promoting investment in
small- and large-scale business and agriculture to create employment, at all levels of the
private and public sector economy; skills development; designing public works programmes
to employ youth; and ensuring an employment-friendly institutional framework.
Pillar 6 – Social Protection
The AfP stresses implementation of the 2011 National Social Protection Policy, to
complement the effects of economic growth in building resilience. Strategies will develop
social protection policies, institutions and programmes, building capacity of relevant agencies
and their staff; extending social insurance interventions; providing basic social protection
packages for the vulnerable; strengthening support for nutrition, health care, education and
housing.
Pillar 7 – Governance and Public Sector Reform
Good Governance, including access to justice, peace and security, and effective capacity in
the public sector, are all pre-requisites for the AfPVision. Capacity-building and other
activities, in a wide range of vital and diverse sectors and areas of institutional development,
all contribute to this crucial Pillar.
Pillar 8 – Gender and Women’s Empowerment
The AfP goal is to empower women and girls through (a) education, reducing socio-
economic barriers and supporting formal and non-formal education; (b) increasing their
participation in decision-making in public, private, and traditional institutions, and access to
justice and economic opportunities; (c) strengthening prevention and response mechanisms to
violence against women and girls; and (d) improving the business environment for women,
with access to finance and capacity development. Government will enact Gender Equality
legislation, set up a National Women’s Commission, and focus on coordinated gender
awareness and action across and among MDAs and civil society.
The PFM Reform Process is now of critical importance in Sierra Leone as revenues from
Extractive Industries are expected to increase significantly over the coming years. Securing
inclusive growth will depend largely on the transparent transfer of increased GoSL revenues
to the Treasury and then the efficiency with which these increased revenues are spent.
The PFM Reform Strategy 2014 – 2017 was formulated to address the weaknesses identified
by the 2010 PEFA, as well as observations and conclusions reached by internal and external
review missions and the Audit Service of Sierra Leone. These are being pursued under five
themes:
• Budget Planning, Comprehensiveness, and Credibility
• Financial Control and Accountability, Service Delivery and Oversight
• Revenue Mobilisation
• Strengthening Local Governance Financial Management through Local
Councils for Effective Decentralisation
• Program Governance and Project Management
Budget Planning, Comprehensiveness, and Credibility

87
Under this theme, the primary aims are to establish a credible and stable budget process,
particularly to establish a transformational public investment program (PIP) and link
investment to recurrent operations and maintenance spending through the MTEF process.
Financial Control and Accountability, Service Delivery and Oversight
For the next phase of the 2014-2017 strategy, the most critical objective for financial control
and accountability is to complete the roll out of IFMIS to major spending MDAs and bring all
central government public accounts including sub-vented accounts and donor project
accounts onto IFMIS. For this aspect the strategy recognizes that substantial investment in IT
infrastructure for IFMIS will be required. It is also acknowledged that expansion of IFMIS
underpinned by a more robust infrastructure will be a crucial step towards establishing a
Single Treasury Account and the basis for a more comprehensive budget covering the whole
of central government, and eventually general government.
Alongside this is the recently proposed ‘’Sierra Leone Medium Term Counterpart PFM
Reform Strategy 2014-2015’’ which has been designed in a bid to complement other reform
areas not exhaustively covered by the wider PFM Reform Strategy. The reform areas
proposed include a strong focus on accounting and control reforms at a technical level:
• Fixed asset management
• Expenditure control and management
• Rationalisation of end of service benefit for government employees
• Maintaining an adequate records management system
• Local councils financial administration and management
• Contract management
• Salary reform
Integrated Financial Management Information System (IFMIS). In 2014 roll-outs are
planned for Human Resource Management Office, the Cabinet Secretariat, Ministry of
Energy, Ministry of Lands, Country Planning and the Environment. The Information
Communication and Technology (ICT) Division within MoFED continues to support the
provision of an enabling ICT environment to facilitate the smooth operation of MoFED
activities and also provides support to the IFMIS within MDAs and financial management
information systems within local councils. Looking ahead future plans include a fibre optic
solution.
Revenue Mobilization
Two objectives will be stressed under this theme: (1) Consistent with likely developments in
resource-related industries, major efforts are being made to establish more effective tax and
control regimes for extractive industries through the Extractive Industries Revenue Act and
the Oil Exploration Act. (2) Challenges identified in revenue collection, reporting and
reconciliation will be addressed by improved systems and interfaces, which aims at
improving the system for recording and reconciling payment and receipts. A new MOU with
the banks has already been established.
Strengthening Local Governance Financial Management through Local Councils for
Effective Decentralization
The next phase will emphasise a transfer of authority to the Councils, combined with
effective use of systems to meet both community and national goals of service delivery.
These aims will be reflected in the revised legislative framework. A critical objective will be

88
the consolidation of the implementation of the Petra Accounting Package in all local councils
including the real time processing of transactions by selected councils. PETRA-based reports
by councils could be consolidated at the national level by the LGFD. Improved sectoral
reporting from Councils should in turn allow a redesign of the process of allocating grants
and give greater authority to councils over a smaller number of grants.
Program Governance and Project Management
As part of its commitment to this theme, the Government will establish a strong PFM
Strategy governance structure to ensure that overall government fiscal policy is controlled
within the strategic parameters needed to ensure transformation and sustainable PFM
practices.
To support the Government’s Public Financial Management program, its Development
Partners (DPs) focus to a large extent in strengthening fiscal management institutions,
accountability and oversight through budget support operations. The DPs and Donors have
complimentary support operations in a number of areas in a Public Financial Management
Improvement & Consolidation (PFMIC) project as highlighted in the grid below:
DFID GIZ AfDB EU WB
1
Budget Planning,
Comprehensivenes
s, and Credibility
Support to
Statistics
Sierra Leone
Support to the
PPP Unit
2
Financial Control
and Accountability,
Service Delivery
and Oversight
Support to
Audit Service
Sierra Leone
Strengtheni
ng Legal
framework
3
Revenue
Mobilization
Support to
NRA
Strengtheni
ng Revenue
Systems
Support to
the Mineral
Resource
Revenue
Areas
Tax Policy
Transparenc
y
4
Strengthening
Local Governance
Financial
Management
through Local
Councils for
Effective
Decentralization
Strengtheni
ng Local
Government
Systems &
Controls
Strengtheni
ng Local
Government
PFM
Systems

89
5
Program
Governance and
Project
Management
Support to
IPFMRP
Support to
IPFMRP
Support to
IPFMRP
Support
to
IPFMRP
General
Budget
Support
Multi Year
Support to
MDBS
Multi
Year
Support
to
MDBS
The PFM project costs are $28.5m, which will be split between IDA $12.0m and $13.0m by
the MDTF (administered by the IDA/World Bank) and $3.5m from the AfDB. The MDTF
will benefit from contributions from DFID-$11.19m and EU-$1.81m . The Government of
Sierra Leone and all the partners in this project have agreed to adopt the Investment Project
Finance (IPF) instrument for this project. The key objective is to ensure that the priority
government reforms defined in the 2014 – 2017 PFM Reform Strategy are implemented in a
sequenced manner over the life of the project. This is complimentary to other reforms in the
PFM area by DFID, GIZ, AfDB, EU and WB as shown in the grid above.
PFM Reform Institutions
As noted in the grid above, the core of PFM reform will be carried out by the MoFED, in
particular managed by the PFMRU. . NRA, under the responsibility of MOFED but whose
head is a Presidential nominee, is also a core beneficiary of reform. Institutions outside of
MoFED include Statistics Sierra Leone (macro forecasting) and the Audit Service
(improving the legal framework). PFMRU will be the key institution for managing PFM
reform.
Vision 2025 of Sierra Leone was developed through consensus, and summarises the
development principles which Sierra Leoneans agreed must guide their development efforts
for the foreseeable future. The strategic areas of focus chosen which are the basis for plans
and policies for Sierra Leoneans are to:
• Attain a competitive private sector-led economic development with effective indigenous
participation;
• Create a high quality of life for all Sierra Leoneans;
• Build a well-educated and enlightened society;
• Create a tolerant, stable, secure and well-managed society based on democratic values;
• Ensure sustainable exploitation and effective utilisation of our natural resources while
maintaining a healthy environment; and
• Become a science and technology driven nation.
The PRSP I document, covering the period 2004-2008, presented the policy and strategy to
implement this broad agenda to address the poverty challenges and attain the medium term
objectives of attaining food security and creating employment opportunities. It was
developed around three main pillars, which have been also linked to the achievement of the
MDGs, namely:
Pillar 1: Promoting good governance, security and peace
Pillar 2: Promoting pro-poor sustainable growth for food security and job creation

90
Pillar 3: Promoting human development
The Poverty Reduction and Strategy Paper (PRSP II) or Agenda for Change covered the
period 2008-2012 and identified key priority areas for poverty reduction. The PRSP II was
designed to address a number of key strategic priority areas including power, infrastructure,
agriculture, education and health considered vital for economic growth, poverty eradication
and economic development.

91
Annex 1 Persons Met for PEFA 2014
Edmond Koroma, Financial Secretary, MOFED
Avril Cummings (Mrs), Principal Deputy Financial Secretary MOFED
Denis Vandi, Senior Deputy Financial Secretary, MOFED
Matilda Williams, Senior Deputy Financial Secretary, MOFED
Hon. Komba E. Koedoyoma, Deputy Chairman Public Accounts Committee, Parliament
Hon. Claude D.M. Kamanda, Chairman Transparency Committee, Parliament
Augustine Sessay, Clerk Transparency Committee, Parliament
David P.G. Saffa, Clerk to PAC, Parliament
Kebbe A. Kouroma, Accountant General, AGD
Richard S.Williams, Deputy Accountant General, AGD
Lunyanga N. Kaiwa, Assistant Accountant General, AGD
Raymond Coker, Assistant Accountant General, AGD
Alex Pratt, Head of Administration and Central Salaries Services, AGD
Sheila Max-MaCarthy, Head of Unit, AGD
Festina Macauley, Head of Unit- Bank Reconciliation, AGD
Abu Bakarr Sesay, Head of Unit – Other Charges, AGD
Abu Bakarr Conteh, Head of Unit – Payroll, AGD
Adama Renner, Deputy Auditor General, ASSL
Vidal Paul-Cker, Deputy Auditor General, ASSL
Philip Goba, Assistant Auditor General, ASSL
Madonna Thompson, Energy and telecoms Sector, NPC, Office of the President
Amadu Sidi Bah, National Non State Actors Co-ordinator
Clive Dawson, President, British Chamber of Commerce Sierra Leone
Mark Appleby, Country Director, PWC
Kofie Macauley, CEO, CAMServ SL Ltd.
Sorie Kamara, Director of Financial Resources, Ministry of Health and Sanitation
Simaila N.K.Lansana, Director of Internal Audit, Ministry of Health and Sanitation
Abubakar Kamara, Head of Planning, Ministry of Health and Sanitation
Mani Koroma, Permanent Secretary (and Directors) of Ministry of Education
Matthew Dingie, Director of Budget, Budget Bureau, MoFED
Tasima A.Jah, Deputy Director of Budget, Budget Bureau, MoFED
Keightly Reynolds, ODI Fellow Budget Bureau, MoFED
Sahr L Jusa, Head, Public Debt Management Division, MoFED
Charles Conteh, Senior Economist, Public Debt Management Division, MoFED
Solomon S. Thomas, Assistant Secretary, Public Debt Management Division, MoFED
James Ngawa, Public Debt Management Division, MoFED
Abie Elizabeth Kamara, Deputy Director, DACO, MoFED
Ajai Nicole, DACO, MoFED
Alimami Bangura, Director of EPRU, MoFED
Joseph A. Fatoma, PETS Team Researcher, EPRU, MoFED
Mohamed Bailey, PETS Team Researcher, EPRU, MoFED
Simeon M. Jonjo, Acting Director of ICT, MoFED
Max Bailor, Acting Deputy Director, ICT, MoFED
Idrissa Kanu, Director, Revenue and Tax Division, MoFED
Kandeh Sesay, Acting Director of Internal Audit Department, MoFED
Alpha Umaru Jalloh, Ag. Deputy Director, LGFD, MoFED

92
Sallieu Kamara, Economist, LGFD, MoFED
Peter Sam-Kpakra, Director of Multilateral Projects Division, MoFED
Matt Geddes ODI Fellow, Multilateral Projects Division, MoFED
Jamelia Harris, ODI Fellow, Public Debt Management Division, MoFED
Alpha K. Bangura, Director Public Investment Management Unit, MoFED
Mohamed S. Jalloh, Director, HRMO
Abdulai Sankoh, Chief Technology Officer, HRMO
M. Ngerao, Internal Audit Assistant, HRMO
Dr Philip Kargbo, Officer in Charge, MRP, NRA
Ibrahim Sorie Kamara, Commisioner DTD, NRA
Shahid Conteh, Acting Customs Commissioner
Said Conteh, OIC Operations Custom & Excise Duties, NRA
Mohamed James Foday, Economist, NRA
James Lansana, Large Taxpayers Office, NRA
Mohamed Musa, Head of Capacity Building, NPPA
Patricia Row, Senior Capacity Building Officer, NPPA
Alfred Coker, Head of Monitoring and Evaluation, NPPA
Joseph B. Dawuda, Finance Manager, NPPA
Gustavus William, Head of Engineering, NPPA
Alie Kargbo, Head of Research. NPPA
Moses Ngebeh, Head of Procurement, NPPA
Princess Nicol, Secretary to the IPRP
Abie Elizabeth Kamara, Deputy Director, DACO, MoFED
Ajayi J. Nicol, DACO, MoFED
Eugene Sawyer, DACO, MoFED
John A. Conteh, Chief Administrator, Freetown City Council
Dawuda R. Koroma, Chief Finance Officer, Freetown City Council
Mohamed Madina Bah, Accountant, Freetown City Council
Alfred Nabie Samura, Chief Administrator, Port Loko District Council
Brima Thaimu Koroma, District Education Officer, Port Loko District Council
Abdul Bangura, Finance Officer, Port Loko District Council
Alpha Umaru Jalloh, Deputy Director Intergovernmental Fiscal Affairs, Local Government
Finance Department
Veronica M. Finney, BoSL, Assistant Director, Foreign Exchange Operations, Financial
Markets Department
John-Paul Fanning, Economic Adviser, DFID
Ibrahim Ansu Bangura, Senior Macro Economist, African Development Bank
Yosuf Bob Foday, Economist, World Bank
Linda Williams, Project Officer, Economic, Trade and Regional Co-operation
Amparo Gonzalez-Diez, Head of Economic and Trade Sector
Dr. Francis Y. Kumar, IMF Res. Rep.
Matthew Sandy, Economist, IMF
Augustus Cole, Director, PFM Reform, PFMRU
Princess L. Johnson, Deputy Director PFM Reform, PFMRU
Bai Sesay, PFMRU
Kidijah Mohamed, PFMRU
Claudia Johnson, PFMRU
Alex L Keijah, PFMRU

93
Annex 2 Documents Consulted
General
The Constitution of Sierra Leone 1991
1998 Audit Services Act, 9th
July 1998
2007 Financial Management Regulations, 7th
July 2007
Government Budgeting and Accountability Act, 2005
Draft Public Financial Management Act 2013
Government of Sierra Leone Agenda for Change
Government of Sierra Leone Agenda for Prosperity
Sierra Leone Central Government PEFA December 2007
Sierra Leone Central Government PEFA December 2010
Sierra Leone Sub-National Government PEFA December 2010
MoFED Sierra Leone PFM Strategy 2014-2017 Final Draft 14th
June 2013
MoFED Sierra Leone Medium Term Counterpart PFM Reform Strategy 2014-15
Public Financial Management Reform Update December 2011, December 2012 & Jan-
Sept 2013, Ministry of Finance and Economic Development
Government of Sierra Leone Public Procurement Act, 2004
Port Loko District Council MTEF Budget 2013-15
UN Development Reports
www.mofed.gov.sl/ Ministry of Finance and Economic Development website
www.auditservice-sl.org/ Audit Service Website
www.statistics.sl/
EPRU
PETS and Quantitative Service Delivery Survey (QSDS) Report on Financial Year
2010/11 Selected Expenditures IN Health and Education Conducted in Nov 2011
Economic Bulletin 2011/12/13
Public Debt Management Division
Developing a Medium Term Debt Management Strategy, Oct 2013
Public Debt Management Act
Government of Sierra Leone Public Debt Bulletin Issue#5 May 2013
Report on survey and compilation of contingent liabilities in LCs and SOEs, June 2012
Budget Bureau
Analysis of Extra –Budgetary Expenditure FY2010-2012 Spreadsheet (received from
MoFED Budget Bureau February 2014)
Analysis of Carry-Overs Between Fiscal Years 2010-2013 (received from MoFED
Budget Bureau February 2014)
Restoration of Fiscal Discipline and Expenditure Controls Powerpoint Presentation,
Dated January 2013 (received from MoFED Budget Bureau February 2014)
Guidelines and Strategy to Restore Fiscal Discipline and Strengthen Expenditure Control
Note, Dated January 2013 (received from MoFED Budget Bureau February 2014)
MTEF Guidelines 2011
Budget Documents 2010-13
Budget Call Circular for FY 2014, July 2013
Local Government Finance Division
LC Equitable Grants Distribution Formulae and Annual Allocations 2009/10/11/12
Draft Report – Seminar on LC’s devolved sectors’ Grant Distribution for 2014
Government of Sierra Leone Local Government Act, 2004

94
Payroll
Evaluation of DFID Support to Healthcare Workers Salaries in Sierra Leone by Debra
Stevenson, Charles Kinyeki, Mark Wheeler. Dated 7th
September 2012
Human Resource Management Office (HRMO) Report on the Personnel Record
Verification of the HRMO, 9th
September, 2013
National Commission for Privatization
National Commission for Privatization Act 2002
Reporting
CMI Michelsen Institute: ‘’Follow the Money – Do Public Expenditure Tracking Surveys
Matter?’’by Gier Sundet U4 Issue 2008:8 Anti-Corruption Resource Centre
Examples of in-year reports from MoFED
Procurement
www.publicprocurement.gov.sl/
NPPA Act 2004
NPPA Annual Report 2009-2010
Public Procurement Plan 2006
Various procurement plans of MDAs councils.
Internal Audit
Annual Report of the Internal Audit Department for the Year Ended 31st
December 2012
Annual Report of the Internal Audit Department for the Year Ended 31st
December 2011
Ministry of Agriculture & Food Security Internal Audit Unit Report on Activities
Undertaken for 2013
NPPA Internal Audit Unit Report on Activities Undertaken for 2013
Extract of Internal Audit Reports in the Ministry of Works, Housing and Infrastructure for
the Year Ended 31st
December 2012
Ministry of Fisheries and Marine Resources Internal Audit Unit – Summary of Internal
Audit Reports issued in 2013
Schedule of Statistics on MDA’ Internal Audit Units which have undertaken audit reports
on payroll for the fiscal years 2010-2013
Analysis of internal audit staffing levels (approved establishment versus staff in post)
Accountant General
Report and Annual Statement of Public Accounts for the Financial Year Ended 31st
December 2012
Report and Annual Statement of Public Accounts for the Financial Year Ended 31st
December 2011
Report and Annual Statement of Public Accounts for the Financial Year Ended 31st
December 2010
Concept Paper: ‘’The Roadmap for the adoption of IPSAS in Sierra Leone’’ Accountant
General’s Department 2013
Account General’s Department – TSA Implementation Timetable 2014
Sierra Leone Treasury Single Account : Inception Report, Kojo Oduro, Richard Odoom,
Crown Agents, September 2013
Annual Reports TOGAS 2012 &2013
Treasury And Other Government Accounts Services Unit, Accountant General’s
Department, Annual Reports For 2012 and 2013
ASSL
ASSL Report on the Accounts of Sierra Leone for the Financial Year Ended 31st
December 2012

95
ASSL Report on the Accounts of Sierra Leone for the Financial Year Ended 31st
December 2011
ASSL Report on the Accounts of Sierra Leone for the Financial Year Ended 31st
December 2010
ASSL Performance Audit Reports
ASSL Strategic Plan 2010-2015, approved 14th
May 2010
ASSL Operational Plan 2012-2013 finalised 25th
and 26th
January 2012
ASSL 2010 database of audit recommendations
SAI Performance Measurement Framework Documents – Mapping of Tools for
Assessing the Performance of SAI’s Volumes 1 & 2. September 2012 versions
Example of an ASSL Annual Management Letter : Final Management Letter on the Audit
of the National Fire Service for the Financial Year2011
National Revenue Authority
Post Clearance Audit Status Report 2012 &2013
Audit Plans for SMTO and LTO, 2012-13
Employers Guide to PAYE, GST
Various information sheets, adverts, etc.
www.nra.gov.sl NRA website
Parliament
Consolidated Report of the Public Accounts Committee on the Reports of the Auditor General on the Public Accounts of Local Councils for the Financial Years 2004-2008
(PAC hearings held 24th
March 2011 to 31st
May 2011)
Report of the Public Accounts Committee on the Reports of the Auditor General on the
Accounts of Sierra Leone for the Financial Year 2010
Report of the Public Accounts Committee on the Reports of the Auditor General on the
Accounts of Sierra Leone for the Financial Year 2009
Report of the Public Accounts Committee on the Reports of the Auditor General on the
Accounts of Sierra Leone for the Financial Year 2008
Report of the Public Accounts Committee on the Reports of the Auditor General on the
Public Accounts of Local Councils for the Financial Year 2009
Report of the Public Accounts Committee on the Reports of the Auditor General on the
Public Accounts of Local Councils for the Financial Year 2010
Report of the Parliamentary Committee on Transparency and Accountability on an
Assessment of the Level of Transparency and Accountability of Local Councils in the
Northern Region. Submitted by Hon.Ibrahim R.Bundu. Chairman of the Committee May
2012
Supplementary Government Budget for the Financial Year 2013, Thursday 4th
July 2013
Donor
DFID Annual Review of Poverty Reduction Budget Support in Sierra Leone 2010-2012.
Undertaken 24th
February 2012
Aide Memoire, Mid Term Supervision Mission Sierra Leone Integrated Public Financial
Management Reform Project, June 18th
-27th
June 2012
Aide Memoire, Mid Term Supervision Mission Sierra Leone Integrated Public Financial
Management Reform Project, March 25th
-27th
June 2013
Joint Aide Memoire: GoSL, ADB, DFID-UK ,EU and World Bank : 2013 Review of the
Progress Assessment Framework, Multi Donor Budget Support
Joint Aide Memoire: GoSL, ADB, DFID-UK ,EU and World Bank : 2012 Review of the
Progress Assessment Framework, Multi Donor Budget Support
DACO Publication: GoSL Development Assistance to Sierra Leone 2012
96
OECD : 2011 Report on International Engagement in Fragile States : Republic of Sierra
Leone
EC Sierra Leone Strategy Paper 2008-2013
European Commission’s 2011 Communication on Budget Support, Sierra Leone 19th
January 2012
Council of the European Union- Council Conclusions ‘’The Future Approach to EU
Budget Support to Third Countries’’ 3,166th
Foreign Affairs Council Meeting Brussels 14 May 2012. Document 15561/11 – COM(2011) 638
European Commission Communication from the Commission to the European
Parliament, the Council, the European Economic and Social Committee and the
Committee of the Regions ‘’The Future Approach to the EU Budget Support to Third
Countries’’ Brussels 13.10.2011 COM (20110 638 final
World Bank Country Assistance Strategy Progress Report for Sierra Leone for the Period
FY10-FY13, 12th
July 2012.
IMF Report October 2012 Sierra Leone: Fourth Review Under the Three-Year
Arrangement Under the Extended Credit Facility, and Financing Assurances Review
IMF Staff Report and Article IV, Nov 2013
The Management of UK Budget Support Operations, Independent Commission for Aid
Impact (ICAI) Report 9th
May 2012.
www.dad.synisys.com/dadsierraleone/ Development Assistance Database Sierra Leone