golder associates - british · pdf filel i golder associates consulting geotechnic4l and...
TRANSCRIPT

L
I
Golder Associates CONSULTING GEOTECHNIC4L AND MINING ENGINEERS
In association with:
Sigma Engineering L td
Beak Consultants Ltd
REPORT TO B C HYDRO ON THE
HAT CREEK PROJECT
800 MW SCHEME - MINE DRAINAGE
FIPUL REPORT
Distribution:
10 Copies - B C Hydro and Power Authority Vanccuver, B C
6 Copies - Golder Associates, Vancouver
2 Copies - Sigrncl Engineering L td
2 Copies - Beak 'Consultants
DECEMBER I982 822 I569
.) GOLDERASSOCII\TES~WESTERNCANADA~LTD.~224WESTBTHAVENLIE.VANCOUVER.BRlTlS~COLUMBIA.CANADAV5VlN5~TELEPHONE(M4~879-9266~TELEX04-508800
OFFICES IN CANADA * UNITED STATES * UNITED KINGDOM AUSTRALIA

I I.
2 . e
I
I
il
4.
I
I
HAT C:REEK PROJECT
800 MW SCHEME
MIbE DRAINAGE
FIPJAL REPORT
CONTENTS
MANAGEMENT SUMMARY
INTRODUCTION
I . I Background I .2 Scope of Work I .3 Approach
SITE DESCRIPTION
2.1 Location 2.2 800 MW Scheme 2.3 Comparison with 2240 M\Y Scheme
DRAINAGE DESIGN CRITERIA
3. I General 3.2 Water Quality
3.2. I Water Quality Objectives 3.2.2 Land Areas 3.2.3 Groundwater Sources
3.3 Water Quantity
3.3.1 Quantity Design Criteria 3.3.2 Runoff Discharged Directly to Hat Creek
3.3.4 Runoff Discharged to Leachate System 3.3.3 Runoff Discharged to Sediment System
3.3.5 Groundwater 3.3.6 Sewage 3.3.7 Vehicle Washdowll 3.3.8 Evaporation
COLLECTION SYSTEMS
4.1 Collection of Direct Discharges to Hat Creek 4.2 Sediment Collection System 4.3 Leachate Collection Syst,zm 4.4 Sewage Collection Systerl

HAT CREEK PROJECT 800 MW SCHEME
M I E DRAINAGE
CONENTS (Continued)
5. DISPOSAL SYSTEMS
5. I Direct Discharges to Hat Creek 5.2. Sedimentation Lagoon 5.3 Leachate Lagoon 5.4 Sewage Disposal 5.5 Abandonment
6. IMPLEMENTATION
6. I Stages of Mine Developinent 6.2 Stages of Drainage System Development 6.3 Monitoring
REFERENCES
FIGURES

TABLE
2- I
3- I
3-2
3-3
3-4
3-5
3-6
3-7
3-8
3-9
3-10
LIST OF TABLES
TiTLE
Comporison bet,ween Power Schemes - Year 35
Projections of Water Quality of Mine Drainage
Land areas contributing to water disposal systems:
I. Watersheds discharging directly to Hot Creek (before mine development)
2. Watersheds discharging directly to Hat Creek (during mine development)
3. Watersheds discharging to Sedimeni System
4 . Watersheds discharging to Leachate System
5. Domestic: Sewage.
Design Criteria for Planning of Mine Drainage System
Recent Hydrology in the Hat Creek Basin
Design Flows from Watersheds discharging directly to Hat Creek
Design Flows and Volumes from Watersheds discharging to the Sediment System
Design Flows and Volumes from Wa.tersheds discharging to the Leachate System
Design Flows orld Volumes for Seepage and Groundwater
Design Flows and Volumes for Sewage and Vehicle Washdown
Evaporative Disposal Areas

4- I
5- I
5-2
5-3
5-4
5-5
5-6
5-7
5-8
5-9
5- IO
LIST OF TABLES (Continued..)
TITLE
Sizing of Open Droins
Column Settling Tests in 2- I Graduate Cylinders without Flocculont
Column Settling 'Tests in IS crn x 180 an Cylinders with Aluminum Sulphate
Column Settling Tests in I5 crn x I80 crn Cylinders with Aluminum Sulphate
Estimated Sedimentation Lagoon Inflow - Year 5
Estimated Sedimentation Logoon Inflow - Year IS
Estimated Sedimentation Lagoon Inflow - Year 35
Projected Quality of Lagoon Discharge & Hat Creek - Case I
Projected Quality of Lagoon Discharge & Hat Creek - Case II
Projected Quality of Lagoon Discharge & Hat Creek - Case I l l
Annual Water Balance for Leachate System

LI!;T OF F IGUFES
FIGURE
2- I
3- I
3-2
3-3
3-4
3-5
4- I
4-2
4-3
4-4
4-5
5- I
5-2
5-3
Natural Watersheds within the Project Area
Rainstorm Flood Nomograph
Rain-Snowmelt Nomograph
Streamflow Oat83
Watershed Yielc!
Mine Seepage and Dewatering Flow Chart - 8011 MW Scheme
to Hat Creek. All stages of Development Mine Drainage F'lan, Direct Discharges
Mine Drainage Flan, Sediment and Leachate Systems - Year 5
and Leachate Systems - Year 15 Mine Drainage Plan, Sediment
and Leachate Systems - Year 35 Mine Drainage Plan, Sediment
Mine Drainage Schematic
Sedimentation Lagoons IO year 24-hour Flood Discharge Hydrograph
Sedimentation L'zgaons Mean Monthly Discharge Hydrograph
Leachate System Hydrographs - Year 35

MANAGEMENT SUMMARY
This report examines the drainclge requirements for the proposed 800 M W open pit development at Hat Creek. It identifies potential flows of varying water qualities into the pit and surrolmding areas, considers the means of collecting
these flows and recommends methods of disposing of the water.
This drainage study is complementary to that carried out by CMJV (1979) for t h e 2240 M W pit development; hydrological data has been used from that work except where more recent records have permitted re-assessment.
During development of the 800 MW pit, it would be necessary to deal with four qualities of water inflow:
runoff unchanged in quality by t h e development which could be channelled
to Hat Creek;
runoff and ground water .From the surficial deposits and disturbed land areas, which would exceed limits for suspended solids and which would therefore require detention in sedimentation lagoons before being returned to Hat Creek;
runoff from coal, vehicle washdawn, waste dump and pit coal surfaces; ground water seepage frorn coal and other in-pit bedrock; which would exceed limits for dissolved solids and which would therefore require treatment if t h e flows were returned to t h e creek;
sanitary sewage.
The hydrology of the various ca.tchments within the Hat Creek basin is assessed
and design criteria established for various flaw probability levels depending on the sensitivity of the 800 MU’ Scheme to the particular water courses or engineered structures. Anticipated quantities of surface runoff are calculated. The sources of t h e surface and ground water for the various water qualities are
identified in the report. Figure 4-5 shows schematically the routing of the drainage flows for the 800 M W Scheme.

Hat Creek itself would be diverted through the 800 MW pit by pipeline (Colder-
Associates, 1982b). Runoff towards the pit or waste dumps and the water yield!;
from dewatering wells capable of being returned directly to Hat Creek would be
collected by perimeter drairls and diversions. The water directed to the
sedimentation system would be collected from within the pit, from the margin!;
of the active slide area, from the waste dump runoff and from the mine
services area. Water of leachate quality would arise from runoff and seepage:
from the coal and other rock exposures in the pit, from the coal blending and
coal dump areas, from seepage from the Houth Meadows Dump and from the
vehicle washdown areas. %wage would be generated from the facilities
associated with the mine maintenance area.
Because Hat Creek is diverted in a pipe system, most of the clean water
diversions would be directed to points either upstream or downstream of the!
diversion arrangement.
Sedimentation quality water would be diverted to a lagoon located to the north
of the pit. The sizing of Ihe lagoon is discussed and design criteria are
presented; the seasonal quality variations of the discharges to Hat Creek are
discussed.
The waters high in dissolved solids and treated sewage would be diverted to CI
leachate lagoon between the sedimentation lagoon and the pit r im where they
would be held until they could be disposed of by evaporation at the site; this is,
referred to as the 'Zero Discharge System'. Other methods of disposal would include spray evaporation on the waste dump and dust control. It would be
necessary to construct the lagoon to full capacity by year 5 because of the large surface area of coal exposed in the pit in the early years and the fact that
the peak runoff precedes the peak demand for water by the dust control system.
Ground water seepage from the coal and rock areas in the pit is likely to vary
between wide limits because of local variations in hydraulic conductivity. The
zero discharge system would be able to cope with the mean seepage flows;
temporary storages might be needed for high transient inflows. Monitoring of
the flows should be undertaken in the early years. Sewage would be treated and
the effluent would be channelled to the leachate lagoon.
Sections are included which discuss the sequence of implementation of the
drainage scheme and the abanclonment options.

m I. INTRODUCTION
I 1 .1 BACKGROUND
I
a
II
*
*
I
1
r I .2
.Ir
rl
1 - 1
The Hat Creek Project is proposed as 6 C Hydro's first thermal cool power generation project. This power plant would use the vast undeveloped deposits of low grade thermal coal located in the Hat Creek Valley, near Cache Creek. The project is a combined development of an open pit coal mine and associated power station.
The project was initially proposed as a 2240 MW Scheme (2000 MW net power to the grid) and a number of reports were prepared from 1977 to 1980 covering various phases of the mine development. During early 1982, downgraded power forecasts and high cost estimates led to a smaller version of the project being proposed, namely on 800 MVJ scheme feeding about 720 M W of power to the grid. This scheme wos similar in layout to the larger scheme, but mos,t elements were scaled down, including the open pit itself. This report discusses the drainage aspects of the pi t area. The diversion of Hat Creek itself around the 800 M W pit is covered in (1 separate report (Golder Associates, 1982).
SCOPE OF WORK
The scope of work for t h e mine drainage study has been detailed in a memjs
f rom the 6 C Hydro Mining Department dated June 22, 1982 and a subsequent proposal from Golder Associcltes in August, 1982. The main points covered i l l
this work would be similar t o .those covered in the Mine Drainage Report for the 2240 M W project (CMJV - 1979).
The Terms of Reference were as follows:
- Calculate the flows and size the drainage facilities for the watershed:$ influencing the 800 MW pit which could be discharged directly to Hat Creek without treatment.
m

1 - 2
Calculate flows and pond sizes for runoff with potentially high sedimeni
loads; this water to be stored for a sufficient time to reduce the sedimeni
level to meet the 25 - 75 Ing/l range before release to Hat Creek.
Calculate flaws and pond sizes for areas of the 800 MW pi t which produce
runoff which cannot be discharged to Hat Creek. This water is to be used
for dust control and spray evaporation an the waste dump. Quantities of
water for dust control cilso to be estimated, and water balance charts,
produced.
Wherever possible, drainage design criteria far these three systems to be
adapted from the CMJV Report (1979); where applicable, flows to be
provided for years 5, I5 and 35.
In addition to the stated terms of reference, some comments are to be
made on the sewage disposal aspects of the mine project. A means of
refinement of the desiqn criteria and staged implementation of the
drainage system w i l l be discussed.
I .3 APPROACH
The Mine Drainage Study far the 800 MW Project i s 'intended to provide the
basic parameters for use in the more detailed designs which would follow i f construction of this reduced capacity thermal power project were to proceed,
A study has already been car*ied out for the mine drainage at the 2240 MW
project (CMJV, 1979); this study therefore provides a comparison between the
two schemes. Accordingly, much of the background information i s drawn from
this earlier report, and parameters have not been re-calculated for features of
the drainage systems which art: common to both projects.
The study has been divided into components which suit the expertise of the
various consultants. Golder Associates are providing the study management and
are updating the groundwater flows; Sigma Engineering Ltd i s providing the

input on the surface water hydrology and system design; Beak Consultants Lt'l is providing information on the water quality. All three consultants havle
background experience on t h e Hat Creek Project.
The contributing consultants to this report used t h e information contained i n
t h e CMJV Report as a basis f a r the 800 M W Drainage Study. In some instances, where a parameter such as a drainage area is changed from the 2240 MVIl scheme, the resulting flow is changed accordingly. However, there are some parameters such as runoff coefficients, which in the absence of further research work must be assumed as being correct. Where this information is fel t to be insufficient for final design, a recommended method of refinement will be discussed in Section 6 .
The layout of t h e report differs somewhat from t h e CMJV report in order to assist t h e development of background information. In particular the variou:s runoff and evaporation parameters are explained as well as the development of
t h e hydrographs. Where drainage systems are described, t h e major heading,$ have been defined as Collection and Disposal (Sections 4 and 5) with subheadings for the four qualities of water (direct discharges to Hat Creek, sediment, leachate and sewage). Where possible, reference is mode to (1
parameter developed in the CMJV report without further elaboration. A concluding section (Implementation - Section 6) i s provided to recommend
further work where it is felt that the parameters used in the study could bt: improved prior t o initial construction, and refined os mine developmen-t proceeds.

II
1
2. SITE DESCRIPTION
I 2. I LOCATION
U
I
w
I
m
rl
.-
2 - I
The Hat Creek Valley is located mid-way between Lillooet and Cache Creek.
The current project is involved with the exploitation of the No I Coal deposit,
which is the northernmost o f the two coal deposits in the Upper Hat Creek
Valley. This study i s concerrled with the drainage surrounding the developmerlt
of a pit into No I Deposit. C)evelopment of the No 2 Deposit would be reserved
for future demand or for alternative uses for the cool beyond those envisaged c t t
present.
Hat Creek itself is a relatively small meandering creek flowing through a wide
f lat valley and having a gradient of about 2 percent in the area of the No I
Deposit. Tributary creeks, wch as Medicine, Ambusten, Anderson, Finney and
Harry Creeks flow in the vicinity of Pit I , but all are diverted, either naturolly
or with a drainage structure before their waters reach the pi t area. Details csf
the diversions of Hat Creek and i t s tributaries are discussed in a separate
report (Golder 1982).
Closer to the pit itself, the topography is dominated by gradually sloping valley
sides of about 8 percent on the west and 5 percent on the east. A few small
tributary creeks channel runoffs from these areas. Drainage basins extend from
the mine site at about 900 n elevation to 1250 m on the east and to over
1900 m on the west, as shown on Figure 2-1.
.I 2.2 800 MW SCHEME
The 800 MW scheme uses an open pit mine in the valley bottom centered about
2 km south of Highway 12. The location is the sarne OS Pit I in previous studies,
but the pit i s smaller. The power plant i s still located on the ridge about 5 km
east of the mine and about 500 m higher in elevation.
r

2 - 2
A series of roads links the various pit levels and surrounds the pit perimeter.
An access road switchbacks up the hill to the power plant 'site. Once coal i s
mined from the pit, it i s trucked to a dump station on the north side of the pit,
from where it is conveyed to a coal blending and stockpile area. From the coal
blending area, the coal i s moved on a conveyor to the power plant.
On the west side of the valley the Houth Meadows waste dump is used as a
depository for materials other than coal which are mined from the pit. These
materials are moved via truck from the pit to the waste dump. Two earthfill
dams are used to contain the waste rock.
The project facilities are serviced by the maintenance complex lying between
the north pit rim and Highway 12. This area includes an office, dry room,
vehicle repair shop, fuel storage and vehicle washdown area.
The mine facilities mentioned in the preceding paragraphs are all essential to
the process of thermal power generation. The facilities themselves occupy
about 8 square kilometres of land area, hence the impact of the project on the
landscape i s significant as i s tkle impact on the existing drainage pattern. The
most dramatic impact of the project on runoff patterns is the fact that the
open pit itself, which is about 300 m deep, straddles the channel of Hat Creek.
This has made a major diversion system necessary, as detailed in the Diversion
Study (Golder Associates, 1982).
The other major impact of the project i s on the runoff from the various mine
facilities and adjacent areas. These areas produce runoff waters of varying
qualities which must be collect'sd and treated in different ways. In addition to
the networks of collection drains which serve the mine facilities, major
treatment facilities such as the leachate and sedimentation ponds are required.
The details of these collection and treatment facilities are described in
Sections 4 and 5.

2 - 3
I 2.3 COMPARISON WITH 2240 MW SCHEME
L There are few conceptual differences between the 800 and 2240 M W scheme:;. The problems of coal excava,tion, coal transportation, waste rock disposal and runoff and seepage control still exist, but the magnitude of the problems is reduced far the 800 MW scheme, because many of the facilities a r e physically
rr
1, smaller, as described i n Table 2 - I .
1
There are some significant differences in the schemes, resulting from the reduced pit size for the 800 MW scheme. These include:
- elimination of the Mediche Creek Waste Disposal Area
- reduction in area and depth of the Houth Meadows Waste Dump
1. - elimination of the low grade coal stockpile
- steeper pit slopes due to .the higher proportion of stronger materials in the slopes and the lesser depths.
- for the CMJV Report ( l 9 i 9 ) , a canal was the preferred diversion choice for Hat Creek. For both schemes this is now replaced by a pipeline system during mine operation. For the 800 MW Scheme the pipeline system will
also be used after mine abandonment.

2 - 4
TABLE 2 - I
COMPARISON BETWEEN POWER SCHEMES - YEAR 35
Facility 800 MW 2240 M d I )
Open Pit
Houth Meadows Waste Dump
Medicine Creek Waste Dump
Mine Maintenance Complex
Coal Blending
Coal Dump Station
Drive and Transfer House Mine Conveyor
Coal Conveyors
Waste Conveyors
Gravel Roads
Sedimentation Lagoons
North Valley Leachate Lagoon
Medicine Creek Leachate Lagoon
Low Grade Coal
Pipeline Diversion System
Area ( 2 )
Depth
Area
Area
Area
Area
Area
Area
Length(3)
Length (4) Length
Area
Volume
Area
Normal Volume
Emergency Volume
Area Volume
Area
Length
360 ha
300 m
263 ha
N/A 20 ha
15 ha
IO ha
N/A 4.5 km
N/A
I6 km
6.8 ha
225,000 m3
9 ha
360,000
900,000 N/A
N/A
N/A 4.5 km
750 ha
400 m
580 ha
410 ha
20 ha
22 ha
NIA
IO ha
5.5 km
6 km(5)
28 km
7.0 ha
250,000 m 3 9 ha
700,000 m3
I IOO,OOO m3 0.7 ha
I 2,000 m3
33 ha
6.0 km
Footnotes:
Note: Areas shown are plan areas (I) 2240 MW Scheme values obtained from CMJV Drainage Report, I979 (2) Pit area within perimeter diversion drains
(3) Lengths are approximate and scaled from drawings (C,MJV I979 and B C Hydro 1982)
(4) Does not include conveyors within dump boundories
(5) Includes Medicine Creek Waste Cc'nveyor

c 3 - I
I
3. DRAINAGE DESIGN CRITERIA - c
3. I GENERAL
.I 3. I. I Constraints
The drainage design criteria of the Hat Creek Project must be established
before any conceptual layouts or physical sizes can be determined. For the
800 MW Scheme, the overriding criterion is that there should be no discharge to
receiving waters (ie:. Hat Creek itself) of water not meeting the quality
standards of the Waste Mano,Jement Branch, British Columbia Ministry of the
Environment.
There are four separate water disposal systems outlined in this study, to handle,
the four categories of water quality which can be expected from the mine
development. These systems ore defined below:
(c 3. I .2 Runoff Discharqed Directly to Hat Creek
I Land areas surrounding the mille development which are not altered in any way
1) development conditions. This water would be channelled to Hot Creek or the
will produce runoff which is unchanged in quantity and quality from before
diversion system and discharge'd directly without treatment.
e 3. I .3 Sediment System
Land areos disturbed from their natural condition and surficial groundwaters
would produce runoff high in suspended solids but which would be otherwise
acceptable. These waters would be detained in sedimentation logoons north of
the pi t to settle the suspended solids prior to release of the water into Hat
Creek. These flows would include:
I - runoff from pit slopes excavated in surficiol deposits;
r

0
3 - 2
- runoff from disturbed ,slide areas;
- runoff from service artzas;
- seepage flow from pit surficials.
(I
3.1.4 Leachate System
Y Flows from land areas and groundwaters which would be high in dissolved solids
wil l not be released to Hot Creek. As in the 2240 MW Scheme, it i s planned Y that these waters would be intercepted for use and disposal within the mine
ff collect the following surface and groundwater flows:
area. They thus constitute a "Zero Discharge System". This system would
c - runoff from coal and other rocks present in the pi t slopes below the
a
surficial deposits;
- leachate from the Houlh Meadows waste dump;
- runoff from the coal dump station, waste dump surfaces and coal
blending areas;
- vehicle woshdown water;
- groundwater from the pi t coal and other bedrock. m
The water collected fram the above areas would be stored in a sealed leachate
ri pond for use during the summer season in dust control. Roads and coal blending
I sprayed and evaporated on the waste dump surface if required.
areas would require most of the dust control water, but excess water could be
L 3. I .5 Sewaqe System
Sanitary sewage will originate from the showers and washrooms of the Mine
Maintenance area in the North Valley Services area. It will be collected in
conventional gravity drains, treated in a lagoon and input to the leachate
system for disposal via evaporation.

I
3 - 3 *
The criteria for assessing the (quality of runoff water, and hence defining the
r land areas from which it originates, are discussed in Section 3.2. The criteria for determining t h e quantity of runoff, which is a function of climate and topography, are discussed in Section 3.3. Details of the water collection systems are given in Section 4 and details of the disposal systems are given in Section 5.
I
1
3.2 WATER QUALITY 1
3.2. I Water Quality Obiectives
I
Water quality at the mine site is of primary importance to t h e overall
c development of t h e Hat Creek Project. Despite the impact of the open pi t and related facilities on the immediate area, there must be minimal impact on t h e quality of t h e water downstrecm in Hat Creek. The governing criteria for quality of discharges are slated in the British Columbia Ministry of Environment, Waste Management Branch, Eff luent Discharge Guidelines for the Mining Industry. ( B C Minisiry of the Environment, 1979). The discharge objectives are shown in Table I\! of the guidelines and objectives for receiving
I
*
r water quality are shown in Table VI.
1 Projections of water quality from various areas of the mine development were
I have been updated by Beak, together with the latest guidelines from the Waste
made during earlier sampling programs (Beak, 1978, 1979). These projections
Management Branch and are shown in Table 3-1.
L
Sanitary sewage would originate from the Mine Maintenance area. The quality of these flows would be of the normal municipal type, and guidelines for discharge of these flows are contained in Waste Management Branch publications (Guidelines for Municipal Type Discharges, 1975). These flows are
- I to be collected and treated separately from the mine drainage flows, as
m to disposal by evaporation.
outlined in Sections 4.4 and 5.4, ond then pass through the leachate system prior

Parameter (mg/l)
pH (units) Filterable Residue Non Filterable Residue BOD5
TOC Total hardness (as CaCOj) Alkanity i as CaCG3) Chloride Fluoride Nitrate (as N)
Kjeldahl Nitrogen (as N)
Total Nitrogen (as N)
Ortho Phosphate (as P)
Sulfate Arsenic (Total Dissolved) Boron
Cadmium Calcium (as CaCO3) Chromium Copper Iron Lead Magnesium (as CaCO3) Mercury Soliiurrr Vanadium Zinc
TABLE 3 - 1
PROJECTIONS OF WATER QUALITY OF MINE ORAWAGE
3 - 4
Natural Surface Water
Hat@) Creek -
8.4 336
8 i l
8
219
212 1.2
0.14 < 0.06
0.19 e 0.25
0.038 50
< 0.005 < 0.10
0.005 145
< 0.010
< 0.005 < 0.018 < 0.010
74 0.00038
20
0.005
< 0.008
Medicine Creek Area
8.3 275
0-110 "
19 215 221
0.4 0.12 0.04 0.26 0.30 0.01 20
< 0.005 < 0.1
< 0.005
130 c 0.01
<c 0.005 c 0.02
c 0.01 85
c0.0005 ii
< 0.005 0.009
Finney Lake
8.2 179 "
"
18 93 123 0.5
0.22 < 0.02
0.83 < 0.85
0.025 5
< 0.005
< 0.1
< 0.005
60 < 0.01 < 0.005 < 0.04 < 0.01
33 <0.00033
i5 < 0.005
0.006
Mine Drainaqe(3) Discharge Guidelines Ranqe Mine
Waste(2) Leachate
7.9 1340 "
"
51 217 117 26
0.06
-
4.3 0.29 210 0.07
< 0.07
< 0.002 99
0.12 1.43(4) 1.19(4)
0.02 11 5
0.0014 b i
0.01
0.15
Coal Leachate
5. o(4)
8400(4) "
"
"
4140 27 14
0.10 "
"
"
0.01
3700 0.005 0.31 -
1900 0.01 0.03 0.26 "
2240 0.0003
190 0.04 0.11
SOURCE: Beak 1978,1979 NOTE: (1) Mean of measurements taken Sept 1976-1977 during a low flow year. (2) Surface Runoff has been projected to be of this quality (Beak 1981) (3) Updated for 800 MW Scheme. (4) Indicates parameter exceeds upper limit of WMB Guidelines range.
Water Mine
(Bedrock)
7.8 1950 "
"
50
304 1185 42 0.2
< 0.06
14.0 < 14.06 < 0.03
321 0.006 0.71
0.005
180 < 0.01 < 0.008
< 0.075 < 0.013
124 <0.0003
412 c 0.007
0.52
Mine
(Surficials) Water
7.9 350 "
"
21 214 270
3 0.2
< 0.2 < 0.2 < 0.4
< 0.03
52 < 0.005 < 0.1
< 0.005
148 < 0.01 < 0.005
< 0.025 < 0.010
66 <0.0003
39 < 0.005 < 0.03
WMB Objectives
(1979)
6.5 - 10.0 2500 - 5000
25 - 75 - - - - -
2.5 - 10.0
10.0 - 25.0 - -
2.0 - 10 -
0.1 - 1.0 -
.Ol-O.l -
0.05 - 0.3 0.05 - 0.3 0.3 - 1.0
0.05 - 0.2 -
0 - 0.005 - -
0.2 - 1.0

3 - 5
I 3.2.2 Land Areas
w
w
I
1)
I
II
1
IC
3.2.3
0
II
U
L
The quality of t h e water from various sectors of the mine site defines the treatment method which would be used for runoff from each area. The four categories of water quality h w e been identified in Section 3.1, namely: runoff
suitable for direct discharge to Hat Creek, runoff high in suspended solids, runoff high in dissolved solids and domestic sewage. The description and size O F
the land areas contributing to each water quality category are shown i n Table 3-2.
Reference to Table 3-2 indicc~tes that most areas contributing runoff near the mine do not change over the life of the mine. However, the areas which a r e changeable are located within the pit perimeter. These areas increase as t h e mine expands, and a progressi-tely higher proportion of the flow originates from rock and coal exposed within the pit slopes, resulting in an increasing proportion of flow to the leachate system. This implies that some portions of t h e drainage scheme must be built to permit expansion as the pit develops.
Groundwater Sources
The quality of the groundwclter from various sectors of the mine has been projected in the Impact Assessment of t h e Revised Project (Beak 1979). The water from the lower pit dewatering and Houth Meodows Waste Dump seepage would contain high levels of dissolved solids and would be directed to the
leachate system. Seepage from pit surficials would have varying levels of suspended sediment, as projected from previous sampling programs (Beak, 1978, 1979). To guard against excess concentrations of suspended solids, this water would all be directed to the sedimentation systeln in conjunction with surface runoff from the same area. The major difference between t h e groundwater sources in the 2240 M W and 800 MW Schemes is that the slide area underground drainage and most of the pi? perimeter wells have been eliminated from the smaller scheme. The pit rim will be further from the slide area, so the slide
hazard is reduced. The surface water collection system is retained as described in Section 4 . I .4 to reduce ground water recharge.

I 3 - 6
1 TABLE 3-2
* LAND AREAS CONTRIBUTING TO WATER DISPOSAL SYSTEMS
I . WATERSHEDS DISCHARGING DIRECTLY TO HAT CREEK W (BEFORE MINE DEVELOPMEMO
Description Reference No Area (km2) ( S e e Dwg 2- I) (before mine development)
P i t Region Southwest Northwest Southeast Northeast North Valley
Pit Region Subtotal
Houth Meadows South West Northwest North Northeast
Hbuth Meadows Subtotal
Harry Creek Marble Canyon
Watersheds in Project Area Subtotal
Hat Creek Watershed Upstream (Upstream of Diversion Dam)
Finney Creek Anderson Creek Anderson Creek North Medicine Creek Medicine Creek North Ambusten Creek Hat Creek Upstream of
Anderson Creek
Hat Creek Upstream of Diversion Dam Subtotal
6 7 8 9 IO
I I 12
13 14 15 16 17 18
19
3 .0 5 . 2 I . 9 I . 9
2.3
14.3
17.6 8 .6 5 .2
0.9 I . 9
28.2
I O 9.2
61.7
36 13.2
61 7 . 4
34
I98
350
a

1
3 - 7
(I
TABLE 3-2 (Continued..)
LAND AREAS CONTRIBUTING TO WATER DISPOSAL SYSTEMS *
2. WATERSHEDS DISCHARGING DIRECTLY TO HAT CREEK (DURING MINE DEVELOPMENT) 1
I Reference
Code (See Fig 3.5,4.5)
Ckcription Drainage Area
(km2)
QI Q2
D l
D2
D3 D4
D5 D6 D7
D8 D9
Dl0 Dl I Dl2 Dl3
HAT CREEK
Hat Creek u/s O F diversion dam
Hat Creek Pipeline diversion capacity
DIVERSION DRAINS
South West Pit Perimeter Diversion
Lower Slide Diwrsion
Finney Creek Watershed
Finney Creek Channel Realignment
Upper North Valley Diversion
West Houth Meadows Perimeter Diversion
Upper Slide Diversion
South Houth Me(3dows Perimeter Diversion North Houth Perimeter Diversion
North East Houth Meadows Perimeter Diversion
South East Pit Perimeter Diversion
North East Pit Ferimeter Diversion
Dewater wells below Diversion Dam
350 -
I .o 2.9
13.1 0.8
7.8 I 4.8 24.4
I .o 0.3 I .4 I .2
N/A

3 - 8
TABLE 3-2 (Continued..)
LAND AREAS CONTRIBUTING TO WATER DISPOSAL SYSTEMS
3. WATERSHEDS DISCHARGING TO SEDIMENT SYSTEM
Reference Description Code
Area (ha) Year 5 Year 15 Year 35
SI ~~~ ~~~
Houth Meadows Waste Dump Unstripped land below I 90 I13 67
Prestripped land diversion drains;
IO 17 - Active land 25 25 25 Reclaimed land N/A N/A I 30
s2 Slide Area Runoff I 20 I 20 I 20 53 Pit Surficials I80 I 20 I IO s4 Ground Water from Pit N/A N/A N/A
s5 North Valley Serviccts Area Surficials
Buildings, Pavement 20 20 20 Open areas I 90 I 90 I90
4. WATERSHEDS DISCHARGING TO LEACHATE SYSTEM
Reference Code
Description Area (ha) Year 5 Year I5 Year 31;
Z I Coal Blending Area 22 Coal Dump Station 23 Runoff from Pit Cod and
2 4 Groundwater Seepage from
25 Vehicle Washdown Area 26 Dust Control Consulnption 27 Evaporative Disposcd 28 Houth Meadows Waste Dump
29 Houth Meadows Waste Dump
other Bedrock
Pit Coal and other Bedrock
Leachate
(levelled land)
5 . DOMESTIC SEWAGE
Reference Description Code
ZIO Mine Maintenance Complex 300 300 300
Capacity (personslday) Year 5 Year 15 Year 315

3 - 9
I 3.3 WATER QUANTITY
a 3.3. I Quantity Desiqn Criterio and Methodolqy
.. Criteria
There are several different criteria used for assessing the design quantity of
water to be removed from the mine area. The assessment of which criteria to use in different areas is based on the relative importance of the drainage
I
I facility and the potential damage to the mine if the capacity were to be
exceeded.
1)
Water quantities are required for peak design flows for.the design of collection
a systems. The pipes, ditches and pumps conveying the four categories of water a r e assigned design return peri'ads according to Table 3-3. These return periods a r e based on the importance o f the facility and the consequences of failure. The individual criteria for t h e waters from the mine area are discussed in t h e following sections.
I
lm
Runoff Volume a
m
I
Consistent with the CMJV Report (1979), the 24 hour runoff volume and the peak discharge flows have been obtained using Figures 3-1 and 3-2. For rainstorm events, t h e 24 hour qreatest rainfall wos determined from Graph 2 of Figure 3-1. Graph 3 of this figure was t h e n used to obtain runoff volumes, and Graphs 4 to 6 were used to obtclin peak discharges.
I . Graph 2 used to determine the runoff volume is a graphical representation of a runoff relation presented, among others, by Chow (1969) or by the U S Department of Agriculture (1964). This runoff relation assumes average antecedent moisture conditions and is as follows:
Q = (P - 0.2s)2 P t 0.8s

3 - IO
and
where:
CN= 25400 S + 254
P is the total storm rainfall in mm S is potential infiltration in mm CN is the runoff curve number Q is the actual d i rect runoff in mm
CN values have been obtained for a variety of surface drainage conditions, some of which a r e shown in Figure 3-1. The actual direct runoff obtained ill
however very sensitive to t h e CN value used, and these values should be re,- examined for the final design and as the mine development proceeds. The
runoff volumes calculated by this method and presented in this report arc: adequate for preliminary design and were used to size the treatment facil i t ies.
Runoff Peak Discharge
Peak discharge flows were obtained from Graphs 4 to 6 given on Figure 3-1. These graphs were developed by the U S Department of Agriculture (1975) and are applicable for computing peak discharges from agricultural drainage areas less than 10 km2 in size which have a rainfall distribution common to most of the United States. The peak discharge curves in Figure 3-1 could therefore be applicable to the uniform land areas outside of the pit perimeter. The peak flows obtained for other areas, such as pit benches are calculated in the same manner. The drainage condi.tions for natural agricultural watersheds may be
quite different framn the drainage conditions within an open pit mine. It is recommended that in the final design stage the peak discharge values should be re-calculated using a different method than the U.S. Department of Agriculture (1975) which was !used above and in the CMJV report ( I 979).
For snowmelt-rainfall events,, a regional stream flow analysis was used by the CMJV Report (1979) to obtain Figure 3-2. These curves were used to obtain
flows for drainage areas in excess of IO km2 in size. Runoff values obtained for

H
3 - I I
I
m
I
areas close to IO km2 in size, obtained separately from Figure 3-1 and
Figure 3-2, differed considerl~bly and transition values for these areas were:
developed. It is recommended that the peak flows be reviewed carefully prior
to construction.
To assist in obtaining adequate peak discharge values to size the collection
systems, intensity duration frequency (I D F) curves would be desirable.
Rainfall intensity measuring (equipment should therefore be maintained in the
Hat Creek valley. Stream flow monitoring should also continue, as well a:;
measurements of discharges from small, low elevation basins. Peak runoff
figures obtained from pit benches similar to those at Hat Creek would also be
desirable.
(I
3.3.2 Runoff Discharqed Directly to Hat Creek
I
The runoff from the natural land areas surrounding the mine would not be
affected by any mining activities. However, the water that would normally
have discharged to Hat Creek itself, must avoid the open pit, the waste dump
and other facilities, before discharging into Hat Creek or i t s diversion.
As detailed in Table 3-3, perimeter drains and major diversions are sized far the
100 year rainfall and 1,000 year snowmelt events respectively. The calculation
of these flows has been adopted from the previous mine drainage study (CMJV, 1979) which based the tributary runoff on the long term regional data available
for Hat Creek and other streams in nearby valleys. A t the time of the previous
study, there were only partial records available for the tributary streams to Hat
Creek, and no conclusions could be drawn. Since 1979, nearly 4 years of record
are available on Ambusten, Anderson and Medicine (upper and lower) Creeks, as
shown an Table 3-4.
Table 3-4 indicates that there are large differences between the hydrology of
the tributary creeks and of Hat Creek. The figures seem to indicate that the

3 - 12
TABLE 3-3
DESIGN CRITERIA FOR PLANNING OF MIM: DRAINAGE SYSTEM
Probability of
Element Description Flood Year Mine Life Type of Drainage Design Exceedance in 35
(%)
Major Creek Diversions Hat Creek 1,000 yr F* 3 Finney CI-eek 1,000 yr F* 3 Houth Creek 1,000 yr F* 3 Upper Medicine Creek Probable Max.
Flood "
Perimeter Drains Around Pit Waste Dumps 100 yr R 30 & Slide Area
Surface Water Drains Permanent Major Drains 100 yr R 30 within pit
Leachate Collection Systems Temporary Minor Drains IO yr R 97
Rate "
Field Drains Max Seepage
Dewatering Wells Collection Systems Max Pumping Rate "
Sedimentation Lagoons Emergency Spillways 1,000 yr R 3
Treatrnerlt Capacity IO yr R 97
Leachate Storage Lagoons Emergency Spillways 1,000 yr R 3
Storage and Disposal 2 x Mean Annual Capclcity Flow "
U *Refer BCH/HEDD 1976 and Monenco I377 for Design Criteria.
Note: w
1,000 yr F - refers to the 1,000 year average recurrence interval flood during spring freshet caused by rain and snowmelt;
I 100 yr R - refers to the 100 year average recurrence interval flood caused by
high intensity rainfall alone.
.li

3 - 13
TABLE 3-4
RECENT HYDROLOGY IN THE HAT CREEK BASIN
Ambusten Creek 79 near mouth 80 Stn No 08LFO81 8 I
Anderson Creek 79 above diversions 80 Stn No 08LF084 81
Medicine Creek 79 near mouth 80 Stn No 08LF082 8 I
Medicine Creek 79 Diversion near 80 Ashcroft 81 Stn No 08LF083
Near Upper 79 Hat Creek 80 Stn No 08LF06 I 8 I
Mean
Hat Creek 79 nr Cache Creek 80 Stn No 08LFO I 5 8 I
Meon
.05
.417
.982
I .07
4.51 I .94
.345
.545
.510
.590
.903
IO. I 1.16
16.8
I .3l 7.67
18.0 -
.048
.847
.283
.914
2.31 I .94
.261
.502
.444
- .789 .539
9.55 I .06
12.5 6.2
7.26 I .23
12.8 6.6
I .o 5.7 2.0
9.5 12. 12.
1 . 1 I .3 3.0
- 7.4
10.0
2.0 6.8 9.0 5.5
I .4 3.8 5.8 3.8
I I .5 2.5
- I
I .5
IO I
70
I
30 3
-

3 - 1 4
runoffs are larger and more uniform on the western side of the valley than on the eastern side. This inforlnation will affect the size of the diversion and
perimeter drains, hence the generalized criterio used in this study should bt:
updated at the time of construction, when more flow records would be
available.
The other creek shown on Table 3-4, Medicine Creek, has an existing diversion
in i t s upper reaches which complicates the hydrology. The gauge in the
diversion measures flows to Cornwall Creek from a drainage basin of 21 km2,
which is all upland flow. The gauge on the lower creek measures flow from (1
drainage area of about 40 krn2 but i f the diversion was no longer in place, tht:
drainage area would be about 4 6 1 km2 and the peak flows would be much larger.
Until further dota i s available, water quantities from natural drainage areas ore
based on the graphs on Figure:; 3-1 and 3-2. The areas around the pit perimeter
are all less than IO km2 and would use Figure 3-1 while a few larger basins
would use Figure 3-2. For conlporison, flood frequency curves are also shown in Figure 3-3. A summary of flows for the natural land areas near the open pi?
mine is shown on Table 3-5.

3 - 15
TABLE 3-5
DESIGN FLOWS FROM WATERSHEDS
DISCHARGING DIRECTLY TO HAT CREEK
YEARS 1-35 -
Reference Code Description ( m3/s) Criteriia
Design Flow
QI Q2
D l
D2
D9
D l 0
D l I D l 2
D3
D4
D5
D6
D7 D8
HAT CREEK
Hat Creek u/s of Diversion Dam
Diversion Capacity
DIVERSION DRAINS
S W Pit Perimeter Diversion
Lower Slide Diversion
North Houth Perimeter Diversion
N E Houth Perimeter Diversion'
S E Pit Perimeter Diversion
N E Pit Perimeter Divenion
CREEK DIVERSIONS
Finney Creek Watershed Finney Creek Channel Realignment
Upper North Valley Diversion
West Houth Perimeter Diversion
Upper Slide Diversion
South Houth Perimeter Diversion
27 27
0.9 2. I I .3 0.6 I .4 I .o
2.0
2.4
0.3
I .6 2.7 4. I
A IO00 1:
100 F: IO0 F!
100 F! 100 F!
100 F! 100 F!
1000 = IO00 != 100 Ft IO00 != 1000 = 1000 =
NOTE: " Location of drains shown on Figure 4-1; drainage areas given in Table 3-2(2).
1,000 yr F - refers to the I,OOCI year average recurrence interval flood durincl spring freshet caused by rain and snowmelt;
100 yr R - refers to the 100 year average recurrence interval flood caused by high intensity rainfall alone.

3 - 16 - 3.3.3 Runoff Discharqed to Sediment System
I
Both the peak runoff and the runoff volume must be accounted for in the design of facilities for the control of water from disturbed land oreas which would discharge to the sediment system. Runoff from these oreas would include:
.. a) runoff from the pit slopes below the pit perimeter excavated in
surficiol deposits;
b) runoff from the slide area;
c) runoff from the North Valley Services Area.
The design criteria for these areas have been outlined in Table 3-3. The flow from these areas must be routed to the sedimentotion lagoons, hence the volume of runoff is of importance as it determines the volume of these structures. The peak flow is also important for the design of pipes, channels and pumps (if required). Details of these systems are given in Sections 4.2 and 5.2.
The peak flows from disturbed land areas are approximated from the graphs in Figure 3-1 and are shown on Talde 3-6. Groundwater flows are more constant and are discussed in Section 3.3.5. The volume of the runoff from these areas is
based on the IO-yeor 24-hour runoff from Graphs 2 and 3 in Drawing 3-2, and is used for sizing the sedimentation ponds. The mean annual runoff is also shown for comparison, based on 80 mm of annual runoff from the land oreas subjected to dust control (ie: within the pit) and 50 mm of annual runoff for areas outside the pit. These runoff values are based on water budget accounting method (modified) developed in the mine drainage study for the 2240 MW pit (CMJV 1979). Projections of the rumff are shown for the 5, I5 and 35 yeor pit development stages.

3 - 17
TABLE 3-6
DESIGN FLOWS AND VOLUMES FROM WATERSHEDS DISCHARGING TO THE SEDIMENT SYSTEM
YEAR 5 YEAR 15 YEAR 35
Design 24 hr A m 1 Design 24 hr AMWI Design 24 hr AMWI Flow Volume Volume Flow Volume Volume Flow Volume Volume
Code AREA (m3/s) m3xIO3 m3xIO3 (m%) m3x103 m 3 x d (m3/s) m3xlG m3x I 03 Reference
S I Houth Meadows Waste Dump Unstripped land below
diversion drains 0.3 2.6 95 0.2 I .6 56 Prestripped Land 0.15 I .5 5 0.30 2.5 8 Active Waste Dump - - - - Reclaimed Land - - -
- - - - -
52 Slide Area Runoff 0.85 10.2 60 0.85 10.2 60
53 Runoff from Pit Surfaces 2.8 27.0 I44 2. I 18.0 96
s5 North Valley Senices Arm Buildings, Pavement I .3 5.8 I O I .3 5.8 IO Open Area I .6 11.0 95 I .6 11.0 95
n. I 1x9 - - - I .o 7.5
-
0.85 10.2
2.0 16.5
I .3 5.8 I .6 11.0
33 - -
65
60
88
95 IO

1
3.3.4
L
w
w
1
U
U
I
I
I
3.3.5 a
Runoff Discharqed to Leachate System
Some land areas within the pit and surrounding facilities produce runoff which
contains unacceptable chemiccll levels and which rnust be stored in the leachate
lagoon. These sources of water include:
a) drainage from coal blending area
b) drainage from coal dump areas
c) runoff from pit cod and other bedrock, other than surficials
d) runoff from the waste dump.
The design criteria for these flows were outlined in Table 3-3. Runoff peak
flows and volumes are both important in the design of the collection and
treatment facilities. Peal< flows from areas producing runoff were
approximated using Figure 3- I . and were used to size the collection facilities,.
Runoff volumes are required .for the sizing of the leachate lagoon. The lagwrl
must store all the water durinq the spring runoff for gradual release to the dust
control system during the surnmer. The mean annual runoff i s the governinq
criteria, and has been taken a!; 80 mm (CMJV, 1979) for areas which contribute
direct runoff. Groundwater flows have been calculated separately and
described in Section 3.3.5. To be conservative, the extreme inflow to the:
lagoon is taken as twice the mean annual surface inflow plus the meor1
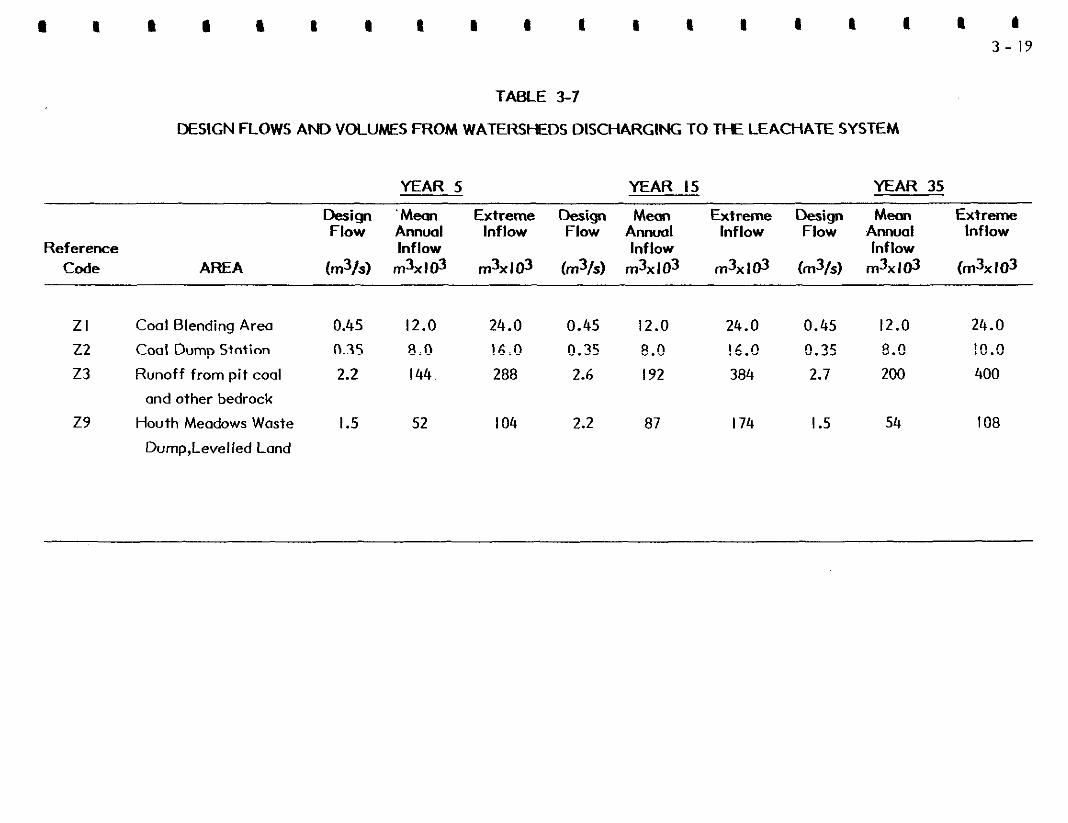
groundwater inflow which gives a moderate value of the recurrence interval.. The runoff values from surface areas are given in Table 3-7.
Hat Creek itself has had some runoff volumes nearly twice the mean in aboui
20 years of record, hence the probability of the event occurring is realistic,.
The safety factors inherent in the lagoon design are described in Section 5.3.
Groundwater
Groundwater originates from the diversion dam wells, seepage at the toe of the
Houth Meadows Waste Dump 'and seepage from surficials and bedrock into the!
pit itself. These flows were previously estimated for the 2240 MW Mine
a I I; li I e I I I I I I I I I I I 1 I 3 - 19
TABLE 3-7
DESIGN FLOWS AND VOLUMES FROM WATERSHEDS DISCHARGING TO THE LEACHATE SYSTEM
YEAR 5 YEAR 15 YEAR 35
Design ' M e a n Extreme Design Mean E x t m e Design Mean Extreme
Reference Inflow Inflow Inflow Flow Annual Inflow Flow Annual Inflow Flow Annual Inflow
Code AREA (m3/s) ~ 1 ~ x 1 0 ~ rn3xl$ (rn3/s) rn3x103 rn3x 103 (rn3/s) m&($ (m&(03
ZI Coal Blending Area 0.45 12.0 24.0 0.45 12.0 24.0 0.45 12.0 24.0 22 Coal Dump Station n,35 8:n !6.n 0.35 n.n !6.C "35 g.c !!?..c! 23 Runoff from pit coal 2.2 144. 288 2.6 I92 384 2.7 200 400
z9 Houth Meadows Waste I .5 52 I 04 2.2 87 I 74 I .5 54 108 and other bedrock
Durnp,Levelfed Land

3 - 20
Drainage Study (CMJV, 1979) and they have been updated for the 800 MW Pit
using results from the 1982 field work (Golder Associates, 1982) where
applicable.
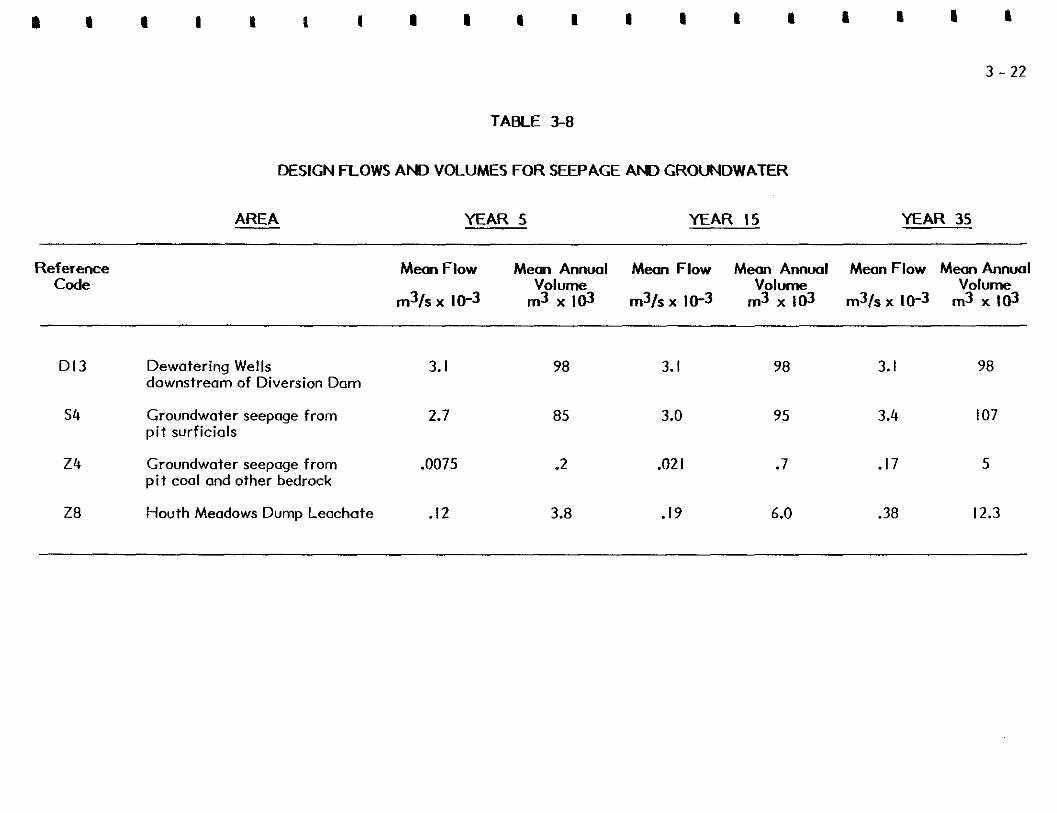
For estimation purposes, groundwater seepage into the pit derived from bedrock
is assumed to be constant on CI daily and annual basis based on an average
hydraulic conductivity of I x 10-9 m/s. The magnitude of these flows i s shown
on Table 3-8; quality is assumed to be poor and the water would be directed to
the leachate system. The calculated flows are considerably less than those
calculated for the 2240 MW Scb8eme because of the smaller and shallower 800
MW Pit. However, there is a wide scatter in the field test results of hydraulic
conductivity (Galder Assoicotes,, 1978, 1982) with some indication that higher
values are characteristic of s:7aIlow depth. This could be due to glacial
disturbance or stress relief. It i s certain that higher than average short
duration inflows would result when fault or highly jointed zones were
intersected. Temporary in-pit storage of these flows might be required. It i s
recommended that surveillance should be undertaken during the early years to
verify the inflow prediction because of the variation in tests results.
Water originating from seepage through the surficial deposits should be directed
to the sedimentation system; woter from the diversion dam wells and
m dewatering wells would be clean enough to use for irrigation or direct discharge to Hat Creek.
I
A schematic representation of the ground water flows i s shown on Figure 3-5.
I 3.3.6 Sewage
Sewage flow at the Hat Creek Project originates from the facilities at the mine
maintenance area. In the mine drainage study for the 2240 MW Scheme, the I flow was estimated at 140 m3/day for a 700 man-shift crew. This represents a
flaw of 200 I/c/d, compared with the construction camp flow allowance of 230
m

3 - 2 1
I/c/d (R D Lewis, 1980) and the Provincial Health Branch guideline of 90 I/c/d
(for factories with showers). For the 800 MW scheme, the estimated sewage
flow for the 300 man operation will be 200 I/c/d. Sewage flows and volumes are
given in Table 3.9.
3.3.7 Vehicle Washdown Water
The vehicle washdown area wil, be located in the Mine Maintenance complex.
Since the runoff from the vehicle washdown will be high in dissolved solids, it
will be discharged into the leach'zte system.
In consultation with the B C Hydro Mining Department, it was estimated that
20 to 25 major pieces of euqipment would be in operation at the mine and would
have to be cleaned every two to three weeks on the average.
A typical high pressure hot water washer used for cleaning heavy equipment has
a capacity of about 2.7 m3/hr an'd depending on the season it takes from four to
six hours (longer if there is snow and ice buildup) to clean a vehicle. The runoff
flows and volumes are given in T(3ble 3-9.
a
3 - 22
TABLE 3-8
DESIGN FLOWS AND VOLUMES FOR SEEPAGE AND GROUNDWATER
AREA YEAR S YEAR 15 YEAR 35
Reference Code
Mean Flow Mean Annual Mean Flow Mean Annual Mean Flow Mean Annual
m3/5 x 10-3 m3 x 1 0 3 m3/sx 10-3 m3 x 103 m3/sx 10-3 m3 x 103 Volume Volume Volume
D l3 Dewatering Wells 3. I 98 3. I 98 3. I 98 downstream of Diversion Dam
54 Groundwater seepage from 2.7 85 3.0 95 3.4 I07 pit surficiols
24 Groundwater seepage from .0075 .2 .02 I .7 .I7 5 pit coal and other bedrock
28 Houth Meadows Dump Leachate .I2 3.8 .I9 6.0 .38 12.3

TABLE 3 - 9
DESIGN FLOWS A N D VOLUMES FOR SEWAGE AM) VEHICLE WASHDOWN
YEAR 5 YEAR 15 YEAR 35
Reference Description Design Mean Annual Mean Annual Design Mean Annual Design Code Flow
m3/s Volume m3x 103
Flow Volume m3/s m3x 1 0 3
Flow Volume m3Is m3 x 103
z5 Vehicle Washdown 0.8 1.3 0.8 1.3 0.8 5.8
ZiO Soniiary trrluent .005 21.9 .005 21.9 .005 21.9 - ~ _.

m
3.3.8
I
I
II
I
Evaporation
The Hat Creek area has relatively light rainfall and low humidity which give i': a high potential evaporation rate. The mine site is required to have a zero
discharge of polluted water from the leachate lagoon hence evaporation plays (1
major role in disposing of wasiewater from the site.
The water is disposed of at a number of areas on the site. Dust control is the
largest water user, with discharges onto roads and the coal blending area.
There i s also direct evaporation from the leachate pond surface and direct:
losses to the air in the dust control sprays (assumed as I5 percent of the total).
In years where there was too much water for dust control, the surface of the
Houth Meadows waste dump would be sprayed to evaporate the excess water.
The mean evaporation rate in the area i s about 250 mm/year as shown arl
Figure 3-4. This figure is usecl as a design value for spray irrigation areas and i:;
increased to 400 mm on areas of high dust potential, such as roads and coal
blending areas. The remaining area, the pond surface, is assigned a more
conservative evaporation rat" of 125 mm/year. The evaporation rates and
areas for various stages of mine development are shown in Table 3-10.

3 - 25
TABLE 3-10
EVAPORATIVE DISPOSAL AREAS
YEAR 5 YEAR 15 YEAR 35 Evcwratim Evaooration Evmoratian Evaaration
~ r ~~ ~~~~~
~~
Reference Code
~ ~~~
. Rate Area vblume Area Vblume Area Vblume AREA mmhr ha m3x 1 0 3 h a m3x 1 0 3 ha m3 x 103
26 Dust Control -Roads 400 19.5 78 22.5 90 24.0 96 -Cod Biending 400 i 5 60 I 5 60 15 60 -Coal Dump Station 400 10 40 10 40 IO 40
-Pond Evaporation I25 9 I I 9 1 1 9 I I -Other (Spray Loss) 15 15 15
27 Evaporative Disposal
-Houth Meadows Waste Dump 250 I05 262 I 75 437 238 595 (potentia! Vo!i;me shswn)
Total Potential Evaporation 466 653 817

4 - I 1
4. COLLECTION SYSTEMS .. 4. I COLLECTION OF DIRECT DISCHARGES TO HAT CREEK
I The collection system for rumff from the undisturbed land areas involves a
combination of watercourses, channels and pipes. These features use different
design criteria, depending on the tributary area (and hence the volume of
runoff) involved. Design flows for the areas less than IO km2 ore based on the
m
II 100 year rainfall event, while flows for larger areas ore based on the 100 year
.. the 2240 MW pi t (CMJV, 1979) is inconsistent at the boundary between large
.I areas and system layout are shown in Figure 4-1. The system schematic is
snowmelt event. This approach, which was used in the mine drainage study for
and small catchments ( I O km) so transition flows were derived. The drainage
shown in Figure 4-5, along with the sediment and leachate systems. The
disposal of the water i s described in Section 5. I . rn
4. I. I Land A r e a Upstream of Diversion Dam m
The runoff from the Hat Crs-ek watershed upstream of the diversion dam e located at Finney Creek, would be conveyed around the open pi t mine through
the Hat Creek pipeline diversion. This major Hat Creek diversion system is
described in detail in the Diver:sion Report (Colder, 1982).
Typicol sizing of the open drains for the collection system is given in Table 4- I.
The maximum velocities in thse drains are mainly determined by the channel
slope, and for steeper section:; riprap protection would be required to prevent
excessive erosion.
Finney Creek would discharge: into the moin diversion just upstream of the
diversion dam. Because of i t s proximity to the pit boundary, and because the
present channel is not well defined in the fiat terrain near the existing airstrip,
the channel would be realigned slightly to the south of i t s present location and
sized to accommodate the IOOCl year flood.

As pal -t of the diversion and dewater
4 - 2
.ing programme for the slide area, described
in Section 4.1.4, drainage of Finney Lake is not considered essential at the onset of the project. Monitoring of the slide area during mining should give indications whether to drain Finney Lake at a future date. Some of the runoff from the southern half of the slide area would also be diverted into the Finney Creek watershed.
4. I .2 Pit Perimeter Diverson Drains
The proposed open pit mine wculd be surrounded by approximately 6 km of open drainage ditches which would '.ntercept small amounts of local surface runoff. Where possible, they will be located adjacent to the perimeter access roads. The drainage ditches will cross under the roads as required through culverts.
The southeast and the southwest perimeter diversion drains will drain south from t h e high point along the pit rim to the diversion dam of the main Hat Creek Diversion system.
The northeast perimeter diversion drain will drain the northeast sector above the pit. To avoid contamination from mining activities, runoff from the drain will be conveyed in the lower sections by a 0.5 meter diameter pipeline since runoff from the northwest perimeter drain will be high in suspended sediments from the slide area. Slide area drainage is discussed in Section 4.2.
To avoid moving the pit perimeter diverson drains as the pit expands in size, the pit perimeter diversion drains are located on the basis of the 35 year pit rim boundary. Runoff from land areas between the perimeter drains and the expanding pit will be handled b v the sediment system described in Section 4.2.
4. I .3 Upper North Valley Diversion Drain -
The watershed above the North Valley mine services area will be drained by an
800 m long diversion ditch discharging into the Northeast pit perimeter diversion drain.

4 - 3
TABLE 4 - I
SIZING OF OPEN DRAINS
SLOPE .002 .00!5 .o I .os
Flow b h b h b h b h m3/s (m) (m) (m) (ml (m) (m) (m)
.5 .8 .45 .8 .3? .8 .30 R .8 .20 R
I .o .8 .60 .8 .50 R .8 .42 R .8 .27 R
1.5 1.0 .70 1.0 .56 R 1.0 .47 R 1.0 .31 R
2.0 1.4 .73 I .4 .5&1 R 1.4 .48 R I .4 .32 R
3.0 1.4 .88 R 1.4 .71 R 1.4 .60 R 1.4 .40 R
5.0 1.6 .98 R 1.6 .78 R 1.6 .66 R 1.6 .43 R
Notes: b = bottom width of drain h = depth of flow R = riprap required Bank side slope for drains is 2 horizontcll : I vertical

4 - 4 I
4. I .4 Slide Area Diversion and Dra inoz
1 The area immediately to the west of the open pi t has been identified as a slide
area and an adequate drainage system must be maintained to ensure slide
stability. A smaller portion of this area, immediately above the p i t can be
classified as an active slide areo, while a larger area surrounding and above the
active slide area can be classi.Fied as a past or potential slide area. The runoff
from the surface of the active slide itself will be high in suspended solids and is
discussed in Section 4.2.
1
i
I
a
I
m
I
1
To assist in the lowering of tkle ground water table of the area, and to prevent
recharge of the ground water system, Aleece Lake and numerous small ponds in
the area would be drained. A monitoring programme of the slide area during
mining should give indications (of whether Finney Lake should also be drained.
To minimize infiltration of surface runoff from the small creeks and watersheds
above the slide area, and to provide drainage to the potential slide area, two
slide diversion drains and several secondary drains would be constructed. The
largest drain, the upper slide diversion drain, starts at elevation I150 m and
follows north, along the stable slope-slide debris contact zone. The upper slide
diversion drain is approximately 2 km long and empties into the South Houth
perimeter diversion drain. Also at high elevation, will be a short secondary
drain flowing south into the Firlney Creek watershed.
A t lower elevation, draining most of the potential slide area immediately above
the active slide, will be the lower slide diversion drain. It will be 2 km long and
will travel from approximately the Aleece Lake location, south into the Finney
Creek watershed. Several sescondary drains would feed into the lower slide
diversion drain. The northern section of the potential slide area will be drained
by additional secondary drains, emptying into the South Houth perimeter
diversion drain. The southwest pit perimeter diversion drain wil l also assist in
the drainage of the slide area.

4 - 5 .I
4. I .5 Houth Meadows Perimeter Diversion Drains
1
The Houth Meadows waste dump would be surrounded by approximately 6 km of perimeter diversion drains. l h e largest of these drains would be t h e West Houth perimeter diversion drain, which would divert the runoff from the large watershed to the west of Houth Meadows dump, and South Houth perimeter diversion drain which would cclnvey the runoff from the upper slide diversion drain in addition to the West Houth perimeter diversion. This drain would discharge into the main Hat Creek diversion via a 0.8 meter diameter pipeline. The smaller North Houth and Northeast Houth perimeter diversion drains would
w
'I
a
;I carry runoff from the northern sides of the Houth (Meadows dump. They would
discharge onto level ground spreaders into the Marble Canyon watershed.
IL
The Houth perimeter diversion drains would be constructed in locations os
required for the 35 Year dump boundary. Runoff from the land areas between the perimeter diversion drains mend the expanding pit would be handled by the drainage system described in Set-tion 4.2
rl
* 4.2 SEDIMENT COLLECTION SYSTEM
I
The collection system for woiers directed to the sediment system involves I wells, drains and pipes. All of t h e runoff from disturbed land areas is passed
I the maintenance yard, pit surficials, reclaimed waste dump surface, slide area
through the sedimentation lagocm os described in Section 5.2. The oreas include
and pit seepage from surficials. The collection systems for each of these areas is described below and shown on Figures 4.2, 4.3 and 4.4..
I
4.2. I Pit Surficials .I*
The groundwater seepage and runoff from in-pit surficials includes the area between the pit perimeter drain:; and t h e upper level of coal strata. It would be desirable to separate the runoff from the surficials which would be high in
- I suspended solids from the runoff contaminated by coal on lower benches. The

4 - 6
I
practicality of this division would be determined in the final design stage 01-
during mine operation. If a separate drainage system were used, the c0ntac.t
zane between surficials and hedrock would not follow a pit bench exactly, s o
that some adjustment of the drain system would be needed to ensure that coal
leachates would not be collected. The system will have to be adjusted
m whenever the bench changed during expansion of the pit.
The runoff from the pit surficials would be conducted around the pit in ditches.
The benches would be sloped such that the flaw would be from the northern part
of the pi t towards the southern exit of the pit. The ditches would be lined
where required, and in some areas a closed conduit may be suitable. With
present mine plans a gravity flow system would be adequate and no pump::
would be required.
4.2.2 Groundwater Seepaq e in Surficials - r[l
Groundwater seepage enterintg the pit from the surficials will mainly occur at
the contact between the surficials and bedrock. This water will be of sediment
water quality or better. Since the surficial bedrock contact may occur an 11
bench draining into the leachaate system, a separate collection system far the
groundwater seepage would be desirable. Alternatively, the groundwater
seepage could be discharged directly into the pit bench ditches and into the
leachate system. The relative costs of each alternative would be examined in the final design stage and the appropriate alternative chosen.
.* 4.2.3 Active Slide Area Drainage
Runoff from the active slide area would be high in suspended sediment and
would be directed into the sediment system. With the smaller 800 MW pit size
no dewatering wells for the slide area would be required.
The surface flow from the active slide area would be collected by the northwest
p i t perimeter diversion drain, and a slide area drain located on the active slide

4 - 1
material. The flow would th'm be conveyed through the waste material haul road embankment, connecting to t h e rest of the sediment system.
4.2.4 Waste Dump Surfaces
The Houth Meadows waste dump surface area can be divided into five areas: unstripped land below the perimeter diversion drains, prestripped land, active! waste dump, levelled land and reclaimed land. Although runoff from only some
of these areas would be high in suspended solids, to keep the collection system simple all runoff except that from the levelled dump area would be directed into the sediment system. The runoff curve numbers (Figure 3-1') corresponding to the individucd surface conditions, were used to determine the
total flows.
The Houth Meadows waste dump would be sloped and runoff would be collected by drainage ditches. The active dump itself would not contribute to runoff
since it would consist of ridges and furrows. The active area would be subsequently levelled and may contribute significantly to runoff which would be collected separately and conveyed to the leachate system. Because o f
uncertainties in the f inal durnp design, the sizing and location of the drainage ditches should be incorporated into the final design stage. This is particularly t rue of the drainage behind the expanding dump because its lower elevation, in relation to the main body of the dump, precludes the use of simple drains to convey the water to the sediment system.
4.2.5 North Valley Services Area
Much of the natural cover of the North Valley Services Area would b e disturbed, and all runoff with the exception of that specifically designated as leachate quality, would be directed into the sediment system.
The North Valley Services Area is bounded an the north by the pit, on the south
by lower sedimentation lagoons, on the west by Hauth Meadows waste dump,

II
4 - 8 I
and on the east by the coal blending area and the mine maintenance complex.
m Drains would be placed at various locations to direct the waters into the sedimentation logoon.
I 4.3 LEACHATE COLLECTION SYSTEM
.II 4.3. I Definition
a The collection system for flows i o the leachate system would involve several different systems. The design cri:;eria ore consistent with the other collection
1 systems except that groundwater or seepoge flows are taken as constant while
1 annually. The water collected by these systems rnust be conveyed to the
surficial runoff would vary both irl distribution throughout the year and in total
leachate logoon for storage and eventual evaporation. The sources of water include runoff from t h e coal blending area, runoff from coal and rock in the pit, runoff from t h e levelled waste clump, seepage from the coal exposed in the lower port of t h e pit vehicle wclshdown water and leachate from the Houth Meadows Waste Dump. The collection systems are shown on Figures 4-2, 4-3
I
I
~ o n d 4-4. 1
4.3.2 Runoff from Coal and Rock in thefi 1.
Runoff in the lower part of t h e open pit where cool would be exposed would be
m collected in bench drains much as in the upper pit area where surficiols are present. These drains would also collect groundwoter seepage. The drains would lead to the north end of the pit, where the gravity catchment from several levels would be collected in small storage basins for pumping. Several pumps at each collection level would be used (for capacity and security). The flow would join other flows which would be piped to the leachate lagoon.
- I
4.3.3 Runoff from the Coal Blendinq Area and Coal Dump Area
- - Runoff from the cool blending and dump oreos would consist of natural runoff plus water residual from the dust control sprays. The water would be collected in several drains in the areas located at the edge of the are0 i f the surface is

4 - 9
impervious. Depending on the relative elevations of the coal blending area and the leachate lagoon, a pump rnight be required to direct the runoff from the drains to the discharge.
4.3.4 Runoff from the Levelled Area of the Houth Meadows Waste Dump
This runoff will be collected t'y ditches, similar to the adjoining areas of the waste dump. The collected water will be pumped over the top of the embankment and carried in a conduit to t h e leachate lagoon.
4.3.5 Vehicle Washdown Area
The water collected by floor drains in the vehicle washdown area will be carried by a pipe to the outside of -the maintenance area where it will join other wastewater flows and be carried by gravity to the leachate lagoon.
4.3.6 Seepoqe from Houth Meadows
The toe of t h e embankment defining the eastern edge of the Houth Meadows Waste Dump would be provided with drains and possibly seepage control wells to collect the groundwater emerging from the dump. These flows would be collected and pumped to the leachate lagoon. The wells would serve to collect contaminated groundwater and prevent it from flowing towards Hat Creek.
4.4. SEWAGE
Sewage collection would be by conventional means to gather t h e eff luent from the facilities associated with the mine maintenance area. The environmental services building location has not been decided yet but its contribution would be small and it would likely be loc~~ted away f rom the maintenance area and served
by a small sewage disposal system. The location of the sewage treatment facility has not been fixed, but once the effluent has been collected from the
maintenance area a single pipe would convey the flow and there would be few
conflicts in routing the pipe to m y of the potential treatment sites.

5 - I m
5. DISPOSAL SYSTEMS
II
5. I DIRECT DISCHARGES TO HAT CREEK
There are no quality control constraints with direct discharges, as by definitiorl
only water of an acceptabh quality could be dischorged to Hat Creek,,
Complications in design arise Ibecouse for most of i t s length in the pit area, Hal
Creek would be directed in a pipeline (Golder Associates, 1982). Only when il
is downstream of the Sedimentation lagoon would the Creek return to an open
channel, making simple discharges possible. Energy dissipation would only be
required where large flows were discharged to unprotected sections of Hat
Creek.
There are a limited number of locations where it would be feasible to discharge
runoff water directly to Hat Ci-eek. The southern half of the pi t would have i t s
perimeter drains flowing towards the south, where the water could enter the
diversion intake pond upstream of the diversion dam. Water collected in the
northern half of the pit perimeter would be directed to the north, where it
would be close to the Hat Creek Diversion, so that it would be feasible to
return the direct runoff flows back to the system by means of a junction.
Further downstream, tributary flows from the North Valley services ore0 would
originate from disturbed land areas and these flows would be directed to the
sedimentation lagoons.
I
5.2 SEDIMENTATION LAGOON
1
5.2. I General
The sedimentation lagoon accepts water from disturbed land areas as outlined
in Section 4.2. The purpose of the lagoon i s to settle out suspended solids from
the incoming water and release the water after o suitable detention time so
that it has less than 25 to 75 Ing/l of nonfilterable residue to meet the Waste
Management Branch objective.
a

5 - 2
5.2.2 Desiqn
In order to establish the settlement rate and hence the lagoon size, a number of
column settling tests were performed on a variety of samples from the Hat
Creek area. These are shown in Tables 5. I , 5.2 and 5.3, duplicated from the
drainage study for the 2240 MW Scheme (CMJV, 1979). The test results
indicate that long settling times are required if the use of coagulant (aluminum
sulfate) i s to be avoided. As, indicated in the tables, the use of coagulant
greatly speeds the settling time.
I The critical settling velocity was selected as 9 cm/hr (2.5 x 10⁻⁵ m/s) to meet
the guidelines and provide additional detention time for the fraction of the
runoff which should have gone to the leachate lagoon. (CMJV, 1979).
1
The sedimentation lagoons are sized on the basis of the critical settling velocity
and the design inflow rate. For the 800 MW Scheme, the design inflow rate is
equivalent to the IO year 24 hour mean runoff of 0.88 m3/s while the settling
velocity of 2.5 x 10⁻⁵ m/s is used. The fallowing formula is used as the basis of
design:
Lagoon Area = Flow rate x 1.2 Settling Velocity
The factor of 1.2 accounts fa r nonuniform settling rates (Waste Management
Branch 1980). The calculated lagoon area is then 4.2 ha. In actual practice, there are typically 2 types of lagoons provided: the f i rst type of lagoon
(primary) is for flow regulation and settling of the course fraction of sediment,
while the secondary lagoon is for settling of finer suspended solids. In the
previous study, two secondary lagoons were used with a total area of 4.5 ha
while the primary lagoon area was 2.5 ha. For the design of the 800 MW
Scheme, the required area of the primary lagoon is taken as 2.1 ha while the
required area of the secondary lagoons i s 2.1 ha each. Actual areas are slightly
larger. Inflows t C '

COL -UMN SETTLING TESTS IN 2 -
5; - 3
TABLE 5 - I
I GRADUATE CYLINDERS WITHOUT FLOCCULAW
Suspended Solids (rng/L) Particle Size (%) Material Time 0 crn I I crn 28.5 cm Clay + Silt Sand pH
(hr) depth (sample)+
Glaciofluvial sand/gravel
Glacial till
Slide Debris
Waste (1)
Waste (2)
Low-grade coal
Composite
0.25 4.5 24
0.25 4.5 24
0.25 4.5 24
0.25 4.5 24
0.25 4.5 24
0.25 4.5 24
0.25 4.5 24
I 88 I20 76
2,600 510 45
5,798 560 60
10,000 840 I33
12,500 2,4 IO I 20
13,280 1,680
90
7,700 2,060
53
404 I32 56
5,643 1,980 1,040
IO ,040 2,760
65
15,000 9,480 5,800
17,080 9,400 5,400
17,080 9,860 6,040
10,820 5,980 3,200
428 2 I32
98 '1.4
60
5,893 19 81 ,9. I 2,670 1,360
I 1,218 36 64 8.2 4 , I30
70
16,640 2 98 i3.5 10,160 7,020
19.160 6 94 8.3 I0;960 6,920
19.060 N I A N I A 16.9 I I ;789 8, IO0
12,260 N / A N / A 13.1 7,040 4,340
NOTE: " 50 g of original solids (coarse plus fine) per litre distilled water
B C Research (I 978) Golder (I 978)
(1) Golder Sample
(2) Acres Sample

COLUMN SETTLIN
5 - 4
TABLE 5 - 2
G TESTS IN 15 CM X 1 8 0 CM CYLINDERS WITH ALUMINUM SULPHATE
su:spended Interface Material Time !5mli& Turbidity Depth
Sample Dqpth
(hr) (Nigh-) NTU (cm) (cm)
Glacial till 0.3 0.6
Slide debris 0.3 0.6 I .6
Waste (1 ) 0.9 2.5 5.3 6.7
Waste (2) 0.7 4. I 4.2
21.4
Low grade caal 0 . 6
4.7 I . 9
6.2
0.9 0.3
I .8 3.7 5. I
Composite
44 19
I44 68 42
I05 66 5 4
28 2 21 25
I I 21 8 2
20 9 7 3 5
21 .o 7.5
48.0 29.0 21 .o 32.0 23.0
3.2 2.2
11.0 2.5 7.5 8.2
7.2 8.8 5.2 2.4
16.0 6.5 4.5 4.2 2.8
61 48 81 48
43 20 67 36 78 65
8 t ; 22 48
20 37
53 52
7 38 20
L. J
38 36 69 52
85 24 20 51 36 59 51
9 28 22
7
41 36 67 53 70 66
(1) Golder (2)Acres
NOTE: Alum dosages are described in Table 3-13.
Source: 6 C Research ( 1978)

TABLE 5 - 3
COLUMN SETTLING TESTS IN I5 CM X I80 CM CYLINDERS
WITH ALUMINUM SULPHATE (ALUM)
Time to Achieve Free Interface Suspended Solids
Alum Dosage SettlinXpate
50 mg/L at so4 m d - cm r 50 an depth FIA
hours
Glacial till I 00 253
Slide debris I 20 I43
Composite waste 206 30
Low grade coal I25 12
Waste ( 1 ) 2 06 9
Waste (2) 206 9
I 74
2 I :38
4 I06
6 1’1 I
6 I lj2
21 I78

5 - 6
the lagoons are shown on Tc~bles 5-4, 5-5, and 5-6 based on flow figures
established earlier in this report. The flows change l i t t le throughout the mine
development period, so the lagson is built to i t s ultimate capacity in Year I.
5.2.3. Construction
The sedimentation lagoons art? located in the valley bottom just north of the
leachate lagoons described in Section 5.3. They would be constructed of o
compacted fill core with a sond and gravel outer shell. Lining of the lagoon
would be required if the underlying soils were found to be too pervious.
The primary lagoon dam would be built with an upstream crest in common with
the leachate lagoon dam. The downstream crest would be common with the
secondary sediment lagoons clnd the sides would be raised above the valley
bottom where required. The secondary lagoons, because the valley elevation
continues to fall, would be built above the valley bottom. The plan of the
lagoons i s shown in Figures 4.il through 4.4, showing a primary logoon 150 m x I50 m x 5 m and secondary lagcans 70 m x 325 m x 2.5 m.
The control structures would be similar to those proposed for the 2240 MW Scheme, with an inlet manifold feeding the primary lagoon, 2 outlets feeding
the secondary lagoons and overflow outlets from the secondary lagoons. The logoon outlets would be sized for the 1000 yeor flood, although the lagoons
themselves are sized for detaining the IO year flood. Extreme floods will pass
through the lagoons with l i t i le detention. The combined secondary lagoon
volumes would total 115,000 n13 to provide a 36 hour average detention time.
During peak storms, pH and coagulant facilities would have to be used to adjust
for higher sediment loads and shorter detention times.
5.2.4 Hydroqraphs
The design flow hydrograph for the lagoon system i s shown in Figure 5.1. The
inflow is based on a simulated 24 hour, IO year storm, peaking linearly after

5 .- 7
TABLE 5-4
ESTIMATED SEDIMENTATION LAGOON INFLOW
YEAR 5
Ref Area Runoff Curve Mean Annual Runoff 10 Yr 24 I-lr Code Source (ha) CN mm m3x IO3 Runoff,
m3 x 1 0 - 5 ~
5 I Houth Meadows Waste Dump
Unstripped land below diversion drains I 90
Prestripped land IO Active Waste Dump 25 Reclaimed Dump 0
~~ ~
52 Slide Area Runoff I20
S3 Runoff from Pit Surficials I80
S4 G r d Water Seepage from Pit Surficials N/A
55 North Valley Services Area
Buildings, Pavement 20 Open Area 1 90
70 90 -
80
65
90
N/A
98 80
50 95
50 95 50 0 50 0
50 60
80 I44
N/A 85
50 IO 50 95
Total 584
2.6 I .5 0 0
10.2
21
0.2
5.8 11.0
58.3
NOTE -. Runoff Curve Numbers should be updated in the early stages of mine development..

!i - 8
TABLE 5 - 5
ESTIMATED SED\ MENTATION LAGOON INFLOW
YEAR 15
Ref Code Source (ha:) CN mm m3x I R u d f
Area Runoff Curve Mean Annual Runoff IO Yr 2h Hr
m3 x 103 ~~ ~~
5 I Houth Meadows Waste Dump
Unstripped land below diversion drains I I3
Prestripped land 17 Active Waste Dump 25 Reclaimed Dump 0
~ ~~
52 Slide Area Runoff I20
53 Runoff from Pit Surficials I20
54 Ground Water Seepage from Pit Surficials N/A
55 North Valley Services Area
Buildings, Pavement 20 Open Area I 90
70 90 -
80
65
90
98 80
50 56 50 8 50 0 50 0
50 60
80 96
N/A 95
50 IO
50 95
Total 420
I .6 2.5 0 0
10.2
18
0.3
5.8 11.0
49.0
” NOTE: Runoff Curve Numbers should be updated in the early stages of mine development.

ti - 9
TABLE 5 - 6
ESTIMATED SEDIMENTATION LAGOON INROW
YEAR 35
Ref Code Source (ha) CN mm m3x I 03 Runoif
Area Runoff Curve Mean Annual Runoff IO Yr 24 Hr
m3 x 103
S I Houth Meadows Waste Dump
Unstripped land below diversion drains 67
Prestripped land 0 Active Waste Dump 25
Reclaimed Dump I30
S2 Slide Area Runoff I20
S3 Runoff from Pit Surficials I IO
S4 Ground Water Seepage from Pit Surficials NIA
S5 North Valley Services Area
Buildings, Pavement 20 Open Area I 90
70
90 -
80
65
90
NIA
98 80
50 33
50 0 50 0 50 65
50 60
80 88
NIA I07
50 IO 50 95
Total 458
0.9
0 0
7.5
10.2
16.5
0.3
5.8
11.0
52.2
NOTE: Runoff Curve Numbers should be updated in the early stages of mine development.

5 - IO
3 hours. The resulting ou.tflow hydrograph i s based on the lagoon
charocteristics. The primary lclgoon is allowed t o fluctuate 4 m at the design
1000 year outflow, while the secondary lagoon i s ollowed to fluctuate 2 m.
In Figure 5.1 the effects of ccmntrolling the discharge of the primary pond are
shown. With an available variable storage.depth of 4 m, it would be possible to
store much of the peak flow within the primary lagoon. The examples shown
give the range between the situlItians of:
I ) No flow control - all flow goes through emergency spillway, which is sized
to pass the 1000 year flood at 4 m head.
2) Decant towers control flour such that the IO year peak runoff (from Figure
3-1 : 5.2 m3/s) is passed when the pond i s at 4 rn head.
The secondary lagoons would receive the water from the primary lagoon and
route it through the spillway with little modification, because the hydrograph
was based on a discharge curve of a broad crested weir passing the 1000 year
flood at a head of 2 metres. Additional storage could be provided by using a
compound weir section, but this detail would be left to final design.
The mean annua'l discharge hydrograph i s shown an Figure 5-2. This is based on
the variable inflow from surfac,? runoff and the nearly constant supply from the
groundwater collection system:;. The surface water inflow is based on the
annual runoff of the spring thaw as being between 50 and 80 mm, depending on
surface conditions. It i s expec.ted thot about 20 percent of this runoff would
occur in March, 70 percent in April and IO percent in May. After April, most
of the snow would be gone from the lower valley, although the flood peak of
Hat Creek would not occur until early June. Surface runoff is expected to be
negligible in the average summer and winter, but 10 percent runoff from the
mixed rain and snow of October and November has been allowed.

.c
5.2.5 Water Quality
rn The water quality of the discharge has been estimated by Beak Consultant:;
using Table 3-1 and the flow data. Three situations have been analyzed to
provide a range of typical ef.fluent types, as shown in Tables 5-7, 5-8 and 5-5) and discussed below.
I )
I
Table 5-7 - Dry Weather - Case I
This table describes the quality parameters when Hat Creek flows are at (1
minimum and the lagoon flow is steady from groundwater. There would be (1
marginal increase in most water quality parameters in Hat Creek after mixing
.I
m
I
of the Sedimentation lagoorl effluent, but the effluent meets all Waste
Management Branch Guidelines.
n Table 5-8 - Spring Runoff - Case II
This table describes the water quality parameters when the sedimentation
lagoon flow is dominated by collected surface runoff in April. Hat Creek itself
would be rising, but below i t s peak. An increase in all parameters, but within
the guidelines, could be expected.
I Table 5-9 - Summer Rainstorm - Case 111
m
m
a
This table describes the parameters when a localized storm affects the mine
area but not the rest of Hat Creek Valley. High surface runoffs can be
expected, discharging into relatively low Hat Creek flows. Most parameters
would be elevated in concentration, especially iron and copper, but woulcl
remain within the discharge guidelines. However, there is a possibility that
capper would exceed the upper limit of the guidelines range.
Conclusion
It is concluded that the sedimentation lagoon discharge will not alter the
background levels of Hat Cre(?k sufficiently to raise any parameter, includinq
toxic chemicals, above the Effluent Discharge Guidelines for the Mining
Industry (BC Ministry of Envir$mment, 1979).

5 - 12 .II
TABLE 5 - 7
n PROJECTED QUALITY OF LAGOON DISCHARGE AND HAT CREEK - CASE I*
Projected - - .. North Existing Projected
Lagcon Effluent Hat Creek Hat Cretk Parameter (mg/l)
I -
pH (units) Filterable Residue Non-Filterable Residue TOC Total Hardness (as CaCO3)
Chloride Fluoride
Phosphorous (P) Sulfate Arsenic
Cadmium Calcium (as CaC03)
1 Chromium Copper Iron
m Alkalinity (as CaC03)
I Total Nitrogen (N)
" Boron
e Lead Magnesium (as CaC03) Mercurv Sodium
..
* Vanadium Zinc
350 7.9
**50 21
12 14 :270
3 0.2
<I 0.4 <: 0.03
52 <: 0.005 <: 0.10 <: 0.005
I48 <: 0.01 <: 0.005 <: 0.025 <: 0.010
66 <: 0.0003
<' 0.005 39
<: 0.03
8.4
6 9
224 226
342
0. I6 1 . 1
0.24 0.043
< 0.005 54
< 0.10 < 0.005
< 0.005 < 0.10
< 0.026 0.010
I43
77 < 0.0004
< 0.005 20
< 0.007
342 0.4
7 9.3
224 227
I .2 0. I6 < 0.24 < 0.043
54
< 0.10 < O.OO!j
< O.OO!j
< 0.01 < O.OO!j < 0.026 < O.OI0
I43
77 < 0.004
< O.OO!j 21
< 0.0013
Dry Weather Condition (Year 35). The only discharge to Hat Creek via the sedimentation laaoons is the aroundwater flows from the Di t surficials. Hat Creek ., discharge was assumed to be 0.1 2 m3/s.
I mg/l. Therefore it has been assum#-d that the middle of the range (50 mg/l) will be
.I (Source Beak)
** The non-filterable residue level of :.he WMB Guidelines is given as a range of 25 - '75
attained by the lagoons performance.

5 - 13 #
TABLE 5 - 8
m PROJECTED QUALITY OF LAGOON DISCHARGE AND HAT CREEK - CASE I I *
.. Parameter (mg/l)
Projected North Existing Projected
Lagoon Effluent Hat Creek Hot creek
pH (units) Filterable Residue Non-Filterable Residue TOC Total Hardness (as CaC03) Alkalinity (as CaC03) Chloride
Total Nitrogen (N) Fluoride
Phosphorous (P) Sulfate
Boron Arsenic
Calcium (as CaC03) Cadmium
Chromium Copper
Lead Iron
Magnesium (as CaC03) Mercury Sodium Vanadium Zinc
487 8.3
**so 15
223 233
6 0. I5
-= 0.8 < 0.07
14 -= 0.013 -= 0. IO
0.005 I38
-= 0.186 0.024
0. I74 -= 0.01
< 0.0005
-= 0.006 -= 0.026
81
27
8.4 342
12 9
224 226
1 . 1 0. I6
0.043 0.24
54 < 0.005 < 0. IO .= 0.005 I43 <0.010 ~ 0 . 0 0 5 -= 0.026 -= 0.010
-= 0.0004
-= 0.005 .= 0.007
77
20
8.4 367
19 IO
224 227
2.0 0.16
K 0.34 0.048
G0.006
K 0.005 -= 0. IO
142
.= 0.037 "0.012
.= 0.052 -E 0.01
58
78
21 0.0004
.z 0.005 "= 0.010
Sprinq Runoff Condition (Year 35). Discharges to Hot Creek via the sedimentalion lagoon include prorated mean suFface runoffs and groundwater flows. Hat CrJxk
I (discharge was assumed to be 0.48 m3/sec.
** The non-filterable residue level of the WMB Guidelines is given as o range of 25 - 75 a mg/l. Therefore it has been assulned that the middle of the range (50 mg/l) will be
attained by the lagoons performance.
(Source Beak)

5 - 14
.I
1ABLE 5 - 9
PROJECTED QUALITY OF LAGOON DISCHARGE AND HAT CREEK - CASE 111' I
- - Projected
rn North Existing Projected Parameter (mg/l) Lagloon Effluent Hat Creek Hat Creek
pH (units) Filterable Residue Non-Filterable Residue TOC Total Hardness (as CaCO3) Alkalinity (as CaC03) Chloride
Total Nitrogen (N) Fluoride
Phosphorous (P) Sulfate
Boron Arsenic
Cadmium Calcium (as CaC03) Chromium Copper Iron Lead Magnesium (as CaC03) Mercury Sodium Vanadium Zinc
579 8.3
**50 19
222 200
7.0
< I .20 0. I4
co.10
< 0.020
10.004 < 0.09
91
I33 < 0.036 < 0.34 (0.30 (0.01
< 0.0006
< 0.006 < 0.041
86
31
342 95
9 2 24 226
8.4
0.16 1 . 1
0.24
54 0.043
< 0.005 < 0. IO < 0.005 I43 < 0.010 < 0.005 < 0.026 < 0.010
77 < 0.0004 20
< 0.005 e 0.007
418 81
8.4
12 223 218
3.0 0. I!;
< 0.5li
."
e 0.06
< O.O' i0
< 0.005 < 0. IO
140 < 0.018 (0.112 (0.11 e 0.01
< 0.0005
-= 0.005 e 0.02
66
80
24
ponds include surface runoff caused by a IO year return period, 24 hour rainfall of Summer Rainstorm Condition (Year 35). Discharges to Hat Creek via sedimentation
35 mm and round water flows from pit surficials. Hat Creek discharge was assumed to be 1.68 m 3 /sec. The projected outflow hydrographs are shown on Figure 5-1.
The non-filterable residue level of the WMB Guidelines is given as a range of 25 - 75 mgh. Therefore it has been assumed that the middle of the range (50 mg/l) will be attained by the lagoons performance.
**
(Source Beak)

5 - IS I
5.2.6 Operation
Operation of the sedimentation lagoons would require attention to ensure tha?
the control works remained clear and that the water quality of the discharge
was maintained. Addition of coagulant might be required as well as pH control,
and these factors could change on a daily basis. Routine structure checks would
need to be made on the lagoon embankments and control works.
The most uncertain part of the: lagoon operation would be the sediment removal
frequency. Previous studies for coal mining operations (EPA, 1976; Steele,,
1976; James, 1977) give a wide range of values for the sediment carried by
runoff. Variations would exist with the rainfall of the site, surface condition
(road, waste dump etc), slope and geology. In the drainage study for the!
2240 MW Scheme (CMJV, 1975’) a value of 17 tonnes/km2/year was given as the:
residual sediment load (after :sedimentation) for the entire mine development.,
A t an 80 percent removal effkiency, four times this value would be retained irl
the settling ponds. However 17 tonnedkm 2/year at an average 50 mm annual
runoff produces a concentration of 340 mg/l suspended solids which exceeds the:
guidelines. Accordingly 100 percent removal will be assumed, so that sediment
accumulations will amount to 272 m3/year from the 7.7 km2 of mine area.
(Sediment density assumed at 2.4 tonnes/m3).
If the predicted sediment accumulation rate was not exceeded, a total of 9500 m3 would be stored by the end of Year 35, to an average depth of 0.14 m in the
ponds. This amount of sediment would be easily retained, however experience
ot other mine sites would sugqest much higher accumulations. Until the rates
of sediment accumulation can be verified, provision should be made to clean out
the sedimentation lagoons a t intervals of about I - 2 years. - 5.3 LEACHATE LAGOON - 5.3. I General
The leachate lagoon is the intermediate element of the zero discharge system,
holding water high in dissoived solids until i t could be disposed of by

5 - 1 6
m
5.3.2
I
I
1)
evaporation at the mine site. Water sources to the lagoon include in-pit coal
and rock leachate, Houth Meadows Waste Dump leachate, coal blending are(]
runoff, coal dump station runoff, levelled waste dump runoff, vehicle washdown
water and sewage effluent. The water collection systems are described in
Section 4.3.
The leachate lagoon would be located roughly midway between the north p i i
rim, the maintenance area, the Houth embankment and Highway 12. The Ha i
Creek diversion would pass just above the leachate lagoon level on the easi
side, as described in the Hat Creek Diverson Study (Golder Associates, 1982).
Unlike the proposal in the previous drainage study, (CMJV, 1979), the leachate
lagoon would be constructed tcl i t s ultimate capacity at the start of the project.
In the early years, the pit and waste dumps would be relatively small, hence the
flow to the lagoon and the required lagoon storage would be small. However by
Year 5 a significant amount of the pit surface is cool and the runoff could be
appreciable. The total leachate flow would only increase by 35 percent from
Year 5 to Year 35.
The governing criteria for lagoon sizing is the required storage which would be
necessary because the peak runaff precedes the peak demand for water by the
dust control system. The value of the storage in year 35 i s determined from the
hydrographs on Figure 5-3. These hydrographs present the mean and "extreme"
monthly flows as determined for the system on Table 3-7. It is assumed that
the groundwater flow is constmt, but that flow originating from surface areas
varies with the seasons. Mean runoffs of 80 mm are assumed to be distributed
with 20 percent of the flow in March, 70 percent in April and IO percent in May
to correspond with the lower valley snowmelt pattern. A further IO percent of
the mixed rain and snow falling in October and November i s assumed to run off
based on the range of previously established runoff coefficients (Beak 1975).

5 - I 7 .I:
5.3.3
I
L
m
ff
Hydroqraphs
The hydrograph analysis results in a peak storage volume of 361,000 m3 irl
Year 5, 490,000 m3 in Year 15 and 458,000 m3 in Year 35. The increase irI
storage is only 35 percent from Year 5 to Year 15, hence it i s suggested thai
the logoon be built to i t s maximum expected capacity at the start of the:
project. There is some uncertainty in the flaws at the present stage o i
development, so a possible increase in copacity should be provided for.
Table 5-10 also indicates that in Year 5, with 20% below normal rainfall, there
could be a deficit for dust control activities. This amount could be made up by
odding water from the sedimentation lagoon. In Year 5 with an extreme flow,
up to 261,000 m3 of excess water would be sprayed on the Houth Meadow:;
waste dump, representing an average land use of 104 ha. The land use would
range from 38 ha to 147 ha for the mean and extreme flows of Year 35.
I 5.3.4 Construction
The logoon would be constructed partially by excavation and partially of
embankment construction. Simde slopes in cut and fill would be at 3 horizontal
to I vertical. To minimize leakage, the entire pond would be lined with an
impervious membrane; potential seepage would be monitored. The initial size
would be 300 m x 300 m x 5 rn deep, with a provision for expansion in depth to
IO rn. A freeboard of 2 m woLlId be provided.
There are several safety features inherent in the system. The pond itself i:;
oversized and capable of expctnsion. Much of the inflow results from pumped
water from the lower levels of the pit; a limited amount of excess runoff could
therefore be stored within the: pit. Finally there is provision for an emergency
overflow spillway which would return water to the pit for storage and eventual
pumping. The desirability and practicability of this feature would need to be
assessed during the early phases of operation when the designs and hydrological
data have been refined.

5 - 1 8
5.3.5 Disposal System
Disposal of the leachate would be by evaporation during the months of May
through September. The dispclsal areas and amounts of water used in this way
have been shown in Table 3-9. A water balance for the leachate system is
shown in Table 5-10. The water for dust control would be piped to the coo,!
blending area, but disposal of water for dust control on mine roads would be by
truck. Several small reservoirs and filling stations would be required. The:
water for spray evaporation would be piped to Houth Meadows, but the systerr
might not need to be installed in the early years as there would be insufficienl
water available, except in extreme inflow years. The distribution of
evaporative flows i s based on monthly potential evapotranspiration calculated
by Environment Canada. The pump capacity for the lagoon discharge would be
based on three times the maximum monthly outflow, and would be increaseci
from 140 I/s in Year 5 to about 180 Us in Year 15.
5.3.6 Operation m
Maintenance o f - the system would be relatively simple involving annual
inspection of the lining and routine pump overhaul. Sediment removal might be
required every few years as the annual sediment load from active surface areas
could be excessive, depending on the erosion rate. The only potential conflict in the system would arise when spray evaporation was required at the waste
dump. Water should be kept away from the waste placement operation, but
considering the size of the dump area and the seasonal nature of spray
m evaporation, it is considered ?hat there is sufficient space to separate these
activities.
U 5.4 SEWAGE
Sewage wastes in the pit area include the effluent from the mine maintenance
area, but the effluent from the power plant itself and other smaller facilities
would be treated separately and are not included here. In previous studies there
have been different recommendations for the sewage disposal system. The first
study (CMJV 1979) recommended that the effluent be treoted in a sewage
treatment plant prior to disch'mge to the leachate lagoon and eventual use in

D e I I 1 1 I I 1 I I I I I I I a e 1
TABLE 5 - I O 5 - 19
ANNUAL WATER BALANCE FOR LEACHATE SYSTEM
Reference YEAR 5 YEAR 15 YEAR 35 Code m3 x 103 m3 x 103 m3 x 103
Mwn Extreme Extreme Mean Extreme Inflow
Z I Coal Blending Area 12.0 24.0 12.0 24.0 12.0 24.0
22 Coal Dump Station 8.0 16.0 8.0 16.0 8.0 16.0
23 Runoff from Pit coal and other leachate I44 288 I92 384 200 400
2 4 Groundwater Seepage from pi t
coal and other bedrock 0.2 0.2 0.1 0.7 5.4 5.4 25 Vehicle Washdown Water 7.3 7.3 7.3 7.3 5.8 5.8 28 Houth Meadows Waste Dump
leachate 3.8 3.8 6.0 6.0 12.3 12.3 29 Houth Meadows Levelled
Waste Runoff 210
52 I04 87 I 74 54 I08 Sanitary Effluent 22 22 22 22 22 22
TOTAL
27
Outflow 26 Dust Control
Coal Blending Area Roads
Coal Dump Station Net Pond Loss Other (Spray Loss)
Spray Evaporation Houth Meadows (Required Volume) U-..IL hA"> ^ In-&"*:-, 11-0 \ I IUUIII I.IS""VWJ ,t " 1 5 1 1 1 1 " I "UI"II1C,
249
78
40 60
I I 15
-3,- LOL
45
465
78
40 60
I I 15
26 I -I,? LOL
335
90
40 60
I I 15
634
90
40 60
I I 15
418 ,. 37 LtJ I
3 19.5
96 60 40 II I 5
97.5 coc , ,A
593.5
96
40 60
I I 15
37 I .5 coc A,>
TOTAL 466 466 653 653 817 817
Extreme flows based on 2 x mean annual flow. All flows to be confirmed following field investigation.

5.5 II
5 - 20
dust control. The second study (R D Lewis, 1980) recommended treatment in a facultative lagoon followed by discharge to the leachate lagoon. Chlorination of the combined effluent prior to road discharge for dust control as well as screening of the spray irrigation area (waste dump) were also advised .in the Lewis study.
In reviewing the sewage disposal options another system is also considered to be feasible, that of using the lagoon and exfiltration basins proposed for the construction camp on a permanent basis. Mine operations would produce much less effluent than the construction camp system was designed for, hence the effluent could be easily treated. The remoteness of the site from the mine maintenance area would mean about 1.5 km of pumped discharge line would be required.
The sewage treatment system recommended in this report is similar to the second scheme proposed (R 13 Lewis 1980). The effluent from the mine maintenance area could be treated in a facultative lagoon with provision for aeration. A lagoon size of 630 m3 could be provided to ensure 7 day retention
and 2 days of reserve storage ot a depth of 5 - 6 m. Aeration would be added i f odours became a problem. From the treatment lagoon, the effluent would pass through a chlorination tank to provide 30 minutes of contact time and a I mg/l chlorine residual prior to disc:harge to the leachate lagoon. Storage in the leachate lagoon would be at least 3 months before the effluent was used for dust control. Testing of the leachate, prior to disposal in t h e early stages of
the mine (when the sewage c(xnpanent would be a t its highest fraction) could determine if further treatmeni was necessary.
ABANDONMENT
This section briefly describes the status of the waste water disposal systems af te r the projected 35 year mille life. There are two possible scenarios:
- the mine would be kept in operation after year 35 by expanding the pit; or
- t h e mine site would be tolally abandoned.

5 - 2 1
In the case of continued mine operation new sources of coal would be required. One option would be to expand the 800 MW pit towards the size of the proposed 2240 M W pit or even to exploit ihe total resource. If this were done sediment and leachate flows would increas.e, requiring expansion of the sedimentation and leachate systems to the sizes proposed for the 2240 MW scheme and beyond.
A second mining option could be to develop the No 2 Deposit south of Pit No 1 . Waste rock could be disposed in Pit No I thus precluding further development of the pit, or a separate disposal area could be construc:ted. If Pit No I were filled in, the need for the disposal sysiems would gradually diminish. If o new waste dump were constructed, separate wastewater disposal systems would need to be
Constructed and the effect on the existing system would be the some as total abandonment, described below.
If the mine site were totally abandoned, the various disposal systems could remain intact. The diversion system and perimeter drainage systems should continue to operate if they received routine maintenance.
The sediment system could continue to operate. Much of the gravity flow into it would remain unchanged, except that reclamation of the waste dump would
result in cleaner water.
The leachate system would be le f t with few sources of water. All of the inputs to the leachate system which did not require pumping would be reclaimed, while
the pumped water inputs would cease when pumping ceases. The sewage flow into the lagoon would also be elirninated.
The components of the flow to the leachate ond sedimentation systems which
were pumped from the lower pit would no longer be a part of any treatment system, but ground water seepage would continue to infiltrate into the lower pit, and runoff would continue l o accumulate. The runoff and seepage would continue to f i l l the pit unt i l a balance is made with the annual evaporation, or
the pit fills to overflowing and returns water to the original Hat Creek channel.

6 - I L 6 .
.. 6 . I
.. I
II
w
- 6.2
IMPLEMENTATION
STAGES OF MINE DEVELOPMENT
The Hat Creek 800 MW Scheme involves the development of the open pi t
gradually aver 35 years. Most of the development ubove elevation 900 m on the
east side of the pit would be completed by Year !a, when the pipeline diversion
arrangement would be in i t s final location (Galder Associates, 1982). Below
elevation 900 m, and on the west side, excavalion would continue through
Year 35 and pi t benches would continue to move.
The Houth Meadows waste dump would be developed slowly in this more limited
scheme so that runoffs and seepages would increase yearly. Other mine
facilities, with the possible 'exception of the leachate and sedimentation
lagoons, would attain their final configuration in the early stages of operation,
so that their respective drainag? facilities wil l remain fixed.
STAGES OF DRAINAGE SYSTEM DEVELOPMENT
Portions of the mine drainage :system must be established early in the project
life, as there is sediment laden water to collect. as soon as any excavation
proceeds. It might be necessary to install some dewatering wells around the
east pit perimeter prior to excavation, to reduce excess pore pressure. There is also perimeter drainage to intercept to prevent excess runoff into the
excavation. Most other draina'ge systems would have to be established before
cool mining began.
The following facilities WOUM have to be constructed at each stage of
development:
I. Preliminary Development
w
- Major tributary creek diversions
- Hat Creek Diversion

6 - 2
- Pit Perimeter Diversion Drains
- Leachate Lagoon - Mine Maintenance sewage treatment - Sedimentation lagoons - Pit Slope Drains and Dewatering (First Stage) - Dust control for roads
2. Prior to coal being mined and stored, and shortly after the waste dump is 1 used:
- Leachate collection drains (First Stage) - Coal blending drains - Houth Meadows waste dlJmp runoff drains
I 3. During mining:
.I - Relocation and lengthening of pit bench drains - Groundwater drain development
- Pit pumping system expclnsion and possible relocation - Of the various drainage systems used, the ones involving pit slope drains for .. leachate and sediment quality water would require the most careful planning
* change continuously as excavation proceeds. The design parameters olso
and design, because they would be part of a movable system which would
require verification in some cases.
.I
6.3 MONITORING
1.. Much of the drainage design information in this report and in previous reports is based on the Hat Creek Regional hydrology and on preliminary estimates of runoff and sediment yields from other mining operations, not necessarily similar to Hut Creek. It is felt that the regional hydrologic information for Hat Creek
1
1 is adequate for preliminary desiqn, but the smaller basins would require more on
site information.
I)

6 - 3
I
I
I
w
0
In the pre-development stage, several monitoring programmes should be
maintained. To assist in obtgining adequate peak discharge values to size the
collection systems, intensity duration frequency (IDF) curves would be required.
Rainfall intensity measuring equipment should therefore be maintained in the Hat Creek valley.
To expand the data base i t i s recommended that stream flow monitoring
continue, as well as additiont~l hydrologic measurements from small low level
basins. Information would include mean flows, peak flows, monthly flow
distribution and snowpack. This would assist in design of the collection systems
and sizing of the lagoons.
In the pre-development year:;, i t would also be desiroble to obtain some peak runoff figures from pit benches similar to those at Hot Creek. Also desirable
would be improved values for sediment yield.
During mine development several monitoring programmes should continue.
Particularly groundwater flows should be monitored carefully and compared to
the capacity of the zero discharge leachate system. The slide area would be
monitored to see i f addition111 stablization measures are required, such as the
drainage of Finney Lake.
Stream flow and rainfall information should continue to be collected to be used in drainage design os the pit expands.
We thank you for the opportunity of carrying out this interesting study.
Yours truly COLDER ASSOCIATES
G E RAWLINGS, P ENG

*
m 7.
a
REFERENCES
BEAK CONSULTANTS LIMITEiD, 1978, Hat Creek Project Water Resources Subgroup - Hydrology, Drainage, Water Quality and Use, Volume 2, Inventory Report - Final Report, June 1978.
BEAK CONSULTANTS LIMITED, 1978, Hat Creek Project Detailed Water Quality and Use, Volume 3, Impact Assessment - Final Report June 1978.
BEAK CONSULTANTS LIMITED, 1979, Hat Creek Project Detailed Environmental Studies, Water Resources Subgroup - Hydrology, Drainage Water Quality and Use, Volume 3A, Impact Assessment of the Revised Project, July 1979.
BEAK CONSULTANTS LIMITED, 1979, Hat Creek Project Detailed Environmental Studies, Water Resources Subgroup - Hydrology, Drainoge Water Quality and Use, Volume 38, Impact Assessment of the Revised Project, Flue Ga:; Desulphurization Option, May 1981.
B C HYDRO AND POWER AUTHORITY, 1978, Hat Creek Project, Diversion of Hat and Finney Creeks, Preliminary Design Report, Hydroelectric Design Division, Report No 9 13, March 1978.
B C HYDRO AND POWER AtJTHORITY, 1979, Hat Creek Project, Mining Report, 2 Volumes, Mining Department - Thermal Division, December, 1979.
B C HYDRO AND POWER AUTHORITY, 1982, Hat Creek Project, Report on 1981 Site Investigations for Hat and Finney Creek Diversion and Access Road, Hydroelectric Generation Projects Division, Report No H1478, March 1982.
B C HYDRO AND POWER AIJTHORITY, 1980, Hat Creek Project, Station Design Manual, Diversioll of Hat and Finney Creeks, Hydroelectric Design Division, February 1980.
B C MINISTRY OF ENVIRONMENT, 1980, Guidelines for the Design and Operation of Settling P'onds used for Sediment Control in Mining Operations, Preliminary Clroft, Victoria, B C
B C MINISTRY OF THE ENVIRONMENT, 1979, Pollution Control Objectives for The Mining, Smelting and Related Industries of British Columbia, Pollution Control Board, L'ictoria, B C.

CHOW, VEN TE, Editor, Mmclbook of Applied Hydrology, McGraw-Hill, Toronto, 1964.
COMINCO-MONENCO JOINT VENTURE, Hat Creek Project, Mining Feasibility Report, VolLlme IV, Section 3A, Mine Drainage, October I979 (Revision)
ENVIRONMENT CANADA, 1980, Historical Streamflow Summary, British Columbia to 1979. Water Resources Branch, Ottawa, 1980.
ENVIRONMENTAL PROTECTION AGENCY, 1976. Erosion and Sediment Control, Surface Mining in the Eastern U S, Vol I - Planning, Vol 2 - Design EPA Technology Transfer Seminar Publication.
GOLDER ASSOCIATES, 1982a, Report to 8 C Hydro and Power Authority on Hat Creek Construction 'Water Supply, April 1982.
GOLDER ASSOCIATES, I982b, Hat Creek Project - Diversion Study, Review of Alternatives, 800 MW and 2240 MW Schemes, Report No 822-15236.
GOLDER ASSOCIATES, 198:!c, Hat Creek Project - &technical and Hydrological Update, Fa1 I 1982. Report No 022- I 5248.
JAMES, I C., STEELE, T D, Julie 1977. Application of Residuals Management for Assessing Impacts of Alternative Coal-Development Plans on Regional Water Resources. Third International Hydrology Symposium. Fort Collins. Colorado.
LEWIS, R D AND ASSOCIATES LTD, Hat Creek Project - Construction Phase Sewage Treatment and Disposal, Conceptual Design Report, November 1980. (B C Hydro Environmental lmpoct Statement, Reference No 62)
MONENCO CONSULTANTS, 1977, Hat Creek Diversion Study. Report to B C Hydro and Power Authority, January 1978.
STEELE, T D September, 1976. Coal-Resource Development Alternatives, Residuals Management Innd Impacts on the Water Resources of the Yampa River Basin, Cc+lorado and Wyoming. Symposium on Water Resources and Fossil Fuel Production. Dusseldorf, Germany.

U S DEPARTMENT OF P.GRICULTURE, 1964, National Engineering Handbook Section 4, Hydrology. Soil Conservation Service Reprinted 1969.
U S DEPARTMENT OF AGRICULTURE, 1975 Urban Hydrology for Small Watersheds: Technical Release No 55 Soil Conservation Service, January 1975.

f'ICUFES
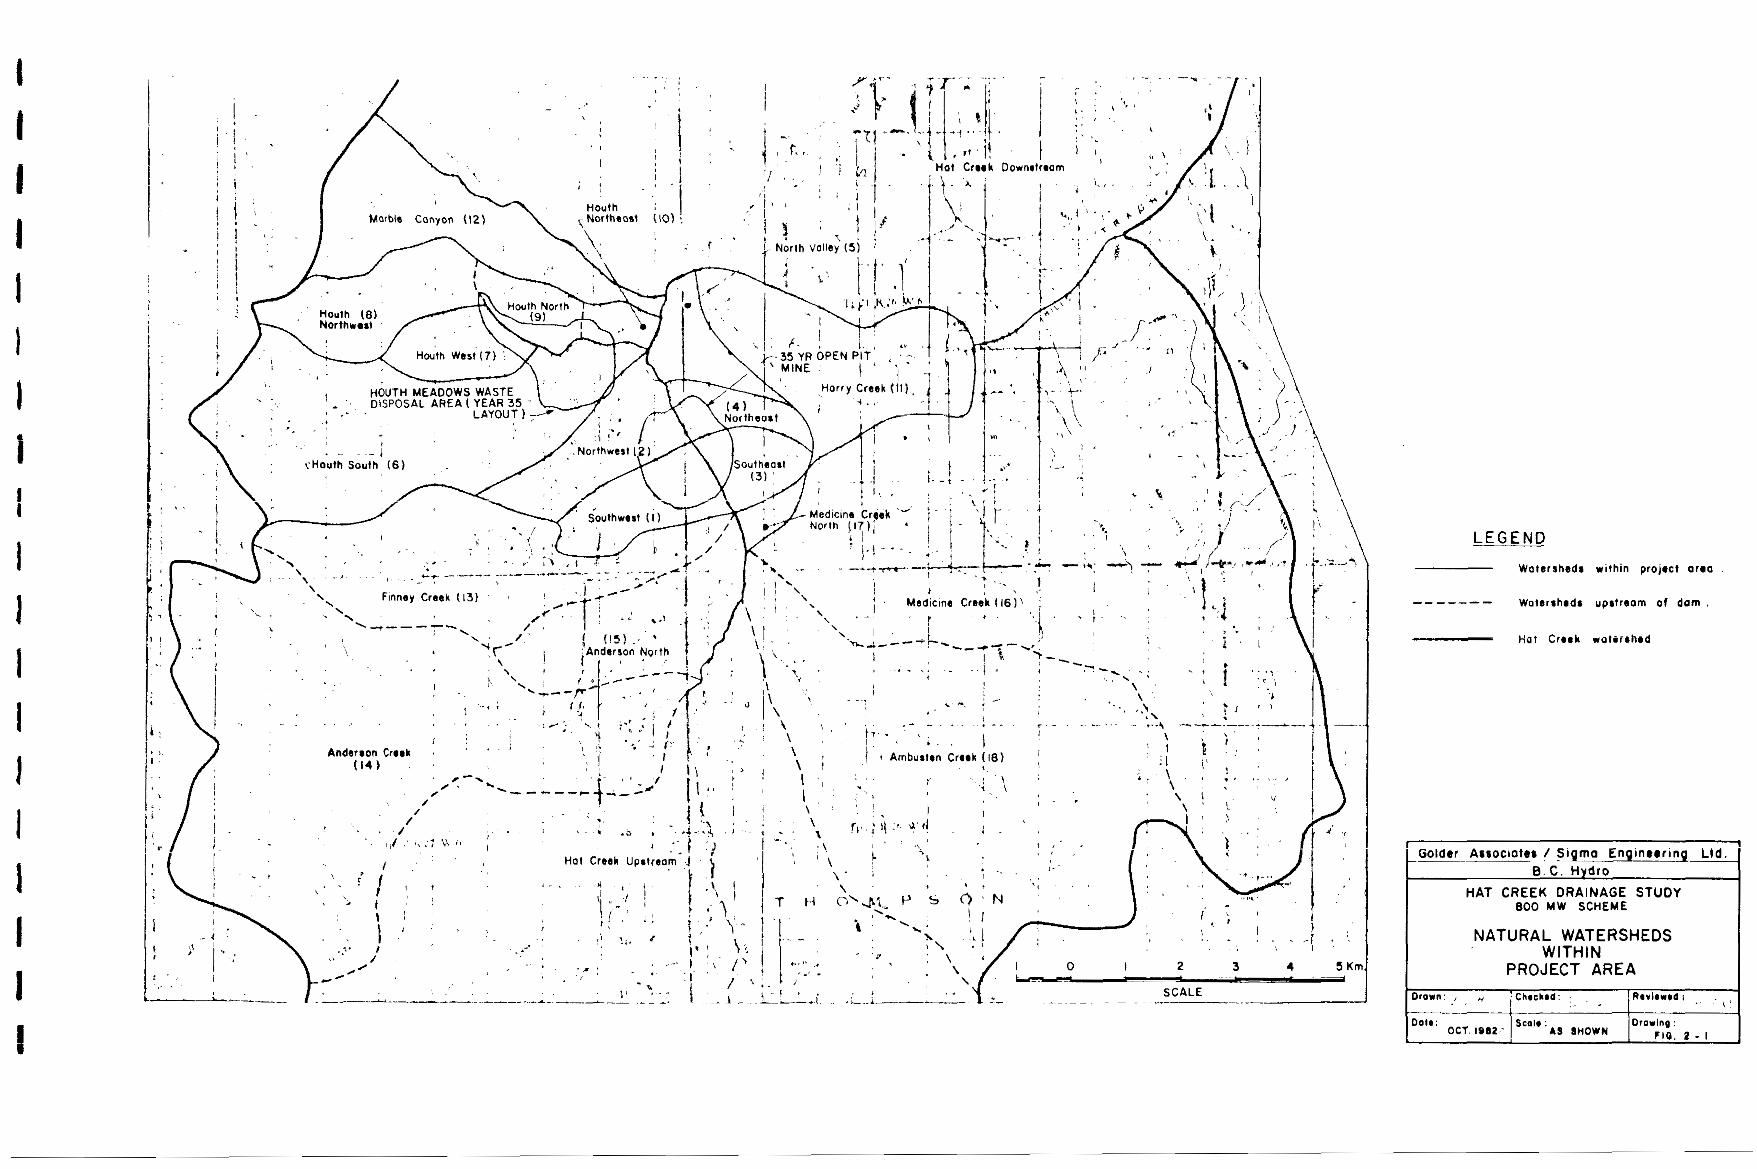
LEGEND
Watersheds within project oroa
""_" Watershods uDatreom 01 dam
i
-~ Golder Assoctoles / Sigma Enginer r in
HAT CREEK DRAINAGE STUDY 800 MW SCHEME
NATURAL WATERSHEDS WITHIN
PROJECT AREA
Dole: OCT. 1982.' AS SHOWN
Drorlng : ria. z - I

TABLE 1 - SOIL COVER COMPLEXES
CURVE NUUBERS ( C Y 1
NATIRAL WATERSHEDS - 50 - 70
REVEGETATED AREAS . m - 0 0
D U R SURFACE - 90 I S u f - e stomp nn occwnled fw 4 INm p m m l e r I PIT SLOPE - so STMIAQE YARDS . a0 PAVED AREAS - ee
1 GREATEST RAINFALL IN 24 HRS. ( m m . ~
i 'P'
I GRAPH 3 -PRECIPITATION RUNOFF CURVES
RAINFALL lmm.) 'P'
ASSUMPTIONS:
hHkl Abstrection
Ant.cedwl Mdrtur~ Condltlm AMC m
lo - 0 ,2S% P o t e n t i d Ab.!roction
0
2 GRAPH 6 - PEAK DISCHARGE CURVES - STEEP SLOPE - 16% Y 1 0 Y g c-5
E
a
k
a 0.1
: 0: 005 E
Y (I
I 0 001
0
5 E
0-005
2 001 o.oa c-I 0.a 1.0 8 10
0
5 0 1 0 0 WATERSHED AREA (Km?l 'A'
EXAMPLE CALCULATIDN
DATA :
DESIGN STORM
R.CW,."C.
Duralion
WATERSHED
AI.0
SlOP.
surroc.
CALCULATION :
( I 1 From Table I
CN - 90
(ill From Graph 2
In twvol ID Yra.
24 Hrs.
I Km?
st1.p ( I 16%)
Pi t s l o p
J.NG C h e c k e d B . ~ , ~ . R e v i e w e d G.s.,,.
ate SEP 1982 N.T.S. Figure 3 - I

GRAPH 1
MEAN ANNUAL FLOOD PEAK im3/a/.rfKm?) N QmP.
GRAPH 3 FREPUENCY AND RATIO OF ANNUAL FLOODS TO MEAN ANNUAL FLOODS
BASED ON REGIONAL DATA
REGIONAL MEAN ANNUAL FLOOD VOLUM GRAPH 2
E D
I
MEAN ANNUAL FWOO MLUME (m3/Km21 N Qmv.
- KEY WATER SURVEY OF CANADA GAUGE STATION
1 08LF056
B OBLF038
C 0 8 L F 0 6 9
D 08LGOO5
E 08LG009
F 0816014
0 08LG032
H 08LG033
J OBLGO55
"ELF?!Z
oBLFo61 Hot Creek volley
" n L
Y OBLF015 i st.tion. In
RECURRENCE INTERVAL ( In year. 1
B.C. Hvdro & Power Authority
HAT CREEK DRAINAGE STUDY
800 MW SCHEME RAIN - SNOWMELT NOMOGRAPH
'lawn J.NG
l a t e SEP 1982 lScs'e N.T.S. Flqure 3-2
Checked p . = . ~ . R e v l e w e d e,.=-M,

I I I I 1 I I I i I I I I I I I I I E
FLOOD FREQUENCY CURVES
DERIVED FROM REGIONAL DATA
HAT CREEK near
/ ;::2&YEK Y
w a 2s I / HAT CREEK near
/ / UPPER HAT CREEK ~~~ "~
: 0 201
0 15
2 1 // HAT CREEK near
I // ASHCROFT (08LF013)
0 " 1.01 I_( 2 5 10 20 50 100 200 5 0 0 1000
lo I
a 5
n
Y
W
a 4
3 ' 0
LL 2
I
MEDICINE CREEK at MOUTH (61 km2)
ASH DUMP AXIS 3 MEDICINE CREEK at
(43km2)
(34 km2) AMBUSTEN CREEK
"I 1.1 _. . .
FINNEY CREEK (12.5 km2 1
HARRYCREEK (9.7 km2)
I L 5 ." " f" !e" LOO _I" Lnn .""- *"" ,^ "
RECURRENCE INTERVAL (in years)
NOTE : CURVES SHOWN ARE FOR ANNUAL SNOWMELT FLOODS
MONTHLY FLOW IN HAT CREEK JUST ABOVE THE MINE SITE
- Maximum daily recorded in month
Meon monthly maximum - ""_ - Mean monthly
15- "_ Mean monthly minimum - M i n i m u m daily r e c o r d e d in month
GAUGE STATION O(ILFO61 HAT CREEK NEAR UPPER HAT CREEK BASED ON FLOW RECORD 1960-1975
SOURCE! YONENCO 119771
u e
W c3 a a
. \ \
JAN ' FEB ' MAR ' APR ' MAY JUN ' JUL ' AUG I SEP ' OCT NOV DEC I
Golder Associates / S i g m a E n a i n e e r i n a Ltd B . C . H y d r o
HAT CREEK DRAINAGE STUDY 800 MW SCHEME
S T R E A M F L O W D A T A
IRAWN:
1ATE:October 198 I S C A L E : N.T.S. I FIGURE : 3-3'
CHECKED: B.p.c. REVIEWED: 6.5.M.

WATERSHED YIELD - 800 MW SCHEME Figure 3;-4
0 $00 ZOO 300 400 M O
ACTUAL EVAPOTRANSPIRATION (mm)
L E G E N D 0 1OOnn SOIL SSORA6E
20Ons SOlL STORLIOE
H!NE SlTF. ELEVATION I".".
sourc.: -a* ,918
Golder AssociatesISigma Engineering Ltd - n80
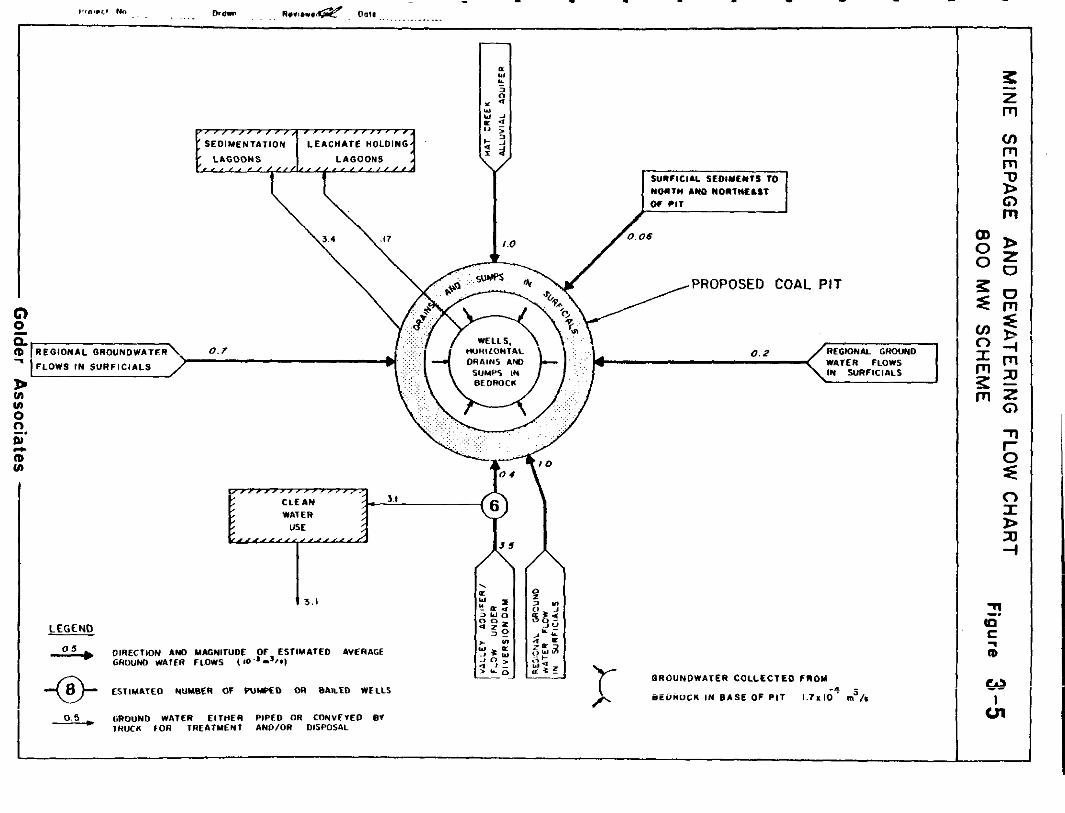
w U A m . l
SUWICIAL SEOIYENIS TO NOITU bN0 NOITliELST
PROPOSED COAL PIT
0
a (p REGIONAL GROUNOWATER\ 0. I
P
0 - 7
FLOWS IN SURFICIALS
REGIONAL GROUND WATER FLOWS IN SURFICIALS
la in 0
nl (D in
n -. -
-
I L
WAl E R
13.1
LEGEND
& DIRECTION IUD YffiUlTUDE OF ESl lYAlED AVERAGE GROUND WAlER FLOWS lO. '"f* l
LSTM&TEO NUMBER OF P U W D M( B&LED WELLS
0.5 GROUND WATER ElTflER PIPED OR CONVEYED B I - lHUC6 FOR TREATMENT AND/OR OISPDS~L
7 GROUNDWI tTER COLLCCl 'ED F R


I I I 1 I 1 I 1 1 I I i I I I
I I I


I I I I t 1 1 1 I 1 I i I I I i I I I

1 I I 1 I 1 1 I ! 1 I i 1 1 1 I I I !
-i
I I I
J COMPLEX I POTABLE
NORTH VALLEY SERVICES M E A . . I
OIVERSION
LEACHATE SYSTEM
UPPER SLIDE OIVERSION
POSSIBLE EAST PIT PERIMETER DEWATERING
. , . , . . . . . . . . . . .
"""""
SEDIMENT SYSTEM
GROUND WATER SUPPLY
FIRE PROTECTION SUPPLY
TWIN POLYETHYLENE PRESSURE P IPEL INE
FIBERGLASS REINFORCED PIPELINE
WATER SUPPLY
WATER TREATMENT PLANT
WASTE WATER TREATMENT
S e r o w treatment system) PLANT [Adopted from Construction camp
PUMP
LAGOON OR RESERVOIR
\ OIVERSION OAM AND INTAKE STRUCTURE
Omcr ileon * woter use Golder AssociateslSlgma Engineering Ltd
B.C.Hydro 8 Power Authority
FINNEY CREEK WATERSHED HAT CREEK DRAINAGE STUDY * 800 MW SCHEME
HAT CREEK UPSTREAM . MINE DRAINAGE SCHEMATIC
Drawn BCH Checked E f l . ~ . Reviewed 6 . 5 . M .
Date OCT 1982 Scale N.T.S Figure 4-5 $*SO

SEDIMENTATION LAGOONS - 800 MW 10 YEAR 24HOUR FLOOD CllSCHARGE HYDROGRAPH Figure 5-1
4.0
3.0
u
\
0 UI
n E
0
OUTFLOW FROM PRIMARY POND ( I )
SECONDARY P ~ N D ( 1 1 ~~ ~ _ ~ _ _
T I M E ( H O U R S )
I. Uncontrolled out f low from 1emergency spillway
2. Controlled outflow from decclnt tower sized to release IO year peak flow a t 4 m of storage
Golder AssociatesISigma Engineering Ltd 511e
I

6l
0 u 0 m N n
SEDIMENTATION LAGOONS - 800 MW MEAN DISCHARGE HYDROGRAPH Figure 5-2
.I3
.I2
.I I
_I 0
.09
.08
.07
.06
.05
.04
.03
.02
.o I
0 JAN FEB MAR .4PR MAY JUN JUL AUG SEP OCT NOV DEC
-
MONTH
Golder Associates/Sigma Engineering Ltd

LEACHATE SYSTEM HYDROGRAPHS - 800 MW YEiAR 35 Figure 5-3
60 C
500
a (3
a 400
E n n 30C
I 0
z a W .02 5
0
- KEY
1 ', rDUST CONTROL
0 ""_ 0 M e a n i n f l o w @ Dust control outf low @ Spray evaporation outflow
Extreme inflow
Golder Associates/Sigrna Engineering Ltd 5280
J.NO NOV 1982