gloucestershire escalation framework 2015/16
TRANSCRIPT

Gloucestershire Escalation Framework
2015/16
Maria Metherall: Senior Commissioning Manager
Urgent Care.
Presentation to the Health Overview and Scrutiny
Committee 12th January 2016
Content
• Escalation measures
• Escalation process
• Escalation level reporting
• Escalation actions
• Next steps

Escalation measures • Measures agreed for all major providers
• Measures relevant to parts of the system e.g.
Miscellaneous
Pre Hospital
In Hospital
Post Hospital
• Measures reflect both capacity and demand
• Weighted according to impact
• Use Public Health and Met Office information to inform
system preparation and response

Whole system escalation process

Step One

Miscellaneous measures Gloucestershire System Escalation Plan
Measures and monitoring
Miscellaneous
Number Type Lead KPI Green Amber Red Black Weighting
1 N/A CCGAre there adverse weather conditions or unforeseen circumstances that
are likely to affect services?0 -None
1 - Yes, with
limited
impact
anticipated
2 - Yes, with
moderate
impact
anticipated
3 - Yes, with
significant
impact
anticipated
5
2 GCS Are there staffing concerns within critical areas? 5
3 GHT Are there staffing concerns within critical areas? 5
4 SWAST Are there staffing concerns within critical areas? 5
5 IDT Are there staffing concerns within critical areas? 5
6 2G Are there staffing concerns within critical areas? 5
7 OOH Are there staffing concerns within critical areas? 5
8 111 Are there staffing concerns within critical areas? 5
100%
Threshold
Capacity1 - Yes, but
isolated
2 - Yes, but
increased
spread
across
system
3 - Yes,
entire
system
affected
0 -None

Pre hospital measures Pre-Hospital
Number Type Lead/Service KPI Green Amber Red Black Weighting
1 GCS SPCA - call volume per hour week (at the point of entry): weekday 8-9 10-12 13-14 >=15 4
2 GCS SPCA - call volume per hour week (at the point of entry): weekend 3-4 5 6 >=7 4
3 GCS Rapid Response - RAG rating (Referral rate in and numbers in service) 1 2 3 4 3
4 GCS MIIU - Patients waiting in departments at time of report: weekday <=16 17-23 24-30 >=31 1
5 GCS MIIU - Patients waiting in departments at time of report: weekend <=13 14-24 25-31 >=32 1
6 111 Abandonment rate as a % of calls <5% <8% <10% <15% 4
7 OOH Average waiting time for call back (weekend measure) <=20 mins <=60 mins 60-180 mins 180 mins plus 4
8 Primary Care Declared level of pressure
0 - No
pressure
1 - 2
localities
under
pressure
2 - 6
localities
under
pressure
3 - All
localities
under
pressure
5
9 SWAST 999 REAP level declaration 1-2 3 4-5 6 5
10 SWAST 999 Red Call Performance Percentage >76% 76->75% 75->60% <60% 4
11 SWAST 999 Green Call Performance Percentage >92% 92->90% 90->80% <80% 4
12 SWAST 999 Resource status below core output <5% 5-<10% 10-<20% >20% 5
13 SWAST 999 % calls above predicted demand<4% 4-<6% 6-<10% >10% 5
14 GCS SPCA - Abandoned call rate <5% 5-<8% 8-<12% >12% 4
15 GCS MIIU - % of patients seen within 4 hours 100% 98% 85% 75% 2
100%
Threshold
Demand
Capacity

In hospital measures In-Hospital
Number Type Lead/Service KPI Green Amber Red Black Weighting
1 GHT Number of patients waiting in department (GRH) 0-29 30-34 35-50 >50 5
2 GHT Number of patients waiting in department (CGH) 0-15 16-20 21-33 >33 5
3 GHT Longest wait to be seen (GRH) 15min 16-30min 30-60min >1hr 4
4 GHT Longest wait to be seen (CGH) 10min 11-25min 26-50min >50min 4
5 GHT Number of spaces in majors - including corridor beds (GRH) >1 1 0 -1 5
6 GHT Number of patients admitted (at time of entry since midnight) (GRH) up to 6 6-8 9-12 >12 4
7 GHT Number of patients admitted (at time of entry since midnight) (CGH) up to 3 3-5 5-8 >8 4
8 GHT Number of patients waiting over 4 hours in department (GRH) <2 <6 6-8 >8 5
9 GHT Occupancy across bed stock as a % (GRH) 85% 86-88% 89-92% >92% 5
10 GHT Total number of beds available at time of report (GRH) >10 6-10 0-5 <0 5
11 GHT Occupancy across bed stock as a % (CGH) 85% 86-88% 89-92% >92% 5
12 GHT Total number of beds available at time of report (CGH) >8 4-8 0-3 <0 5
13 GCS Total number of Community Hospital beds available >=10 6-10 0-5 <=0 3
14 GCS Total number of Reablement beds available >=8 4-8 0-3 <=0 2
15 GCS Beds closed due to Infection Control0
1 ward /
area
2-3 wards /
areas
>4 wards /
areas3
16 GCS Community Hospitals - Number of unfilled shifts (agency & bank) 1 2 3 4 3
17 SWAST 999 Handover delays since midnight (GRH) <1 1 - <2 2 - <3 >3 3
18 SWAST 999 Handover delays since midnight (CGH) <1 1 - <2 2 - <3 >3 3
19 2G Staffing within Mental Health Liaison Team. 80% 60% 50% 50% plus 2
20 2G Staffing within Crisis Team 80% 65% 50% 50% plus 2
100%
Capacity
Demand
Threshold

Post hospital measures
Post-HospitalNumber Type Lead/Service KPI Green Amber Red Black Weighting
1 GHT / GCS IDT - Number of patients in social work assessment <8 8-12 >=12 12 plus 4
2 GHT / GCS IDT - Number of patients on Medically Stable List waiting 1 days <12 13-17 >=18 18 plus 4
3 GHT / GCS IDT - Number of patients on Medically Stable List waiting 6-9 days <10 11 >=12 12 plus 4
4 GHT / GCS IDT - Number of patients on Medically Stable List waiting Total <40 40-45 45-50 50 plus 4
5 GHT / GCS IDT - Patients waiting for home based reablement <3 4 >=5 5 plus 4
6 GHT / GCS IDT - Number of patients awaiting Reablement bed <3 4 >=5 5 plus 4
7 GHT / GCS IDT - Number of patients waiting for Community hospital bed <6 7 >=8 8 plus 4
8 GCS SPCA - Number of patients on SPCA working list at time of report <15 15-20 21-30 >30 3
9 GCS SPCA - Number of patients on SPCA pending list <=10 11 12-14 >=15 3
10 GCS Number of community hospital beds available 12 plus 6-11 5-1 0 3
11 Arriva Patients booked on day waiting more than four hours for discharge 0 1-4 5-8 >8 3
100%
Capacity
Demand
Threshold
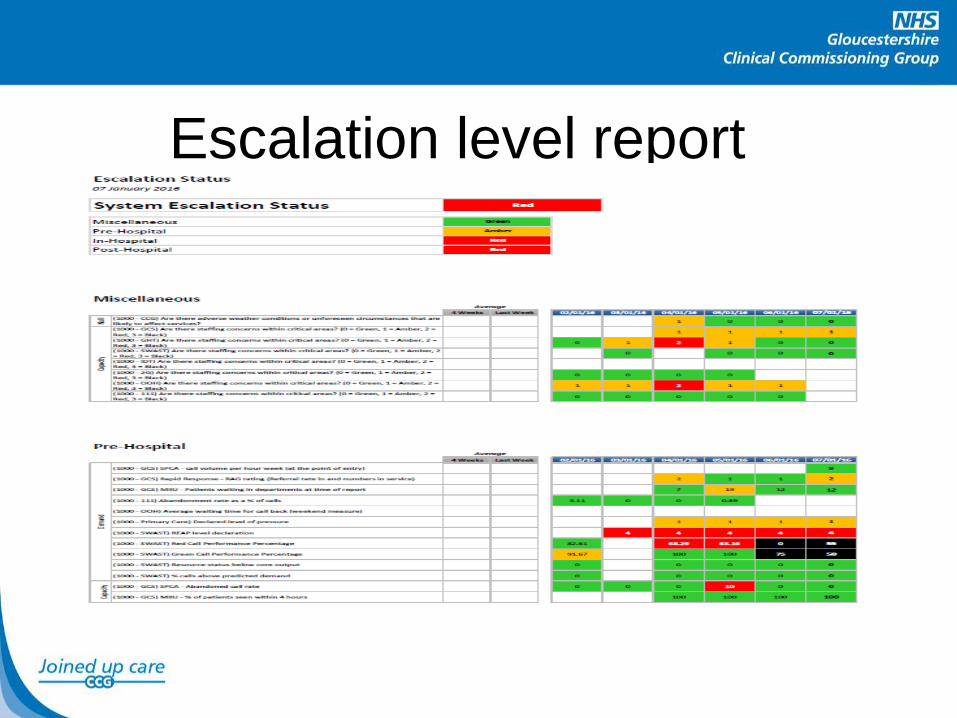
Escalation level report

Escalation level report

Step 2

Extract from escalation action cards
Number Organisation Action
1 2G
MHLT to ensure all referrals are verbally responded to within 2 hour target and subsequent
response is in keeping with level of risk identified using risk matrix
2 GHT
Chiefs of service contacted to contact all speciality Directors to do walk around of their areas
to increase discharges
3 GHT Activate redeployment plan and allocate staff to areas of greatest pressure
4 GHT Instigate RATing in ED and ACUs
5 GHT
All Matrons to attend their key areas of responsibility to ensure all escalation actions are
underway
6 GHT Senior ED Manager/Clinician to attend ED and ensure consistent and effective coordination
7 GHT
Acute physicians mobilised to review and discharge from ED and prioritise patients for
transfer to ACUs
8 SWAST 999 Undertake actions in accordance with agreed REAP level
9 2G Regardless of level of risk and within resource available will prioritise ED referrals
10 2G
MHLT manager to reallocate resources (staffing) from Community Hospital Liaison Service to
prioritise and assist with ED referrals
11 GCS Instigate temporary service closure plan
12 GCS
Instigate whole system redeployment plan in order to respond to capacity and demand
constraint
13 GCS SPCA to action no OOC repatriations and no direct admissions unless agreed by lead
14 GHT Ensure all support services (radiology etc.) continue working until activity completed
15 GHT Cancel elective activity to facilitate increasing discharges and creation of bed capacity
16 GHT All senior managers: GM and above to cancel meetings to drive operational recovery
17 GHT
Reduce clinics by 1 hour to enable medical specialities with bed shortfalls to do extra ward
rounds
18 GHT Full capacity protocol to be implemented
19 SWAST 999 Undertake actions in accordance with agreed REAP level
In-Hospital

Next Steps
• Review as part of whole system winter
review workshop
• Using data to forecast and support
proactive planning
• Primary Care
• Extended intelligence e.g. pharmacies
• Completion compliance