global&food&policy&and&food& security&symposium&series&
TRANSCRIPT

Global Food Policy and Food Security Symposium Series
China’s Agricultural Development and Policies: Are There Lessons for Africa
and Other Developing Countries? ScoC Rozelle, Helen F. Farnsworth Senior Fellow,
co-‐director, Rural EducaLon AcLon Program (REAP) Stanford University
April 17, 2013
Stanford University
Scott Rozelle, Stanford University Jikun Huang, Chinese Academy of Sciences
China’s Agricultural Development and Policies:
Are There Lessons for Africa and Other Developing Countries?

What is the ultimate goal of Development / Growth?

What is the ultimate goal of Development / Growth?
Become a modern, rich, industrialized nation

But, it starts with agriculture
Schultz / Mellor and Johnston / Others
• Agriculture provides income for farm households: – To build housing – To invest in education for kids – To finance move off the farm (and move into the city) – For starting self-employed enterprises – It is a source of demand … in the early stages of
industrialization
What has African agriculture (until recently) looked like over the past three decades?
(let’s look at some pictures of some lost decades)
Almost no agricultural growth
Almost no off-farm employment growth
Almost no income growth

Agricultural TFP
6 Five Year Periods during the Dark Decades
Accumulated Five-Year Growth Rates
decade 1 decade 2 decade 3

Agricultural TFP
6 Five Year Periods during the Dark Decades
Accumulated Five-Year Growth Rates
Almost no agricultural growth
decade 1 decade 2 decade 3
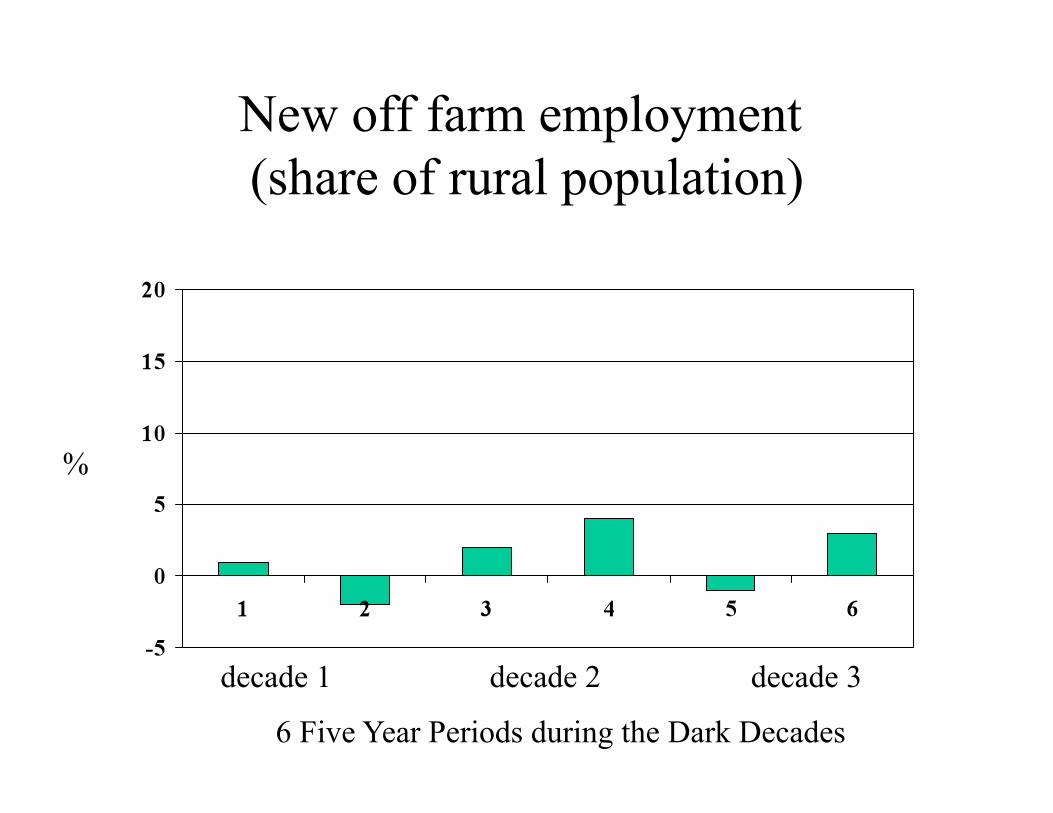
New off farm employment (share of rural population)
6 Five Year Periods during the Dark Decades
%
decade 1 decade 2 decade 3
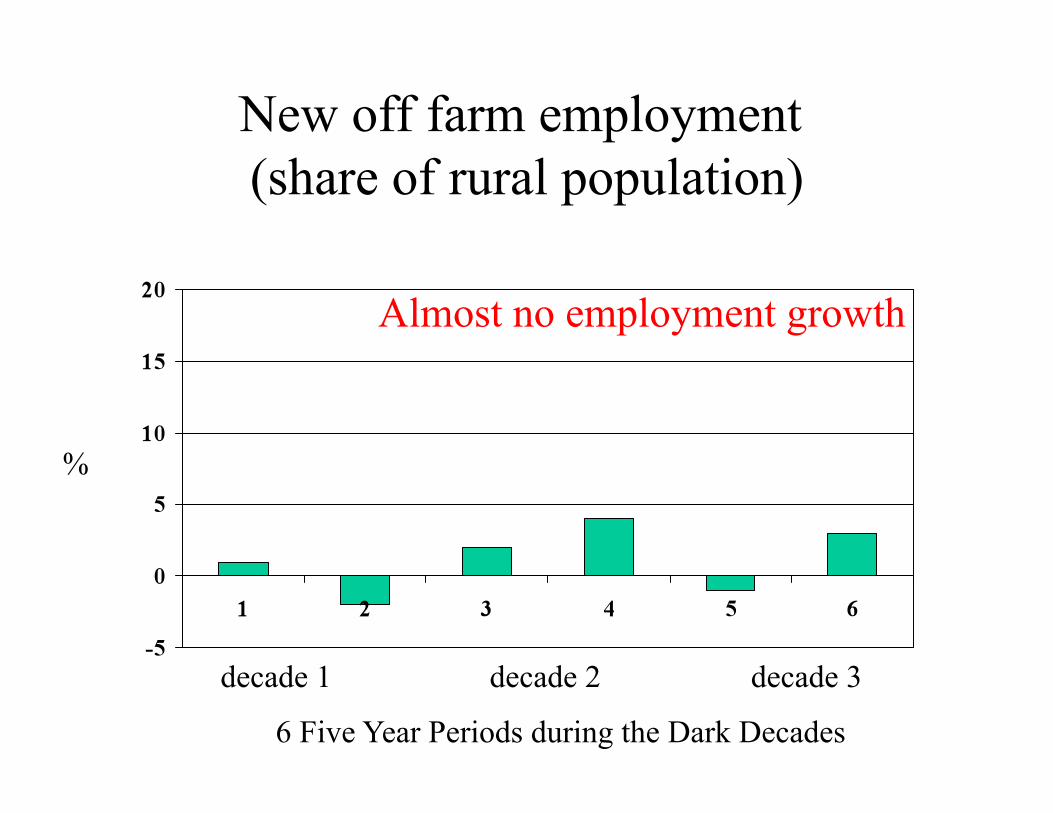
New off farm employment (share of rural population)
6 Five Year Periods during the Dark Decades
%
Almost no employment growth
decade 1 decade 2 decade 3

Annual Growth Rates Rural Income
decade 1 decade 2 decade 3

Annual Growth Rates Rural Income
decade 1 decade 2 decade 3
Almost no rural income growth
The summary of the record of these lost decades
• Almost no agricultural growth
• Almost no off-farm employment growth
• Almost no income growth

So: This is the problem that “we” (the world, the USAID’s and DFID’s, the Gates Foundations,
the African Governments
themselves, academics in the US, Africa,
elsewhere) are working on:
we want to take these anemic results and turn
them into …

… 30 years of 10% growth

Is it possible?

Accumulated Five-Year Growth Rates
Almost no agricultural growth
China’s Agricultural TFP 1950 to 1979
1950- 1955- 1960- 1965- 1970- 1975- 1954 1959 1964 1969 1974 1979
decade 1 decade 2 decade 3

%
Almost no employment growth
China’s new off farm employment (share of rural population)
1950 to 1979
1950- 1955- 1960- 1965- 1970- 1975- 1954 1959 1964 1969 1974 1979
decade 1 decade 2 decade 3

Annual Growth Rates Rural Income
Almost no rural income growth
1950s 1960s 1970s
China’s Rural Income Growth 1950 to 1979
decade 1 decade 2 decade 3

The summary of the record of China during the 1950s, 1960s and 1970s
• Almost no agricultural growth
• Almost no off-farm employment growth
• Almost no income growth
These were China’s Lost Decades

Is it possible after three decades of NO GROWTH to launch a miracle?
Of course, this is what we are hoping for in the case of Africa and other places in the developing world!

30 years of stagnation 30 years of 10% growth
Income / capita

30 years of stagnation 30 years of 10% growth
Income / capita

Today’s presentation is about how China took:
zero growth in TFP … zero transformation & zero growth in income
… and made it into what China is today …
And think about some of the lessons … if there are any … for Africa

Strategy of the Presentation
1. The Record of China’s Past
2. Driving Forces: China’s Policy Menu & Impacts
3. What China Did NOT Do – Some lessons to learn to follow – Some lessons to learn to avoid
4. Policy Lessons for Africa?

Part 1. The Record of China’s Past

Average annual growth rate (%) of agricultural GDP
Average annual growth rate in agricultural GDP was about 4 times of population growth rates.

Grain and cotton production in 1978-2008
Grain (million tons) Cotton (1000 tons)
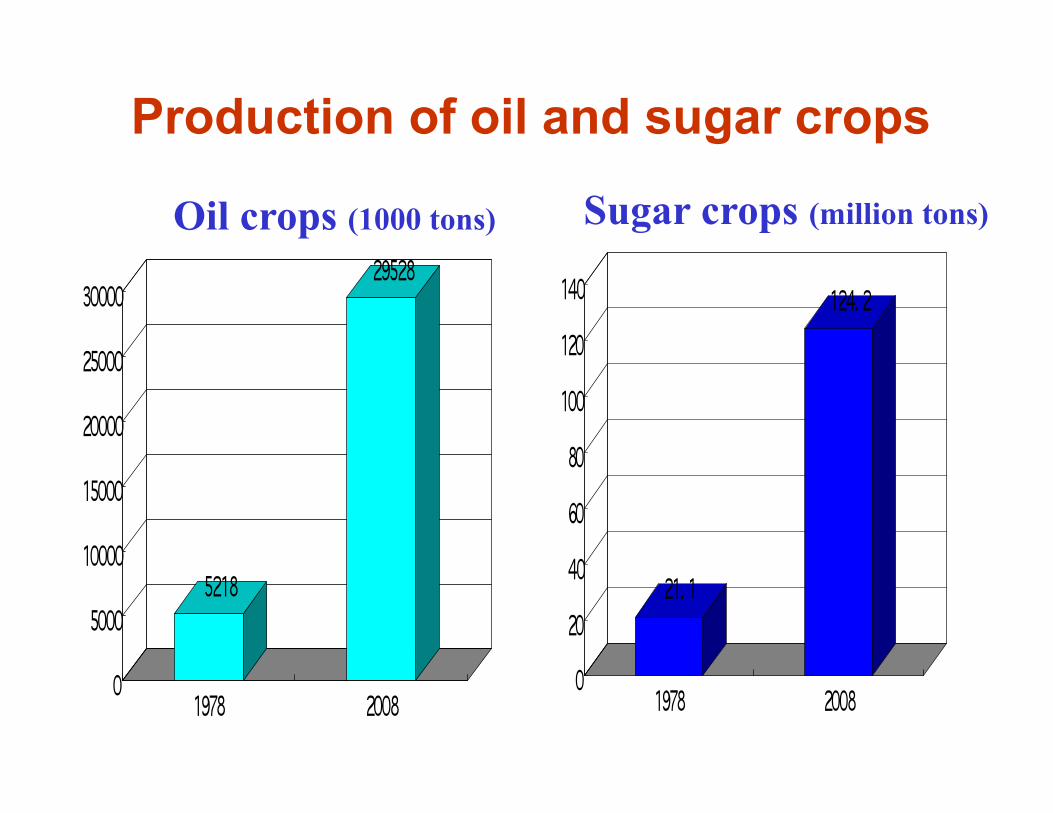
Production of oil and sugar crops
Oil crops (1000 tons) Sugar crops (million tons)

Vegetables and fruit
Vegetable area (1000 ha) Fruit outputs (million tons)

Shares of output values within agricultural sector, 1980-2005, (%)
Livestock and fishery have grown even faster…
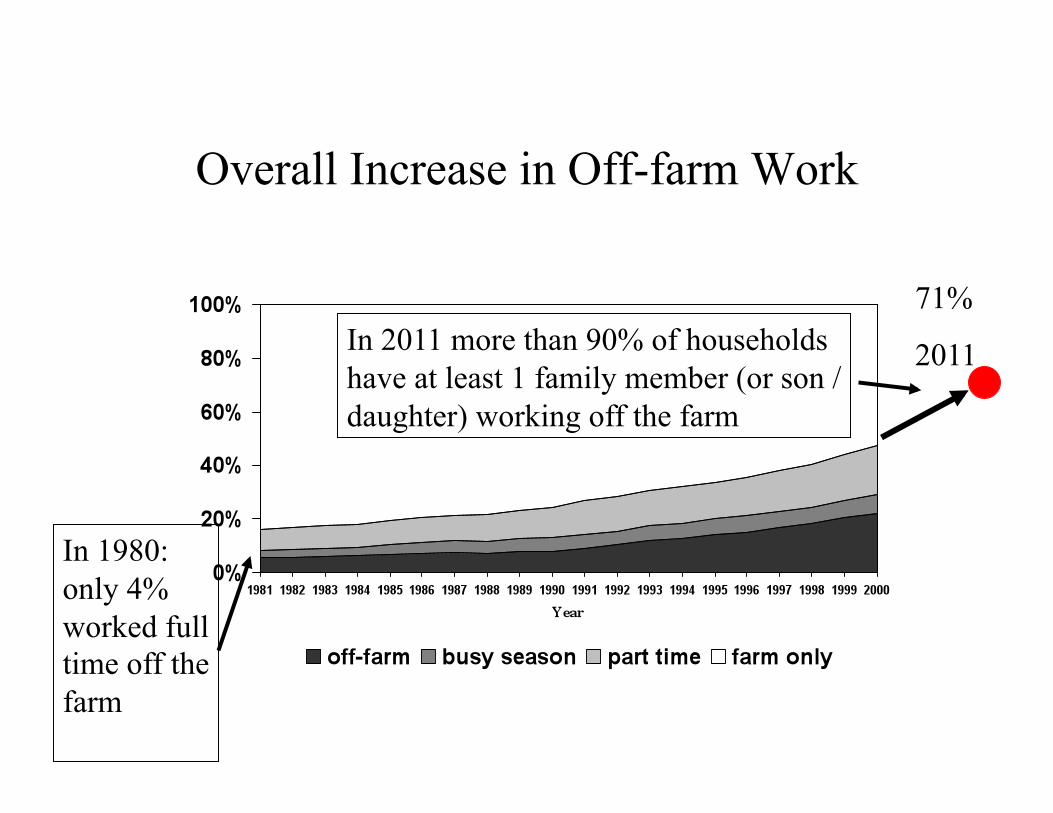
Overall Increase in Off-farm Work
In 2011 more than 90% of households have at least 1 family member (or son / daughter) working off the farm
In 1980: only 4% worked full time off the farm
71%
2011

Unskilled wage
2010
≈ $2.00 / hour in 2010
Park and Cai, 2008
Annual Real Hourly Wage (1978 dollars)
≈ 30 ¢ / hour in 1978

How Expensive are Chinese Workers? Manufacturing Wages 1994-2008 (USD/year) �
497
1180
3481
367
481
433
1075
2849
2338
4231
2018 1638
2833
0
500
1000
1500
2000
2500
3000
3500
4000
4500
1994 1996 1998 2000 2002 2004 2006 2008
China India Indonesia Philippines Thailand
Source: International Labor Organization LABORSTA Database
China
Thailand
Philippines
India Indonesia
China
Of course, as we will see later in the presentation, this also has implications for farming

Per capita income in real term (1978=100)
But, in all but the poorest households, most of the income (and most of the INCREASE in income) is coming from off farm sector

Part 2: Driving Forces: China’s Policy Menu & Impacts
• What are major driving forces of success of China’s agriculture in the past?
• What role did policy play?

• Institutional reform • Market liberalization • Investment into agricultural sector
• Irrigation • Technology • Other
Major driving forces (in past three decades—1980 to today)�

2a. Institutional reform (incentives)

Nature of Reforms (1)
1950s / 1960s / 1970s China’s Farmers in Communes … Land belongs to “others”
• 40,000 communes [before]
• 200,000,000+ million farms [after] [Every rural resident (900,000,000 of them) has land]
– Almost all farms are “family farms” – Farm size: “1 mu per person”
Decollectivization (1978 to 1984)

Performance from 1950s to 1970s
• More than 80% of population in rural sector
• Subsistence agriculture … more than 80% of rural rely fully on farming
• Undiversified agriculture: grain / grain / grain
• Although yields rose (mostly due to increasing water control … and increasing labor input into farming (more than 200 days per hectare of labor input)
Ag growth; Off-farm employment; Income/capita growth = ZERO

Nature of Reforms (1)
1950s / 1960s / 1970s China’s Farmers in Communes … Land belongs to “others”
• 40,000 communes [before]
• 200,000,000+ million farms [after] [Every rural resident (900,000,000 of them) has land]
– Almost all farms are “family farms” – Although farm size was small: “1 mu per person”
Decollectivization or HRS (1978 to 1984)
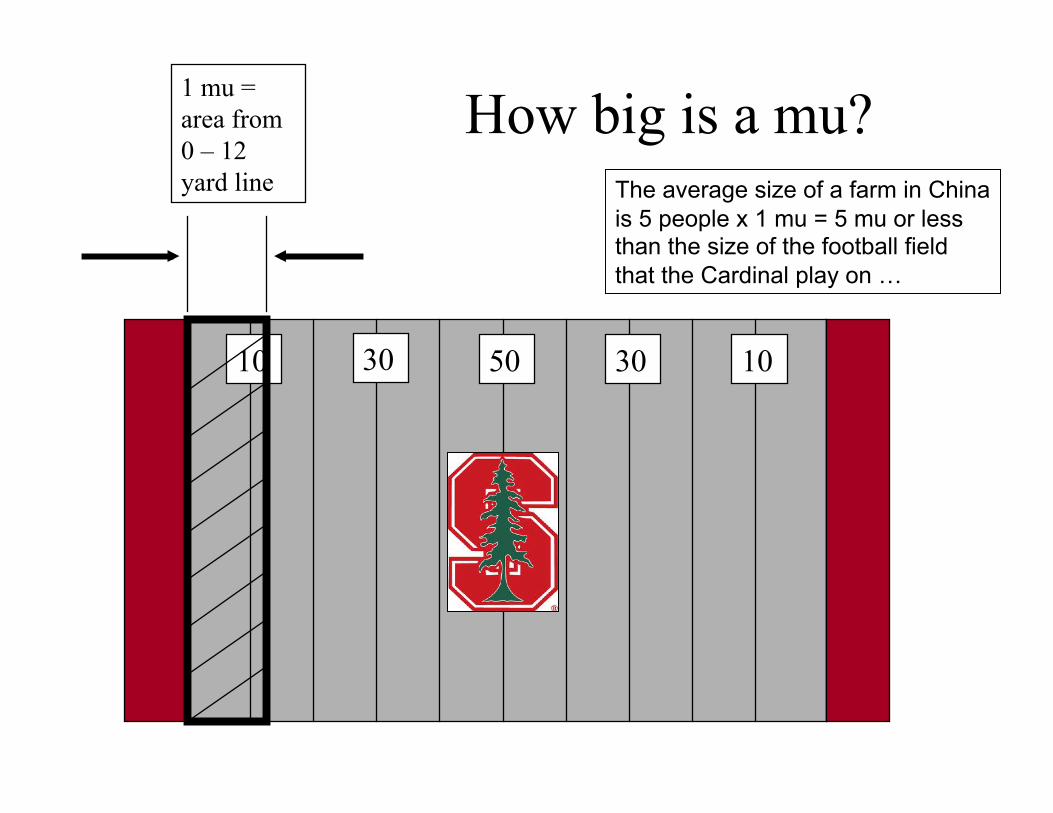
How big is a mu?
50 30 30 10 10
1 mu = area from 0 – 12 yard line The average size of a farm in China
is 5 people x 1 mu = 5 mu or less than the size of the football field that the Cardinal play on …

Nature of Reforms (1)
1950s / 1960s / 1970s China’s Farmers in Communes … Land belongs to “others”
• 40,000 communes [before]
• 200,000,000+ million farms [after] [Every rural resident (900,000,000 of them) has land]
– Almost all farms are “family farms” – Although farm size was small: “1 mu per person”
Decollectivization or HRS (1978 to 1984)
“right to choose crop + inputs”
“right to income”
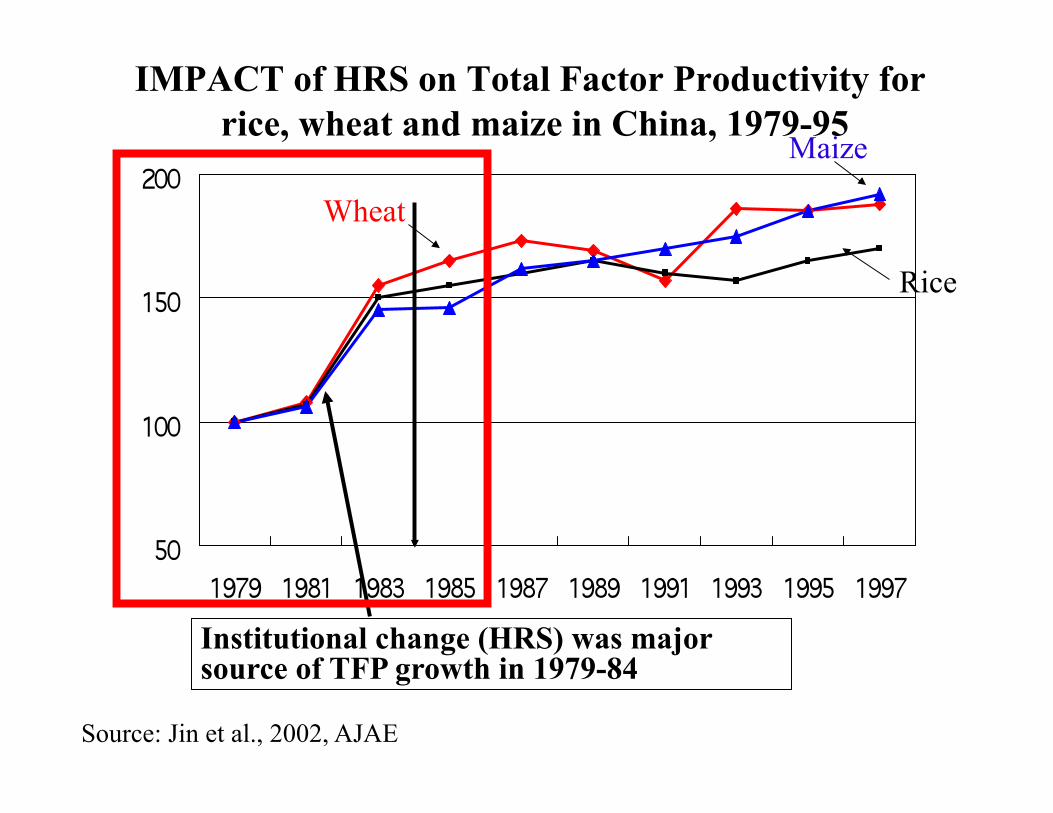
IMPACT of HRS on Total Factor Productivity for rice, wheat and maize in China, 1979-95
Rice
Wheat
Maize
Institutional change (HRS) was major source of TFP growth in 1979-84
Source: Jin et al., 2002, AJAE

2b. Market liberalization

2b. Market liberalization Market support policies
POLICY AGENDA:
• Dismantled Parastatals (State-owned trading companies)
• Deregulated Trading Rules
• Invested in Roads
• Invested in Communications

Use Corn and Soybean Marketing Regions and Flows as an example
Did China’s Markets Integrate?

Changes in corn price across China as markets increase its distance from port, 2000

Port—New Orleans
Location of Major Corn Markets in Greater Mississippi Valley
St. Louis

US Corn Prices

Percentage change in price for every 1000 kilometers of distance from port
Corn Soybean Rice
China 1998 -4% -10% -10% 1999 -4% -9% -9%
2000 -3% -4% -7%
US – 1998 -5% -3.5% 8%

Dalian
Guangzhou (Shekou Port)
After 2000, prices of corn in Dalian and Guangzhou almost move perfectly together …
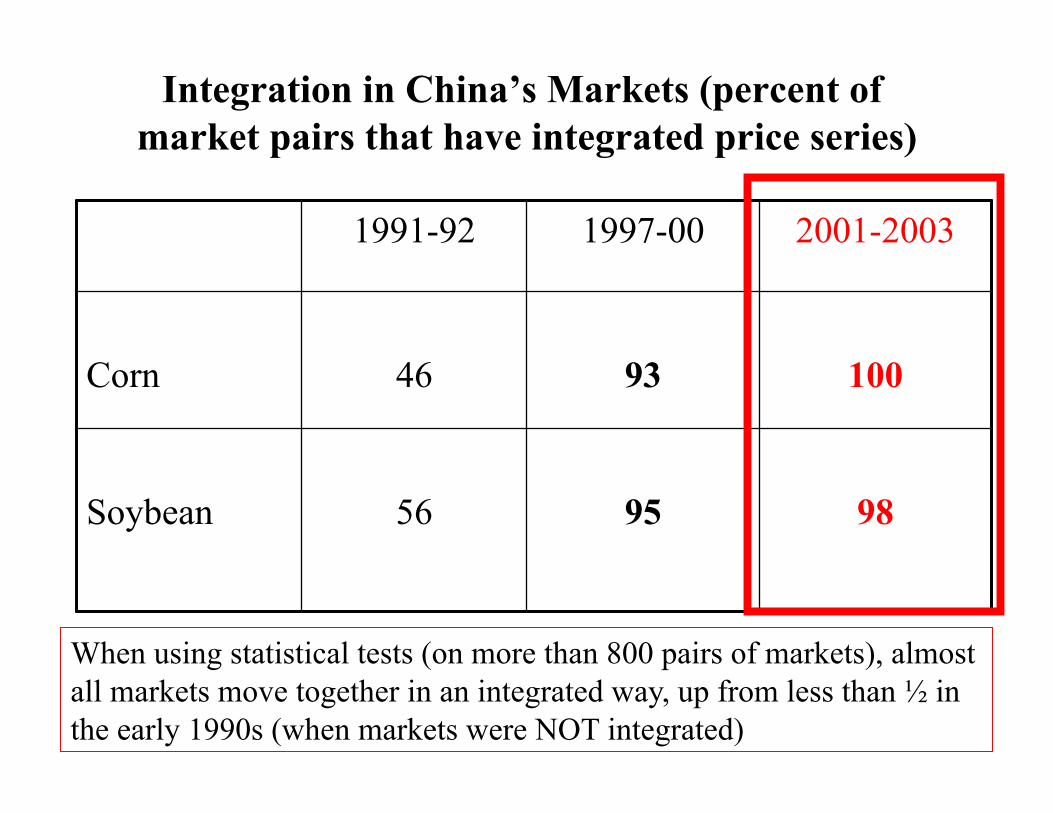
Integration in China’s Markets (percent of market pairs that have integrated price series)
1991-92 1997-00 2001-2003
Corn 46 93 100
Soybean 56 95 98
When using statistical tests (on more than 800 pairs of markets), almost all markets move together in an integrated way, up from less than ½ in the early 1990s (when markets were NOT integrated)

Rise of Specialization Percent
Share of villages reporting they specialize in a crop/livestock
What is the Impact of Rise of Markets

What is impact on the poor? Area_cash crops = a0 + a1*Poor + a2*Z + e Output_cash crops = a0 + a1*Poor + a2*Z + e Income_cash crops = a0 + a1*Poor + a2*Z + e
All things equal, do the poor benefit in this highly marketized world?
Is “a1” + or - ?
In four different studies (Hebei dairy; Shangdong apples; Shandong tomatoes; Shaanxi walnuts)
a1 > 0 the poor have benefited in this super marketized world?
Why? Millions of traders willing to go to furthest most remote places to make a sale …
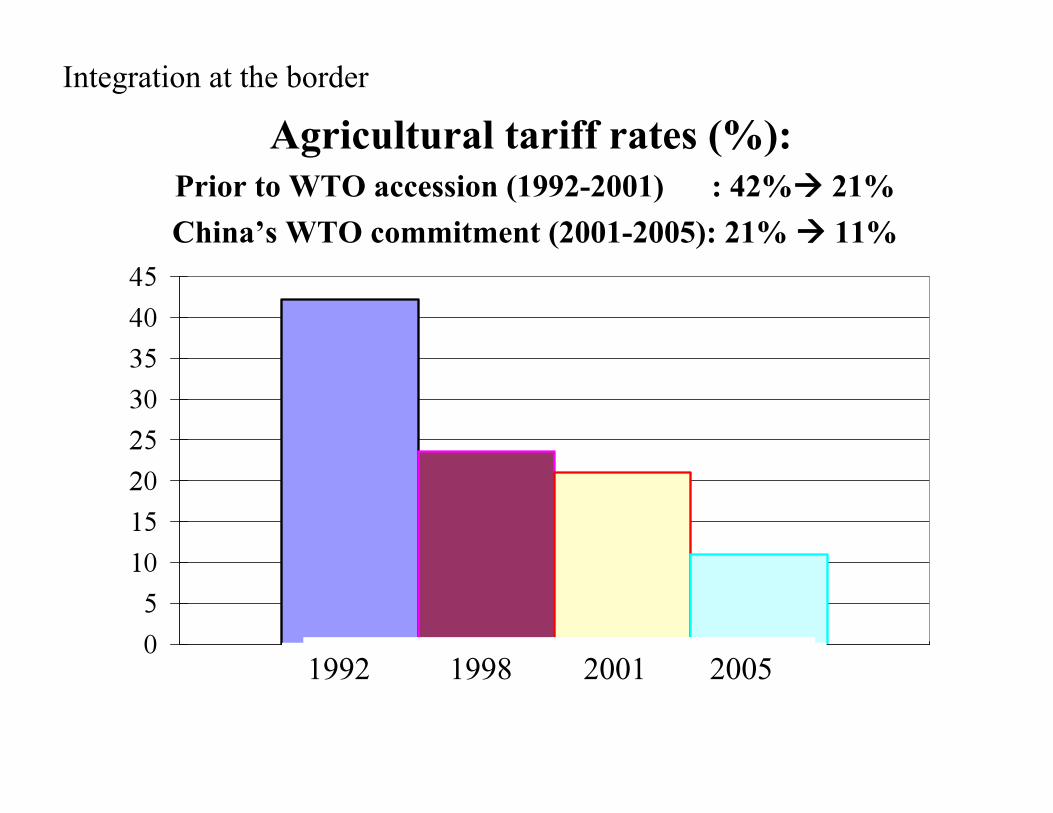
Agricultural tariff rates (%): Prior to WTO accession (1992-2001) : 42% 21% China’s WTO commitment (2001-2005): 21% 11%
1992 1998 2001 2005
Integration at the border

Nominal protection rates (%) in China, 1980-2005
This slide shows that while the prices of some commodities were much higher than world market prices in the 1980s (those commodities > 0) and many were way under world market prices (those commodities < 0)
Soybeans
Milk/Dairy
Wheat
Rice
Pork / Vegetable

Nominal protection rates (%) in China, 1980-2005
… by the 2000s, the prices of most of China’s commodities were nearly equal to the prices of the same commodities on world markets … this means that China is VERY OPEN … these numbers are more close to those in Australia and New Zealand than Japan, Korea or Europe


So China’s record on trade liberalization is mixed
• On import side—quite liberalized – Average prices in China about the same as the
world market prices …
• But, on export side: – Less variable than world market
• Use export restrictions when prices rise … [+ large buffer stocks]

• Irrigation • Technology • Other
2c. Investment into agricultural sector �

Expansion of irrigated land in China�
Million ha Nearly 50% of cultivated land

Surface irrigation

The state invested HEAVILY into surface water (construction and control)

The state invested HEAVILY into surface water (construction and control)
BUT: groundwater was left to the private sector
*** Virtually unregulated
No water/pumping fees But, no subsidy of electricity

Share of Groundwater in the 1960s/1970s ≈ ZERO

Importance of Groundwater in China Water Supply by Source, 2002
North China
Rest of China

And investment into Agricultural Research and Development (R&D)
Most all PUBLIC

Impact of Investment and R&D on Total Factor Productivity for Rice, Wheat and Maize in China, 1979-94
Rice
Wheat Maize
After middle 1980s, technology has been major factor affecting productivity growth
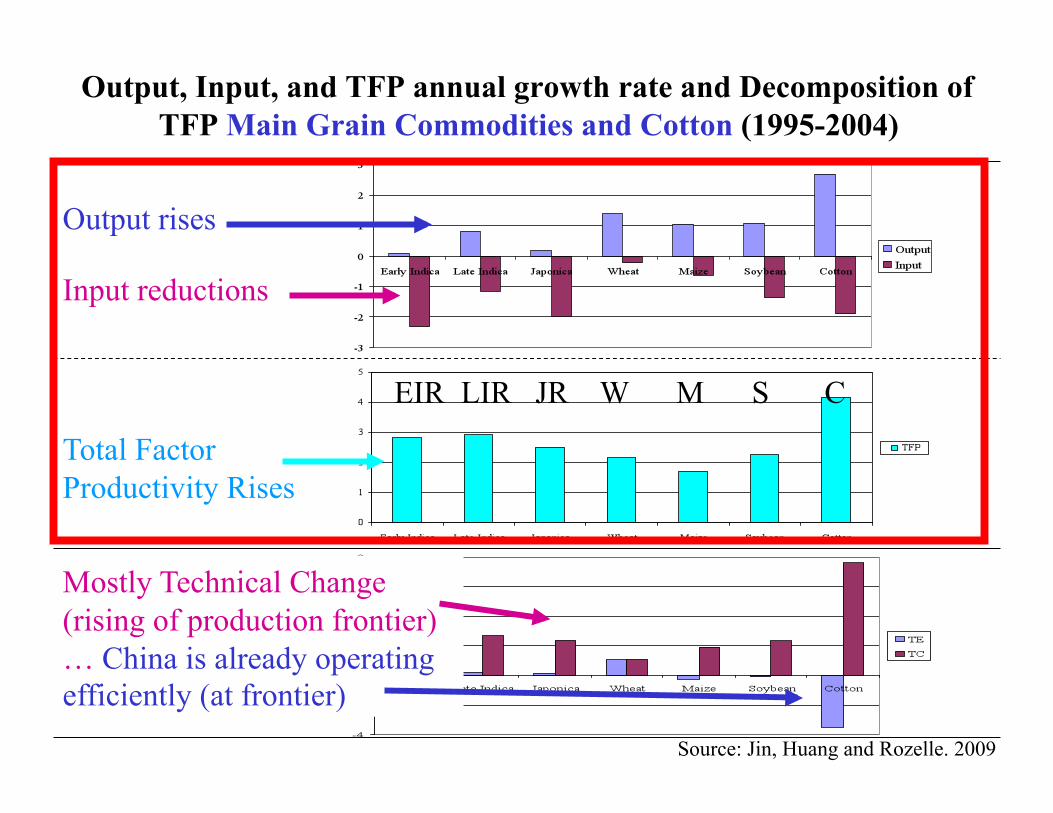
Output, Input, and TFP annual growth rate and Decomposition of TFP Main Grain Commodities and Cotton (1995-2004) �
Source: Jin, Huang and Rozelle. 2009
Input reductions
Output rises
Total Factor Productivity Rises
Mostly Technical Change (rising of production frontier) … China is already operating efficiently (at frontier)
EIR LIR JR W M S C

Output, Input, and TFP annual growth rate and Decomposition of TFP Vegetables and Oranges (1995-2004) �
Source: Jin, Huang and Rozelle. 2009
Same story for vegetables and fruit!!

Agricultural research investment intensity (%)
in China
Government fiscal investment in
agricultural research (billion yuan in 2005 price)
Since 2000, the rise in research investment has been higher in China than any other country in the world …
What is policy initiative?

Agricultural biotech research investment
Huang et al., 2005, April, Science
(million yuan in 2003 price)
2003: 1.65 billion yuan = US$ 200 million or US$ 950 million in PPP
The largest public investors in plant biotech in the world


Non-Bt cotton Bt cotton
Source: CAAS �

Bt cotton areas in China, 1996-2003 (thousand hectares)
More than 5 million farmers adopted Bt cotton in 2003

Case study: Bt vs Non-Bt Samples’ locations (1999-2001) �
The image cannot be displayed. Your computer may not have enough memory to open the image, or the image
The image cannot be displayed. Your computer may not have enough memory to open the
The image cannot be displayed. Your computer may not have enough memory to
The image cannot be displayed. Your computer may not have
The image cannot be displayed. Your computer may not
1 9 9 9 - 2 0 0 1:Samples – 1056 hhs
Hebei: 9 9 - 2 0 0 1
Jinagsu: 2 0 0 1
Anhui: 2 0 0 1
Shangdong: 9 9 - 2 0 0
Henan: 2 0 0 0 - 2 0 0 1

Case Study: Bt vs Non-Bt Cotton Inputs levels:
No significant difference in: Fertilizer use Irrigation Machinery Harvest cost
Significantly different in Pesticide use Labor use Seed price

Numbers of pesticide applications in Bt and non-Bt cotton in Hebei and Shandong in 1999
-- reduced by 13 applications
In 2000: by 12 applications In 2001: by 14 applications
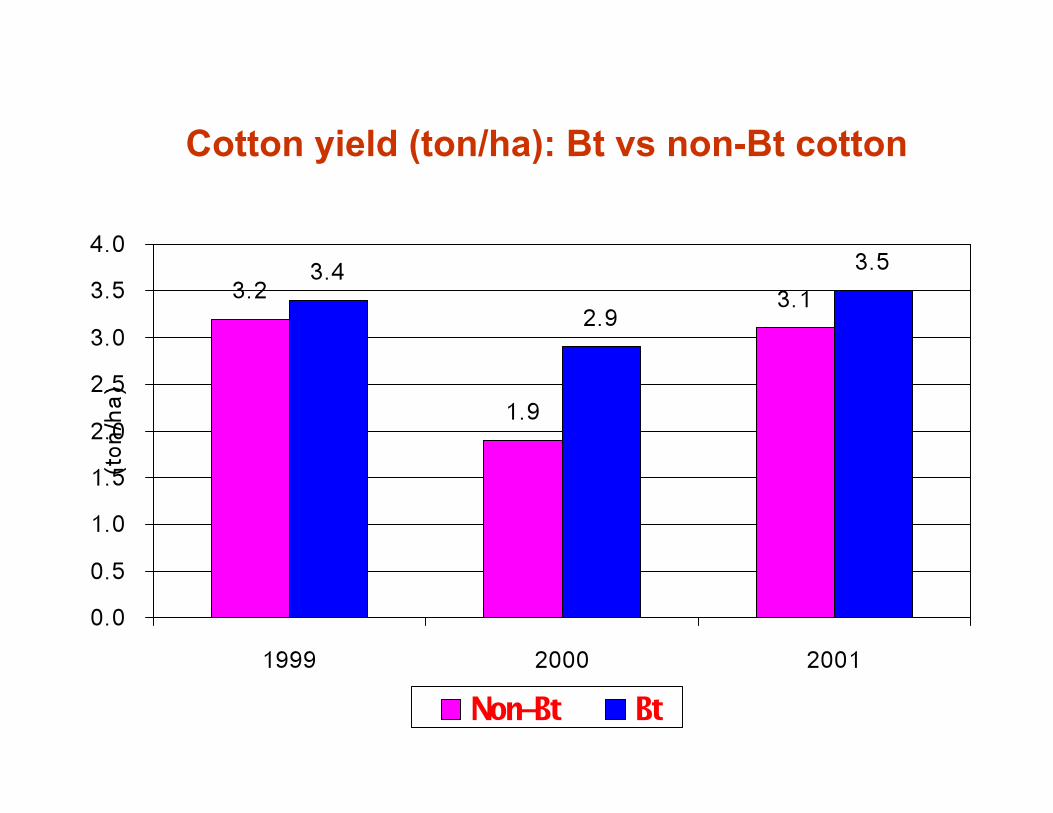
Cotton yield (ton/ha): Bt vs non-Bt cotton

Major findings on Bt cotton impacts in 1999-2001 (per hectare)
• Reduce pesticide use: 34 kg 923 yuan • Increase yield: 9.6% 930 yuan • Increase seed cost: 570 yuan
• Reduce labor input: 41days 574 yuan
• Increase net income: 1283-1857 yuan (US$ 155-225)
A net increase of about 30% … this is a HUGE increase in productivity!

GM technology’s benefits surpass the direct profitability metrics

Percentage (%) of poisonings reported as numbers of farmers interviewed in Henan in 2000

Summary of China’s Ag Development and Status of Its Food Economy

China’s success in a “word”
• Land to all (incentives to farmers)
• Foster Markets – Do not over regulate markets – Key: do not distort
• Invest heavily in: – Water – Agricultural R&D
Invest in roads and communications

What China did NOT do

P They have not privatized cultivated land part of large urban/rural inequality
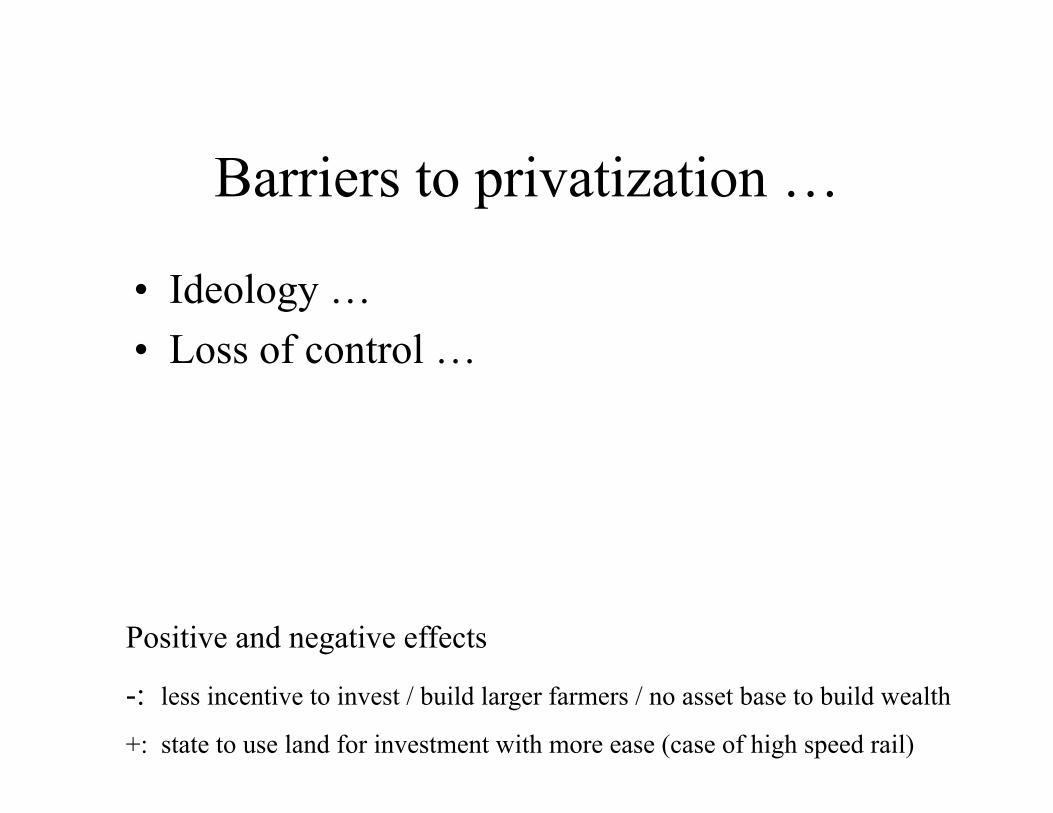
Barriers to privatization …
• Ideology … • Loss of control …
Positive and negative effects
- : less incentive to invest / build larger farmers / no asset base to build wealth
+: state to use land for investment with more ease (case of high speed rail)

No subsidies of inputs (in 1980s or 1990s)
• No fertilizer subsidies • No pesticide subsidies
High incentives to suppliers / no barriers in the market …
• No water subsidies
s

General subsidies in recent years • US farmer in Illinois in 2011: about US $50/acre
• China farmer in Sichuan in 2001: about US $80/acre
But, at least through today, subsidies are given in a way that is non-distorting … given as an income transfer to all farmers that have land
(regardless of what is being planted … regardless of whether the “owner” is cultivating the land or renting the land out … subsidy goes to “owner”)

Agricultural subsidies (100 million yuan)
Subsidies and supports have been rising significantly, reaching 3.1% of agricultural GDP in 2008

General subsidies in recent years • US farmer in Illinois in 2011: about US $50/acre
• China farmer in Sichuan in 2011: about US $80/acre
But, at least through today, subsidies are given in a way that is non-distorting … given as an income transfer to all farmers that have land
(regardless of what is being planted … regardless of whether the “owner” is cultivating the land or renting the land out … subsidy goes to “owner”)

Organization of production
• Have not used Coops … Farmer organizations
The government is afraid the a national system of coops might become focus of an opposition political party
coops

And, these small farmers are mostly “on their own”
Cooperative movement still small
Percent of villages with Cooperatives / FAs
Percent of households that belong to Cooperatives / FAs
8 % 2 %

Comparing with other nations: Percentage of Households Participating in Coops/FAs

Status of China’s Economy--2013
• China has solved Macro-nutrient Food Security Problem at the household level: > 3000 Kcal/day/person
• Absolute Poverty Rate (US$1.25/day): from 40% in 1980 to less than 5% today
• Huge structural transformation

Overall Increase in Off-farm Work
In 2011 more than 90% of households have at least 1 family member (or son / daughter) working off the farm
In 1980: only 4% worked full time off the farm
71%
2011

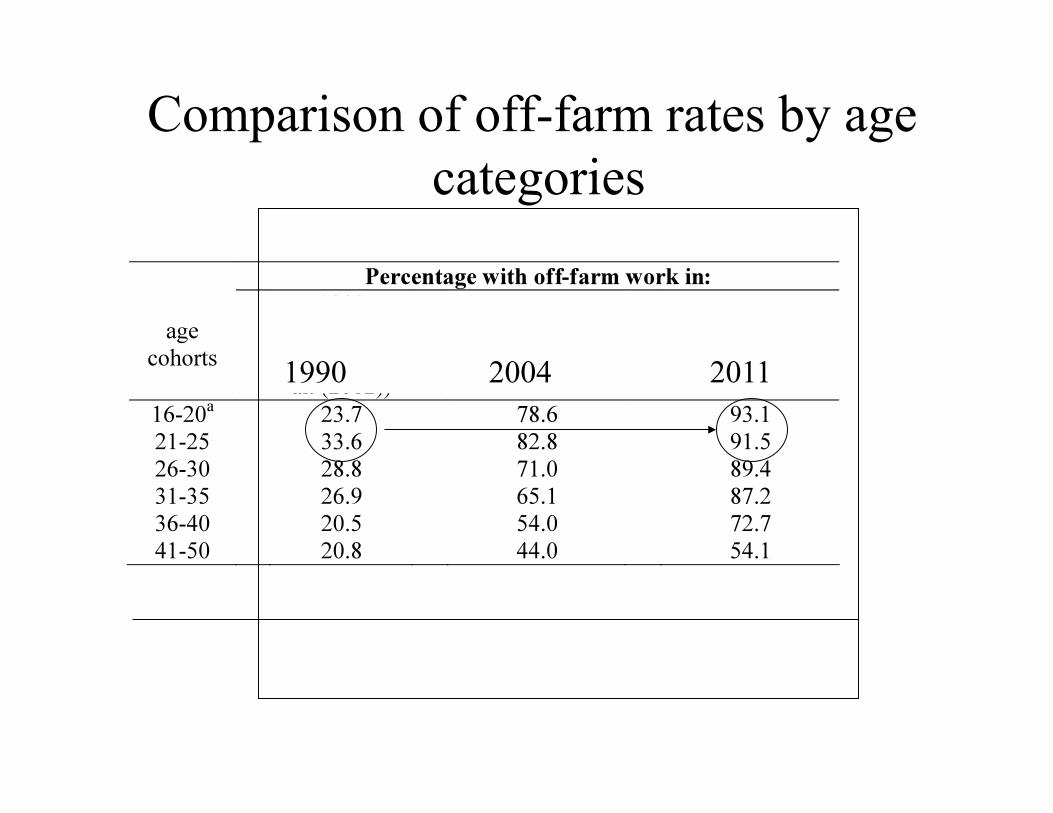
Comparison of off-farm rates by age categories

Comparison of off-farm rates by age categories
1990 2004 2011
Comparison of off-farm rates by age categories
1990 2004 2011

Comparison of off-farm rates by age categories
1990 2004 2011 This is the REAL trans-formation

Investment into agriculture played key role in this transformation
created a virtuous cycle • Agriculture provided income for farm households:
– To build housing – To invest in education for kids – To finance move off the farm – For starting self-employed enterprises – It was a source of demand … in the early stages of industrialization (in fact,
early factories were set up in the rural areas)
• Off farm remittances and earnings from self-employed enterprises in turn financed agriculture at the household level: – High rates of fertilizer use in the world (no credit needed) – Investment by households in groundwater / pumps – Investment by households into vegetable and fruit production – Investment by entrepreneurs into custom plowing / harvesting
• High earnings from agriculture allow additional push off the farm …

China’s agriculture is NOT perfect (not by a long shot) Concerns & Challenges:
Demand Side • High demand for meat / fish / fruits / vegetables • Serious food safety concerns
Supply Side • Land • Water • Small farm/Ageing farmers (farmer-ettes) • Rising wages
• Rising net imports (and National Food Security concerns)

What are the lessons for Africa?
1. Incentives are important …
• Providing incentives are more important than formal property rights … as long as farmers can be assured of the return to the effort, they will invest in farming activities …
• Of course, more secure rights are better … and will be needed to encourage investment in land-specific investments … if State helps out in that (invest in irrigation / invest in rural roads), maybe can do without private land …
• But, this can lead to equity problems.

2. Markets can be an effective tool of development. Markets can be pro-poor.
• Markets have integrated China’s food economy. This has increased efficiency and has increased the income of the poor.
• What was the role of the government? – Mostly Nothing:
• They got out of the way (shut down parastatals) … • They let private sector emerge without regulation • No subsidies … provided incentives for traders
– Actually the government was involved in indirect way: • Investing in roads • Investing in communications • Enforcing free inter-province marketing

3. Greatest role for state: investment into public goods, especially into agricultural R&D … however, state did not interfere (very much) into investments that could be (should be) made by households;
• China’s government invested heavily into:
– Roads – Water control—surface systems – Afforestation projects – Agricultural technologies – Agricultural extension
• Households took responsibility for investing into: – Groundwater – Orchards and Vegetable Production – Machinery/Mechanization – Input Supply

4. Getting the incentives right for the government
• Government officials were given incentives to promote growth and structural transformation. They became co-beneficiaries. There was an incentive to promote programs and encourage growth.
• China’s system of promotion was based on past performance and education.
• Policies designed to promote younger officials.
[But, are there lessons here? Is this the legacy of a one-party system … with ambitious leaders at the top that have the goal of China becoming a world power and developed economy]

What countries can learn about what China’s government did NOT do
• Setting up artificial barriers between rural and urban is extremely inefficient and creates high rates of inequality. This has not been a problem as long as there is growth. There are concerns that when growth slows, the high levels of inequality could lead to instability.
• Investment into rural health, nutrition and health is far from sufficient China got basic education done (taught rural individuals to read, write and be disciplined) … but, there are high barriers keeping rural individuals now from getting the education that they will need as China tries to move from middle to high income.

Thank you