global wealth migration review - samhällsnytt · global wealth migration review worldwide wealth...
TRANSCRIPT

NWWealth
GWMR 2018
© New World Wealth. Page 1
ho-
Global Wealth Migration Review
Worldwide wealth and wealth migration trends
Publication Date: February 2018
NWWealth
GWMR 2018
© New World Wealth. Page 2
TABLE OF CONTENTS
TABLE OF CONTENTS ............................................................................................................. 2
LIST OF TABLES....................................................................................................................... 3
1 Introduction ........................................................................................................................ 4
1.1 What is this Report About? ....................................................................................................... 4
1.2 Notes and definitions ................................................................................................................ 4
1.3 Sources ...................................................................................................................................... 4
1.4 Why do we compile a global wealth report? ............................................................................ 5
2 Country benchmarks ......................................................................................................... 6
2.1 Global wealth statistics ............................................................................................................. 6
2.2 W10: The 10 wealthiest countries worldwide ........................................................................... 6
2.3 The wealthiest countries by wealth per capita ........................................................................ 9
3 Country performance and trends ................................................................................... 10
3.1 Wealth growth over the past year ........................................................................................... 10
3.2 Wealth growth over the past 10 years .................................................................................... 12
3.3 Future trends............................................................................................................................ 14
3.4 The rise of the Asia 7 ............................................................................................................... 15
4 Wealth inequality.............................................................................................................. 16
4.1 Wealth inequality by country .................................................................................................. 16
4.2 Relationship between population density and wealth per capita ......................................... 18
5 The wealthiest cities worldwide ...................................................................................... 19
5.1 World cities .............................................................................................................................. 19
5.2 Spotlight on Chinese cities ..................................................................................................... 21
6 Wealth migration trends .................................................................................................. 22
6.1 The immigration debate .......................................................................................................... 22
6.2 Countries with large inflows of HNWIs in 2017 ...................................................................... 23
6.3 Countries with large outflows of HNWIs in 2017 ................................................................... 24
6.4 Country spotlights ................................................................................................................... 25
6.5 Cities with large inflows of HNWIs in 2017............................................................................. 28
6.6 Cities with large outflows of HNWIs in 2017 .......................................................................... 29
6.7 Mechanisms of migration ........................................................................................................ 29
7 HNWI review ..................................................................................................................... 30
7.1 Top countries and cities for HNWIs ........................................................................................ 30
7.2 Top countries and cities for multi-millionaires ...................................................................... 31
7.3 Top countries and cities for billionaires ................................................................................ 32
7.4 Most popular destinations and hobbies for the world’s wealthy ......................................... 33
7.5 Key investment trends for HNWIs in 2017 and beyond ......................................................... 35
8 Global prime property index ........................................................................................... 38
NWWealth
GWMR 2018
© New World Wealth. Page 3
9 Drivers of wealth growth ................................................................................................. 39
9.1 Factors that encourage wealth growth................................................................................... 39
9.2 Woman safety index ................................................................................................................ 40
10 About New World Wealth ................................................................................................ 42
LIST OF TABLES
Table 1: World: Wealth band definitions ......................................................................................................................................................................4
Table 2: W10: The 10 wealthiest countries in the world by total wealth held, 2017 ..................................................................................................6
Table 3: W10: Wealth growth by country, 2016 - 2017 ...............................................................................................................................................7
Table 4: W10: Wealth growth by country, 2007 - 2017 ...............................................................................................................................................7
Table 5: W10: Wealth growth forecast by country, 2017 - 2027 .................................................................................................................................8
Table 6: World: The 10 wealthiest countries in the world by per capita wealth, 2017 ...............................................................................................9
Table 7: World: Best performing wealth markets, 2016 - 2017.................................................................................................................................10
Table 8: World: Worst performing wealth markets, 2016 - 2017 ..............................................................................................................................11
Table 9: World: Best performing wealth markets, 2007 - 2017.................................................................................................................................12
Table 10: World: Worst performing wealth markets, 2007 - 2017 ............................................................................................................................13
Table 11: The Asia 7 - The big 7 wealth markets in Asia..........................................................................................................................................15
Table 12: World: Countries ranked by HNWI net inflows, 2017 ...............................................................................................................................23
Table 13: World: Countries ranked by HNWI net outflows, 2017 .............................................................................................................................24
Table 14: World: Cities with large (1,000+) inflows of HNWIs in 2017 .....................................................................................................................28
Table 15: World: Cities with large (1,000+) outflows of HNWIs in 2017...................................................................................................................29
Table 16: World: The top 10 countries for HNWIs, 2017 ..........................................................................................................................................30
Table 17: World: The top 10 cities for HNWIs, 2017 .................................................................................................................................................30
Table 18: World: The top 10 countries for multi-millionaires, 2017 ..........................................................................................................................31
Table 19: World: The top 10 cities for multi-millionaires, 2017 .................................................................................................................................31
Table 20: World: The top 10 countries for billionaires, 2017 ....................................................................................................................................32
Table 21: World: The top 10 cities for billionaires, 2017 ...........................................................................................................................................32
Table 22: World: Most popular hotels for the super-rich, 2017 .................................................................................................................................33
Table 23: World: Most popular trains for the super-rich, 2017..................................................................................................................................33
Table 24: World: Most popular hobbies for the super-rich, 2017 ..............................................................................................................................34
Table 25: World: Top classic cars for HNWIs, 2017 .................................................................................................................................................37
Table 26: World: Top 20 most expensive prime property locations worldwide, 2016 - 2017 ..................................................................................38
NWWealth
GWMR 2018
© New World Wealth. Page 4
1 Introduction
1.1 What is this Report About?
.
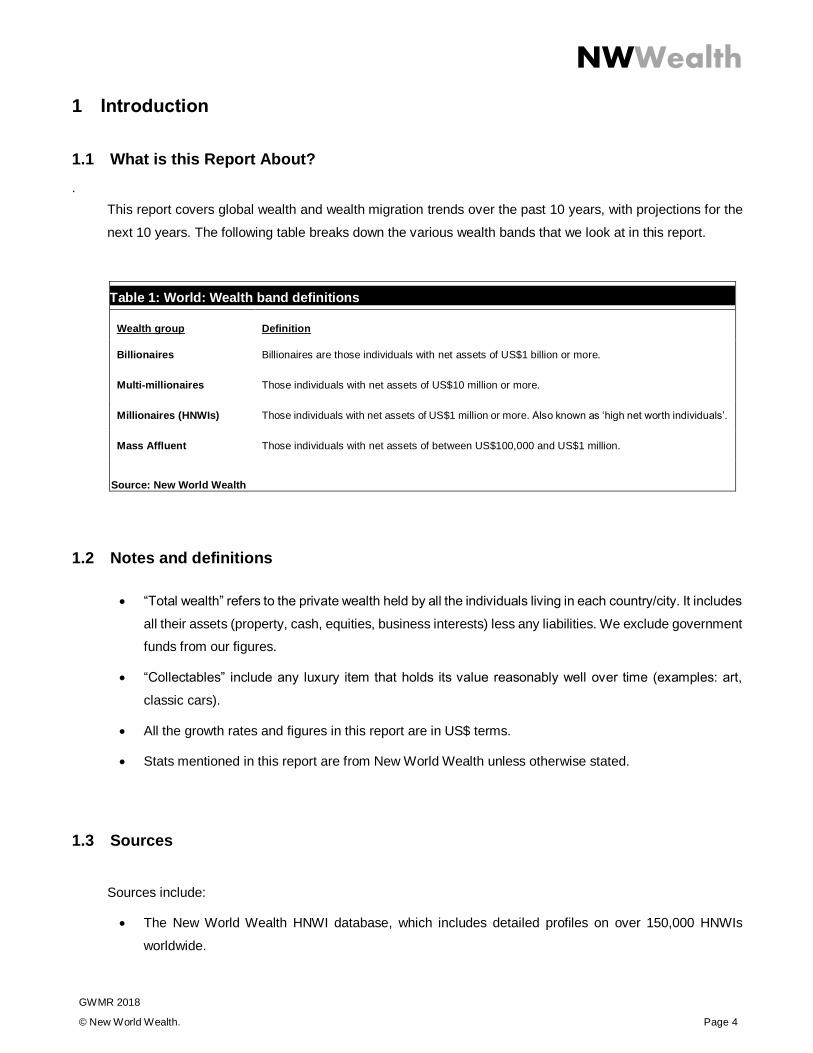
This report covers global wealth and wealth migration trends over the past 10 years, with projections for the
next 10 years. The following table breaks down the various wealth bands that we look at in this report.
Table 1: World: Wealth band definitions
Wealth group Definition
Billionaires Billionaires are those individuals with net assets of US$1 billion or more.
Multi-millionaires Those individuals with net assets of US$10 million or more.
Millionaires (HNWIs) Those individuals with net assets of US$1 million or more. Also known as ‘high net worth individuals’.
Mass Affluent Those individuals with net assets of between US$100,000 and US$1 million.
Source: New World Wealth
1.2 Notes and definitions
“Total wealth” refers to the private wealth held by all the individuals living in each country/city. It includes
all their assets (property, cash, equities, business interests) less any liabilities. We exclude government
funds from our figures.
“Collectables” include any luxury item that holds its value reasonably well over time (examples: art,
classic cars).
All the growth rates and figures in this report are in US$ terms.
Stats mentioned in this report are from New World Wealth unless otherwise stated.
1.3 Sources
Sources include:
The New World Wealth HNWI database, which includes detailed profiles on over 150,000 HNWIs
worldwide.

NWWealth
GWMR 2018
© New World Wealth. Page 5
Regular interviews with intermediaries (migration experts, wealth managers, financial advisors,
property agents, travel agents and art & classic car dealers).
Property registers and property sales statistics in each country (i.e. who is buying).
Income distribution stats in each country.
Stock market statistics in each country.
Tracking of HNWI movements in the media.
Investor visa program statistics in each country.
Crime stats in each country.
1.4 Why do we compile a global wealth report?
We consider wealth to be a far better measure of the financial health on an economy that GDP. Reasons for
this include:
In certain countries, a large portion of GDP flows to the government and therefore has little impact on
private wealth creation (examples: Bahrain, Kuwait).
GDP counts items multiple times (for instance, if someone is paid $100 for a product/service and they
then pay someone else that $100 for another product/service, then that adds $200 to a country’s GDP,
even though only $100 has been produced at the start).
GDP disregards income levels in a country.
GDP ignores the efficiency of the local banking sector and the local stock market at retaining wealth in
a country.
Wealth figures, on the other hand, do not have any of these limitations, making them a far better gauge of the
financial health of an economy than GDP figures.
Wealth migration figures are another very important gauge of the health of an economy. For instance, if a
country is losing a large numbers of HNWIs to migration, it is probably due to serious problems in that country
(i.e. crime, lack of business opportunities, religious tensions etc.). Conversely, countries that attract HNWIs
tend to be very healthy and normally have low crime rates, good schools and good business opportunities.
NWWealth
GWMR 2018
© New World Wealth. Page 6
2 Country benchmarks
2.1 Global wealth statistics
Worldwide stats (as at end of Dec 2017):
Total private wealth held worldwide amounts to approximately US$215 trillion.
The average individual has net assets of US$28,400 (wealth per capita).
There are approximately 15.2 million HNWIs in the world, each with net assets of US$1 million or more.
There are approximately 584,000 multi-millionaires in the world, each with net assets of US$10 million
or more.
There are 2,252 billionaires in the world, each with net assets of US$1 billion or more.
2.2 W10: The 10 wealthiest countries worldwide
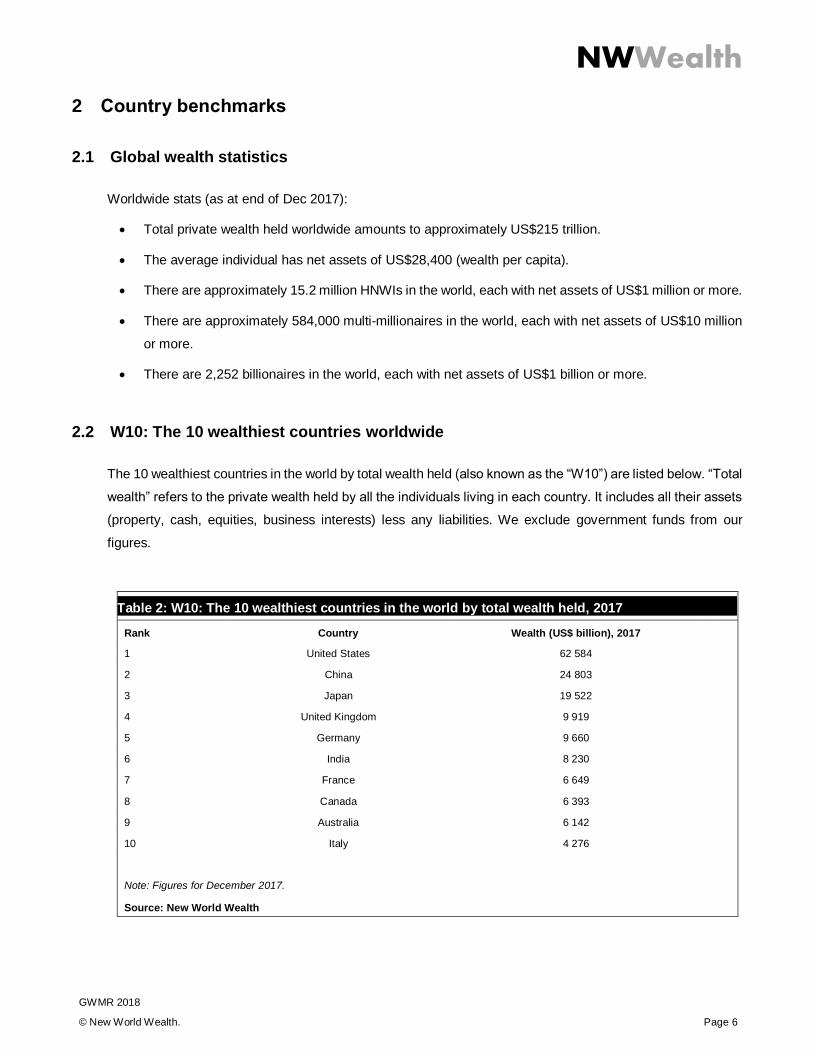
The 10 wealthiest countries in the world by total wealth held (also known as the “W10”) are listed below. “Total
wealth” refers to the private wealth held by all the individuals living in each country. It includes all their assets
(property, cash, equities, business interests) less any liabilities. We exclude government funds from our
figures.
Table 2: W10: The 10 wealthiest countries in the world by total wealth held, 2017
Rank Country Wealth (US$ billion), 2017
1 United States 62 584
2 China 24 803
3 Japan 19 522
4 United Kingdom 9 919
5 Germany 9 660
6 India 8 230
7 France 6 649
8 Canada 6 393
9 Australia 6 142
10 Italy 4 276
Note: Figures for December 2017.
Source: New World Wealth
NWWealth
GWMR 2018
© New World Wealth. Page 7
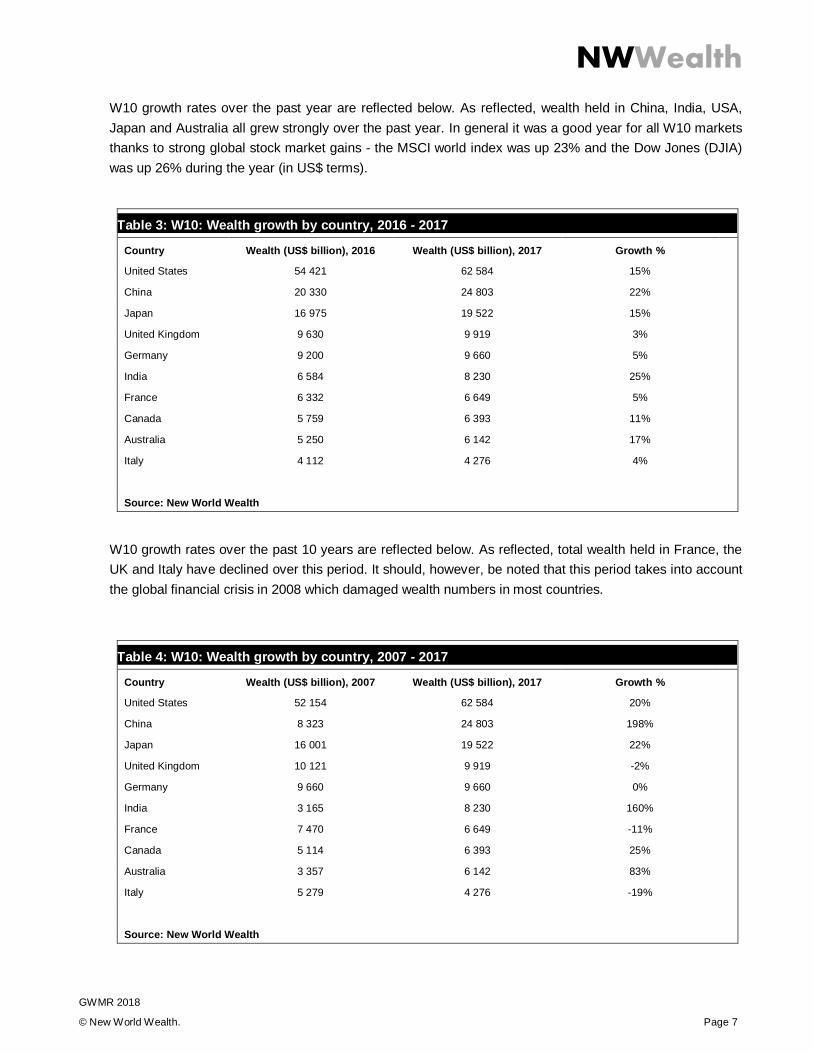
W10 growth rates over the past year are reflected below. As reflected, wealth held in China, India, USA,
Japan and Australia all grew strongly over the past year. In general it was a good year for all W10 markets
thanks to strong global stock market gains - the MSCI world index was up 23% and the Dow Jones (DJIA)
was up 26% during the year (in US$ terms).
Table 3: W10: Wealth growth by country, 2016 - 2017
Country Wealth (US$ billion), 2016 Wealth (US$ billion), 2017 Growth %
United States 54 421 62 584 15%
China 20 330 24 803 22%
Japan 16 975 19 522 15%
United Kingdom 9 630 9 919 3%
Germany 9 200 9 660 5%
India 6 584 8 230 25%
France 6 332 6 649 5%
Canada 5 759 6 393 11%
Australia 5 250 6 142 17%
Italy 4 112 4 276 4%
Source: New World Wealth
W10 growth rates over the past 10 years are reflected below. As reflected, total wealth held in France, the
UK and Italy have declined over this period. It should, however, be noted that this period takes into account
the global financial crisis in 2008 which damaged wealth numbers in most countries.
Table 4: W10: Wealth growth by country, 2007 - 2017
Country Wealth (US$ billion), 2007 Wealth (US$ billion), 2017 Growth %
United States 52 154 62 584 20%
China 8 323 24 803 198%
Japan 16 001 19 522 22%
United Kingdom 10 121 9 919 -2%
Germany 9 660 9 660 0%
India 3 165 8 230 160%
France 7 470 6 649 -11%
Canada 5 114 6 393 25%
Australia 3 357 6 142 83%
Italy 5 279 4 276 -19%
Source: New World Wealth
NWWealth
GWMR 2018
© New World Wealth. Page 8
Additional findings:
Australia’s high total wealth ranking is impressive when considering it only has 22 million people
living there.
The decline in UK wealth ((in US$ terms) over the 10 year period between 2007 and 2017 was mainly
driven by a significant deprecation of the GBP against the US$ from around US$2.0/£ at the end of
2007 to US$1.35/£ at the end of 2017.
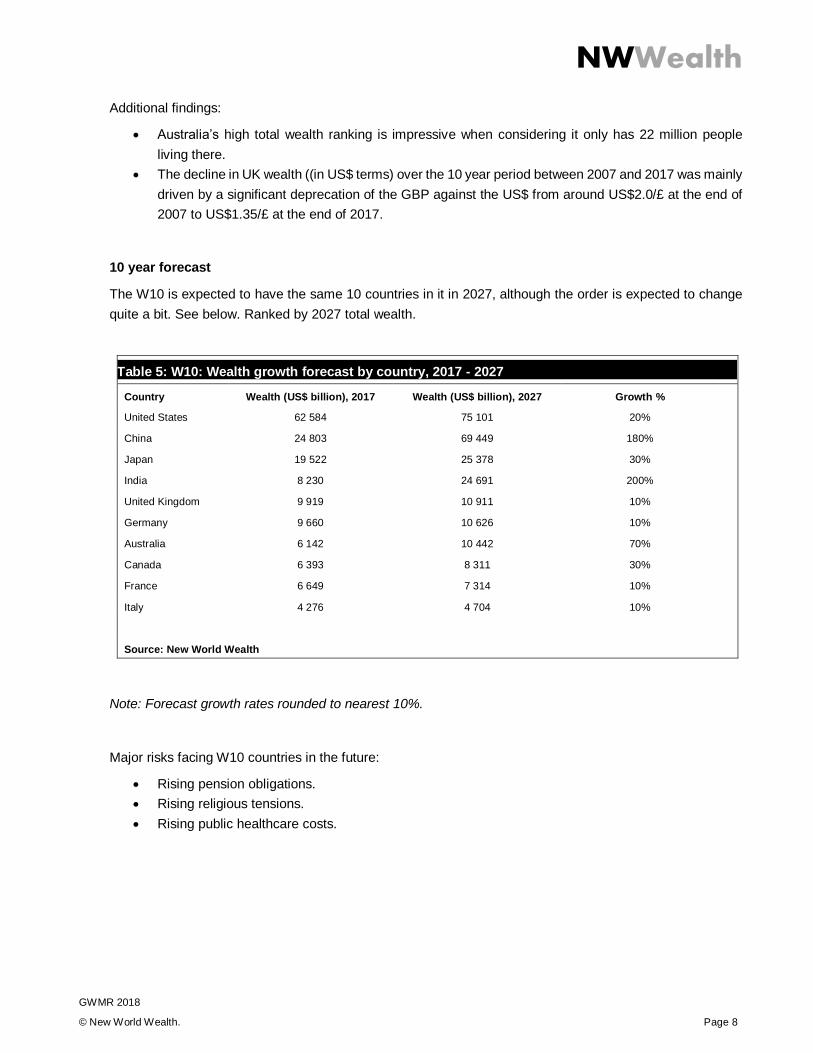
10 year forecast
The W10 is expected to have the same 10 countries in it in 2027, although the order is expected to change
quite a bit. See below. Ranked by 2027 total wealth.
Table 5: W10: Wealth growth forecast by country, 2017 - 2027
Country Wealth (US$ billion), 2017 Wealth (US$ billion), 2027 Growth %
United States 62 584 75 101 20%
China 24 803 69 449 180%
Japan 19 522 25 378 30%
India 8 230 24 691 200%
United Kingdom 9 919 10 911 10%
Germany 9 660 10 626 10%
Australia 6 142 10 442 70%
Canada 6 393 8 311 30%
France 6 649 7 314 10%
Italy 4 276 4 704 10%
Source: New World Wealth
Note: Forecast growth rates rounded to nearest 10%.
Major risks facing W10 countries in the future:
Rising pension obligations.
Rising religious tensions.
Rising public healthcare costs.

NWWealth
GWMR 2018
© New World Wealth. Page 9
2.3 The wealthiest countries by wealth per capita
The following table ranks all known countries by average wealth per person (wealth per capita). As reflected,
small financial hubs such as Monaco and Liechtenstein top the list.
Table 6: World: The 10 wealthiest countries in the world by per capita wealth, 2017
Rank Country Wealth per capita (US$), 2017
1 Monaco 2 087 400
2 Liechtenstein 761 100
3 Luxembourg 368 000
4 Switzerland 354 000
5 Australia 279 200
6 Norway 228 000
7 Singapore 194 500
8 United States 193 400
9 Canada 185 300
10 New Zealand 173 700
Note: Figures for December 2017.
Source: New World Wealth
The high average wealth of people living in Monaco reflects:
Its tax haven status – people living in Monaco pay no income tax. This attracts wealthy people to
move there and also promotes business formation in the country.
Offshore center – Monaco operates as an offshore center for the European wealth sector, which
brings a large number of wealthy financiers to the country.
Its location on prime part of the French Riviera.
High proportion of multi-millionaires – approximately 2,800 of Monaco’s 40,000 residents are worth
over US$10 million.
It is a hotspot for super-yacht owners and one of the most popular yacht docking spots in the Med.
High real estate prices – Only the wealthy can afford to buy homes there. Monaco apartments are
the most expensive in the world per square meter.
Snob appeal – Monaco is synonymous with wealth, luxury and fame.
NWWealth
GWMR 2018
© New World Wealth. Page 10
3 Country performance and trends
3.1 Wealth growth over the past year
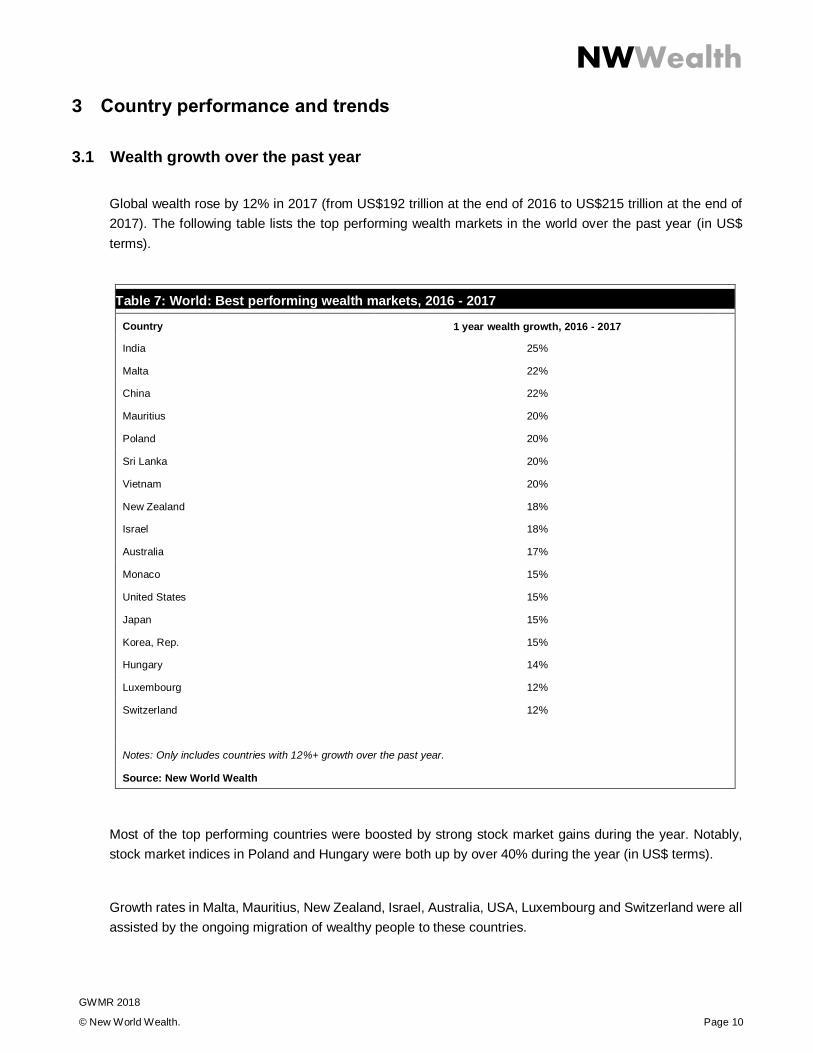
Global wealth rose by 12% in 2017 (from US$192 trillion at the end of 2016 to US$215 trillion at the end of
2017). The following table lists the top performing wealth markets in the world over the past year (in US$
terms).
Table 7: World: Best performing wealth markets, 2016 - 2017
Country 1 year wealth growth, 2016 - 2017
India 25%
Malta 22%
China 22%
Mauritius 20%
Poland 20%
Sri Lanka 20%
Vietnam 20%
New Zealand 18%
Israel 18%
Australia 17%
Monaco 15%
United States 15%
Japan 15%
Korea, Rep. 15%
Hungary 14%
Luxembourg 12%
Switzerland 12%
Notes: Only includes countries with 12%+ growth over the past year.
Source: New World Wealth
Most of the top performing countries were boosted by strong stock market gains during the year. Notably,
stock market indices in Poland and Hungary were both up by over 40% during the year (in US$ terms).
Growth rates in Malta, Mauritius, New Zealand, Israel, Australia, USA, Luxembourg and Switzerland were all
assisted by the ongoing migration of wealthy people to these countries.
NWWealth
GWMR 2018
© New World Wealth. Page 11
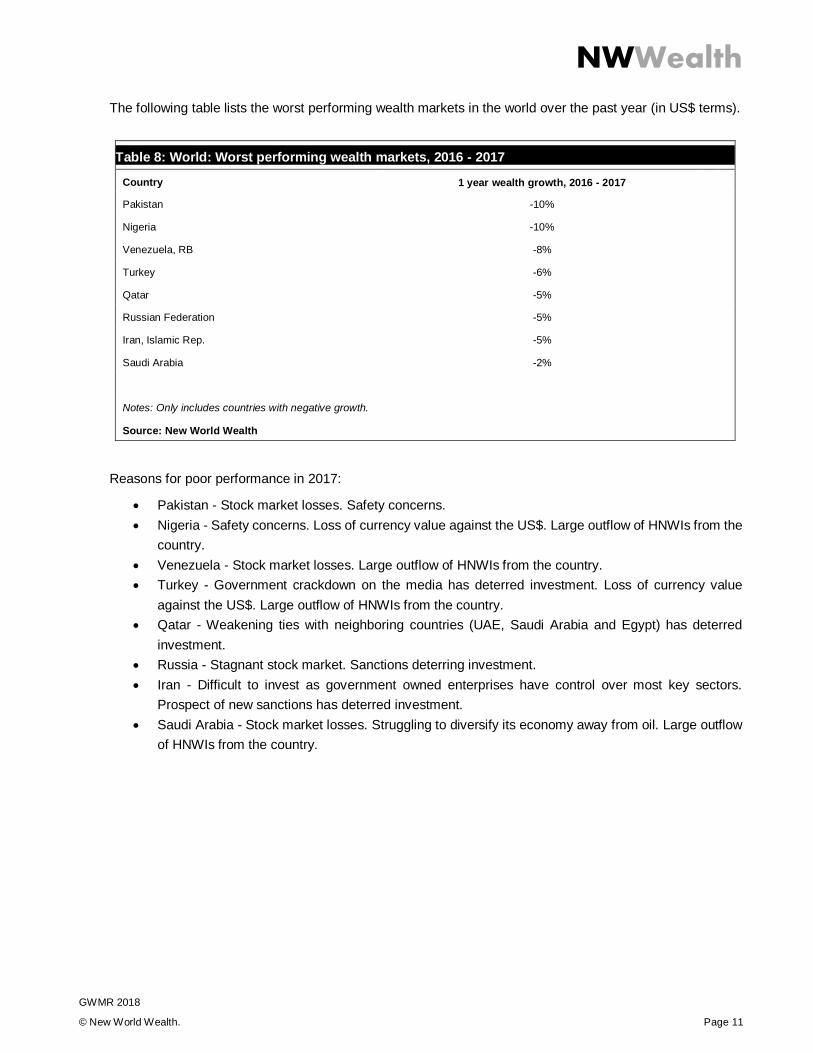
The following table lists the worst performing wealth markets in the world over the past year (in US$ terms).
Table 8: World: Worst performing wealth markets, 2016 - 2017
Country 1 year wealth growth, 2016 - 2017
Pakistan -10%
Nigeria -10%
Venezuela, RB -8%
Turkey -6%
Qatar -5%
Russian Federation -5%
Iran, Islamic Rep. -5%
Saudi Arabia -2%
Notes: Only includes countries with negative growth.
Source: New World Wealth
Reasons for poor performance in 2017:
Pakistan - Stock market losses. Safety concerns.
Nigeria - Safety concerns. Loss of currency value against the US$. Large outflow of HNWIs from the
country.
Venezuela - Stock market losses. Large outflow of HNWIs from the country.
Turkey - Government crackdown on the media has deterred investment. Loss of currency value
against the US$. Large outflow of HNWIs from the country.
Qatar - Weakening ties with neighboring countries (UAE, Saudi Arabia and Egypt) has deterred
investment.
Russia - Stagnant stock market. Sanctions deterring investment.
Iran - Difficult to invest as government owned enterprises have control over most key sectors.
Prospect of new sanctions has deterred investment.
Saudi Arabia - Stock market losses. Struggling to diversify its economy away from oil. Large outflow
of HNWIs from the country.
NWWealth
GWMR 2018
© New World Wealth. Page 12
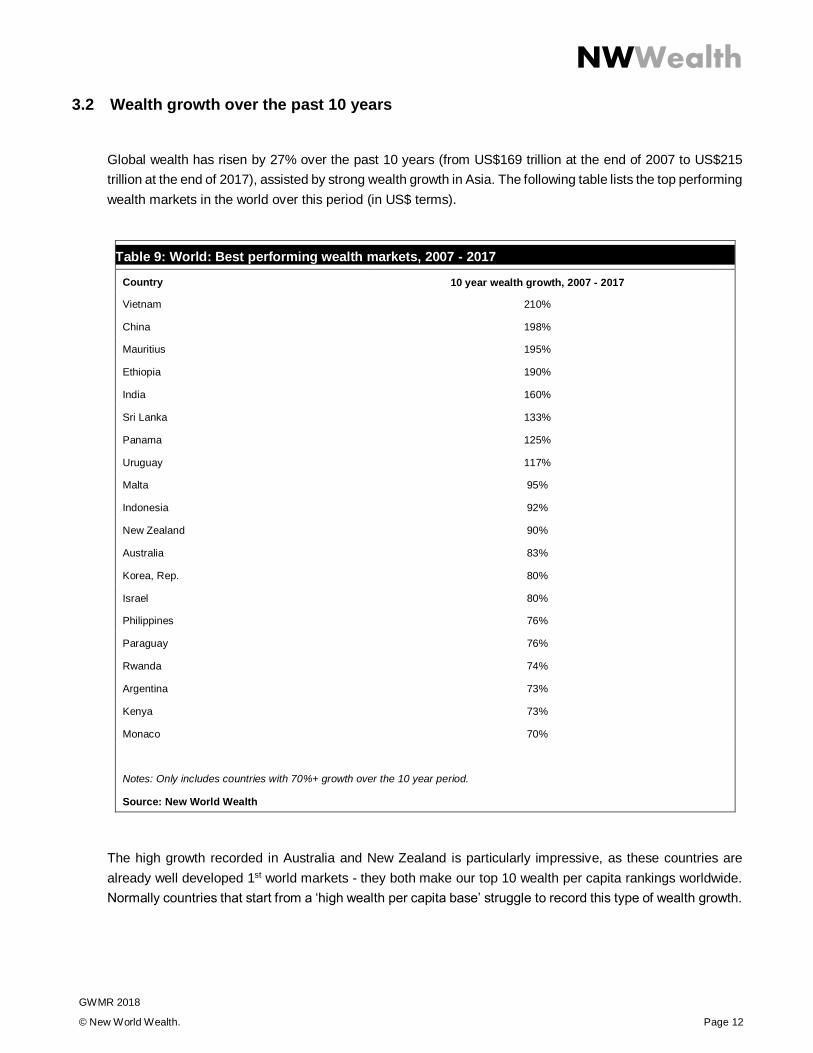
3.2 Wealth growth over the past 10 years
Global wealth has risen by 27% over the past 10 years (from US$169 trillion at the end of 2007 to US$215
trillion at the end of 2017), assisted by strong wealth growth in Asia. The following table lists the top performing
wealth markets in the world over this period (in US$ terms).
Table 9: World: Best performing wealth markets, 2007 - 2017
Country 10 year wealth growth, 2007 - 2017
Vietnam 210%
China 198%
Mauritius 195%
Ethiopia 190%
India 160%
Sri Lanka 133%
Panama 125%
Uruguay 117%
Malta 95%
Indonesia 92%
New Zealand 90%
Australia 83%
Korea, Rep. 80%
Israel 80%
Philippines 76%
Paraguay 76%
Rwanda 74%
Argentina 73%
Kenya 73%
Monaco 70%
Notes: Only includes countries with 70%+ growth over the 10 year period.
Source: New World Wealth
The high growth recorded in Australia and New Zealand is particularly impressive, as these countries are
already well developed 1st world markets - they both make our top 10 wealth per capita rankings worldwide.
Normally countries that start from a ‘high wealth per capita base’ struggle to record this type of wealth growth.
NWWealth
GWMR 2018
© New World Wealth. Page 13
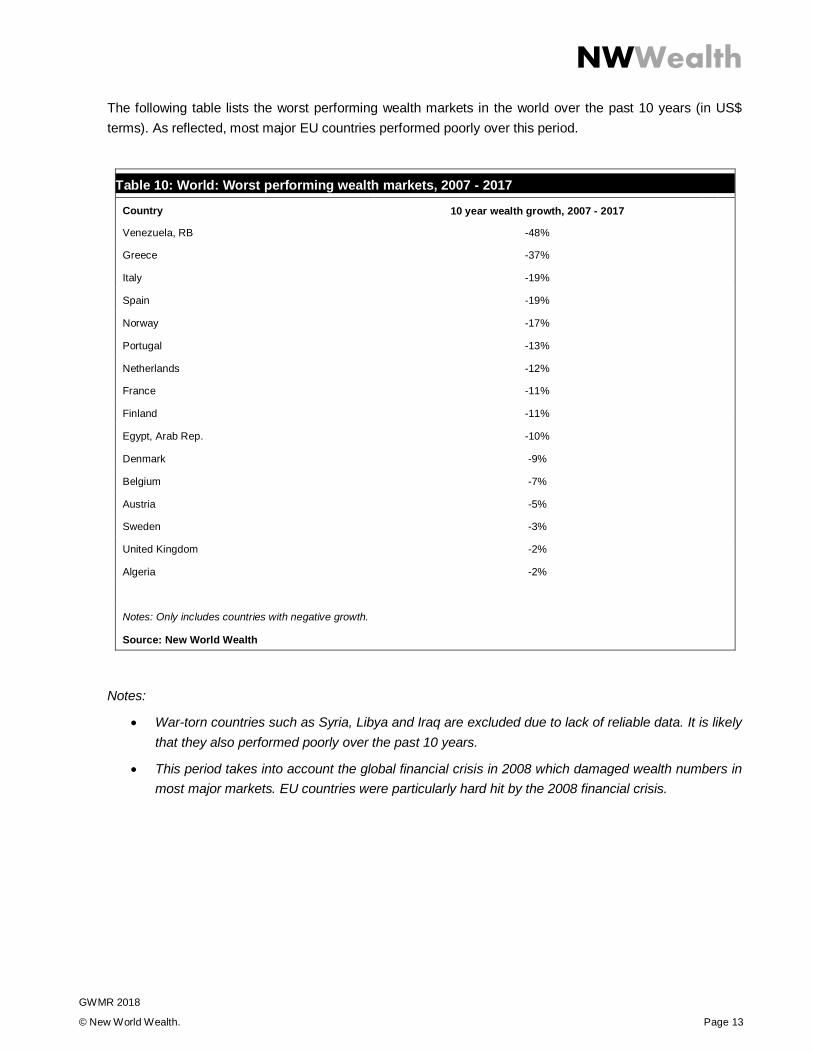
The following table lists the worst performing wealth markets in the world over the past 10 years (in US$
terms). As reflected, most major EU countries performed poorly over this period.
Table 10: World: Worst performing wealth markets, 2007 - 2017
Country 10 year wealth growth, 2007 - 2017
Venezuela, RB -48%
Greece -37%
Italy -19%
Spain -19%
Norway -17%
Portugal -13%
Netherlands -12%
France -11%
Finland -11%
Egypt, Arab Rep. -10%
Denmark -9%
Belgium -7%
Austria -5%
Sweden -3%
United Kingdom -2%
Algeria -2%
Notes: Only includes countries with negative growth.
Source: New World Wealth
Notes:
War-torn countries such as Syria, Libya and Iraq are excluded due to lack of reliable data. It is likely
that they also performed poorly over the past 10 years.
This period takes into account the global financial crisis in 2008 which damaged wealth numbers in
most major markets. EU countries were particularly hard hit by the 2008 financial crisis.
NWWealth
GWMR 2018
© New World Wealth. Page 14
3.3 Future trends
Global wealth is expected to rise by 50% over the next decade, reaching US$321 trillion by 2027. This will
again be driven by strong growth in Asia. The fastest growing wealth markets are expected to be:
Sri Lanka: Safe country, good educational standard and English speaking. Should benefit from
strong growth in the local technology, manufacturing, real estate, healthcare and financial services
sectors (10 year wealth growth forecast: 200%).
India: Large number of entrepreneurs, good educational system and English speaking. Strong
growth forecast in the local financial services, IT, business process outsourcing, real estate,
healthcare and media sectors (10 year wealth growth forecast: 200%).
Vietnam: Emerging manufacturing hub of Asia. Vietnam was the fastest growing wealth market in
the world over the past decade and is expected to continue to grow strongly. We expect Vietnam
wealth numbers to be boosted by strong growth in the local healthcare, manufacturing and financial
services sectors (10 year wealth growth forecast: 200%).
China: Expected to benefit from strong growth in the local hi-tech, financial services, entertainment
and healthcare sectors (10 year wealth growth forecast: 180%).
Mauritius: Safe country, business friendly and has low tax rates when compared to the rest of Africa.
Hotspot for migrating HNWIs. We expect it to benefit from strong growth in the local financial services
sector (10 year wealth growth forecast: 150%).
Note: Forecast growth rates rounded to nearest 10%.
Cities to look out for:
Colombo, Sri Lanka.
Pune, India.
Hyderabad, India.
Bangalore, India.
Mumbai, India.
Delhi, India.
Kolkata, India.
Ho Chi Minh City, Vietnam.
Hangzhou, China.
Port Louis, Mauritius.
NWWealth
GWMR 2018
© New World Wealth. Page 15
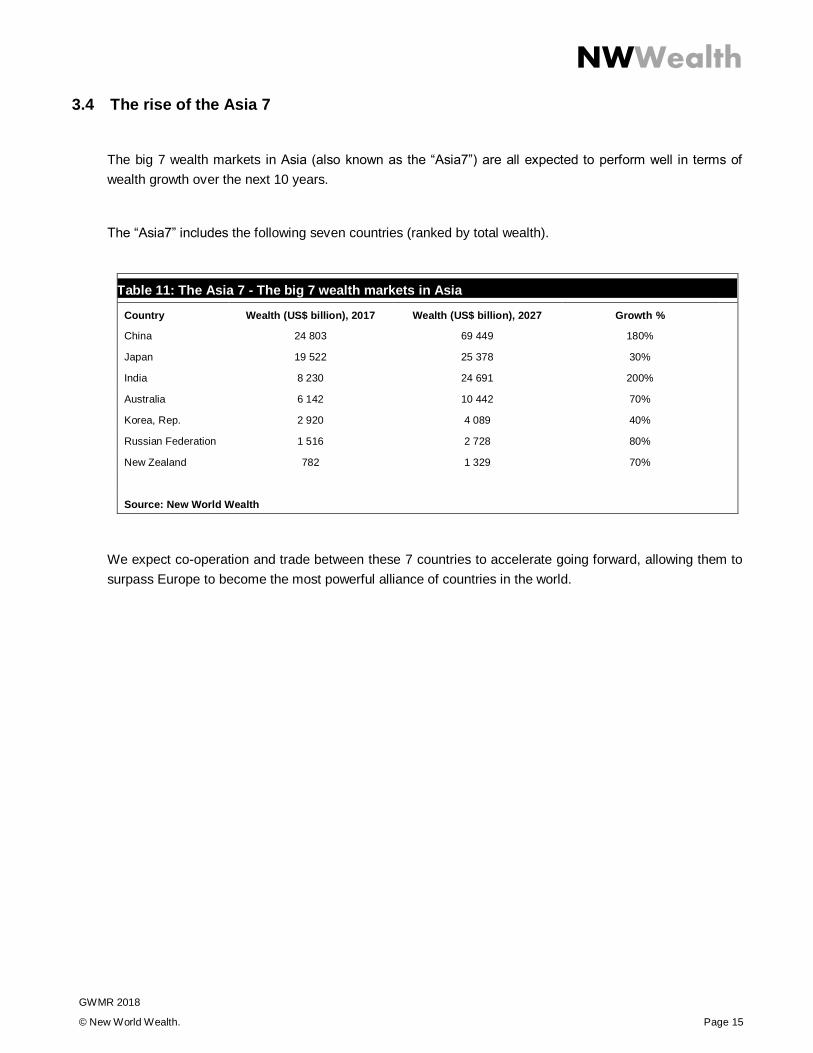
3.4 The rise of the Asia 7
The big 7 wealth markets in Asia (also known as the “Asia7”) are all expected to perform well in terms of
wealth growth over the next 10 years.
The “Asia7” includes the following seven countries (ranked by total wealth).
Table 11: The Asia 7 - The big 7 wealth markets in Asia
Country Wealth (US$ billion), 2017 Wealth (US$ billion), 2027 Growth %
China 24 803 69 449 180%
Japan 19 522 25 378 30%
India 8 230 24 691 200%
Australia 6 142 10 442 70%
Korea, Rep. 2 920 4 089 40%
Russian Federation 1 516 2 728 80%
New Zealand 782 1 329 70%
Source: New World Wealth
We expect co-operation and trade between these 7 countries to accelerate going forward, allowing them to
surpass Europe to become the most powerful alliance of countries in the world.
NWWealth
GWMR 2018
© New World Wealth. Page 16
4 Wealth inequality
4.1 Wealth inequality by country
As part of this report, we examined the level of wealth inequality in major countries globally. We did this by
looking at the proportion of wealth controlled by millionaires (HNWIs) – the higher the proportion the more
unequal the country is. For instance, if HNWIs control over 40% of a country’s wealth then there is very little
space for a meaningful middle class. Ideally the ratio should be less than 30%.
The most equal countries in the world (based on % of country’s wealth held by HNWIs):
Japan (23%)
New Zealand (26%)
Norway (27%)
Australia (28%)
Canada (28%)
Germany (28%)
Sweden (28%)
Denmark (29%)
South Korea (29%)
Finland (29%)
Japan’s low ratio is assisted by:
A large middle class or “mass affluent” community of over 35 million people. “Mass affluent” refer to
individuals with net assets of between US$100,000 and US$1 million.
A small number of billionaires. Japan has only 35 billionaires which is well below the likes of USA,
China, India, Russia and UK.
Very few “super-billionaires” (i.e billionaires with over US$10 billion). Only 3 of Japan’s 35 billionaires
are worth over US$10 billion and the wealthiest person in Japan is worth around US$20 billion (which
means he does not even make it into the top 30 wealthy people worldwide).
NWWealth
GWMR 2018
© New World Wealth. Page 17
The most unequal countries in the world (based on % of country’s wealth held by HNWIs):
Saudi Arabia (60%)
Russia (58%)
Nigeria (56%)
Brazil (53%)
Turkey (52%)
Other notable economies worldwide (based on % of country’s wealth held by HNWIs):
USA (36%)
UK (36%)
China (40%)
India (48%)
Worldwide average (35%).
Another interesting measure is the proportion of a country’s wealth held by billionaires. Russia tops this list
with 24% of total Russian wealth held by billionaires. Japan again is the most equal with billionaires only
controlling 3% of total wealth there.
NWWealth
GWMR 2018
© New World Wealth. Page 18
4.2 Relationship between population density and wealth per capita
During our analysis we noticed that countries with low population densities such as Canada and Australia are
some of richest countries in the world on a wealth per capita (wealth per person) basis, whereas densely
populated countries such as Nigeria, Ethiopia, Bangladesh and Pakistan are some of the poorest.
Rainfall also has an effect here as some countries are able to sustain more people due to higher rainfall -
Ethiopia for example is very dry which makes it difficult for it to sustain such a large number of people (over
90 million) at a reasonable standard of living.
Ofcourse, there are exceptions to the rule that high population density = low per capita wealth. Prominent
examples include Hong Kong, Monaco, Liechtenstein, Luxembourg and Singapore (all financial hubs), which
are all relatively wealthy on a per capita basis despite their high population densities.
Notably, among the W10: Canada and Australia have relatively low population densities when compared to
the other countries on the list. We expect this to assist these two countries in future.
Reasons why a lower population density is good in our view:
Less dependence on other countries for trade and resources.
Less competition for land and resources within country.
Less waste and pollution. Water reserves are better - river systems less impacted.
Allows for more wild spaces. Wildlife has better opportunity to thrive, which improves quality of life for
locals.
NWWealth
GWMR 2018
© New World Wealth. Page 19
5 The wealthiest cities worldwide
5.1 World cities
We recently examined the top cities worldwide by total wealth held. Results reflected below.
Note: “Total wealth” refers to the private wealth held by all the individuals living in each city. It includes all
their assets (property, cash, equities, business interests) less any liabilities. We exclude government funds
from our figures.
Top 15 cities:
1. New York City: Total wealth held in the city amounts to US$3.0 trillion. Home to the two largest stock
exchanges in the world (Dow Jones and NASDAQ). Areas around New York such as Connecticut
and Long Island also contain a large amount of wealth that is not included in this figure.
2. London: Total wealth held in the city amounts to US$2.7 trillion. Home to the 6th largest stock
exchange in the world. Small towns around London such as Windsor, Ascot, Virginia Water,
Leatherhead, Weybridge, Henley, Marlow and Bray also contain a large amount of wealth that is not
included in this figure.
3. Tokyo: Total wealth held in the city amounts to US$2.5 trillion. Tokyo is home to the 3rd largest stock
exchange in the world.
4. San Francisco Bay area: Total wealth held in the area amounts to US$2.3 trillion. Figures include:
San Francisco, Silicon Valley, San Jose, Oakland, Palo Alto, Los Altos, Redwood City, Moraga, San
Mateo and Mountain View.
5. Beijing: Total wealth held in the city amounts to US$2.2 trillion. Beijing is the official capital city of
China and is home to the head offices of most of China’s largest companies.
6. Shanghai: Total wealth held in the city amounts to US$2.0 trillion. Shanghai is considered to be the
“Financial Capital of China” and is home to the Shanghai stock exchange, the largest stock exchange
in China and the 4th largest in the world.
7. Los Angeles: Total wealth held in the city amounts to US$1.4 trillion. Our figures for Los Angeles
include wealth held in Los Angeles, Malibu and Beverley Hills.
8. Hong Kong: Total wealth held in the city-state amounts to US$1.3 trillion. Hong Kong is considered
to be the gateway between Europe and Asia and it is home to the 7th largest stock exchange in the
world.
9. Sydney: Total wealth held in the city amounts to US$1.0 trillion. Sydney is one of the top financial
centers in Asia and has become one of the most sought after destinations for the world’s super-rich
due to its lifestyle, safety and climate. Major industries include financial services, real estate, IT,
tourism, retail and media.
10. Singapore: Total wealth held in the city-state amounts to US$1.0 trillion. Singapore is known to be
one of the most business friendly countries in the world and has particularly low tax rates.
NWWealth
GWMR 2018
© New World Wealth. Page 20
11. Chicago: Total wealth held in the city amounts to US$988 billion. Strong in a large number of sectors.
Major industries include transportation, financial services (insurance), FMCG and manufacturing.
12. Mumbai: Total wealth held in the city amounts to US$950 billion. Mumbai is the economic hub of
India. It is also home to the Bombay Stock Exchange (BSE), the 12th largest stock exchange in the
world. Major industries in the city include: financial services, real estate and media.
13. Toronto: Total wealth held in the city amounts to US$944 billion. Toronto is home to the 9th largest
stock exchange in the world. Major industries include financial services, real estate, IT, media and
telecoms.
14. Frankfurt: Total wealth held in the city amounts to US$912 billion. Frankfurt is home to the 11th
largest stock exchange in the world and is the financial capital of mainland Europe. Major industries
include financial services and professional services.
15. Paris: Total wealth held in the city amounts to US$860 billion. Major industries include financial
services, real estate and manufacturing (automotive, luxury consumables).
Notable cities that just missed out on top 15 include: Houston, Geneva, Osaka, Seoul, Shenzhen, Melbourne,
Zurich and Dallas.
Performance:
Among the 15 cities listed:
San Francisco, Beijing, Shanghai, Mumbai and Sydney were the fastest growing in terms of wealth
growth over the past 10 years.
Going forward, Mumbai is expected to be the fastest growing city (in terms of wealth growth over the
next 10 years).
NWWealth
GWMR 2018
© New World Wealth. Page 21
5.2 Spotlight on Chinese cities
Top cities:
Beijing: See top 15 world cities list.
Shanghai: See top 15 world cities list.
Shenzhen: Total wealth held in the city amounts to US$770 billion. Located next to Hong Kong,
Shenzhen is considered to be the “Hi-tech Capital of China”. It is also home to the Shenzhen stock
exchange, the 2nd largest stock market in China and 8th largest in the world. Notably, tech company
Huawei is based in the city.
Hangzhou: Total wealth held in the city amounts to US$425 billion. Many wealthy people that work
in nearby Shanghai, have homes in Hangzhou as it is considered to be more scenic than Shanghai.
Hangzhou’s high ranking on this list is notable as it is only the 10th largest city in China by GDP.
Hangzhou is also the fastest growing major city in China (in terms of wealth growth over the past
decade). Notably, media and retail company Alibaba is based in the city.
China total:
Total wealth held in the country amounts to US$25 trillion (as of December 2017). Note: these figures exclude
wealth held in Special Administrative Region’s such as Hong Kong and Macau.
China growth prospects:
Over the next decade, China is expected to benefit from strong growth in the local hi-tech, financial services,
entertainment and healthcare sectors.
In the hi-tech sector, China is moving away from being a component manufacturer towards finished products
(example: Huawei). If more companies such as Huawei come along, China could soon take over from the
United States as the dominant player in the global hi-tech sector. Hi-tech sector growth is critical to any
economy as it a primary sector that generates exports and other sectors can feed off of it (i.e. a bigger hi-tech
sector leads to a bigger financial services sector and so forth). The hi-tech sector also offers good salaries
and high quality jobs, which boosts the middle class.
In the entertainment sector, Chinese made films are beginning to break into the top 10 grossing films
worldwide, with films such as the Mermaid (2016) and Wolf Warrior 2 (2017). Growing box office receipts are
a good indicator of a growing middle class, so this is a particularly good sign for China.
NWWealth
GWMR 2018
© New World Wealth. Page 22
6 Wealth migration trends
6.1 The immigration debate
Is HNWI immigration good or bad for the destination country?
This is a complicated discussion that often depends on one’s political ideology. For instance, democrats
(liberals) in the US tend to be pro-immigration, whilst republicans (conservatives) tend to be anti-immigration.
It is important to note that many of the traditional arguments against immigration (i.e. that immigrants place
pressure on public healthcare and social services and that they push down wages due to oversupply of cheap
labor) do not apply to wealthy people as HNWIs are unlikely to take low paying jobs and they are very unlikely
to claim benefits. In fact, most HNWIs send their children to private schools without relying on state funding
and pay for their own housing and medical needs without state support.
Also, there are only 15 million wealthy people (HNWIs) worldwide, so taking in some of these individuals is
unlikely to create the over-population problems that were mentioned in section 4.2.
In our view, the only possible negative of taking in a wealthy person is that they can push property prices up
to levels that locals cannot afford. However, there are controls that can be put in place to prevent this from
getting out of hand, such as those introduced in Australia which prevent foreigners from buying ‘second-hand
homes’ (i.e. foreigners can only buy newly built homes). This essentially forces these foreigners to sell their
properties to locals at a price that locals can afford, which means prices should not be inflated (as there is no
point in them paying $2 million for a house that they can only sell for $1 million).
NWWealth
GWMR 2018
© New World Wealth. Page 23
6.2 Countries with large inflows of HNWIs in 2017
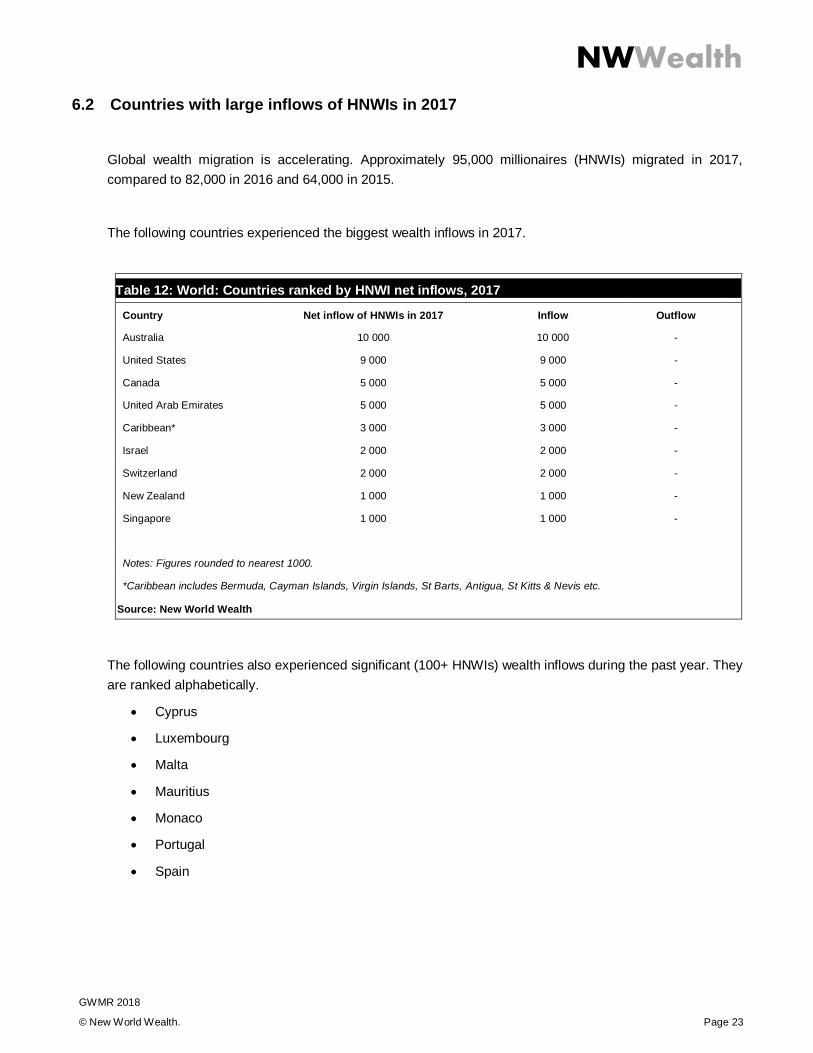
Global wealth migration is accelerating. Approximately 95,000 millionaires (HNWIs) migrated in 2017,
compared to 82,000 in 2016 and 64,000 in 2015.
The following countries experienced the biggest wealth inflows in 2017.
Table 12: World: Countries ranked by HNWI net inflows, 2017
Country Net inflow of HNWIs in 2017 Inflow Outflow
Australia 10 000 10 000 -
United States 9 000 9 000 -
Canada 5 000 5 000 -
United Arab Emirates 5 000 5 000 -
Caribbean* 3 000 3 000 -
Israel 2 000 2 000 -
Switzerland 2 000 2 000 -
New Zealand 1 000 1 000 -
Singapore 1 000 1 000 -
Notes: Figures rounded to nearest 1000.
*Caribbean includes Bermuda, Cayman Islands, Virgin Islands, St Barts, Antigua, St Kitts & Nevis etc.
Source: New World Wealth
The following countries also experienced significant (100+ HNWIs) wealth inflows during the past year. They
are ranked alphabetically.
Cyprus
Luxembourg
Malta
Mauritius
Monaco
Portugal
Spain
NWWealth
GWMR 2018
© New World Wealth. Page 24
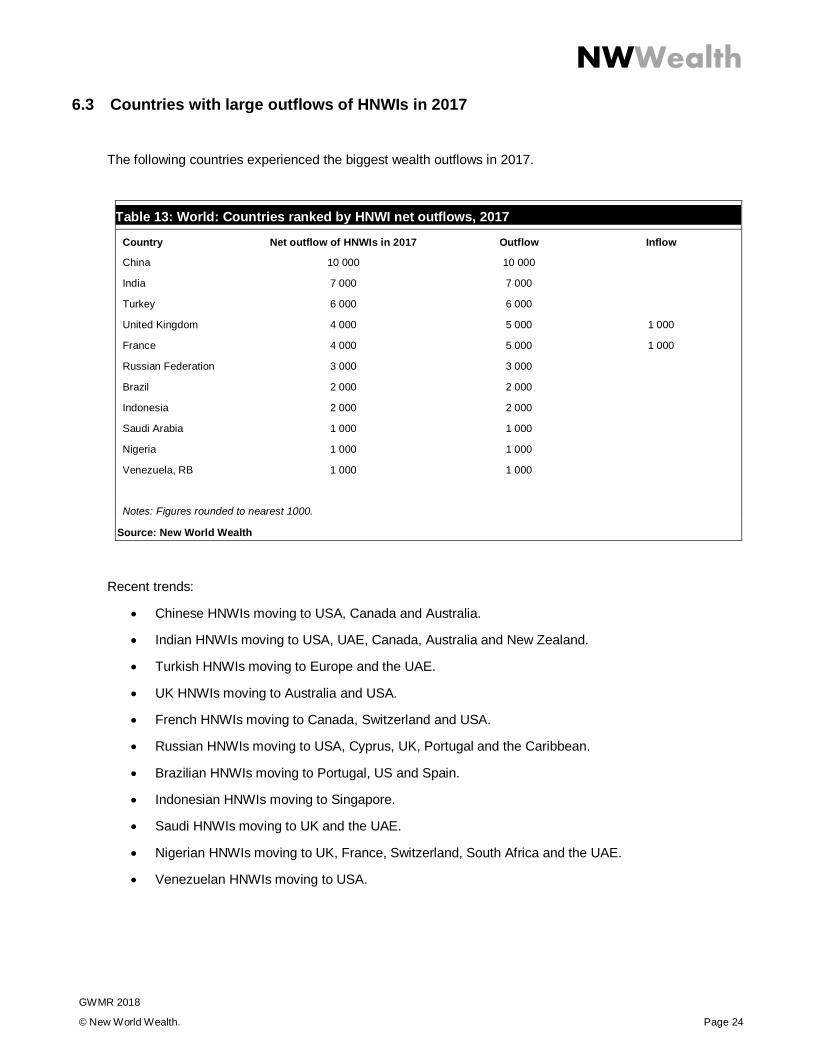
6.3 Countries with large outflows of HNWIs in 2017
The following countries experienced the biggest wealth outflows in 2017.
Table 13: World: Countries ranked by HNWI net outflows, 2017
Country Net outflow of HNWIs in 2017 Outflow Inflow
China 10 000 10 000
India 7 000 7 000
Turkey 6 000 6 000
United Kingdom 4 000 5 000 1 000
France 4 000 5 000 1 000
Russian Federation 3 000 3 000
Brazil 2 000 2 000
Indonesia 2 000 2 000
Saudi Arabia 1 000 1 000
Nigeria 1 000 1 000
Venezuela, RB 1 000 1 000
Notes: Figures rounded to nearest 1000.
Source: New World Wealth
Recent trends:
Chinese HNWIs moving to USA, Canada and Australia.
Indian HNWIs moving to USA, UAE, Canada, Australia and New Zealand.
Turkish HNWIs moving to Europe and the UAE.
UK HNWIs moving to Australia and USA.
French HNWIs moving to Canada, Switzerland and USA.
Russian HNWIs moving to USA, Cyprus, UK, Portugal and the Caribbean.
Brazilian HNWIs moving to Portugal, US and Spain.
Indonesian HNWIs moving to Singapore.
Saudi HNWIs moving to UK and the UAE.
Nigerian HNWIs moving to UK, France, Switzerland, South Africa and the UAE.
Venezuelan HNWIs moving to USA.
NWWealth
GWMR 2018
© New World Wealth. Page 25
6.4 Country spotlights
Australia dominates
Australia was the top country worldwide for HNWI inflows in 2017, beating out its main rival the US for the
third year running.
Popular places for them to move to in Australia included: Sydney, Melbourne, Gold Coast, Sunshine Coast,
Perth and Brisbane.
Reasons why migrating HNWIs may be preferring Australia to the US:
Australia’s location makes it a better base for doing business in emerging Asian countries such as
China, Japan, South Korea, Hong Kong, Singapore and Vietnam.
Safety. Australia was recently rated as the safest country for woman worldwide during our annual
woman safety ratings (see section 9.2). Australia is also a particularly safe country to raise children
(although some describe it as a nanny state with too many rules).
Australia has lower inheritance taxes than the US.
Problems in the US healthcare industry. In the US, getting healthcare insurance can be difficult for
incoming HNWIs. Notably, several international medical aids cover patients in all developed countries
with the exception of the US (which is a big warning sign). In particular, the Affordable Care Act
enacted in 2010 has not turned out well for wealthy and middle class patients in the US, with average
premiums rising by over 120% since the act was passed in 2010.
Australia’s superior growth over the past decade has also no doubt had an impact on confidence and business
opportunities – over the past 10 years, total wealth held in Australia has risen by 83% compared to 20%
growth in the US. As a result, the average Australian is now significantly wealthier than the average US
citizen, which was not the case 10 years ago.
Notably, there is a trend of large European, American and Asian companies setting up offices in Australia,
which assists the businessmen in charge of these companies in moving to Australia via work transfers.
USA still a steady performer
The US was the second most popular destination for migrating HNWIs in 2017. Popular places for them to
move to in the US included: New York City, Los Angeles, Seattle and the San Francisco Bay area (including
San Francisco, Palo Alto, Silicon Valley etc.).
NWWealth
GWMR 2018
© New World Wealth. Page 26
Canada also performs well
Like Australia and the US, Canada also performed well in 2017, boosted by steady HNWI migration into
Vancouver, Toronto, Calgary and Montreal (Quebec).
UK spotlight
Over the past 30 years, the United Kingdom has been one of the biggest recipients of migrating HNWIs.
However, this trend changed in 2017 when the country experienced its first major HNWI net outflow. Although
around 1,000 HNWIs came into the UK during the year, this was more than cancelled out by a bigger outflow
of around 5,000 HNWIs, resulting in a net outflow of around 4,000 HNWIs for the year.
Possible reasons for the UK’s poor performance in 2017:
New taxes on non-doms and foreigners with homes in the UK made it more expensive and more
complicated for migrating HNWIs to buy homes in the UK.
The UK’s traditionally high inheritance taxes made the likes of Australia and the US more appealing
to migrating HNWIs (post Brexit). Notably, Australia has no inheritance taxes, whilst in the US the
inheritance tax threshold is much higher than in the UK. Note: the US is now talking about scrapping
inheritance taxes all together which would make the UK even more unappealing to HNWIs.
Several European HNWIs living in the UK moved back to their home countries in 2017, possibly due
to Brexit. Furthermore, relatively few new HNWIs came into the country during the year when
compared to previous years.
Rising crime levels and rising religious tensions, especially in London (see below).
Concerns for London
London has experienced a steady rise in incidents of rape, terrorism, acid attacks and woman trafficking over
the past few years. Religious tensions and anti-semitism are also at an all-time high in the city.
London was obviously a hotspot for migrating HNWIs for many years. However, this trend appears to have
changed over the past couple years as migrating HNWIs now prefer moving to safer “international cities” such
as Sydney, Melbourne, New York and San Francisco. “International cities” refer to first world cities which
attract business people from all over the world. They tend to have English as their main language.
In last year’s report, we highlighted the fact that many wealthy Londoners were moving out of the city to small
affluent towns such as Bray, Taplow and Marlow. This is a notable trend that is gaining momentum. A large
number of wealthy Londoners are also leaving the UK altogether – many of these individuals are going to the
US and Australia.
NWWealth
GWMR 2018
© New World Wealth. Page 27
China and India outflows not a concern
The outflows of HNWIs from these countries are not particularly concerning as they are still producing far
more new HNWIs than they are losing. Also, once the standard of living in these countries improves, we
expect several wealthy people to move back.
Over-taxation in Europe
Over-taxation has become a problem in most major European countries. In particular, inheritance taxes are
very high in France and the United Kingdom (around 40%). This could be one of the reasons why many
HNWIs are now moving away from these countries.
Problems in Turkey
Turkey experienced a significant outflow of HNWIs in 2017. This is the second straight year that over 5,000
HNWIs have left the country. These outflows are very concerning as Turkey is not producing many new
HNWIs to replace the ones that are leaving. As a result, the total number of HNWIs living in the country is
declining all the time.
Note: loosing HNWIs is normally a very bad sign and generally shows serious problems in a country.
Common reasons why HNWIs leave a country:
Safety - woman and child safety especially.
Lifestyle: climate, pollution, space, nature and scenery.
Financial concerns.
Schooling and education opportunities for their children.
Work and business opportunities.
Taxes.
Healthcare system.
Religious tensions.
Standard of living.
Why do HNWIs leaving a country matter?
Bad sign - HNWIs are often the first people to leave. They have the means to leave unlike middle class
citizens. If one looks at any major country collapse in history, it is normally preceded by a migration of wealthy
people away from that country.
NWWealth
GWMR 2018
© New World Wealth. Page 28
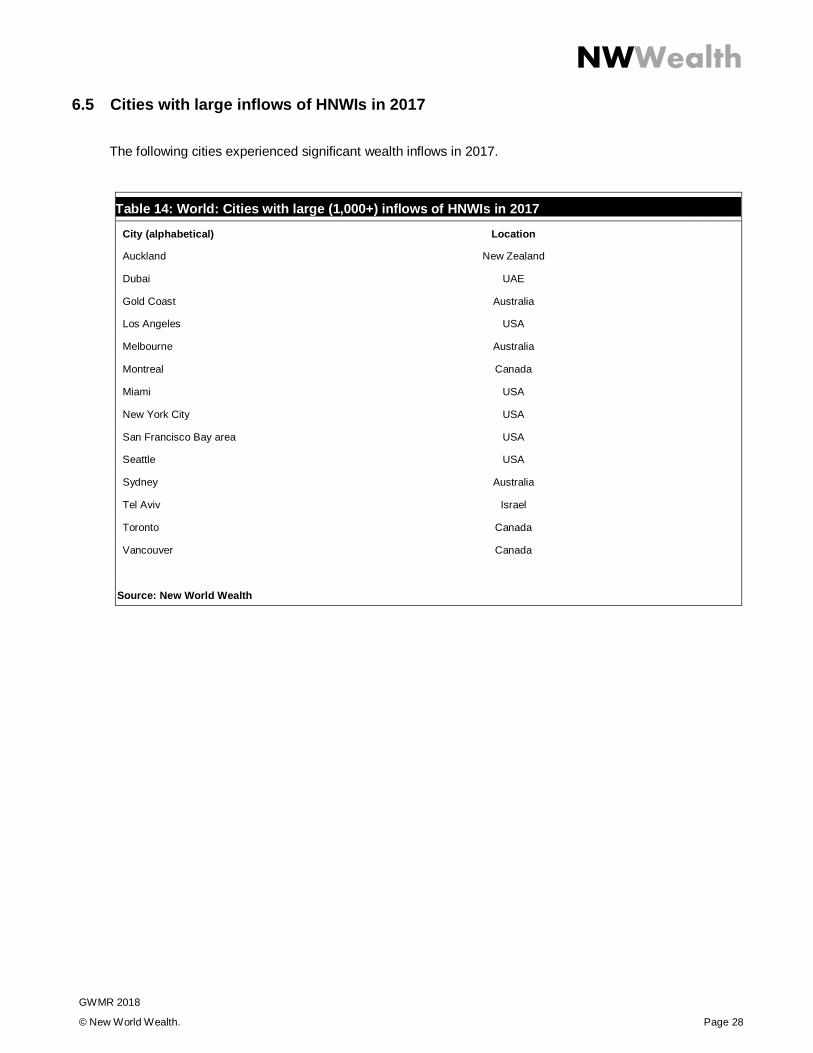
6.5 Cities with large inflows of HNWIs in 2017
The following cities experienced significant wealth inflows in 2017.
Table 14: World: Cities with large (1,000+) inflows of HNWIs in 2017
City (alphabetical) Location
Auckland New Zealand
Dubai UAE
Gold Coast Australia
Los Angeles USA
Melbourne Australia
Montreal Canada
Miami USA
New York City USA
San Francisco Bay area USA
Seattle USA
Sydney Australia
Tel Aviv Israel
Toronto Canada
Vancouver Canada
Source: New World Wealth
NWWealth
GWMR 2018
© New World Wealth. Page 29
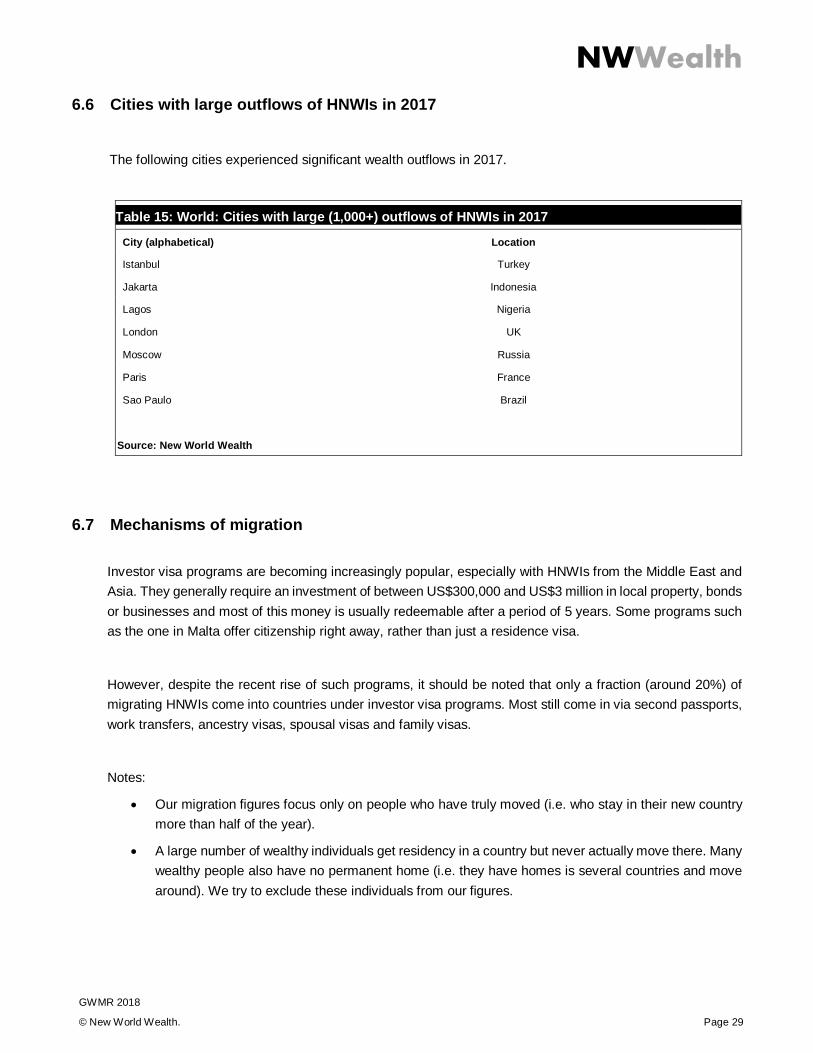
6.6 Cities with large outflows of HNWIs in 2017
The following cities experienced significant wealth outflows in 2017.
Table 15: World: Cities with large (1,000+) outflows of HNWIs in 2017
City (alphabetical) Location
Istanbul Turkey
Jakarta Indonesia
Lagos Nigeria
London UK
Moscow Russia
Paris France
Sao Paulo Brazil
Source: New World Wealth
6.7 Mechanisms of migration
Investor visa programs are becoming increasingly popular, especially with HNWIs from the Middle East and
Asia. They generally require an investment of between US$300,000 and US$3 million in local property, bonds
or businesses and most of this money is usually redeemable after a period of 5 years. Some programs such
as the one in Malta offer citizenship right away, rather than just a residence visa.
However, despite the recent rise of such programs, it should be noted that only a fraction (around 20%) of
migrating HNWIs come into countries under investor visa programs. Most still come in via second passports,
work transfers, ancestry visas, spousal visas and family visas.
Notes:
Our migration figures focus only on people who have truly moved (i.e. who stay in their new country
more than half of the year).
A large number of wealthy individuals get residency in a country but never actually move there. Many
wealthy people also have no permanent home (i.e. they have homes is several countries and move
around). We try to exclude these individuals from our figures.
NWWealth
GWMR 2018
© New World Wealth. Page 30
7 HNWI review
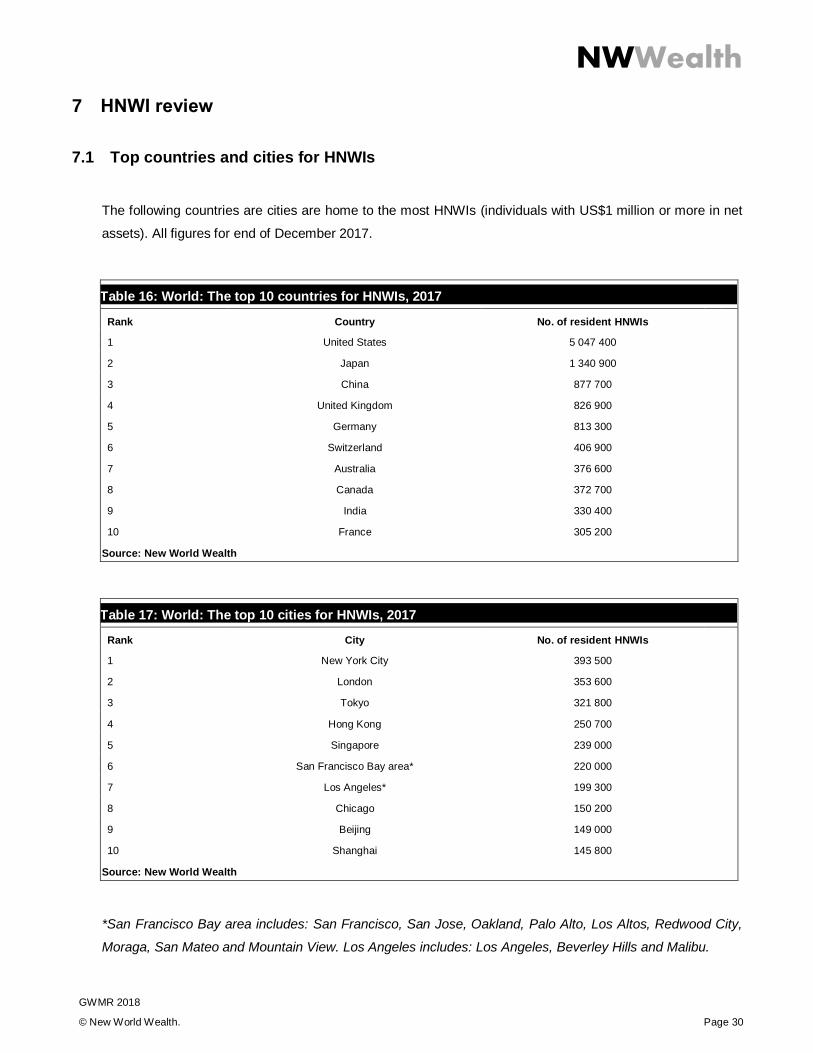
7.1 Top countries and cities for HNWIs
The following countries are cities are home to the most HNWIs (individuals with US$1 million or more in net
assets). All figures for end of December 2017.
Table 16: World: The top 10 countries for HNWIs, 2017
Rank Country No. of resident HNWIs
1 United States 5 047 400
2 Japan 1 340 900
3 China 877 700
4 United Kingdom 826 900
5 Germany 813 300
6 Switzerland 406 900
7 Australia 376 600
8 Canada 372 700
9 India 330 400
10 France 305 200
Source: New World Wealth
Table 17: World: The top 10 cities for HNWIs, 2017
Rank City No. of resident HNWIs
1 New York City 393 500
2 London 353 600
3 Tokyo 321 800
4 Hong Kong 250 700
5 Singapore 239 000
6 San Francisco Bay area* 220 000
7 Los Angeles* 199 300
8 Chicago 150 200
9 Beijing 149 000
10 Shanghai 145 800
Source: New World Wealth
*San Francisco Bay area includes: San Francisco, San Jose, Oakland, Palo Alto, Los Altos, Redwood City,
Moraga, San Mateo and Mountain View. Los Angeles includes: Los Angeles, Beverley Hills and Malibu.
NWWealth
GWMR 2018
© New World Wealth. Page 31
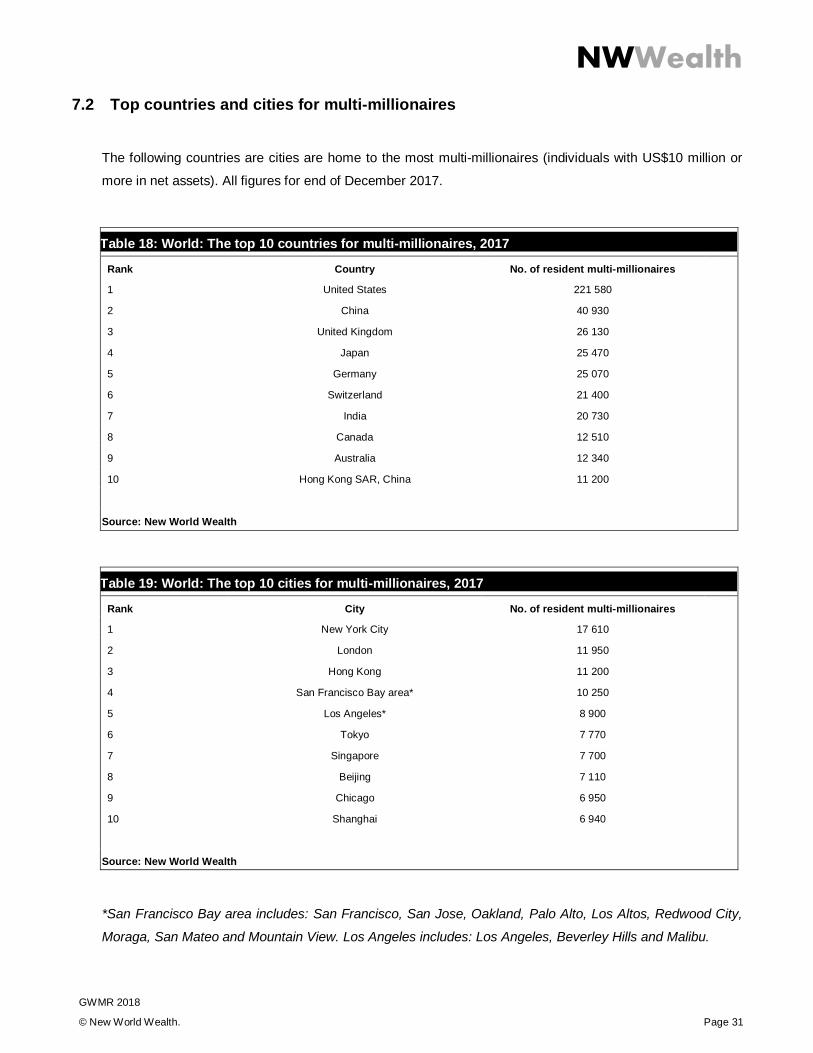
7.2 Top countries and cities for multi-millionaires
The following countries are cities are home to the most multi-millionaires (individuals with US$10 million or
more in net assets). All figures for end of December 2017.
Table 18: World: The top 10 countries for multi-millionaires, 2017
Rank Country No. of resident multi-millionaires
1 United States 221 580
2 China 40 930
3 United Kingdom 26 130
4 Japan 25 470
5 Germany 25 070
6 Switzerland 21 400
7 India 20 730
8 Canada 12 510
9 Australia 12 340
10 Hong Kong SAR, China 11 200
Source: New World Wealth
Table 19: World: The top 10 cities for multi-millionaires, 2017
Rank City No. of resident multi-millionaires
1 New York City 17 610
2 London 11 950
3 Hong Kong 11 200
4 San Francisco Bay area* 10 250
5 Los Angeles* 8 900
6 Tokyo 7 770
7 Singapore 7 700
8 Beijing 7 110
9 Chicago 6 950
10 Shanghai 6 940
Source: New World Wealth
*San Francisco Bay area includes: San Francisco, San Jose, Oakland, Palo Alto, Los Altos, Redwood City,
Moraga, San Mateo and Mountain View. Los Angeles includes: Los Angeles, Beverley Hills and Malibu.

NWWealth
GWMR 2018
© New World Wealth. Page 32
7.3 Top countries and cities for billionaires
The following countries are cities are home to the most billionaires (individuals with US$1 billion or more in net
assets). All figures for end of December 2017.
Table 20: World: The top 10 countries for billionaires, 2017
Rank Country No. of resident billionaires
1 United States 737
2 China 249
3 India 119
4 United Kingdom 103
5 Germany 82
6 Russian Federation 79
7 Hong Kong SAR, China 56
8 Canada 44
9 France 41
10 Australia 36
Source: New World Wealth
Table 21: World: The top 10 cities for billionaires, 2017
Rank City No. of resident billionaires
1 New York City 68
2 Hong Kong 56
3 Beijing 52
4 Shanghai 52
5 London 47
6 Moscow 45
7 San Francisco Bay area* 41
8 Los Angeles* 35
9 Seoul 28
10 Mumbai 28
Source: New World Wealth
*San Francisco Bay area includes: San Francisco, San Jose, Oakland, Palo Alto, Los Altos, Redwood City,
Moraga, San Mateo and Mountain View. Los Angeles includes: Los Angeles, Beverley Hills and Malibu.
NWWealth
GWMR 2018
© New World Wealth. Page 33
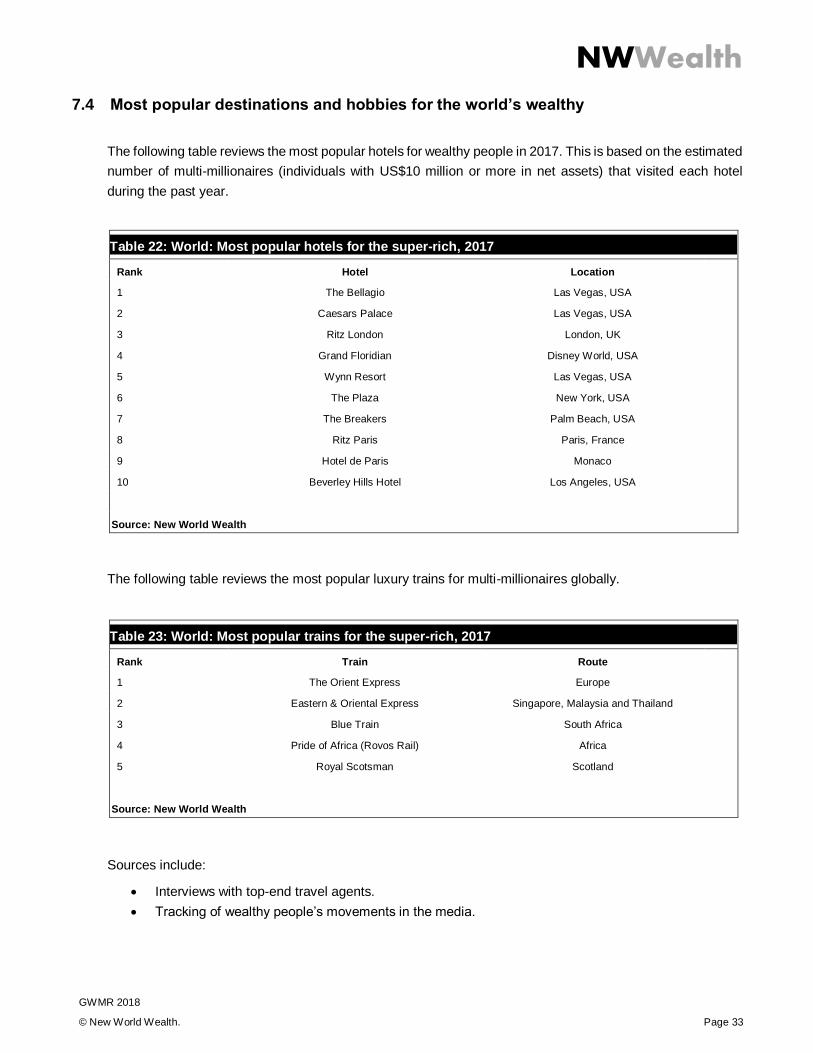
7.4 Most popular destinations and hobbies for the world’s wealthy
The following table reviews the most popular hotels for wealthy people in 2017. This is based on the estimated
number of multi-millionaires (individuals with US$10 million or more in net assets) that visited each hotel
during the past year.
Table 22: World: Most popular hotels for the super-rich, 2017
Rank Hotel Location
1 The Bellagio Las Vegas, USA
2 Caesars Palace Las Vegas, USA
3 Ritz London London, UK
4 Grand Floridian Disney World, USA
5 Wynn Resort Las Vegas, USA
6 The Plaza New York, USA
7 The Breakers Palm Beach, USA
8 Ritz Paris Paris, France
9 Hotel de Paris Monaco
10 Beverley Hills Hotel Los Angeles, USA
Source: New World Wealth
The following table reviews the most popular luxury trains for multi-millionaires globally.
Table 23: World: Most popular trains for the super-rich, 2017
Rank Train Route
1 The Orient Express Europe
2 Eastern & Oriental Express Singapore, Malaysia and Thailand
3 Blue Train South Africa
4 Pride of Africa (Rovos Rail) Africa
5 Royal Scotsman Scotland
Source: New World Wealth
Sources include:
Interviews with top-end travel agents.
Tracking of wealthy people’s movements in the media.
NWWealth
GWMR 2018
© New World Wealth. Page 34
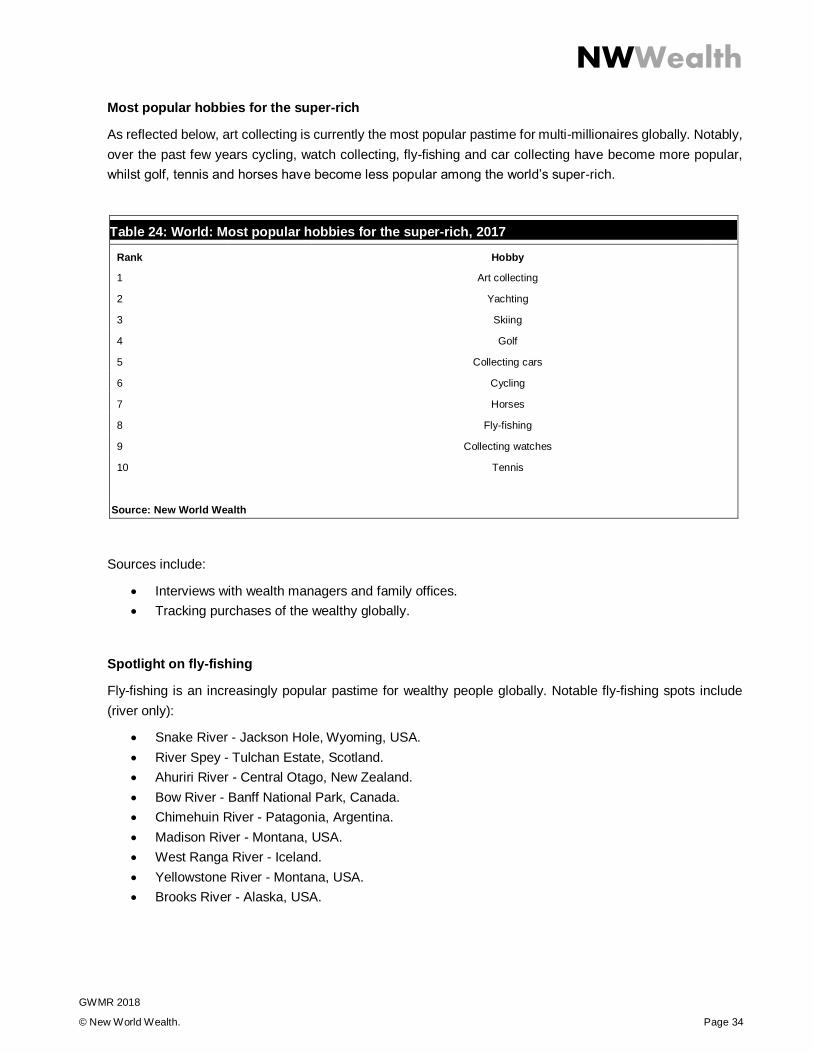
Most popular hobbies for the super-rich
As reflected below, art collecting is currently the most popular pastime for multi-millionaires globally. Notably,
over the past few years cycling, watch collecting, fly-fishing and car collecting have become more popular,
whilst golf, tennis and horses have become less popular among the world’s super-rich.
Table 24: World: Most popular hobbies for the super-rich, 2017
Rank Hobby
1 Art collecting
2 Yachting
3 Skiing
4 Golf
5 Collecting cars
6 Cycling
7 Horses
8 Fly-fishing
9 Collecting watches
10 Tennis
Source: New World Wealth
Sources include:
Interviews with wealth managers and family offices.
Tracking purchases of the wealthy globally.
Spotlight on fly-fishing
Fly-fishing is an increasingly popular pastime for wealthy people globally. Notable fly-fishing spots include
(river only):
Snake River - Jackson Hole, Wyoming, USA.
River Spey - Tulchan Estate, Scotland.
Ahuriri River - Central Otago, New Zealand.
Bow River - Banff National Park, Canada.
Chimehuin River - Patagonia, Argentina.
Madison River - Montana, USA.
West Ranga River - Iceland.
Yellowstone River - Montana, USA.
Brooks River - Alaska, USA.
NWWealth
GWMR 2018
© New World Wealth. Page 35
7.5 Key investment trends for HNWIs in 2017 and beyond
Hotel residences
Originally a New York phenomenon, the hotel residence trend has started to catch on in other major cities
and holiday hotspots around the world. ‘Hotel residences’ refer to apartments/villas in existing hotels which
can be purchased. They essentially allow owners to live in a hotel permanently and enjoy the same services
as normal guests do (i.e. room service, dining, cleaning etc.).
Hotel residences are often difficult to identify such as ‘One Hyde Park’ in London - the apartments there are
essentially hotel residences serviced by the Mandarin Oriental next door.
Reasons for their rising appeal include:
Appeal to those that travel a lot - facilities are maintained whether one is there or not.
Access to services – room service, cleaning.
Access to facilities – pool, spa, entertainment, dining, bar.
Good security and big reception area for meetings.
Unsurprisingly, hotel residences sell at a premium to normal apartments.
Banyan Tree, the St Regis, the Mandarin Oriental, the Four Seasons, the Conrad Hilton and the Ritz Carlton
are the main providers of hotel residences worldwide.
Notable examples:
Mandarin Oriental Residences (One Hyde Park) - London, UK.
The Plaza Pied-a-terre - New York, USA.
St Regis Residences - New York, USA.
Four Seasons Private Residences - Seychelles.
Ten Trinity Square - London, UK.
Baccarat Residences - New York, USA.
Palazzo Tornabuon - Florence, Italy.
NWWealth
GWMR 2018
© New World Wealth. Page 36
Residential estates
Residential estates are another growing segment. Reasons for their rising popularity include:
Security - access gate, private security personnel.
Activities – gym, swimming pool, golf, horse riding, skiing, tennis.
Lifestyle and community - parks, gathering places, children playgrounds, schools.
Limited and controlled traffic - safer for children.
Residential estates can be tricky to define. The easiest ones to define are golf estates. Countries with large
numbers of golf estates include: Portugal, Spain, South Africa and USA (mainly Florida area). They are also
becoming increasingly popular in UAE, New Zealand, Mauritius, Mexico and the UK.
By our definition, residential estates encompass golf estates, equestrian estates, parkland estates, wildlife
estates and retirement estates.
Notable examples:
Yellowstone Club - Big Sky, Montana, USA.
Wentworth Golf Estate - Surrey, UK.
Royal Palm Yacht and Country Club - Boca Raton, Florida, USA.
Jumeirah Golf Estates - Dubai, United Arab Emirates.
Quinta do Lago - Algarve, Portugal.
PGA Catalunya Resort - Spain.
Bighorn Golf Estate - Palm Desert, USA.
Kukio - Hawaii, USA.
Millbrook Estate - New Zealand.
Jacks Point - New Zealand.
Fancourt - South Africa.
Quivira Los Cabos - Mexico.
Monte Rei - Algarve, Portugal.
NWWealth
GWMR 2018
© New World Wealth. Page 37
Art
New World Wealth estimates that global HNWIs held US$75 billion worth of fine art at the end of 2017. This
includes paintings, sculptures etc. According to our in-house indices, global fine art prices have risen by 12%
over the past 10 years (US$ terms). Although this is not spectacular growth, art remains one of the key
investments for HNWIs now and in the future.
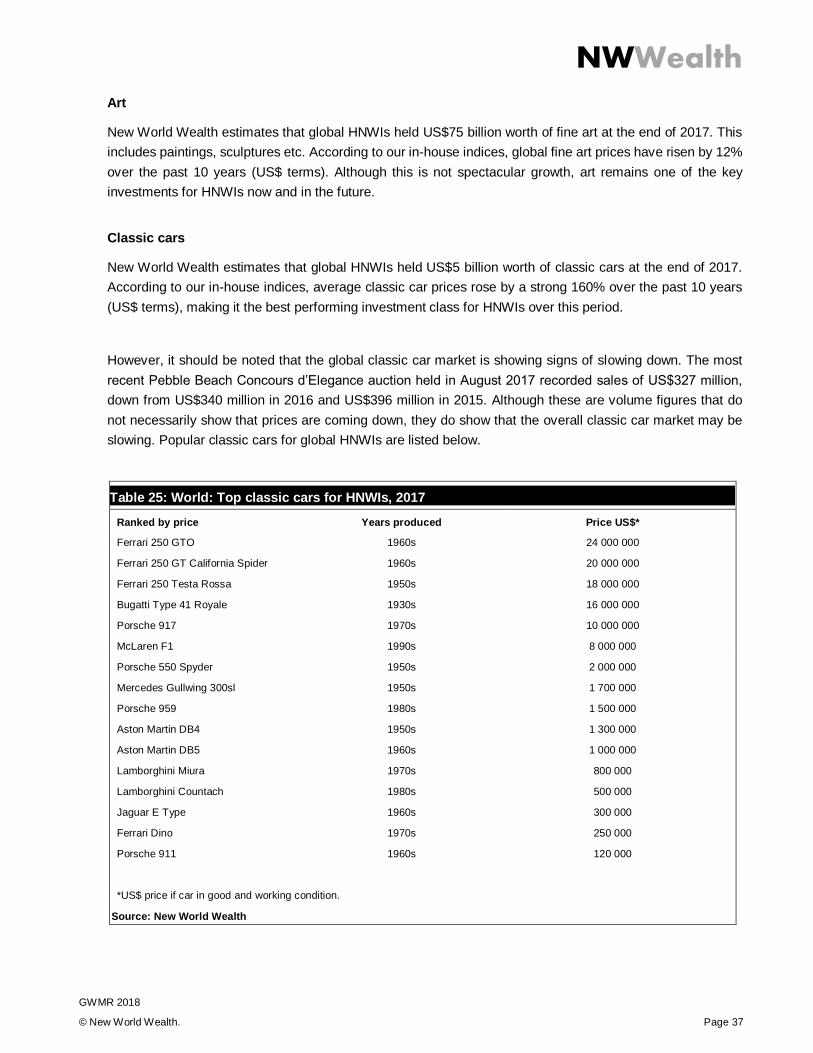
Classic cars
New World Wealth estimates that global HNWIs held US$5 billion worth of classic cars at the end of 2017.
According to our in-house indices, average classic car prices rose by a strong 160% over the past 10 years
(US$ terms), making it the best performing investment class for HNWIs over this period.
However, it should be noted that the global classic car market is showing signs of slowing down. The most
recent Pebble Beach Concours d’Elegance auction held in August 2017 recorded sales of US$327 million,
down from US$340 million in 2016 and US$396 million in 2015. Although these are volume figures that do
not necessarily show that prices are coming down, they do show that the overall classic car market may be
slowing. Popular classic cars for global HNWIs are listed below.
Table 25: World: Top classic cars for HNWIs, 2017
Ranked by price Years produced Price US$*
Ferrari 250 GTO 1960s 24 000 000
Ferrari 250 GT California Spider 1960s 20 000 000
Ferrari 250 Testa Rossa 1950s 18 000 000
Bugatti Type 41 Royale 1930s 16 000 000
Porsche 917 1970s 10 000 000
McLaren F1 1990s 8 000 000
Porsche 550 Spyder 1950s 2 000 000
Mercedes Gullwing 300sl 1950s 1 700 000
Porsche 959 1980s 1 500 000
Aston Martin DB4 1950s 1 300 000
Aston Martin DB5 1960s 1 000 000
Lamborghini Miura 1970s 800 000
Lamborghini Countach 1980s 500 000
Jaguar E Type 1960s 300 000
Ferrari Dino 1970s 250 000
Porsche 911 1960s 120 000
*US$ price if car in good and working condition.
Source: New World Wealth
NWWealth
GWMR 2018
© New World Wealth. Page 38
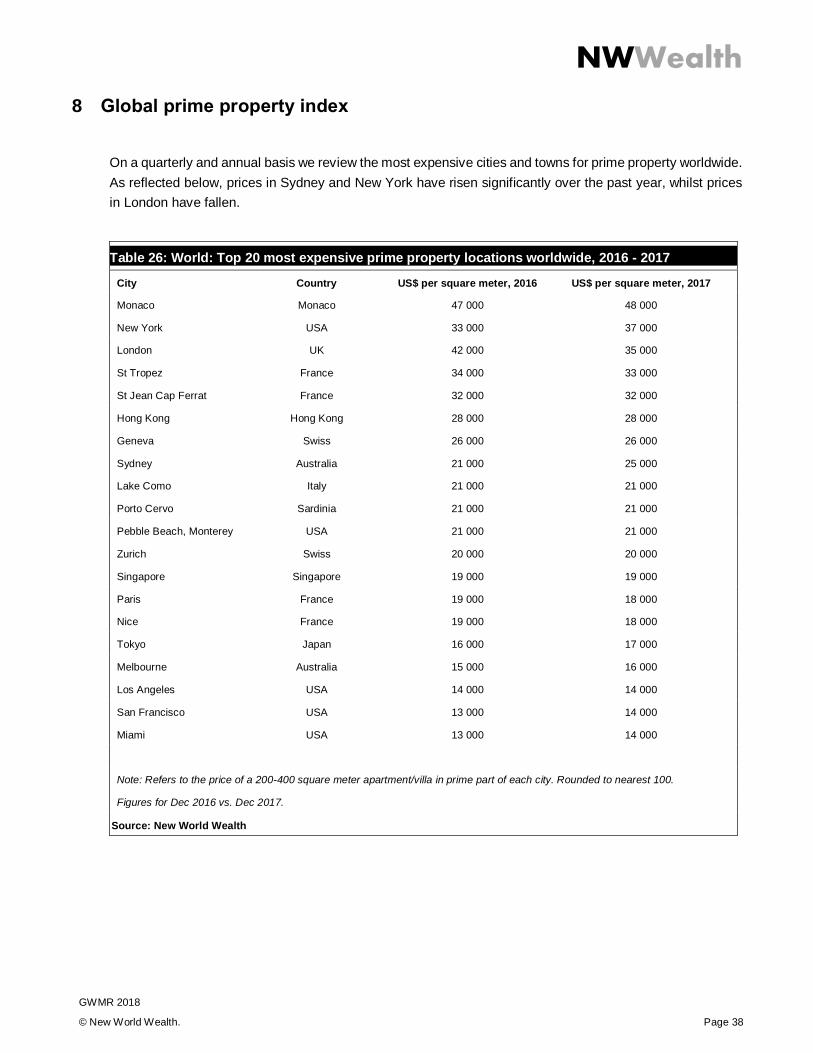
8 Global prime property index
On a quarterly and annual basis we review the most expensive cities and towns for prime property worldwide.
As reflected below, prices in Sydney and New York have risen significantly over the past year, whilst prices
in London have fallen.
Table 26: World: Top 20 most expensive prime property locations worldwide, 2016 - 2017
City Country US$ per square meter, 2016 US$ per square meter, 2017
Monaco Monaco 47 000 48 000
New York USA 33 000 37 000
London UK 42 000 35 000
St Tropez France 34 000 33 000
St Jean Cap Ferrat France 32 000 32 000
Hong Kong Hong Kong 28 000 28 000
Geneva Swiss 26 000 26 000
Sydney Australia 21 000 25 000
Lake Como Italy 21 000 21 000
Porto Cervo Sardinia 21 000 21 000
Pebble Beach, Monterey USA 21 000 21 000
Zurich Swiss 20 000 20 000
Singapore Singapore 19 000 19 000
Paris France 19 000 18 000
Nice France 19 000 18 000
Tokyo Japan 16 000 17 000
Melbourne Australia 15 000 16 000
Los Angeles USA 14 000 14 000
San Francisco USA 13 000 14 000
Miami USA 13 000 14 000
Note: Refers to the price of a 200-400 square meter apartment/villa in prime part of each city. Rounded to nearest 100.
Figures for Dec 2016 vs. Dec 2017.
Source: New World Wealth
NWWealth
GWMR 2018
© New World Wealth. Page 39
9 Drivers of wealth growth
9.1 Factors that encourage wealth growth
Based on our research, the top factors that encourage wealth growth in a country include:
Strong safety & security - woman and child safety is particularly important.
Strong ownership rights - Zimbabwe offers a case in point as to what happens when ownership
rights are stripped – once assets are taken away they tend to lose value as no one is willing to buy
anything.
Strong economic growth - economic growth is usually linked to wealth growth.
A well-developed banking system and stock market - insures that people invest and grow their
wealth locally. Also insures that GDP growth leads to wealth growth.
Free and independent media - allows for the dissemination of accurate information to investors.
Low level of government intervention – government tampering in the business sector creates large
inefficiencies within an economy. Government owned enterprises and parastatals are also a problem.
Low income tax and company tax rates - Dubai and Singapore are examples of the power that tax
rates can have in encouraging business formation – both have very low tax rates.
Ease of investment - barriers such as exchange controls inhibit wealth growth.
Low level of trade union involvement - large trade unions deter businesses from hiring workers.
Wealth migration - the migration of HNWIs to the country.
NWWealth
GWMR 2018
© New World Wealth. Page 40
9.2 Woman safety index
On an annual basis, we review the safest countries for woman worldwide. Woman safety has become very
topical over the past year, following several high profile celebrity assault cases in the US. Notably, woman
safety is one of the best ways to gauge a country’s long term wealth growth potential, with a correlation of
92% between historic wealth growth and woman safety levels. This means that wealth growth is boosted by
strong levels of woman safety in a country.
Safest countries:
The 10 safest countries for woman worldwide during the past year (2017) were:
1. Australia
2. Malta
3. Iceland
4. New Zealand
5. Canada
6. Poland
7. Monaco
8. Israel
9. USA
10. South Korea
The safest countries in each region were:
Europe: Malta, Poland, Monaco, Iceland.
Asia Pacific: Australia, New Zealand, Sri Lanka, Japan, South Korea.
Middle East: Israel, UAE.
Africa: Mauritius, Botswana, Namibia.
Americas: USA, Canada.
Additional findings:
We expect emerging markets with good woman safety levels to be some of the world’s top performers
in terms of wealth growth over the next 10 years. For instance, countries such as Mauritius and Sri
Lanka (which have good levels of woman safety) are both expected to perform very well (in terms of
wealth growth) going forward.
NWWealth
GWMR 2018
© New World Wealth. Page 41
Most of the countries in our top 10 are also popular destinations for migrating HNWIs. Also, most of
them have experienced strong wealth growth over the past 10-20 years.
Least safe countries:
The least safe countries in the world for woman in 2017 included the likes of Somalia, Sudan, Iraq and Syria.
Some of the world’s big economies such as Nigeria also made the list. Notably, most of these markets have
performed poorly in terms of wealth growth over the past few years, which is probably linked to their low
woman safety levels. Furthermore, many of the migrant boats crossing the Med to Europe had a large number
of citizens from these countries on them which shows that people are fleeing these countries in search of
safer places to live.
Crimes considered in this study included:
Rape.
Slavery of woman.
Trafficking of woman.
General assaults on woman (physical assaults, acids attacks etc.)
Notes:
Results based on the % of each country’s population that has been a victim of one of these crimes
over the past year.
Countries with unreliable crime statistics were excluded from top 10.
NWWealth
GWMR 2018
© New World Wealth. Page 42
10 About New World Wealth
New World Wealth is a global market research group, based in Johannesburg, South Africa. We specialize
in ratings, surveys, country reports and wealth statistics.
Services on offer include:
Ratings and surveys.
Country, city and regional wealth statistics.
Residential property surveys.
Wealth migration studies.
Management consulting.
Custom research.
Media ratings.
Our wealth statistics leverage off our in-house HNWI database, which comprises dossiers on over 150,000
HNWIs from around the world.
We provide comprehensive wealth statistics on 90 countries and 125 cities worldwide.
For more information on New World Wealth please visit www.newworldwealth.com.
NWWealth
GWMR 2018
© New World Wealth. Page 43
Contact
Andrew Amoils
New World Wealth
+27 11 706 1185
www.newworldwealth.com