global urban indicators database version 2 · the global urban indicators database version 2...
TRANSCRIPT

GLOBAL URBAN INDICATORS DATABASE
Version 2
Global Urban Observatory United Nations Human Settlements Programme (UN - Habitat)

NOTE
The designation and presentation of material in this publication do not imply the expression of any opinion whatsoever on the part of the secretariat concerning the legal status of any country, city, or territory concerning the delimitation of its frontiers or boundaries.
UNITED NATIONS PUBLICATION HS/637/01E
ISBN 92-1-131627- 8
Any questions or comments concerning this product should be addressed to: Coordinator Global Urban Observatory United Nations Human Settlements Programme (UN - Habitat) P. O. Box 30030 - Nairobi, Kenya Tel: (254 02) 623050 - Fax: (254 02) 623080 Email: [email protected] http://www.unhsp.org/guo

iii
TABLE OF CONTENTS
Page
List of Acronyms ......................................................................................... iv
1. INTRODUCTION ........................................................................................1 Overview .......................................................................................................1 Databases .....................................................................................................1 Data collection ..............................................................................................2
2. THE CITY DEVELOPMENT INDEX ......................................................3
3. REGIONAL DATA ANALYSIS ...............................................................4 Tenure ............................................................................................................4 Infrastructure ...............................................................................................13 Health and education ..................................................................................15 Gender-gaps ................................................................................................16 Crime ............................................................................................................17 Regional disparity of urban poor households .........................................18 Water ...........................................................................................................22 Waste management ....................................................................................23 Economic and workforce issues ...............................................................25 Transport .....................................................................................................25 Local government .......................................................................................27
ANNEX: Calculating the CDI ...................................................................30

iv
LIST OF ACRONYMS CDI - City Development Index GDP - Gross Domestic Product GUID1 - Global Urban Indicators Database Version 1 GUID2 - Global Urban Indicators Database Version 2 GUO - Global Urban Observatory HH - Household HIC - Highly Industrialised Countries LAC - Latin America and the Caribbean
1
1. INTRODUCTION Overview The Urban Indicators Programme of the United Nations Human Settlements Programme (UN- Habitat) was established in 1988, as the Housing Indicators Programme, to address the urgent global need to improve the base of urban knowledge by helping countries and cities design, collect and apply policy-oriented indicators data. Following the success of the Housing Indicators Programme, in 1993 the programme moved towards the broader issue of sustainable urban development, as the Urban Indicators Programme, in preparation for the Habitat II Conference in 1996. The Habitat Agenda is the principal policy document that resulted from the Habitat II conference. Resolutions 15/6 and 17/1 of the United Nations Commission on Human Settlements called for a mechanism to monitor global progress in the implementation of the Habitat Agenda. The Global Urban Observatory (GUO) was established to monitor global progress in the implementation of the Habitat Agenda. To achieve the above the GUO developed a system of indicators composed of twenty-three key urban indicators and a list of nine qualitative data subsets. These form the minimum data required for reporting on shelter and urban development consistent with the twenty key areas of commitment of the Istanbul+5 Universal Reporting Format. Consequently, the urban indicators provide a comprehensive means for monitoring, evaluating and reviewing global urban conditions, trends and issues through a gender perspective and an adequate tool for evaluating the implementation of the Habitat Agenda. Databases The first Global urban indicators database namely Global Urban Indicators Database Version 1 (GUID1) was launched following the Habitat II conference in 1996. Key indicators used in this database were endorsed by the commission on Human Settlements in May 1995 and were collected in 237 cities, the year of reference being 1993. This database was one of the successful attempts in representing urban indicators in a truly global perspective. During the statistical analysis of the ensuing data, a City Development Index (CDI) was derived to assist in ranking cities along their level of development and as a baseline for comparative display of indicators depicting urban conditions. In the mean time, the urban indicators used in the GUID1 were reviewed to enhance the assessment of urban conditions during the Istanbul+5 conference in 2001. Consequently, a survey was carried out in 1998, five years after the 1993 survey, to collect data on urban indicators based on the Istanbul+5 Universal Reporting Format. The resulting database is the Global Urban Indicators Database version 2 (GUID2). GUID2 database has captured key indicators from 232 cities in 113 countries. The database is aimed at assessing and evaluating urban conditions and trends between 1993 and 1998. Indicators were received from 6 regions as shown in Table 1.

2
Table 1. Indicators received, cities and countries, by Region.
Region Cities Countries Africa 55 32 Arab states 16 14 Asia 28 15 Highly Industrialised 38 10 Latin America & Caribbean 53 20 Transition 42 22 Total 232 113
As for the 1993 collection, there is a substantial under-sampling of the highly industrialised countries, where for many indicators there are not enough cities to be statistically representative. There are also no cities from the largest countries, India and China. The LAC region has been over-sampled, with a number of small cities surveyed, and also Africa. Data collection Data collection for the compilation of the GUID2 was collected through a collaborative effort between UN-Habitat, governmental and non-governmental organizations and consultants at the city and country levels. Ten GUO partners, under the close supervision of UN-Habitat, facilitated data collection. These partners are: • Arab Towns Organization (ATO) • Asian Institute of Technology AIT) • City-Region-Household (CRH) • Ecole Africaine des Métiers de l'Architecture et de l'Urbanisme (EAMAU) • Environnement et Développement du Tiers-monde (ENDA) • International Council on Local Environmental Initiatives (ICLEI) • Metropolitan Research Institute (MRI) • Society for Development Studies (SDS) • Urban Management Programme, Eastern and Southern Africa (UMP-SA) • Urban Management Programme, Latin America and the Caribbean (UMP-LAC) Data collection was guided by the principle that data collected should be the best available, the latest available and fully documented. Therefore, data collectors were asked to make use of latest available secondary data for indicators, wherever possible, and to document their sources. In absence of this, data collectors were advised to apply other estimation techniques to obtain best estimates and provide footnotes if data provided was for anything other than the stated definition. Further, data collectors were asked to follow guidelines provided by the International Statistics Yearbook 1998, International Monetary Fund, in the conversion of local currencies to United States dollars.
3
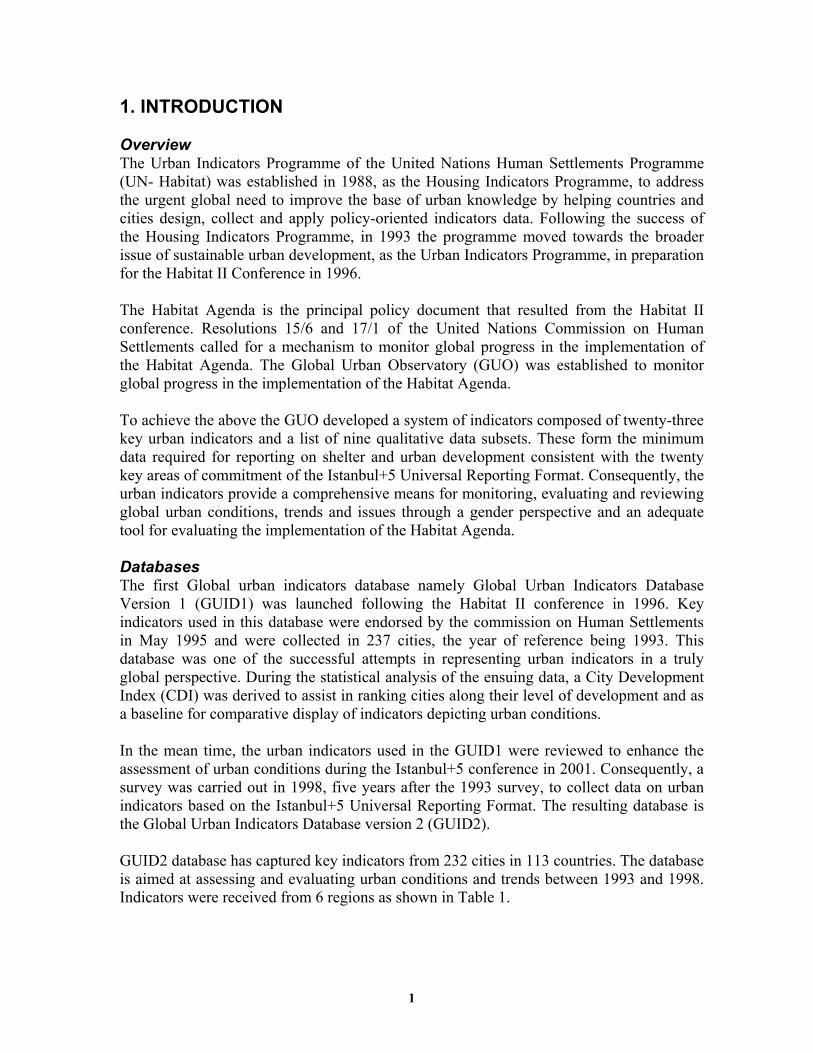
2. THE CITY DEVELOPMENT INDEX The City Development Index (CDI), originally developed in 1997, has been modified based on the improved data collected in the present survey and on experience in calculating and using the Index for the Asian Development Bank, carried out in 1999 in 18 Asian cities, Cities Data Book and on the latest version of the United Nations Development Programme (UNDP) Human Development Index. The CDI continues to be the best single measure of the level of development in cities. Details on the calculation of the modified index are presented in the Annex. The annex also shows CDI values and for a sample of 162 cities. As previously, the CDI is based on five subindices namely City Product, Infrastructure, Waste, Health and Education. The average values of each subindex for the different regions are shown in Table 2a and are plotted in Figure 1.
Table 2a. Components of the City Development Index, by region Region CDI City Product Infrastructure Waste Health Education
Africa 42.85 49.69 36.17 26.04 50.39 51.96Arab States 64.55 66.52 69.79 45.87 77.18 63.39Asia-Pacific 65.35 62.9 67.75 44.4 78.27 73.43HIC 96.23 90.6 99.21 100 94.26 97.1LAC 66.25 62.93 70.42 39.5 82.71 75.68Transitional 78.59 71.62 90.64 55.93 85.8 88.94
Figure 1. Components of the City Development Index
0
20
40
60
80
100CDI
City Product
Infrastructure
Waste
Health
Education
HICTransitionalAsia-PacificAfrica

4
Figure1 shows the comparative size of the various components of the City Development Index for four regions. Although the regions are generally ordered from least developed to most developed, there are also particular areas in which regions are relatively weak. Overall, the transitional cities are good in most social and physical infrastructure categories but are weak in incomes and economic product. Africa has a particular weakness in physical infrastructure. Waste disposal is a problem throughout the developing world. 3. REGIONAL DATA ANALYSIS For analysis purposes, indicators received from cities in the 6 regions were classified as shown in Table 3a. The table also shows the total population and urban populations of these regions. Regional analysis was performed in April 2001 based on reports received from cities. More data has since been received hence the complete database contains 232 cities as indicated by Table 1.
Table 3a. Sample size by region compared with total national and urban populations.
Region Cities* Sample Countries Regional Population Urban population Africa 29 17.70% 45 568 9.90% 186 7.00%Arab States 14 8.50% 17 256 4.50% 144 5.40%Asia-Pacific 28 21.30% 34 1884 32.90% 657 24.70%HIC 9 3.70% 17 784 13.70% 607 22.80%LAC 48 29.30% 33 496 8.70% 370 13.90%Transitional 36 19.50% 24 1747 30.50% 696 26.20%TOTAL 164 100% 170 5735 100% 2660 100% * This number includes 13 cities from the Asian Development Bank Cities Data Book, which had data collected on the same basis. These are included in the CDI analysis but not in other tables.
TENURE Housing tenure Housing tenure tends to be institutional in nature and therefore will differ strongly between otherwise similar countries according to the regulatory framework, subsidies or controls applied to various sectors, the existence of mortgage finance, income distribution, urban growth, and land use planning controls. It therefore shows different patterns both between and within the broad regions of the world as depicted by Table 3b.
Table 3b. Housing tenure
Region1 Owned MortgagedPrivate
rent SocialSub-
tenant Squatter Homeless OtherAfrica 40.8% 3.4% 31.3% 5.2% 4.5% 9.3% 1.0% 4.5%Asia-Pacific 61.4% 3.6% 23.4% 0.9% 0.3% 2.1% 1.5% 6.8%LAC 60.6% 5.5% 19.2% 3.1% 0.9% 6.6% 2.9% 1.2%Transitional 60.7% 2.6% 4.4% 25.0% 0.3% 2.9% 1.2% 2.9%All developing 57.1% 4.0% 17.2% 10.3% 1.4% 5.1% 1.6% 4.3%
Note 1. No tenure information was provided in the Arab States (except Algiers) or in HIC

5
Privatisation The major change in housing tenure is in the Transitional countries, where social housing has fallen from 44% to 25% of the total. Overall, the ownership level has risen from around 40% to almost 60%in these cities. As Table 4 shows, this has been due to wholesale privatisation in some countries like Estonia, Armenia, Yugoslavia and Moldova, rapid privatisation in Croatia, Latvia and the Russian Federation, where ownership has doubled, and slower or more uneven changes in Poland, Mongolia, Laos and the Czech Republic. Private rental and mortgages have increased somewhat in the region (from 3.5% to 4.5%, and from 1.2% to 3.1% respectively), and homelessness has also increased (from 0.35% to 1.2%). Those countries which privatised early, such as Bulgaria and Slovenia, have seen a slight fall in ownership as new entrants to the housing market find it difficult to locate affordable housing. This trend can be expected to accelerate throughout the region.
Table 4. Privatisation of public housing, transitional cities
1993 1998 City Country Owner-
shipSocial
housingOwner-
ship Social
housingSofia Bulgaria 84.3% 83.2% 13.7% 12.8%Ljubljana Slovenia 80.0% 14.0% 77.0% 15.0%Vilnius Lithuania 70.0% 19.0% 84.4% 3.6%Gdansk Poland 52.9% 0.0% 63.0% 37.0%Zagreb Croatia 44.0% 34.5% 89.5% 2.5%Belgrad Yugoslavia 39.2% 53.9% 84.7% 3.6%Omsk Russian Federation 30.0% 70.0% 63.0% 36.7%Tallinn Estonia 25.0% 75.0% 91.8% 0.3%Astrakhan Russian Federation 25.0% 75.0% 51.5% 48.5%Kostroma Russian Federation 19.0% 81.0% 60.5% 39.5%Nizhny Novgorod Russian Federation 19.0% 81.0% 46.0% 54.0%Chisinau Moldova 17.9% 54.2% 75.0% 20.0%Yerevan Armenia 13.7% 86.3% 97.5% 2.5%Riga Latvia 13.4% 77.3% 24.7% 52.9%Prague Czech Republic 10.3% 71.1% 13.6% 52.4%Veliky Novgorod Russian Federation 7.0% 93.0% 37.4% 62.6%Ulaanbaatar Mongolia 0.0% 54.6% 18.2% 33.4%
Mortgage finance The development of mortgage finance has been patchy as demonstrated by Table 5. It has fallen away in parts of Latin America such as Brazil, Chile, Colombia, Ecuador, Nicaragua, Paraguay and San Salvador, where it had been established to different degrees. It has also diminished in Thailand, where a strong system has weakened, and in a few African countries subject to unrest, such as the Congo. Some countries such as Bangladesh, Indonesia, the Czech Republic, Lithuania, Croatia and Cuba have been able to

6
introduce housing finance or extend it to smaller cities, while others like Ghana, Uganda, Zimbabwe and Jordan have been able to expand their mortgage system.
Table 5. Proportion of dwellings with mortgages
City Country Region 1993 1998Zagreb Croatia Transitional 1.0% 17.0%Entebbe Uganda Africa 4.0% 14.0%Vilnius Lithuania Transitional 0.0% 6.0%Ljubljana Slovenia Transitional 20.0% 25.0%Cienfuegos Cuba LAC 0.0% 4.0%Amman Jordan Arab States 6.8% 10.1%Gweru Zimbabwe Africa 10.0% 13.0%Kumasi Ghana Africa 1.2% 3.2%Tangail Bangladesh Asia-Pacific 0.0% 1.2%Jakarta Indonesia Asia-Pacific 0.0% 1.1%Prague Czech Republic Transitional 0.0% 1.0%Cajamarca Peru LAC 2.3% 2.7%Lima Peru LAC 0.5% 0.6%Armenia Colombia LAC 4.0% 3.8%Asuncion Paraguay LAC 1.2% 0.1%Guayaquil Ecuador LAC 9.9% 8.6%Leon Nicaragua LAC 3.3% 1.7%Santo Andre Brazil LAC 11.3% 9.2%Recife Brazil LAC 8.9% 6.7%Vina del mar Chile LAC 13.3% 10.9%Quito Ecuador LAC 12.9% 9.5%San Salvador El Salvador LAC 30.9% 26.2%Brazzaville Congo Africa 10.5% 5.7%Chiang Mai Thailand Asia-Pacific 24.0% 17.0%Kinshasa Dem. Rep. of Congo Africa 11.2% 2.3%
Private rental Private rental is the main alternative to home ownership throughout much of the world. A viable private rental sector provides formal sector accommodation not only to those with transient lifestyles, but also to those with limited resources who would not otherwise be able to afford formal sector housing. The viability of the sector is limited in many countries by the existence of rent control regimes that discourage supply increases. Private rental is dominant in cities in a diverse group of countries, including Germany, France, Denmark, many cities in Canada and USA; the Republic of Korea, Indonesia, Bangladesh and parts of India in Asia; Belize, Columbia and Jamaica in LAC; and in most African countries. The subtenant category continues to be significant largely in sub-Saharan Africa, particularly in Southern Africa, Uganda and Guinea, and has probably been underestimated by some cities in the present sample. Backyard shacks and other forms of subletting are commonplace throughout much of sub-Saharan Africa. Some German and Venezuelan

7
cities, Trinidad and Kuwait, also have significant proportions of subtenants. Subletting appears also to be on the increase in transitional countries. Squatter housing and homelessness Squatter housing generally divides into housing of poor quality or impermanent materials, and more established housing which may have been in place for a long period but has no official title to the land. In some countries such as Indonesia, Bangladesh, Kenya or parts of India, most squatter housing is rented from informal sector landlords, while in other places such as Latin America, it is typically occupied without cost. Data on squatter housing is often unreliable, since by definition informal housing is not recorded. However, the incidence of squatter housing does appear to be rising, with 25 cities (10 in LAC, 8 transitional) reporting an increase and 14 cities (7 in LAC, 5 in Africa) a decrease. There may also have been an increase in homelessness, with 14 cities reporting an increase (6 of which are Transitional) and 5 cities a decrease in numbers. House and Land Price Housing and land prices both reflect the availability of land compared with demand. The house price to income ratio and land development multipliers are notoriously dependent on restrictions on land and housing markets, taking high values in places where land use is restricted or markets undeveloped. The rent to income ratio usually depends on various forms of rent control. House price to income The house price to income ratio is the quotient of median house value (including land) divided by median annual income. It is intended that all housing in the city should be included, both formal and informal; however it is often difficult to establish price ranges for the latter.
Table 6. House price comparison of 1993 values for Habitat II and Istanbul +5 surveys.
Habitat II 1993 Istanbul +5 1993
Region House price to income
ratio
House Rent to Income
ratio
House price to income
ratio
House Rent to Income
ratio Africa 6.9 27.3% 10.6 30.3% Arab States 9.7 17.8% *14.4 *24.0% Asia Pacific 9.4 23.7% 8.7 **82.0% HIC 4.4 18.9% *5.1 *24.5% LAC 3.8 20.2% 5.8 32.1% Transitional 12.2 4.4% 9.2 9.6%
Note: * = not significant. ** = Asian figures include several cities in Korea, where most rent payments involve very substantial “key moneys” which may be a significant proportion

8
of the price of the dwelling. Table 6 shows that the current survey has obtained significantly higher values for housing costs in 1993 in most regions, compared with the earlier Habitat II survey. This appears to be due to the different cities in the sample, and to undocumented changes in methodology, especially with regard to the treatment of informal housing. In particular, the present survey has obtained higher average values for African cities than are usual. House price to income. The house price to income ratio is generally regarded as the best measure of pressure on housing markets, and ratios of 3 to 5 are regarded as “normal” or satisfactory. Variations in the house price-to-income ratio may be due either to changes in house prices or in incomes. Overall, 66 cities reported rising house prices and 33 reported stationary/falling prices. In Africa, generally rising house prices as a result of population pressure and the removal of informal dwellings from the stock have been accompanied by falling incomes in three quarters of cities. Incomes have been falling in most transitional countries also, but this has been accompanied in a majority of cases by falling house prices as populations decline and housing markets begin to develop as shown in Table 7. However, the fall in house prices has not matched the decline in incomes and overall, prices have become less affordable.
Table 7: Number of cities by change in median house price and median household income, 1993-98.
House price increase increase decrease decrease Income Increase decrease increase decrease Africa 5 12 1 3 Arab States 2 1 2 1 Asia Pacific 8 3 3 3 HIC 2 1 2 0 LAC 17 1 6 0 Transitional 6 8 0 12
Table 8. Change in house prices and rents, 1993-1998.
Median house price Household income Price to income
Region 1993 1998 1993 1998 1993 1998Africa1 $13,029.67 $15,832.20 $1,419.33 $1,385.24 10.6 13.3Arab States* $54,731.63 $55,675.70 $5,013.38 $5,177.64 14.4 13.4Asia-Pacific $30,481.91 $39,650.06 $7,354.04 $9,048.50 8.7 7.0HIC* $143,102.17 $134,337.88 $22,384.26 $23,381.78 5.1 4.8LAC $26,873.62 $29,578.60 $4,851.12 $5,278.15 5.8 5.8Transitional $22,094.38 $24,004.55 $3,850.82 $3,453.20 9.2 10.7
Note: * = sample not significant 1. African countries are recording higher values of house price to income than in previous
samples, and it is likely that informal housing has not been handled correctly.

9
Conversely, despite a speculative period in some Asian countries in the early 1990s, incomes in the Asia-Pacific rose faster than house prices up to 1998, with the house price to income ratio falling from 8.7 to 7 on average. In LAC, both incomes and house prices rose in balance in the majority of cities, and the ratio was unchanged as shown in Table 8. House rent to income The general trend in rents by region is similar to that of house prices, except that rents have tended to rise more rapidly than prices as indicated by Table 9.
Table 9: Number of cities by change in median rent and median household income of renters, 1993-98
Rent increase increase decrease decrease Income increase decrease increase decrease Africa 3 9 1 1 Arab States 2 1 0 1 Asia Pacific 3 0 2 0 HIC 1 0 1 1 LAC 14 1 4 0 Transitional 6 16 1 1
Table 10. Changes in rent and household income of renters, 1993-19981.
Median rent Household income
renters Rent to income
ratio Region 1993 1998 1993 1998 1993 1998
Africa $293 $455 $971 $940 30.3% 50.3%Arab States* $1,869 $1,955 $5,683 $6,044 24.0% 24.9%Asia-Pacific2 $4,664 $4,792 $3,543 $4,237 82.0% 71.7%HIC* $4,736 $4,661 $17,458 $17,531 24.5% 27.7%LAC $881 $1,390 $3,098 $3,378 32.1% 38.4%Transitional $325 $500 $3,126 $2,816 9.6% 17.9%
Note:* = sample not significant 1. Includes only those 69 cities for which all numbers were available or could be estimated. 2. Includes a number of Korean cities. In Korea, rents are mostly paid in a lump sum.
In Africa, with increasing pressure on housing markets, rents have risen while incomes have fallen somewhat as depicted in Table 10. Rents are now absorbing a very high proportion of income in many cities. In LAC, rents have also been rising rapidly and are at a high level relative to incomes. As with all previous collections, the transitional countries have the most unusual values, with very low, subsidized rentals, and high dwelling prices because of undeveloped house and land markets. However, housing markets are in the process of normalizing, with falling prices and rising rents. The increasing rents charged for social housing have led to a

10
near-doubling of the rent to income ratio in Transitional cities, though rents remain at a moderate level. Once again, the figures are considerably higher than in the Habitat II survey. This may reflect genuine increases in the ratio, as in the case of Africa and the Transitional countries, but is more likely to be due to inadequacies in the estimation of rents and incomes in either or both surveys.
Table 11. House and land price
Median price of 1 square meter, per median monthly income
Region House price to incomea
House rent to incomea
Highly developed land
Developed land
Undeveloped land
Africa 12.5 39.50% $0.15 $0.07 $0.03 Arab States 10.9 45.40% $0.81 $0.33 $0.08 Asia-Pacific 11.3 34.40% $3.02 $1.04 $0.31 HIC 5.8 19.10% $0.07 .. ..LAC 5.4 31.40% $1.45 $0.31 $0.09 Transitional 6.8 18.20% $0.41 $0.26 $0.06 All developing 8.3 30.40% $1.13 $0.39 $0.11 CDI quintile
1 16.3 41.60% $1.21 $0.53 $0.11 2 6.7 36.80% $0.40 $0.22 $0.09 3 6.4 26.00% $2.12 $0.40 $0.17 4 6.5 23.30% $0.47 $0.23 $0.06 5 6 25.90% $1.51 $0.51 $0.12
Note (a). Averages are different than in earlier tables because they include all cities for
which data are available in 1998, not just cities with data in both 1993 and 1998. Land price Even when adjusted for local variations in income, residential land prices vary a great deal by region. They tend to reflect investment pressure on land resources, which in the developing world is lowest in Africa and highest in Asia-Pacific. Relative land prices are 10-20 times as high in Asia as in Africa, while the Transitional countries are placed somewhere near the geometric mean of the two In the highly industrialized countries, where incomes are much higher, land prices are not all that different from Asia in absolute terms (and far lower in relative terms). The implication is that to some extent, absolute levels of land price in cities around the world are being driven in part by Western income levels and the attractiveness of cities for Western investment.

11
0.01 0.10 1.00 10.00
Africa
Arab States
Asia-Pacific
HIC
LAC
Transitional UndevelopedDevelopedHighly developed
Housing rights Table 12 shows the presence or absence of various kinds of housing rights throughout the world. Some 77% of cities in the sample are in countries having constitutions or national laws that promote the full and progressive realisation of the right to adequate housing. This is particularly strong in the Asia-Pacific region (94%), and somewhat weaker in the HIC (67%). In addition, 64% of cities have laws that include protections against evictions. This is fairly evenly distributed between regions, but slightly lower in Africa and LAC.
Table 12. Housing rights
Region Housing
rights Eviction
protection
Women owning impedi-
ments
Women mortgage
impedi-ments
Impedi-ments to
women own
name
Impedi-ments to
groups owning
Impedi-ments to
groups inheriting
Impedi-ments to
groups mortgage
Africa 79% 55% 41% 70% 31% 56% 44% 37%Arab States 79% 79% 29% 29% 21% 36% 29% 36%Asia-Pacific 94% 76% 24% 24% 24% 24% 24% 24%HIC 67% 67% 11% 0% 0% 11% 0% 0%LAC 75% 56% 24% 11% 34% 32% 27% 38%Transitional 71% 74% 9% 6% 9% 27% 21% 22%All developing 77% 65% 24% 26% 24% 35% 29% 32%CDI quintile
1 80% 63% 34% 59% 43% 52% 52% 34%2 70% 53% 39% 22% 26% 30% 22% 26%3 74% 74% 17% 17% 17% 40% 33% 31%4 83% 73% 11% 11% 15% 11% 4% 27%5 77% 60% 17% 10% 14% 31% 21% 28%
Figure 3. Median land price of a square metre of urban land of various development levels, divided by average annual household income.
12
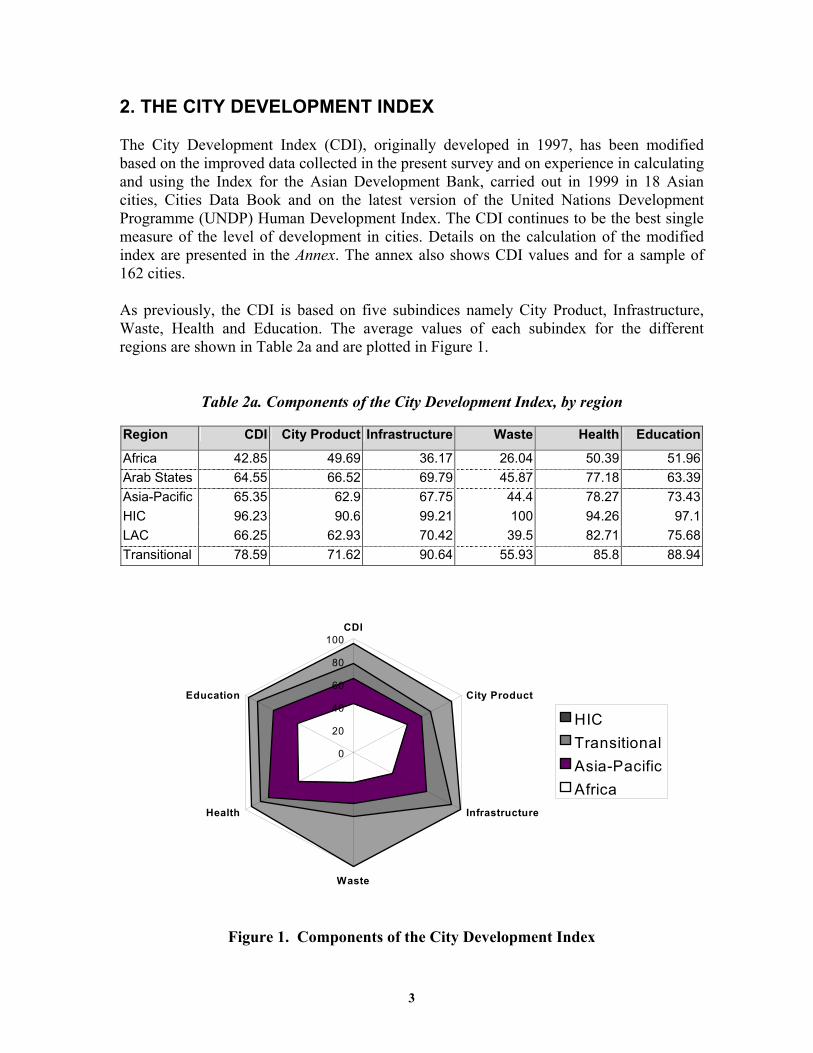
Twenty-nine countries have impediments against women owning property, as shown in Table 13, while thirty-five countries have impediments for other groups.
Table 13. Countries with impediments against owning, inheriting or taking mortgages on property.
Strong impediments Some impediments
Women Burundi Belize Lithuania Central African Republic Cambodia Malawi Congo Brazzaville Chile Morocco Congo, Dem. Rep. Colombia Niger El Salvador Côte d'Ivoire Panama Moldova Ecuador Paraguay Palestine Guinea Switzerland Peru Guatemala Thailand Rwanda Kenya Zimbabwe Uganda Korea, Rep. Of
Other groups Central African Republic Algeria Korea, Rep. Of Côte d'Ivoire Belize Kuwait El Salvador Bolivia Liberia Kyrgyzstan Brazil Malawi Latvia Burundi Malaysia Lithuania Cambodia Moldova Peru Chile Morocco Colombia Palestine Congo Slovenia Congo, Dem. Rep. Switzerland Ecuador Syria Georgia Togo Guatemala Uganda Guinea Zimbabwe
These restrictions tend to diminish with increasing levels of development, as Figure 4. shows for gender impediments.
0%
20%
40%
60%Owning
MortgageOwn name
lowmedium-lowmediummedium-highhigh
Figure 4. Gender impediments to owning property, by level of development

13
INFRASTRUCTURE The levels of household connection to networked infrastructure are major indicators of the level of city development. The level of connection of each type of infrastructure tends to reflect the relative cost per household of providing the service and the relative importance to lower income households, so that access to potable water (which can be arranged fairly cheaply using communal standpipes) and electricity connections tend to advance most rapidly with development level, as Figure 5 and Table 14a show. Sewerage (which is the most expensive) and telephone connections (which are something of a luxury item) increase more slowly.
Table 14a. Connections to infrastructure
Region Water1 Sewerage Electricity TelephoneAccess to
water1 Africa 48.4% 30.9% 53.9% 15.5% 73.5% Arab States 79.1% 65.9% 91.8% 42.0% 88.0% Asia-Pacific 65.9% 58.0% 94.4% 57.1% 94.8% HIC 99.6% 99.7% 100.0% 99.5% 99.7% LAC 83.7% 63.5% 91.2% 51.7% 89.1% Transitional 91.1% 89.6% 99.2% 73.5% 97.3% All developing 75.8% 64.0% 86.5% 52.1% 88.9% CDI quintile
1 40.6% 19.7% 61.6% 17.4% 71.8% 2 67.2% 44.1% 83.2% 40.1% 85.0% 3 86.8% 77.5% 97.1% 55.6% 92.9% 4 92.8% 84.4% 97.3% 61.1% 98.0% 5 97.4% 90.6% 96.2% 87.6% 97.8%
Note: 1. Water connections refer to percentage of households with piped water connection. Access to water means having potable water within 200 meters of the household (e.g., standpipes, wells etc), and includes water connections (since most countries presume piped water is potable).
Figure 5. Access to networked infrastructure, by CDI quintile
0%
50%
100%Water
Sewerage
ElectricityTelephone
Water < 200m
54321

14
Connections to informal settlements are substantially lower than to cities as a whole, as Table 14b shows.
Table 14b. Connections to infrastructure - informal settlements*
Region Water Sewerage Electricity Telephone
Access to water
(<200m) Africa 19.1% 7.4% 20.3% 2.9% 40.0% Arab States 35.7% 21.5% 35.9% 30.0% 42.7% Asia-Pacific 38.3% 7.4% 75.7% 25.4% 89.1% LAC 57.9% 30.3% 84.7% 32.0% 66.8% Transitional 33.6% 28.8% 60.7% 29.7% 57.5% All developing 37.2% 19.8% 59.1% 25.4% 57.6% CDI quintile
1 17.2% 7.1% 33.4% 5.7% 45.3% 2 43.7% 11.9% 63.3% 41.3% 64.1% 3 51.9% 27.6% 87.4% 28.6% 62.0% 4 49.3% 36.4% 67.5% 23.6% 68.5% 5 61.2% 92.9% 77.7% 81.2%
Note *. These data may contain inaccuracies as sample sizes are small and measurement is uncertain.
From Figure 6, on average there is about half the level of connections to networked infrastructure in all categories (with higher relative levels for the cheaper classes of connections).
.Figure 6. Connections to networked infrastructure, informal settlements
and all developing cities.
0%
50%
100%Water
Sewerage
ElectricityTelephone
Water < 200m
All citiesInformal settlements

15
The differences between informal and formal settlements become more pronounced at lower levels of development, especially for the more expensive services. The relative proportions of connections are much lower in Africa, as Figure 7 shows, and in less developed regions more generally.
0%
20%
40%
60%
80%Water
Sewerage
ElectricityTelephone
Water < 200m
All Africa
InformalSettlements
Figure 7. Networked services in Africa, formal and informal settlements
HEALTH AND EDUCATION As well as networked services, health and education are also major components of the City Development Index, providing subindices that represent outcomes from investment in health and education services. Both sectors are also major contributors to measures of capability poverty, it being argued that poor health and lack of education are major impediments to individuals improving their circumstances and moving out of poverty. UNDP have recorded consistent improvements in health and education at national levels throughout the 1990s. This is largely the case with the current sample (with the exception of African cities). Figure 8 shows improvements in child mortality since 1993 for each quintile, with the greatest improvements in the second quintile.
0.00%
2.00%
4.00%
6.00%
8.00%
10.00%
12.00%
14.00%
16.00%
18.00%
1 2 3 4 5
1998 1993
Figure 8. Child mortality by CDI quintile, 1993 and 1998.
16
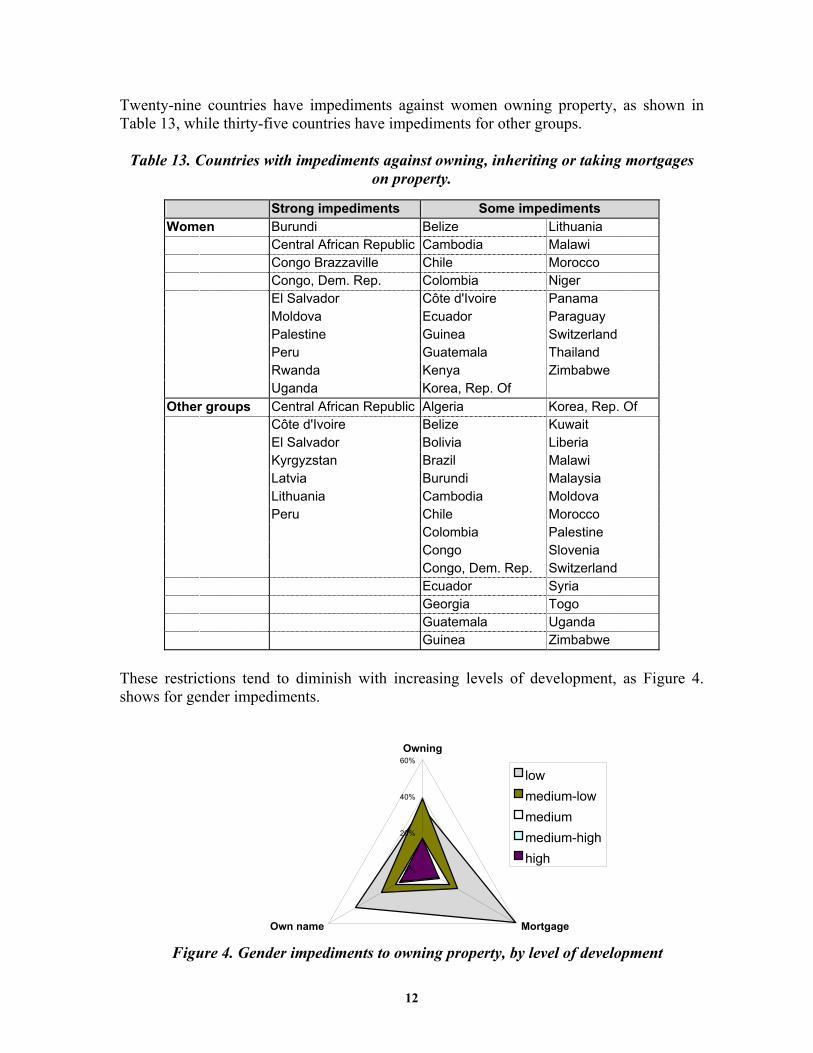
The health and education indicators are more extensive than in the 1993 sample, and match those commonly collected by UNDP. As part of the CDI, they are more dependent on levels of development than on regional differences. Almost 15% of children die in the lowest quintile (and in Africa) before reaching their 5th birthday, which is 16 times the death rate of those in the top quintile. In the lowest quintile, over half the population are illiterate, 60% of children do not attend school, and life expectancy is only three quarters that of the top quintile.
Table 15. Health and education
Region Under 5
mortalityLife
expectancy LiteracyCombined enrolment
Africa 14.6% 52.7 58.8% 45.1% Arab States 5.7% 68.2 69.1% 57.7% Asia-Pacific 4.4% 67.4 82.5% 71.2% HIC 0.9% 77.6 97.6% 88.4% LAC 3.6% 70.9 82.1% 69.6% Transitional 2.4% 67.3 95.2% 79.1% All developing 5.8% 65.6 79.2% 65.9% CDI quintile
1 14.6% 56.0 47.2% 41.1% 2 5.4% 65.2 76.1% 63.4% 3 4.2% 66.5 88.0% 70.6% 4 2.4% 69.7 93.4% 76.8% 5 0.9% 74.3 96.6% 84.1%
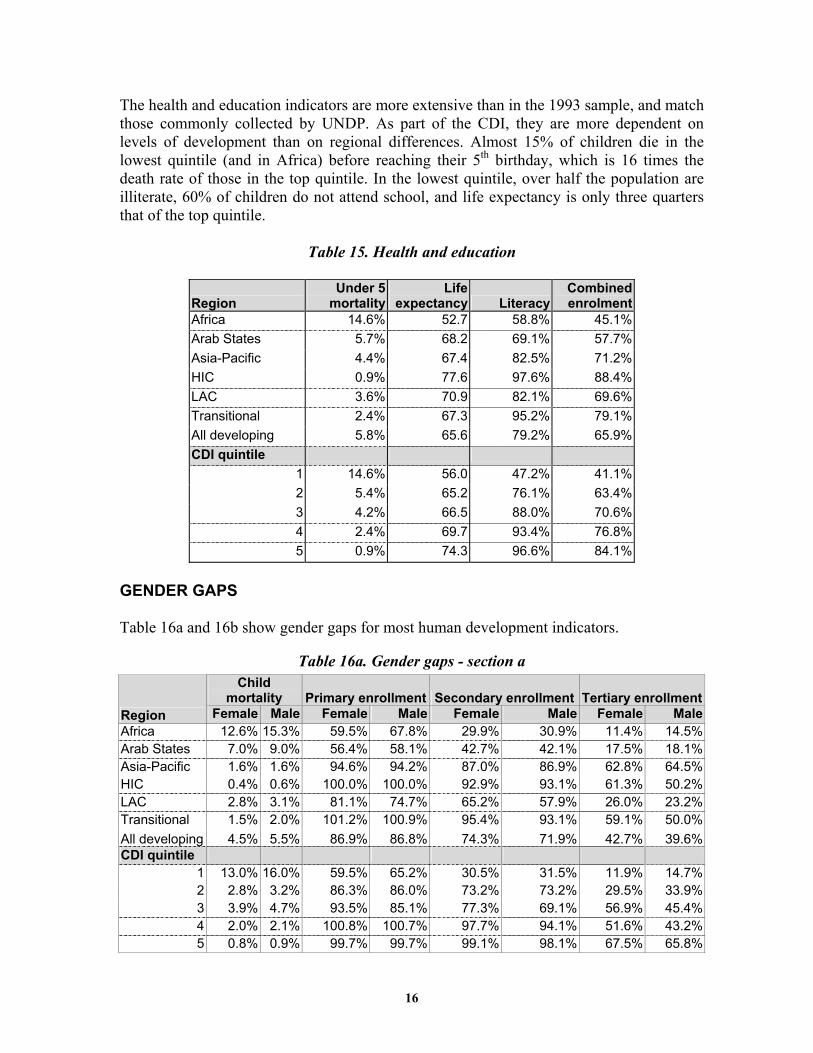
GENDER GAPS Table 16a and 16b show gender gaps for most human development indicators.
Table 16a. Gender gaps - section a
Child mortality Primary enrollment Secondary enrollment Tertiary enrollment
Region Female Male Female Male Female Male Female MaleAfrica 12.6% 15.3% 59.5% 67.8% 29.9% 30.9% 11.4% 14.5%Arab States 7.0% 9.0% 56.4% 58.1% 42.7% 42.1% 17.5% 18.1%Asia-Pacific 1.6% 1.6% 94.6% 94.2% 87.0% 86.9% 62.8% 64.5%HIC 0.4% 0.6% 100.0% 100.0% 92.9% 93.1% 61.3% 50.2%LAC 2.8% 3.1% 81.1% 74.7% 65.2% 57.9% 26.0% 23.2%Transitional 1.5% 2.0% 101.2% 100.9% 95.4% 93.1% 59.1% 50.0%All developing 4.5% 5.5% 86.9% 86.8% 74.3% 71.9% 42.7% 39.6%CDI quintile
1 13.0% 16.0% 59.5% 65.2% 30.5% 31.5% 11.9% 14.7%2 2.8% 3.2% 86.3% 86.0% 73.2% 73.2% 29.5% 33.9%3 3.9% 4.7% 93.5% 85.1% 77.3% 69.1% 56.9% 45.4%4 2.0% 2.1% 100.8% 100.7% 97.7% 94.1% 51.6% 43.2%5 0.8% 0.9% 99.7% 99.7% 99.1% 98.1% 67.5% 65.8%
17
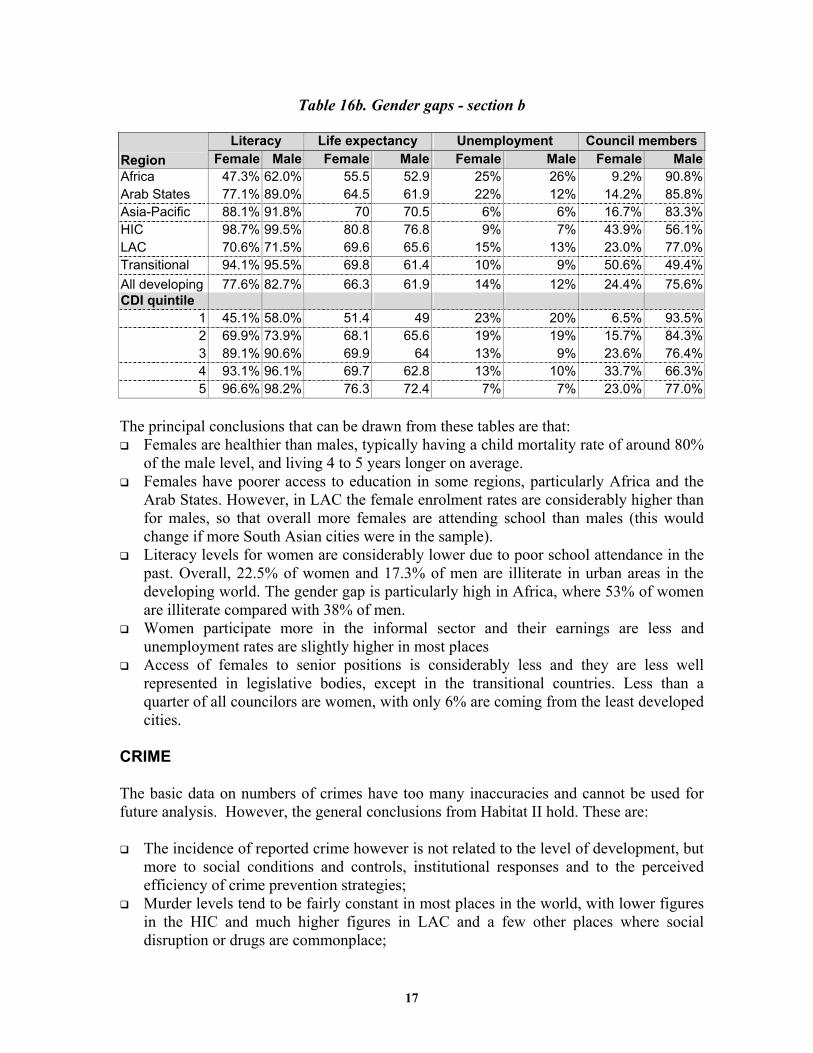
Table 16b. Gender gaps - section b
Literacy Life expectancy Unemployment Council membersRegion Female Male Female Male Female Male Female MaleAfrica 47.3% 62.0% 55.5 52.9 25% 26% 9.2% 90.8%Arab States 77.1% 89.0% 64.5 61.9 22% 12% 14.2% 85.8%Asia-Pacific 88.1% 91.8% 70 70.5 6% 6% 16.7% 83.3%HIC 98.7% 99.5% 80.8 76.8 9% 7% 43.9% 56.1%LAC 70.6% 71.5% 69.6 65.6 15% 13% 23.0% 77.0%Transitional 94.1% 95.5% 69.8 61.4 10% 9% 50.6% 49.4%All developing 77.6% 82.7% 66.3 61.9 14% 12% 24.4% 75.6%CDI quintile
1 45.1% 58.0% 51.4 49 23% 20% 6.5% 93.5%2 69.9% 73.9% 68.1 65.6 19% 19% 15.7% 84.3%3 89.1% 90.6% 69.9 64 13% 9% 23.6% 76.4%4 93.1% 96.1% 69.7 62.8 13% 10% 33.7% 66.3%5 96.6% 98.2% 76.3 72.4 7% 7% 23.0% 77.0%
The principal conclusions that can be drawn from these tables are that:
Females are healthier than males, typically having a child mortality rate of around 80% of the male level, and living 4 to 5 years longer on average.
Females have poorer access to education in some regions, particularly Africa and the Arab States. However, in LAC the female enrolment rates are considerably higher than for males, so that overall more females are attending school than males (this would change if more South Asian cities were in the sample).
Literacy levels for women are considerably lower due to poor school attendance in the past. Overall, 22.5% of women and 17.3% of men are illiterate in urban areas in the developing world. The gender gap is particularly high in Africa, where 53% of women are illiterate compared with 38% of men.
Women participate more in the informal sector and their earnings are less and unemployment rates are slightly higher in most places
Access of females to senior positions is considerably less and they are less well represented in legislative bodies, except in the transitional countries. Less than a quarter of all councilors are women, with only 6% are coming from the least developed cities.
CRIME The basic data on numbers of crimes have too many inaccuracies and cannot be used for future analysis. However, the general conclusions from Habitat II hold. These are:
The incidence of reported crime however is not related to the level of development, but more to social conditions and controls, institutional responses and to the perceived efficiency of crime prevention strategies;
Murder levels tend to be fairly constant in most places in the world, with lower figures in the HIC and much higher figures in LAC and a few other places where social disruption or drugs are commonplace;

18
Reported theft rates are far higher in the HIC and are under-reported in many developing cities. The indicator reflects confidence in the police force as much as the actual crime level;
Asia shows low theft levels, whereas those in Africa are quite high.
Table 17. Crime controls
Region Dangerous
areas School
violence
Domestic violence
policy
Crime prevention
policy
Weapons control policy
Victim of violence
assistanceAfrica 17% 30% 62% 83% 86% 72%Arab States 7% 0% 57% 86% 86% 71%Asia-Pacific 12% 50% 59% 94% 100% 82%HIC 0% 70% 100% 100% 100% 100%LAC 48% 50% 69% 67% 69% 60%Transitional 29% 30% 71% 88% 94% 35%All developing 29% 40% 65% 80% 84% 61%
Table 17, which shows the percent of cities having crime controls, supports some of these observations. LAC cities have a much higher proportion of dangerous areas at 48%. Transitional cities also show a high proportion of dangerous areas – which may be due to social disturbances following the change of economic system. School violence is reported in more than half the cities in the HIC, Asia Pacific and LAC. Two thirds of all cities have a domestic violence policy, and over 80% have crime prevention and weapons control policies; the figure is lower in LAC. Only a third of transitional cities have assistance for victims of violence, and 60% of LAC cities; elsewhere the figure is over 70%. REGIONAL DISPARITY OF URBAN POOR HOUSEHOLDS The reduction of poverty is a major aim of most governments, and poverty impacts heavily on urban conditions. Urban poverty is often manifested most severely in cities where the poor are compelled to live together in squatter areas or informal settlements, and where the option to fall back on own production of food is limited or impossible. Poverty measurement is difficult. UNDP, the World Bank and others have put a lot of effort into ascertaining poverty levels. This survey makes use of local poverty lines, which are relatively easy to collect but which are not comparable between countries. Overall, 114 cities provided figures on poverty. Missing data was disproportionately in small LAC cities, Arab States and Africa. There were also few cities from South Asia (where poverty is very high) in the sample. Table 18 shows population and poverty related averages by level of development between 1993 and 1998.

19
Table 18. Poor households and poor woman-headed households by region, 1993 and 1998.
Poor households
Poor women headed
households Region 1993 1998 1993 1998 Africa 37.5% 40.9% 32.2% 40.0% Arab States 8.1% 15.4% 4.0%* 14.0%* Asia-Pacific 14.7% 14.2% 3.5%* 16.3%* HIC 11.9% 8.0% 1.5%* 8.8%* LAC 26.9% 25.4% 38.4% 36.7% Transitional 18.3% 22.2% 13.7% 18.1% All developing 23.4% 25.2% 25.5% 29.8%
Note. * = Not significant There is quite a pronounced sub-regional distribution of urban poverty, as Table 19 shows (the table covers cities that reported both 1993 and 1998 data). The most important observations from the sample are:
Poverty has increased over the period, particularly in Africa and Transitional countries; Africa has the highest level of poverty; Smaller cities in LAC are showing high poverty levels; All Eastern African cities and Western African cities, excluding Banjul, show poverty
increase; All Russian cities, and a few Polish and Czech cities, show an increase in poverty; Cities in Asia (pre-crisis) show a substantial decrease in poverty, as do Central
American and Middle African cities on average – but in fact cities divide fairly evenly between gains and losses.
Table 19. Poverty data by sub-region, 1993 and 1998.
Poor
households Poor women headed UN sub-region
Total cities
Cities with data 1993 1998 1993 1998
Caribbean 8 3 25.4% 21.2% 75.6% 51.6%Central America 6 4 43.9% 36.1% 37.6% 25.1%Eastern Africa 13 7 43.7% 59.7% 47.5% 70.2%Eastern Asia 4 4 4.7% 8.7% 1.7% 3.1%Eastern Europe 21 19 14.5% 16.9% 1.1% 6.7%Middle Africa 5 5 35.6% 28.7% 25.3% 14.5%Northern Africa 5 2 7.8% 11.8% 10.0% 12.9%Northern Europe 6 2 9.8% 10.3% .. ..Polynesia 1 1 32.9% 38.9% .. 34.5%South America 34 19 24.6% 25.2% 35.5% 35.9%South-central Asia 5 5 31.1% 30.3% 15.8% 26.3%South-eastern Asia 11 7 11.1% 11.9% 5.3% 14.3%Southern Europe 7 3 20.6% 18.7% 1.7% 21.5%Western Africa 11 7 32.1% 35.2% 25.4% 37.4%Western Asia 12 4 22.4% 21.8% 15.7% 38.6%Western Europe 1 1 4.2% 7.1% .. ..

20
Table 20 shows poverty by level of development. Clearly, poverty decreases by level of development, declining from 36% in the least developed cities to 10.5% in the top quintile.
Table 20. Poverty and demographic averages, 1998, for levels of development.
CDI quintile City population average (-000)
Population growth
Household size
Woman headed
Poor households
Poor woman
headed HH1 1822.8 4.4% 5.9 18.8% 35.9% 42.1%2 1031.6 4.4% 4.6 25.2% 25.1% 30.5%3 1751.1 2.0% 3.8 20.8% 31.4% 32.2%4 1176.4 1.8% 3.7 24.8% 21.2% 23.9%5 1992.1 1.2% 3.1 25.4% 10.5% 7.3%
All developing 1599.1 2.7% 4.3 22.7% 25.2% 29.3% Woman headed households in poverty On average, 57 cities provided data on women headed households (HH) in poverty1. Of these, 34 cities had more a higher incidence of poverty among women headed households in poverty than the average, against 23 with less. The differences for a selection of cities are shown in Table 21. At Habitat II, it was strongly suggested that women headed households had more poverty in HIC and Transitional cities and less in Asia and Arab States while cities were equally divided in LAC and Africa (but with somewhat higher overall averages because of some extreme cases of poverty among women). It is shown in Table 18, as it has been found in previous samples, that Asia and the Arab States have a lesser proportion of woman-headed households, with about 15% compared with 25% elsewhere. On a regional basis, only LAC has a significantly higher incidence of poverty among women headed households than general households (36% against 25% average). This is particularly pronounced in the Caribbean, as Tables 17 and 19 showed. The present sample shows that: a) There are higher proportions of women headed households in poverty in most LAC and
Transitional cities; b) North Africa is showing a different pattern than the other Arab States, with more
woman headed households in poverty; c) Poverty incidence is higher in woman headed households in most Asian cities; d) East African women headed households appear to have been hard-hit by increasing
poverty.
1 Only LAC, Africa and Transitional regions have a sufficient sample for statistical significance.

21
Table 21. Comparison of general poverty incidence and poverty among women headed households (local poverty definition)
City Region HH in povertyWoman-headed
HH in poverty Difference Montego Bay LAC 13.4% 71.80% 58.40% Kingston LAC 10.1% 67.70% 57.60% Marinilla LAC 31.3% 70.10% 38.80% Guayaquil LAC 48.0% 73.70% 25.70% Bishkek Transitional 7.2% 28.70% 21.50% Cajamarca LAC 60.0% 80.00% 20.00% Conakry Africa 9.0% 29.00% 20.00% Tacna LAC 14.7% 33.30% 18.60% Bujumbura Africa 66.5% 84.10% 17.60% Tbilisi Transitional 47.5% 60.00% 12.51% Nouakchott Africa 25.0% 36.00% 11.00% Belize LAC 18.8% 29.50% 10.70% Santo Andre LAC 6.5% 16.00% 9.50% Banjul Africa 40.0% 48.00% 8.00% Algiers Arab States 5.9% 13.00% 7.10% Poznan Transitional 5.9% 12.30% 6.40% Bridgetown LAC 9.0% 15.20% 6.20% Ibadan Africa 53.0% 58.50% 5.50% Lagos Africa 53.0% 58.50% 5.50% Prague Transitional 1.1% 6.20% 5.10% Kigali Africa 65.0% 70.00% 5.00% Bourgas Transitional 1.2% 6.00% 4.80% Chiang Mai Asia-Pacific 9.7% 14.30% 4.57% Rio de Janeiro LAC 17.0% 20.00% 3.00%
Quito LAC 11.5% 8.08% -3.42% Montevideo LAC 15.4% 11.80% -3.60% Kisumu Africa 58.2% 53.90% -4.30% Apia Asia-Pacific 38.9% 34.50% -4.40% Ulaanbaatar Transitional 34.1% 28.70% -5.40% Leon LAC 28.3% 22.10% -6.20% Brazzaville Africa 21.7% 12.50% -9.20% Douala Africa 19.7% 8.30% -11.40% Lome Africa 20.00% 6.15% -13.85% Jinja Africa 89.80% 72.70% -17.10% Yaounde Africa 30.00% 12.90% -17.10% Sarajevo Transitional 85.80% 67.00% -18.80%

22
WATER Water is one of the great necessities of human life that is taken for granted in the developed world. A supply of clean water is absolutely necessary for life and health, yet many people of the world do not have access to clean water or can only obtain it at high prices. Many cities do not have a constant, potable water supply. Even in cities which are supplied with clean water, households in some informal areas which are not connected to the network can only buy water from vendors at up to 200 times the tap price, so that much of family income is spent on water. Availability of potable water in urban areas increases rapidly with development. Around 30 per cent of households do not have access to clean water in the least developed cities, and 60% of households in informal settlements, as Tables 16 and 17 showed, while almost everyone in developed cities has access. Accordingly, water consumption is much higher in cities with higher incomes, as with most other forms of consumption. Typically people in developed cities use about 220 litres per day while the average in Africa is 50 litres per day, less than a quarter. However, water price generally falls with the level of development (as Table 22 shows with the exception of the highest group, which is poorly sampled). Households in informal settlements use less than half the amount of water as the average in the same cities, due to less availability and greater costs. The median water price in informal settlements is almost 5 times the average price in developing cities. This is mostly due to the high price of water in African informal areas.
Table 22. Water
Region Water used
(l/person/day)
Water used, informal
settlements-
Highest water price
($/cu.m.)
Median water price
Lowest water price
Median price, informal
settlements Africa 50 23 $6.85 $1.42 $0.76 $6.10Arab States 190 66 $0.75 $0.54 $0.34 $0.67Asia-Pacific 224 56 $1.08 $0.33 $0.19 $0.09*HIC 215 $1.79* $1.34 $1.38* $1.71*LAC 178 84 $12.27 $0.44 $0.38 $0.78Transitional 186 27 $0.50 $0.28 $0.30 $0.39All developing 158 45 $6.21 $0.56 $0.41 $2.38CDI quintile
1 69 30 $3.72 $1.11 $0.68 $4.652 106 52 $1.32 $0.66 $0.31 $1.363 192 54 $20.95 $0.37 $0.32 $0.324 205 98 $0.68 $0.29 $0.26 $0.275 218 .. $0.94 $0.70 $0.60 $1.51
Note: * = Not significant

23
WASTE MANAGEMENT
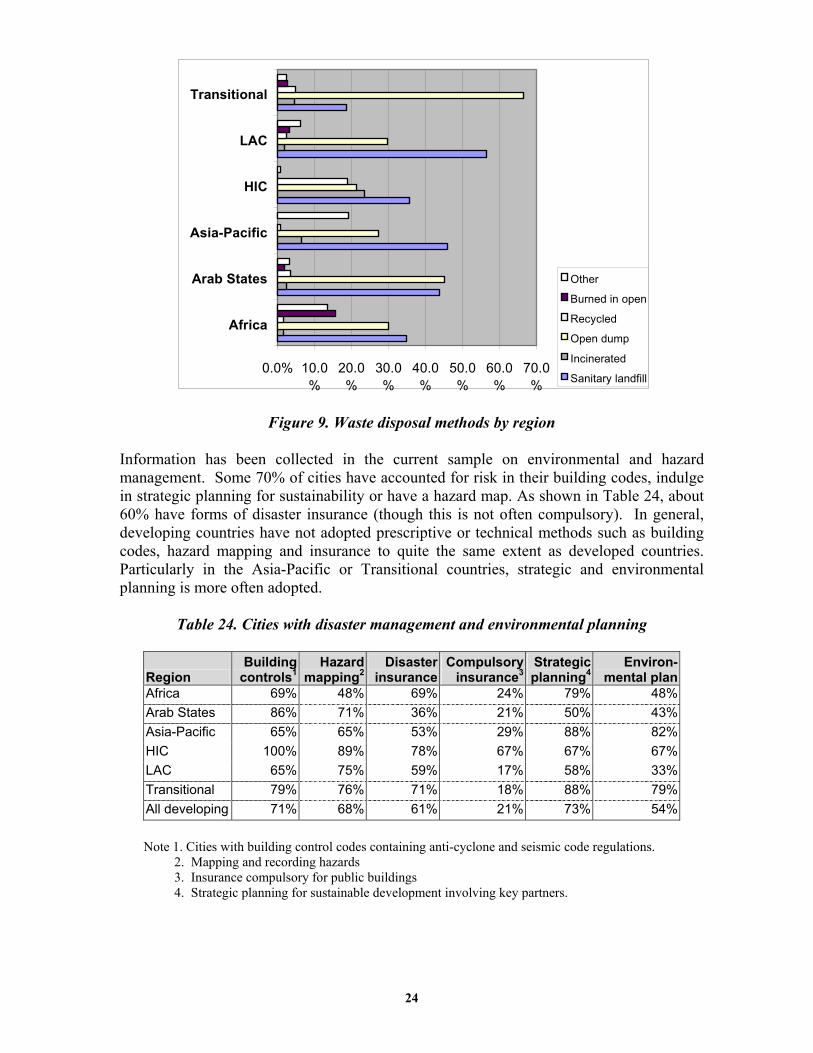
Waste management is the final component of the City Development Index - the component that advances most slowly and is most difficult to improve with increasing development. While there are many advantages in urban living, mostly involving the cheaper provision of physical and social infrastructure and the greater availability of employment, the major disadvantages relate to congestion and to the problems of disposal of solid and liquid wastes of people living at high densities, and the local environmental degradation and propensity for health risks that this causes. As with networked infrastructure, the effectiveness of environmental management increases rapidly with the level of development as Table 23 shows, with only 8 per cent of wastewater treated and 12.5% of garbage disposed formally in the least developed cities. Less than 35% of cities in the developing world have their wastewater treated. In only one out of every five African and Latin American cities and in one out of every three Asian cities is wastewater undergoing some form of treatment. In cities of highly developed countries, 95% of solid wastes are formally disposed and 19% is formally recycled. As shown on figure 9, in Transitional countries, 75% of solid wastes are going to open dump.
Table 23. Waste management
Region Waste water treatment
Formal solid waste disposal
Formally recycled
Africa 21.70% 31.40% 1.50% Arab States 32.00% 44.30% 4.00% Asia-Pacific 33.70% 58.90% 7.70% HIC 94.30% 78.00% 18.90% LAC 19.80% 66.30% 2.60% Transitional 64.80% 24.50% 4.60% All developing 34.60% 46.40% 3.70% CDI quintile
1 7.80% 12.50% 1.20% 2 13.00% 40.50% 1.40% 3 30.90% 43.00% 3.20% 4 65.50% 54.50% 3.60% 5 82.40% 85.20% 13.00%
24
Figure 9. Waste disposal methods by region
Information has been collected in the current sample on environmental and hazard management. Some 70% of cities have accounted for risk in their building codes, indulge in strategic planning for sustainability or have a hazard map. As shown in Table 24, about 60% have forms of disaster insurance (though this is not often compulsory). In general, developing countries have not adopted prescriptive or technical methods such as building codes, hazard mapping and insurance to quite the same extent as developed countries. Particularly in the Asia-Pacific or Transitional countries, strategic and environmental planning is more often adopted.
Table 24. Cities with disaster management and environmental planning
Region Building
controls1 Hazard
mapping2Disaster
insuranceCompulsory
insurance3Strategic planning4
Environ-mental plan
Africa 69% 48% 69% 24% 79% 48%Arab States 86% 71% 36% 21% 50% 43%Asia-Pacific 65% 65% 53% 29% 88% 82%HIC 100% 89% 78% 67% 67% 67%LAC 65% 75% 59% 17% 58% 33%Transitional 79% 76% 71% 18% 88% 79%All developing 71% 68% 61% 21% 73% 54%
Note 1. Cities with building control codes containing anti-cyclone and seismic code regulations. 2. Mapping and recording hazards 3. Insurance compulsory for public buildings 4. Strategic planning for sustainable development involving key partners.
0.0% 10.0%
20.0%
30.0%
40.0%
50.0%
60.0%
70.0%
Africa
Arab States
Asia-Pacific
HIC
LAC
Transitional
Other
Burned in open
Recycled
Open dump
Incinerated
Sanitary landfill

25
ECONOMIC AND WORKFORCE ISSUES Ultimately, the reason why people come together in cities is for wealth and job creation, and the creation of income has been considered to be the prime measure of urban success, until fairly recently when quality of life concerns became more evident. In general, incomes and productivity are higher in urban areas, and this is borne out in the comparison of national GDP and average city product in Table 25. It remains clear however than the largest gaps between developed and developing countries are in incomes, product and capital, and in the forms of consumption and investment that this permits. Household income is about 17 times as great in the HIC as in the bottom quintile of cities, and city product and GDP per person are 37 times as large. The informal employment sector tends to vary strongly with city development levels, ranging from about 54% of all employment in Africa to 3% or less in the HIC (although informal employment figures tend to be underestimated and concealed in developed countries because of compliance requirements). Unemployment rates tend to be rather meaningless in countries with high levels of informal employment, but unemployment also falls away with increasing development levels.
Table 25. Economic and workforce issues
Region GDP per
Capita City
productHousehold
incomeInformal
employment1 Unemploy-ment rate1
Africa $441 $729 $1,637 54% 23%Arab States $2,752 $3,170 $5,850 65% 11%Asia Pacific $4,742 $6,182 $9,101 33% 8%HIC $22,501 $22,103 $26,273 3%* 8%LAC $3,350 $3,226 $5,623 39% 13%Transitional $2,541 $2,905 $3,591 21% 9%All developing $2,670 $2,988 $4,761 37% 12%CDI quintile
1 $606 $571 $1,512 49% 15%2 $1,571 $1,329 $2,593 51% 16%3 $2,087 $2,409 $3,917 40% 12%4 $3,230 $3,539 $5,521 26% 12%5 $11,822 $12,842 $16,743 19% 7%
Note: *=not significant 1. There has been some confusion in the distinction between informally employed
(employed in unregistered enterprises) and unemployed, which relates to those actively seeking work in the formal sector. Quite often, formally unemployed people will work in the informal sector, so there may be double counting.
TRANSPORT Transport is an important indicator in urban centers. About 42% of people in urban centres in the developing world travel to work by bus or minibus, and 16% on foot. Only about 17.5% use cars, compared with over 50% in the HIC. Train travel is used more commonly

26
in the transitional countries, and bicycles are more common in Asia. This is shown in Table 26 and further demonstrated in Figure 10.
Table 26. Transport
Region Travel time CarsMotorcycle Train/tram Bus/minibus Bicycle Walking OtherAfrica 34.1 13.6% 2.8% 2.1% 47.4% 6.4% 17.4% 7.0%Arab States 28 41.0% 1.6% 0.0% 41.2% 0.2% 7.7% 8.7%Asia-Pacific 42.1 16.0% 15.2% 4.9% 27.1% 0.7% 21.9% 13.1%HIC 27 50.3% 0.0% 8.2% 20.6% 6.5% 10.6% 0.8%LAC 30.7 21.2% 4.3% 3.0% 43.8% 4.7% 15.0% 11.0%Transitional 29.8 15.1% 4.3% 17.3% 41.7% 1.9% 15.4% 1.5%All developing 32.3 17.5% 5.0% 7.5% 41.8% 3.4% 16.1% 7.1%CDI quintile
1 35 11.5% 7.0% 2.1% 38.5% 5.5% 20.2% 13.3%2 27.5 16.9% 10.5% 0.5% 44.3% 7.8% 17.4% 6.2%3 33.7 17.9% 2.2% 10.6% 45.5% 2.9% 16.0% 5.7%4 31 22.5% 3.4% 8.9% 45.1% 0.3% 12.5% 2.9%5 33.1 31.5% 1.6% 13.1% 30.9% 2.7% 12.9% 4.9%
Some cities make use of alternative transport modes: motorcycles take over 70% of commuters in Phnom Penh and Surabaya, and over 60% in Chiang Mai. Private cars are used most commonly in the Arab States and HIC cities with poor transit systems or which are at low density. Average travel time to work across all cities is about 32 minutes, which does not vary much by development level or region. However some larger cities such as Bangkok, Seoul, Lagos, Nairobi, Kinshasa and Moscow have an average travel time of 60 minutes, while Cuban cities, which suffer from fuel shortages due to a US embargo, have a travel time of 80 minutes.
Figure 10. Mode of transport to work
0.0% 10.0% 20.0% 30.0% 40.0% 50.0% 60.0%
Africa
Arab States
Asia-Pacific
HIC
LAC
Transitional
Other
Walking
Bicycle
Bus/minibus
Train/tram
Motorcycle
Cars

27
LOCAL GOVERNMENT City partnerships and participation City partnerships have been strongly encouraged by development agencies in recent years in an attempt to reduce development stagnation and encourage transparency, and some 63% of cities have formed public-private partnerships, as Table 27 shows. The highest proportions have been in Africa where more than 80% of cities are involved. There are somewhat lower levels in LAC, where aid agencies have withdrawn somewhat in recent years. Partnerships are slightly more common at the city level than at the national level. Cities in virtually all regions belong to associations of local authorities, and conduct inter-city cooperation. The weakest region in this regard is LAC, where cities seem more reluctant to engage in partnerships. This may be due to the relative strength and high capacity of individual city governments in Latin America. Cities in Africa and the Transitional countries, which have the weakest local governments, are also more prone to engage in cooperative action.
Table 27. Partnerships.
Region
City public/private partnerships
National public/private partnerships
Received aid
Association of local
authorities City to city
cooperationAfrica 83% 76% 7% 83% 83%Arab States 71% 71% 0% 71% 64%Asia-Pacific 59% 59% 18% 59% 71%HIC 67% 67% 0% 78% 67%LAC 46% 38% 17% 52% 54%Transitional 71% 74% 21% 79% 85%All developing 63% 60% 14% 68% 70%CDI quintile
1 73% 70% 13% 67% 70%2 53% 47% 13% 67% 73%3 64% 68% 19% 71% 68%4 70% 60% 13% 67% 70%5 56% 57% 7% 70% 70%
From Table 28a, around 60% of cities consult with civil society in most activities, including road proposals, zoning alterations, and major public projects. Numbers are higher at around 80% in HIC cities, and in general tend to increase with development level.
Transparency and accountability Table 28a also shows that a good percentage of cities are engaging in various practices designed to improve accountability. 73% of developing cities have independent auditing (compared with 90% in HIC), 84% publish tenders (100% in HIC), 83% have sanctions against fault by office holders, and 53% require disclosure of interest (78% in HIC). Cities engaging in these practices are not particularly distinguished by region or development level.

28
Table 28a. Local government - section a
Civil society involved in Local government has
Region
Transfers known in advance
New road
proposals
Zoning altera-
tions
Major public
projects
Inde-pendent auditing
Publi- shed
tenders
Sanctions against
fault
Disclo-sure of interest
Africa 52% 52% 59% 52% 69% 90% 90% 69%Arab States 64% 50% 50% 36% 86% 86% 86% 71%Asia-Pacific 59% 59% 88% 71% 82% 82% 71% 59%HIC 67% 78% 78% 78% 89% 100% 89% 78%LAC 60% 50% 48% 60% 67% 79% 85% 48%Transitional 85% 74% 68% 85% 76% 85% 79% 76%All developing 65% 57% 60% 63% 73% 84% 83% 63%CDI quintile
1 53% 43% 47% 43% 73% 87% 83% 53%2 53% 37% 53% 53% 60% 80% 83% 67%3 77% 68% 61% 81% 68% 84% 84% 61%4 73% 70% 67% 63% 80% 77% 77% 60%5 67% 73% 77% 80% 90% 97% 90% 77%
Autonomy Figure 11 and Table 28b, show the extent to which local governments are relatively independent from national governments, by region, according to four indicator measures. On average, cities in the Arab States are the most constrained, followed by African cities and cities in the Asia Pacific region. Cities in the transitional economies are less likely to be able to set taxes and charges than cities in Latin America, but are often able to borrow funds independently. Cities in the Highly Industrialized countries are largely independent on all these counts.
0.000.200.400.600.801.001.201.401.601.802.00
Choose contractors
Set taxes
Borrow funds
Set charges
HICLACTransitionalAsia-PacificAfricaArab States
Figure 11. Independence of local government
29
Table 28b. Local government - section b
Local government (3 year av.)
Higher government can
Local government can independently (max value 2)
Region Reve-
nue Expendi
-ture Close
local govt.Remove
councillorsSet
taxesSet
charges Borrow
funds Hire
contractorsAfrica $58 $53 72% 45% 0.66 0.76 0.48 1.03Arab States $483 $66 64% 57% 0.36 0.5 0.57 0.86Asia-Pacific $591 $465 35% 18% 0.65 0.88 0.76 1.29HIC $2,280 $2,270 22% 22% 1.33 1.56 1.67 1.89LAC $129 $83 17% 23% 1.55 1.36 1.1 1.77Transitional $276 $173 26% 21% 1.09 1.12 1.56 1.76All developing $248 $158 37% 30% 0.99 1.02 0.98 1.45CDI quintile
1 $245 $42 70% 43% 0.57 0.67 0.5 1.032 $50 $35 33% 20% 0.92 1.04 1 1.43 $171 $133 23% 35% 1.59 1.14 1.14 1.764 $225 $116 27% 27% 0.96 1.11 1.21 1.685 $1,146 $1,078 30% 20% 1.03 1.3 1.3 1.53
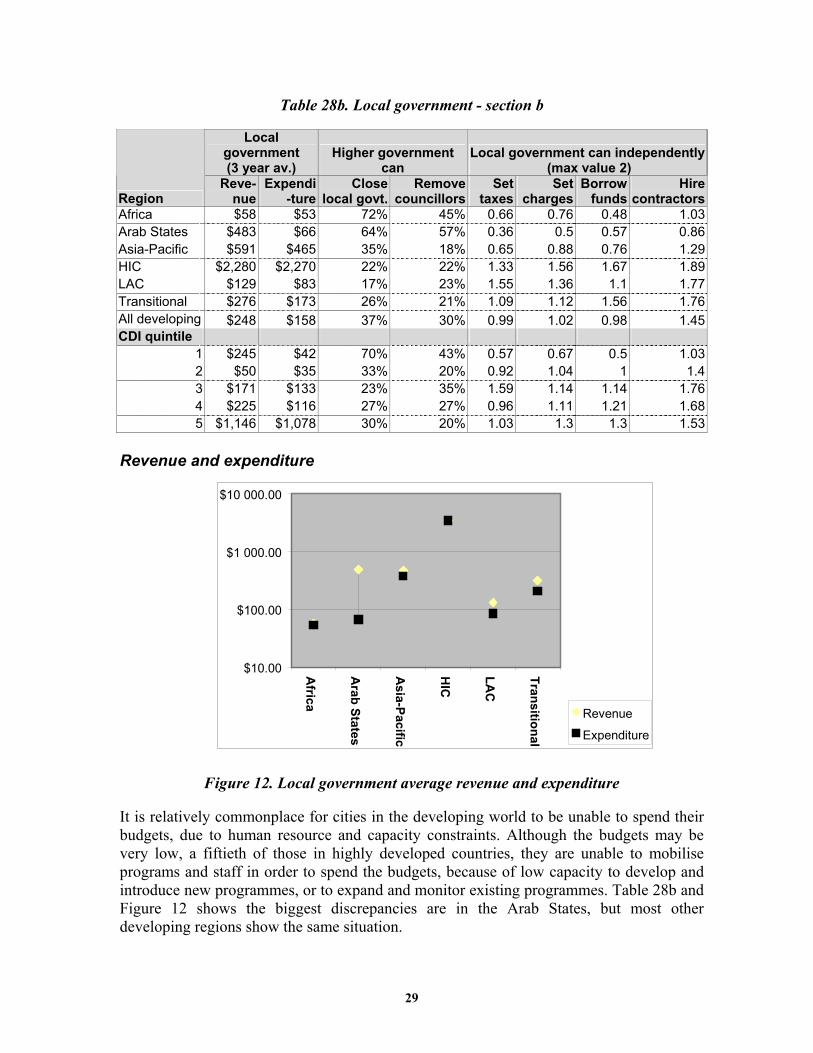
Revenue and expenditure
Figure 12. Local government average revenue and expenditure
It is relatively commonplace for cities in the developing world to be unable to spend their budgets, due to human resource and capacity constraints. Although the budgets may be very low, a fiftieth of those in highly developed countries, they are unable to mobilise programs and staff in order to spend the budgets, because of low capacity to develop and introduce new programmes, or to expand and monitor existing programmes. Table 28b and Figure 12 shows the biggest discrepancies are in the Arab States, but most other developing regions show the same situation.
$10.00
$100.00
$1 000.00
$10 000.00A
frica
Arab States
Asia-Pacific
HIC
LAC
Transitional
Revenue
Expenditure

30
ANNEX: Calculating the City Development Index Since indicators have been collected under approximately the same definitions, it is possible to use a rage of statistical techniques to determine correlation between variables. This annex explains procedures used in calculating the City Development Index (CDI), which is instrumental in ranking cities in order to evaluate their levels of development. The CDI is calculated according to the formulae in the Table A. It has separate sub-indices for Infrastructure, Waste Management, Health, Education and City Product, which are averaged to form the CDI. Each sub-index is a combination of several indicators that have been normalized to give a value between 0 and 1.
Table A. City Index formulas Index Formula Infrastructure 25 x Water connections + 25 x Sewerage + 25 x Electricity +
25 x Telephone Waste Wastewater treated x 50 + Formal solid waste disposal x 50 Health (Life expectancy - 25) x 50/60 +(32 - Child mortality) x 50/31.92 Education Literacy x 25 + Combined enrolment x 25 Product (log City Product - 4.61) x 100/5.99 City Development (Infrastructure index + Waste index + Education index +
Health index + City Product index) / 5 Because the variables used to make up the CDI are strongly related to each other, there are a number of ways to calculate the CDI that give almost identical results. For analysis purposes, the weightings given to each indicator have been initially calculated by a statistical process called Principal Components Analysis and then simplified. This formulation of the index uses the same formulae as in UNDP Human Development Report (1999), for the Health, Education and City product sub-indices. For meaningful ranking of cities, the index requires data that are essentially complete, robust and precise hence not many variables are suitable. All the underlying data had to be checked for accuracy and completeness. Where there was missing data or very inaccurate estimates, they were either replaced by data from another national city of similar size, by country-wide figures (or national urban data, if available) or by figures for a nearby city or place at a similar level of development (but only if absolutely necessary).
31
Also, Formal waste disposal or Wastewater treated is taken as zero if not provided. Where City Product was not provided, it was calculated so that City Product x Household size = 0.45 x Mean Household Income (which is similar to the main estimation formula). For most transitional countries, 0.35 x Household Income is used since, in Transitional economies, much GDP goes into indirect services and subsidies. The resultant city products must be somewhere in the vicinity of the National GDP per person, otherwise household incomes are presumed incorrect and adjusted. CDI values and their component subindices are provided for 167 cities in Table B.

Table B. CDI and component subindices
Components No. City Country Region CDI City
ProductInfrast-ructure Waste Health Education
32
1 Abidjan Côte d'Ivoire Africa 39.7 56.6 21.7 29.0 94.6 42.42 Accra Ghana Africa 46.6 49.4 50.0 0.0 94.0 62.03 Antananarivo Madagascar Africa 34.5 44.4 22.5 0.0 92.7 52.54 Bangui Central African Republic Africa 27.5 42.0 14.9 0.1 90.2 36.85 Banjul Gambia Africa 40.5 46.0 16.0 48.0 87.8 37.86 Brazzaville Congo Africa 27.1 30.7 31.6 0.4 86.4 18.57 Bujumbura Burundi Africa 43.1 50.3 32.8 18.2 82.6 57.78 Bulawayo Zimbabwe Africa 74.6 67.5 84.5 75.5 78.4 77.69 Chegutu Zimbabwe Africa 55.4 55.1 45.0 38.5 84.1 77.610 Conakry Guinea Africa 37.1 50.8 30.4 40.0 85.2 29.511 Douala Cameroon Africa 48.2 46.6 34.9 39.5 87.5 59.812 Entebbe Uganda Africa 39.7 42.7 29.5 16.0 81.1 68.213 Gweru Zimbabwe Africa 68.5 58.9 83.8 70.5 67.7 77.614 Harare Zimbabwe Africa 70.2 68.1 82.5 96.5 80.6 77.615 Ibadan Nigeria Africa 27.3 39.8 21.1 2.5 86.6 29.116 Jinja Uganda Africa 42.7 41.8 42.0 34.0 86.6 63.117 Kigali Rwanda Africa 31.9 45.9 29.8 10.0 81.2 44.818 Kinshasa Congo, Dem. Rep. Africa 35.3 64.6 34.9 13.3 81.6 22.819 Kisumu Kenya Africa 53.5 60.0 42.0 32.5 80.5 68.320 Kumasi Ghana Africa 57.1 42.8 47.5 49.0 80.7 62.021 Lagos Nigeria Africa 29.3 42.1 29.5 2.0 26.4 29.122 Lilongwe Malawi Africa 31.5 34.4 33.0 0.0 76.0 58.323 Lome Togo Africa 40.9 55.4 21.8 0.0 81.0 73.324 Mombasa Kenya Africa 53.4 54.6 41.3 52.3 83.8 65.325 Monrovia Liberia Africa 28.1 46.6 4.7 0.0 78.8 36.526 Nairobi Kenya Africa 56.1 63.2 52.5 39.0 84.6 65.327 Niamey Niger Africa 21.7 40.0 22.0 0.0 78.3 14.928 Nouakchott Mauritania Africa 30.8 50.0 12.3 2.0 74.1 39.029 Aden Yemen Arab States 42.5 42.3 40.2 17.5 94.5 46.630 Algiers Algeria Arab States 76.1 69.2 75.0 80.0 88.8 75.231 Amman Jordan Arab States 77.0 65.1 84.9 77.2 94.9 75.032 Baghdad Iraq Arab States 47.2 65.1 56.3 0.0 88.8 51.933 Casablanca Morocco Arab States 57.2 64.5 81.8 5.0 88.9 48.634 Damascus Syria Arab States 64.3 57.9 68.6 37.0 85.9 75.835 Doha Qatar Arab States 82.6 89.6 90.0 70.0 82.0 77.236 Gaza Palestine Arab States 44.5 63.7 65.0 0.0 80.9 51.637 Kuwait Kuwait Arab States 88.3 92.8 99.0 93.0 82.9 70.038 Muscat Oman Arab States 76.7 77.5 78.0 80.0 77.9 63.439 Rabat Morocco Arab States 63.1 62.7 65.5 52.5 83.6 48.640 Sana'a Yemen Arab States 41.8 40.0 39.0 17.5 76.3 46.641 Tripoli Libya Arab States 67.7 70.2 73.1 27.5 70.2 86.642 Tunis Tunisia Arab States 74.6 70.6 61.0 85.0 42.4 70.843 Apia Samoa, Western Asia-Pacific 59.0 65.3 63.5 0.0 94.1 82.744 Bangalore India Asia-Pacific 58.0 51.1 82.7 31.3 42.2 48.545 Bangkok Thailand Asia-Pacific 82.6 77.7 89.6 74.5 90.6 78.947 Cebu Philippines Asia-Pacific 67.0 70.2 42.3 66.0 59.1 78.748 Chiang Mai Thailand Asia-Pacific 78.5 68.0 82.5 85.0 90.0 76.349 Chittagong Bangladesh Asia-Pacific 39.3 55.4 41.0 0.3 83.1 38.150 Colombo Sri Lanka Asia-Pacific 58.4 46.9 68.6 45.0 61.5 45.3

Table B. CDI and component subindices
Components No. City Country Region CDI City
ProductInfrast-ructure Waste Health Education
33
51 Dhaka Bangladesh Asia-Pacific 47.1 57.5 48.8 0.0 84.6 59.252 Hanam Korea, Rep. Of Asia-Pacific 89.9 87.9 84.8 90.4 80.2 97.753 Hanoi Vietnam Asia-Pacific 74.2 59.6 72.0 90.0 35.0 69.054 Hohhot China Asia-Pacific 65.8 60.0 67.9 50.1 75.7 69.555 Hong Kong China Asia-Pacific 92.0 89.4 99.3 99.0 61.5 81.356 Jakarta Indonesia Asia-Pacific 69.2 66.2 57.3 46.7 79.0 95.757 Kathmandu Nepal Asia-Pacific 62.0 60.4 76.3 37.5 40.7 64.858 Lahore Pakistan Asia-Pacific 61.1 71.1 78.5 50.0 52.9 40.859 Mandaluyong Philippines Asia-Pacific 70.8 69.6 66.4 45.9 29.0 89.360 Medan Indonesia Asia-Pacific 58.0 40.8 54.6 42.6 31.8 72.761 Naga Philippines Asia-Pacific 66.7 70.3 55.4 43.0 44.0 80.262 Penang Malaysia Asia-Pacific 67.3 73.4 79.3 20.0 82.3 75.863 Phnom Penh Cambodia Asia-Pacific 39.2 40.1 40.1 0.0 86.3 49.064 Port Moresby Papua New Guinea Asia-Pacific 39.3 69.0 18.1 10.0 43.9 40.265 Pusan Korea, Rep. Of Asia-Pacific 88.6 83.1 89.3 84.7 71.0 97.966 Semarang Indonesia Asia-Pacific 58.1 47.0 34.8 37.2 69.6 93.567 Seoul Korea, Rep. Of Asia-Pacific 95.8 94.7 98.4 99.3 81.8 97.768 Singapore Singapore Asia-Pacific 94.5 91.6 99.5 100.0 64.8 88.669 Surabaya Indonesia Asia-Pacific 62.2 58.6 64.2 35.0 78.5 75.470 Suva Fiji Asia-Pacific 69.3 73.5 79.3 37.5 54.5 75.571 Sylhet Bangladesh Asia-Pacific 40.6 51.4 40.4 0.3 77.5 49.372 Tangail Bangladesh Asia-Pacific 35.3 48.7 28.3 0.0 80.5 38.173 Ulaanbaatar Mongolia Asia-Pacific 66.0 49.9 60.8 53.0 47.2 92.074 Vientiane Laos Asia-Pacific 47.1 44.0 58.0 0.0 65.9 71.375 Yangon Myanmar Asia-Pacific 51.3 47.4 65.3 0.0 54.7 73.476 Amal Sweden HIC 94.7 81.2 98.8 100.0 93.7 99.877 Ankara Turkey HIC 72.0 73.0 93.9 40.4 93.9 72.578 Aversa Italy HIC 81.7 82.2 96.3 45.6 93.3 90.779 Basel Switzerland HIC 95.2 91.5 99.7 100.0 86.8 89.880 Hull Canada HIC 98.0 97.2 98.8 100.0 82.9 99.581 Madrid Spain HIC 94.4 87.9 98.8 100.0 80.2 91.382 Melbourne Australia HIC 95.5 90.0 99.8 100.0 50.5 94.183 Pamplona Spain HIC 90.2 84.0 93.5 89.5 74.2 90.684 Stockholm Sweden HIC 97.3 93.5 99.5 100.0 75.6 99.885 Umea Sweden HIC 95.8 85.9 98.8 100.0 56.5 99.886 Armenia Colombia LAC 54.0 63.6 84.0 0.0 90.9 40.587 Asuncion Paraguay LAC 55.7 75.7 39.5 2.0 83.8 78.188 Belem Brazil LAC 53.0 51.6 50.5 0.0 90.2 84.389 Belize Belize LAC 63.0 64.3 58.8 45.0 87.2 64.790 Bridgetown Barbados LAC 77.9 87.1 69.9 53.5 89.3 88.691 Buenos Aires Argentina LAC 79.4 82.2 92.1 50.0 93.6 88.492 Cajamarca Peru LAC 72.5 58.4 62.8 78.5 89.9 84.193 Cienfuegos Cuba LAC 69.6 62.6 70.4 41.1 80.9 84.794 Ciudad Habana Cuba LAC 71.0 64.9 74.8 50.0 90.7 84.795 Ciudad Juarez Mexico LAC 72.6 75.4 76.8 48.5 84.3 80.496 Colon Panama LAC 66.2 58.4 58.8 45.0 89.2 82.297 Cordoba Argentina LAC 81.9 77.6 79.5 74.6 83.0 88.498 Cuenca Ecuador LAC 76.5 50.5 83.5 87.5 80.3 79.399 Gran Concepcion Chile LAC 79.9 81.5 88.6 52.9 82.3 86.7100 Guayaquil Ecuador LAC 69.0 61.1 63.8 51.7 85.4 83.3

Table B. CDI and component subindices
Components No. City Country Region CDI City
ProductInfrast-ructure Waste Health Education
34
101 Huanuco Peru LAC 59.5 36.2 49.3 50.0 83.4 84.1102 Huaras Peru LAC 41.9 43.6 30.0 0.0 81.3 48.8103 Icapui Brazil LAC 35.9 40.1 52.8 0.0 82.0 11.0104 Iquitos Peru LAC 53.2 51.2 69.4 32.0 86.3 37.7105 Kingston Jamaica LAC 62.7 63.0 66.2 20.0 80.5 74.5106 Leon Nicaragua LAC 48.9 52.8 45.7 0.0 84.6 65.5107 Lima Peru LAC 67.2 64.4 67.7 34.0 89.3 84.1108 Manta Ecuador LAC 52.1 35.1 65.0 0.0 85.4 82.8109 Maranguape Brazil LAC 62.1 51.6 47.0 49.0 82.0 84.3110 Marinilla Colombia LAC 66.4 62.0 88.9 50.0 51.6 52.7111 Medellin Colombia LAC 73.0 61.6 96.2 42.5 72.5 81.8112 Montego Bay Jamaica LAC 60.1 61.2 59.8 15.0 81.4 74.5113 Montevideo Uruguay LAC 72.5 81.5 87.9 17.1 88.3 89.4114 Port of Spain Trinidad and Tobago LAC 72.9 73.4 87.5 40.0 82.3 76.9115 Porto Alegre Brazil LAC 68.5 74.8 77.8 49.8 90.1 58.2116 Puyo Ecuador LAC 55.2 58.8 65.0 0.0 78.4 82.8117 Quetzaltenango Guatemala LAC 57.8 64.3 58.8 32.5 90.1 57.2118 Quito Ecuador LAC 60.2 57.6 76.6 0.0 77.8 88.3119 Recife Brazil LAC 69.9 68.2 64.8 54.5 86.1 86.1120 Rio de Janeiro Brazil LAC 79.4 82.3 86.2 62.6 76.5 84.3121 Rosario Argentina LAC 72.6 70.0 83.3 36.3 79.2 87.0122 San Salvador El Salvador LAC 70.2 72.5 82.3 40.6 68.8 70.9123 Santa Clara Cuba LAC 72.2 82.2 70.0 35.0 86.5 84.7124 Santa Cruz de la Sierra Bolivia LAC 64.3 55.8 60.7 58.5 84.1 72.4125 Santiago de Chile Chile LAC 79.2 74.9 92.8 51.7 60.3 86.7126 Santiago de los Caballeros Dominican Republic LAC 68.0 65.7 79.0 40.0 78.4 76.4127 Santo Andre Brazil LAC 76.8 51.4 93.0 65.0 83.4 88.7128 Tacna Peru LAC 57.9 50.0 53.1 32.0 70.1 85.5129 Tena Ecuador LAC 52.6 35.1 69.0 2.5 60.4 82.8130 Tome Chile LAC 80.3 74.8 74.8 75.4 62.9 86.7131 Tumbes Peru LAC 50.5 40.4 50.0 35.0 71.4 41.3132 Valparaiso Chile LAC 87.8 74.8 87.3 100.0 32.5 86.7133 Vina del mar Chile LAC 87.4 74.2 89.3 95.0 61.5 88.2134 Astrakhan Russian Federation Transitional 71.2 59.3 77.8 46.0 90.6 92.4135 Belgorod Russian Federation Transitional 77.3 69.7 82.5 50.5 90.3 98.7136 Belgrad Yugoslavia Transitional 69.6 69.0 91.7 10.4 88.7 90.1137 Bishkek Kyrgyzstan Transitional 55.8 64.0 42.9 7.5 87.3 86.2138 Bourgas Bulgaria Transitional 85.4 61.6 95.8 96.5 92.5 86.0139 Brno Czech Republic Transitional 89.6 79.9 90.9 100.0 84.7 86.8140 Bydgoszcz Poland Transitional 71.0 72.3 91.7 14.3 90.0 89.3141 Chisinau Moldova Transitional 76.9 54.0 94.5 71.2 86.2 84.3142 Gdansk Poland Transitional 77.4 73.8 87.1 51.8 85.6 85.2143 Katowice Poland Transitional 76.4 79.0 92.2 34.3 89.3 88.9144 Kostroma Russian Federation Transitional 75.1 64.5 79.6 54.9 87.6 94.2145 Ljubljana Slovenia Transitional 91.7 83.4 99.3 99.0 86.9 86.2146 Moscow Russian Federation Transitional 89.9 81.0 98.7 86.8 85.6 99.3147 Nizhny Novgorod Russian Federation Transitional 78.6 69.1 90.0 53.7 86.4 97.3148 Novomoscowsk Russian Federation Transitional 74.5 59.1 88.5 50.0 81.5 94.8149 Omsk Russian Federation Transitional 73.8 67.7 78.8 44.5 80.5 94.4

Table B. CDI and component subindices
Components No. City Country Region CDI City
ProductInfrast-ructure Waste Health Education
35
150 Poznan Poland Transitional 79.8 79.1 94.2 48.2 77.8 88.6151 Prague Czech Republic Transitional 89.6 83.0 98.4 88.5 78.5 87.4152 Pushkin Russian Federation Transitional 81.1 69.5 96.8 55.0 64.9 99.8153 Riga Latvia Transitional 75.8 71.8 89.5 45.0 77.8 87.2154 Sarajevo Bosnia and Herzegovina Transitional 68.1 56.1 78.8 75.0 61.0 47.0155 Sofia Bulgaria Transitional 79.1 70.9 93.7 58.5 53.7 86.3156 Surgut Russian Federation Transitional 77.6 82.0 86.7 46.6 73.8 88.3157 Tallinn Estonia Transitional 81.5 78.0 95.4 61.8 86.0 89.8158 Tbilisi Georgia Transitional 72.2 58.6 88.2 47.5 64.6 85.5159 Troyan Bulgaria Transitional 64.8 66.9 81.5 4.5 62.3 90.5160 Veliko Tarnovo Bulgaria Transitional 71.5 64.2 98.0 28.0 65.9 85.6161 Veliky Novgorod Russian Federation Transitional 76.2 67.5 86.2 49.0 87.0 97.5162 Vilnius Lithuania Transitional 83.3 75.2 88.9 77.0 53.9 88.3

i
Global Urban Indicators Database Version 2 The Global Urban Indicators Database version 2 contains urban data and indicators collected by the Urban Indicators Programme. Key indicators were collected in 232 cities. Values have been provided by cities and countries and were reported for the reference year 1998. Definitions are included at the end of this book. Comprehensive guidelines on significance, definitions and methodologies of indices are contained in the Istanbul+5 Guide to Urban Indicators available upon request from UN-Habitat and its website (www.unhsp.org/guo).

i
INDEX TO TABLES
List of cities ..................................................................................................................... 1 Cities/Countries/Region Countries/Cities/Region
1. Shelter .......................................................................................................................... 7
Tenure types Evictions House price & rent Access to water Land price to income ratios Household connections Housing rights
2. Social development ................................................................................................. 22
Under - five mortality Reported Crime rates Poor households Gross school enrolment ratios Urban violence Literacy Life expectancy at birth Urban violence
3. Environmental management .................................................................................... 37
Population Annual population growth Water Consumption Median water price Waste water treated Solid waste disposal Travel time Transport modes to work Disaster prevention & mitigation Local environmental plans
4. Economic development............................................................................................ 57
Informal employment City product Unemployment Public-private partnership
5. Governance ............................................................................................................... 62 Decentralisation Local government revenue & expenditures Citizens participation Transparency & accountability International cooperation
Definitions ..................................................................................................................... 72