indicators for urban air quality
DESCRIPTION
Indicators for Urban Air Quality. 14 th EIONET workshop on air quality assessment and management Warsaw 5-6 October 2009. Frank de Leeuw. Current set of UAQ indicators. Structural indicator Urban Audit Core set of Indicators (CSI04). In common. AirBase Data availability, uncertainty - PowerPoint PPT PresentationTRANSCRIPT
Indicators for Indicators for Urban Air QualityUrban Air Quality
14th EIONET workshop on air quality assessment
and management
Warsaw 5-6 October 2009
Frank de Leeuw
Frank de Leeuw, 14th AQ EIONET, October 2009
2
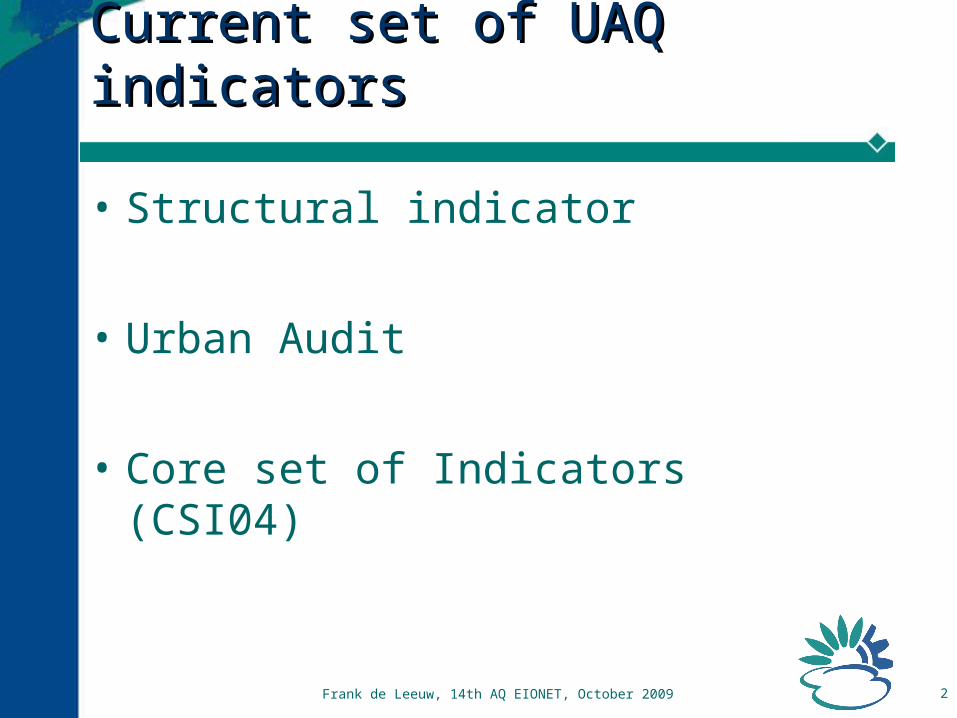
Current set of UAQ indicatorsCurrent set of UAQ indicators
• Structural indicator
• Urban Audit
• Core set of Indicators (CSI04)
Frank de Leeuw, 14th AQ EIONET, October 2009
3
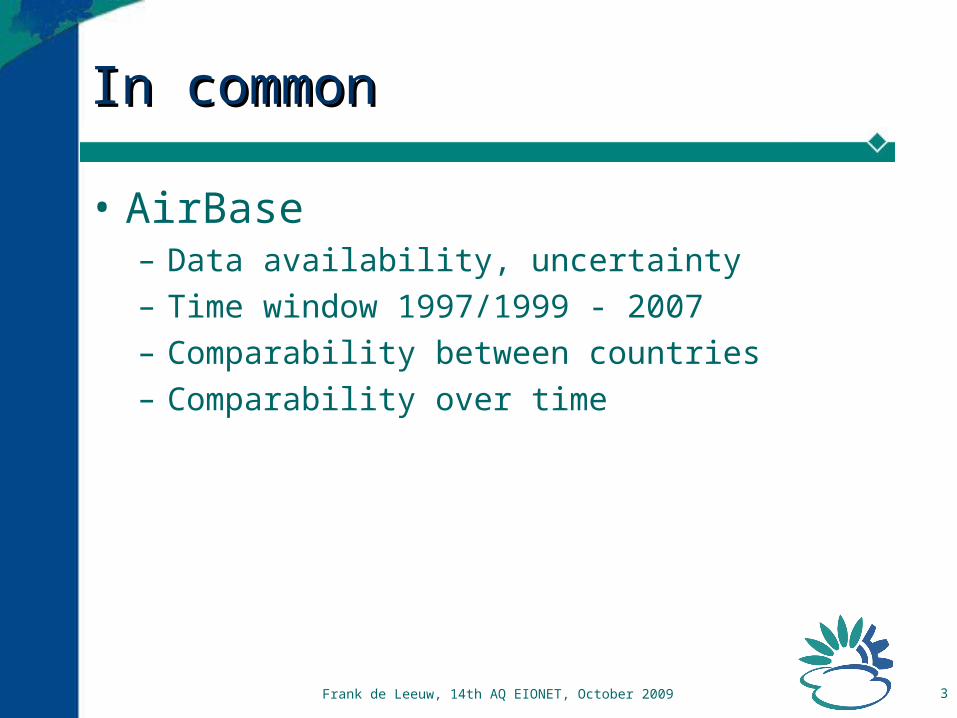
In commonIn common
• AirBase– Data availability, uncertainty– Time window 1997/1999 - 2007– Comparability between countries – Comparability over time
Frank de Leeuw, 14th AQ EIONET, October 2009
4
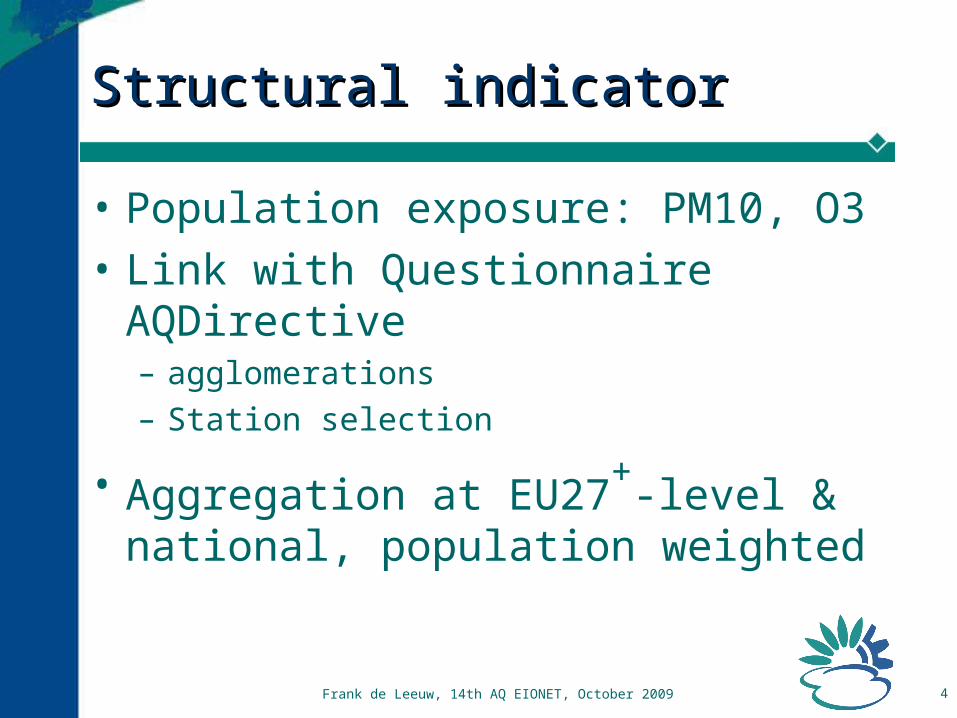
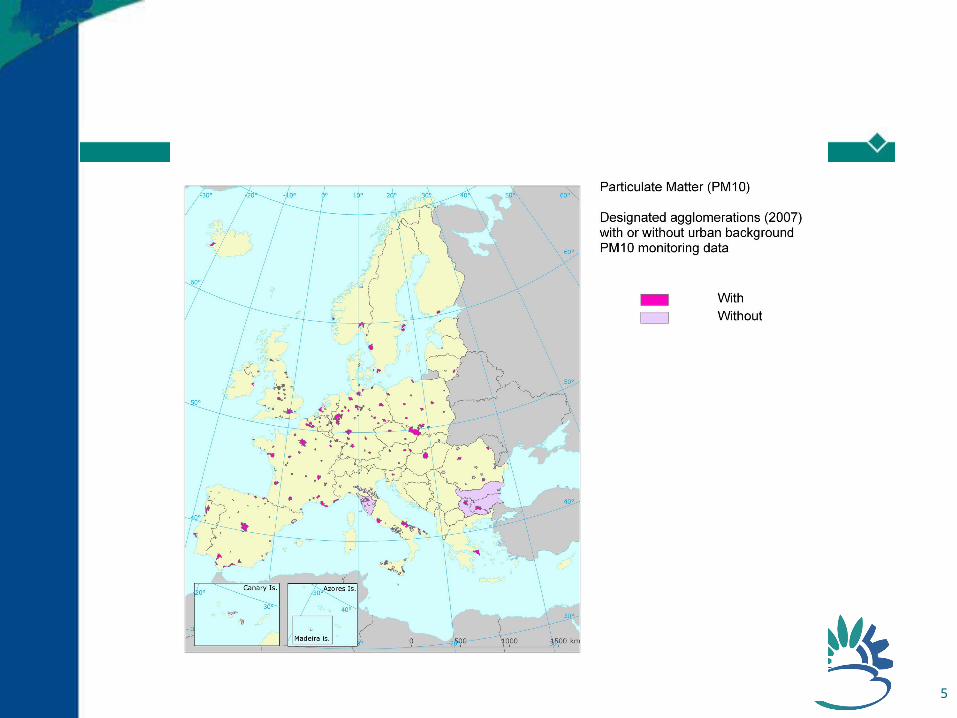
Structural indicatorStructural indicator
• Population exposure: PM10, O3
• Link with Questionnaire AQDirective– agglomerations – Station selection
• Aggregation at EU27+-level & national,
population weighted
Frank de Leeuw, 14th AQ EIONET, October 2009
5
Frank de Leeuw, 14th AQ EIONET, October 2009
6
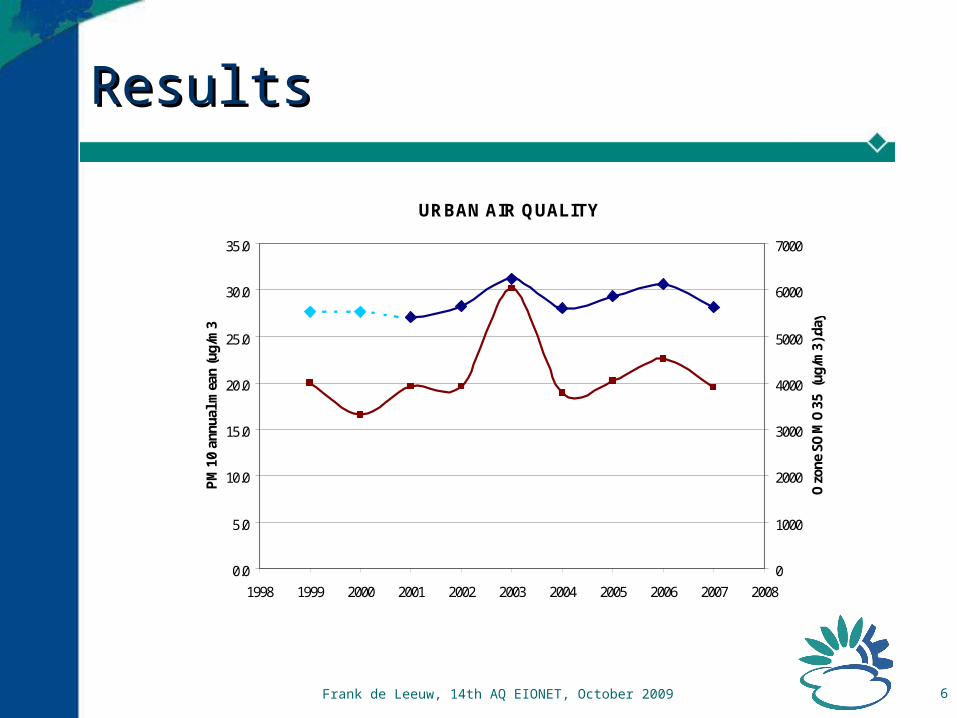
ResultsResults
URBAN AIR QUALITY
0.0
5.0
10.0
15.0
20.0
25.0
30.0
35.0
1998 1999 2000 2001 2002 2003 2004 2005 2006 2007 2008
PM
10 a
nnua
l mea
n (u
g/m
3)
0
1000
2000
3000
4000
5000
6000
7000
Ozo
ne S
OM
O35
(ug
/m3)
.day
Ozone
PM10
Frank de Leeuw, 14th AQ EIONET, October 2009
7
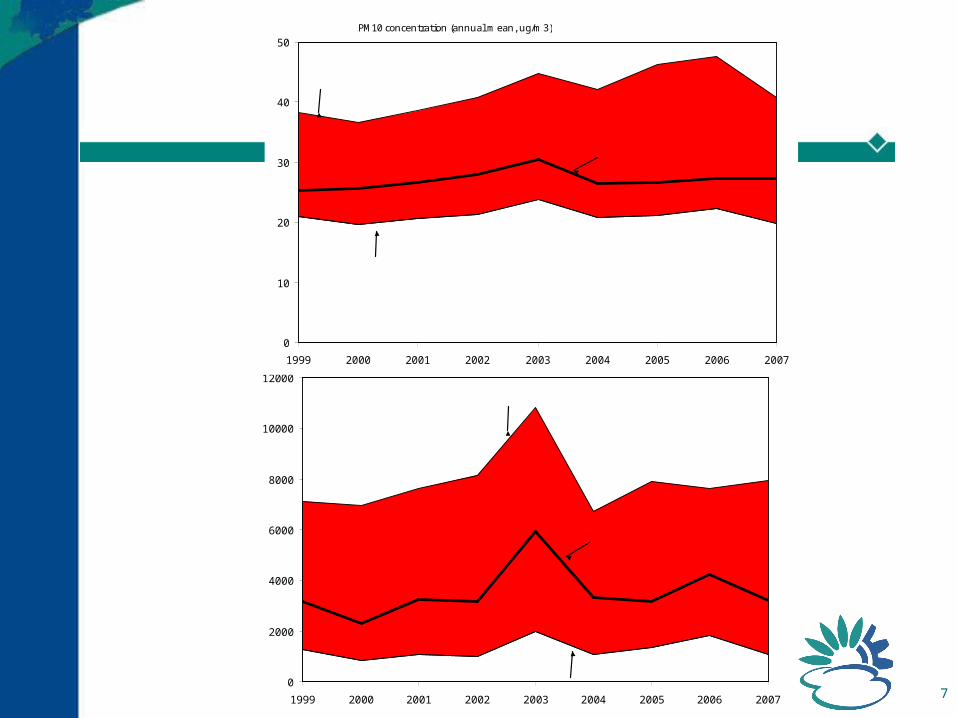
Ozone, SOMO35 values (ug/m3).day
0
2000
4000
6000
8000
10000
12000
1999 2000 2001 2002 2003 2004 2005 2006 2007
90% of th epopulation is exposed to a low er concentration
10% of the population is exposed to a higher concentration
this line indicates the median value: 50% of the population is exposed to low er levels
PM10 concentration (annual mean, ug/m3)
0
10
20
30
40
50
1999 2000 2001 2002 2003 2004 2005 2006 2007
90% of th epopulation is exposed to a low er concentration
10% of the population is exposed to a higher concentration
this line indicates the median value: 50% of the population is exposed to low er levels
Frank de Leeuw, 14th AQ EIONET, October 2009
8
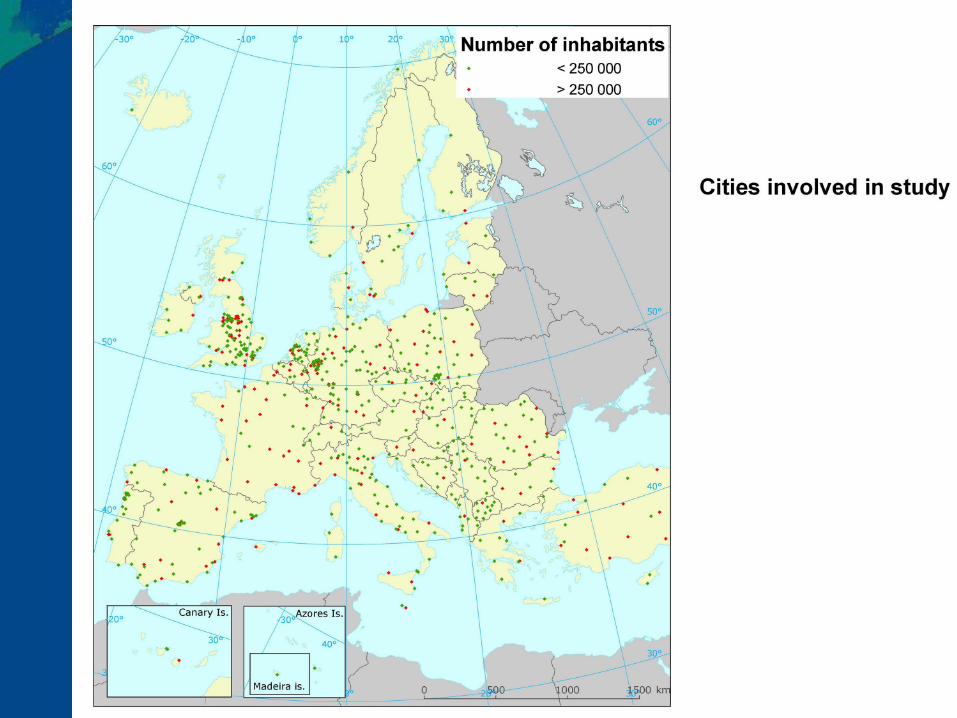
Urban AuditUrban Audit
• Compliance checking; exposure
• 6 sub-indicators: O3 (2), NO2 (2), PM10 (2)
• Station selection by GIS overlay
• No aggregation, only at city level; AQ results presented in City Profile
Frank de Leeuw, 14th AQ EIONET, October 2009
9
Frank de Leeuw, 14th AQ EIONET, October 2009
10
Frank de Leeuw, 14th AQ EIONET, October 2009
11
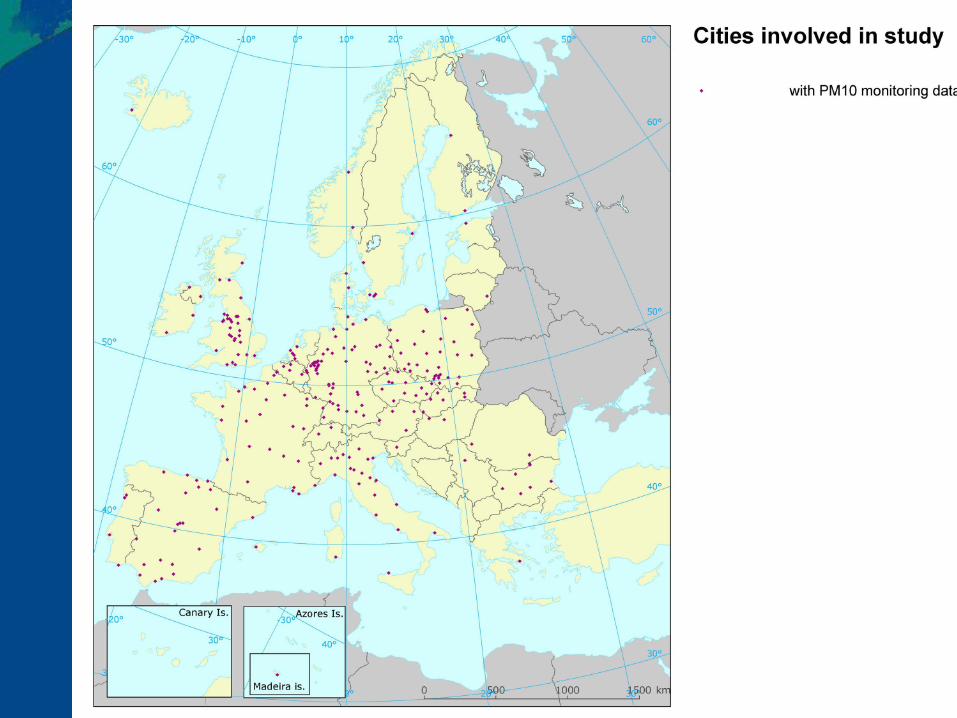
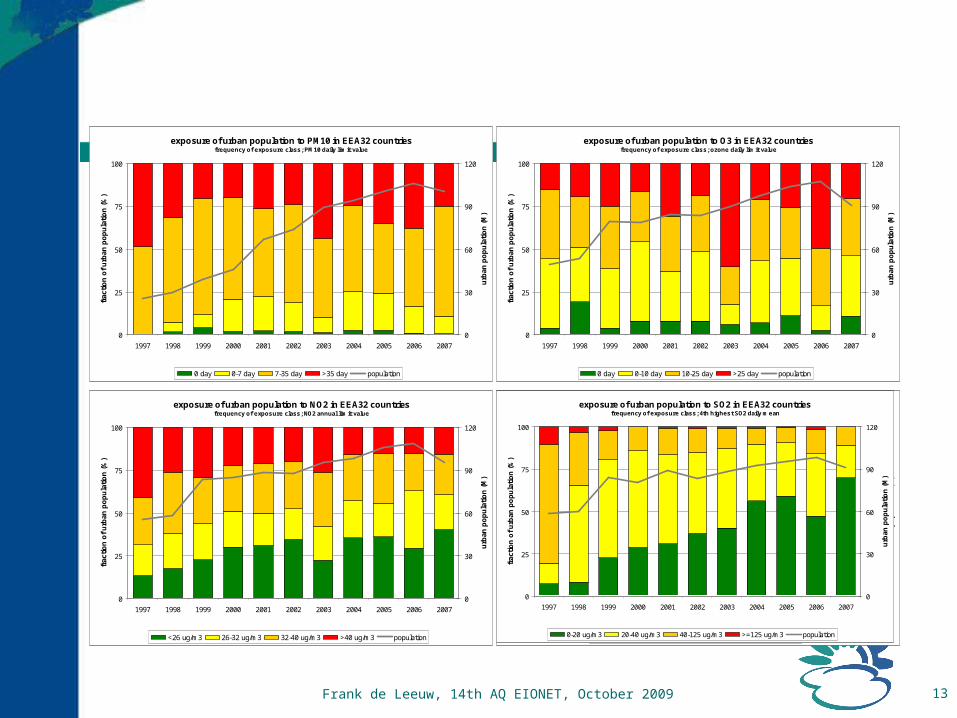
CSI04: urban air qualityCSI04: urban air quality
• “Compliance checking”: population exposed to concentration > LV/TV
• PM10-daily LV, NO2-annual LV, SO2 daily LV, ozone
• Station selection by overlay Urban Audit
• Aggregation at EEA-level from UA results
Frank de Leeuw, 14th AQ EIONET, October 2009
12
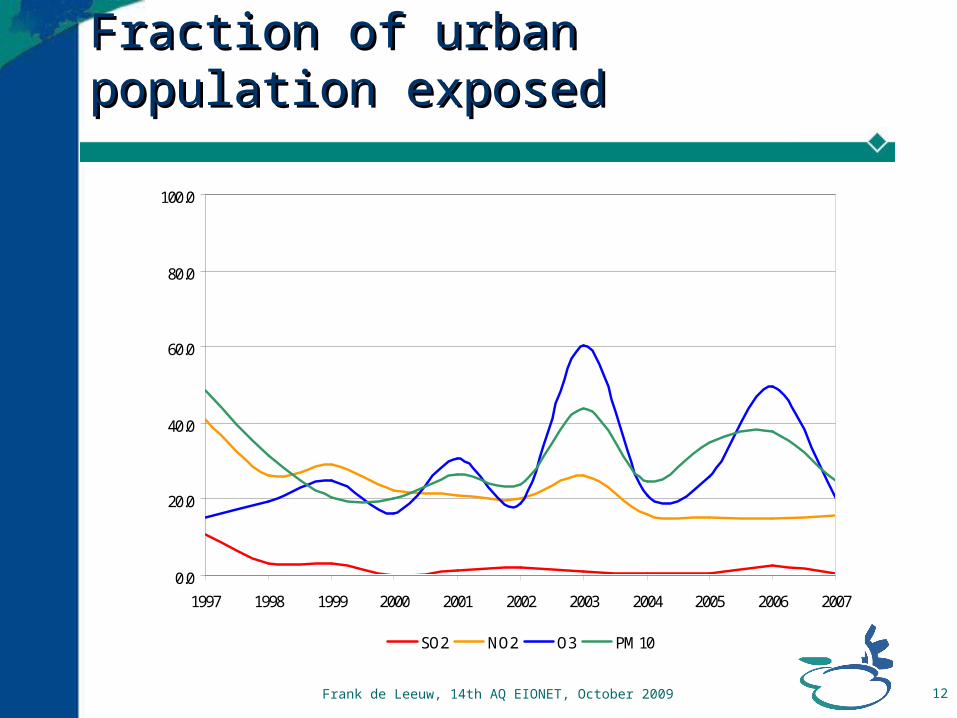
Fraction of urban population exposedFraction of urban population exposed
0.0
20.0
40.0
60.0
80.0
100.0
1997 1998 1999 2000 2001 2002 2003 2004 2005 2006 2007
SO2 NO2 O3 PM10
Frank de Leeuw, 14th AQ EIONET, October 2009
13
exposure of urban population to PM10 in EEA32 countriesfrequency of exposure class; PM10 daily limit value
0
25
50
75
100
1997 1998 1999 2000 2001 2002 2003 2004 2005 2006 2007
frac
tio
n o
f u
rban
po
pu
lati
on
(%
)
0
30
60
90
120
urb
an p
op
ula
tio
n (
M)
0 day 0-7 day 7-35 day >35 day population
exposure of urban population to O3 in EEA32 countriesfrequency of exposure class; ozone daily limit value
0
25
50
75
100
1997 1998 1999 2000 2001 2002 2003 2004 2005 2006 2007
frac
tio
n o
f u
rban
po
pu
lati
on
(%
)
0
30
60
90
120
urb
an p
op
ula
tio
n (
M)
0 day 0-10 day 10-25 day >25 day population
exposure of urban population to NO2 in EEA32 countriesfrequency of exposure class; NO2 annual limit value
0
25
50
75
100
1997 1998 1999 2000 2001 2002 2003 2004 2005 2006 2007
frac
tio
n o
f u
rban
po
pu
lati
on
(%
)
0
30
60
90
120
urb
an p
op
ula
tio
n (
M)
<26 ug/m3 26-32 ug/m3 32-40 ug/m3 >40 ug/m3 population
exposure of urban population to SO2 in EEA32 countriesfrequency of exposure class; SO2 daily limit value
0
25
50
75
100
1997 1998 1999 2000 2001 2002 2003 2004 2005 2006 2007
frac
tio
n o
f u
rban
po
pu
lati
on
(%
)
0
30
60
90
120
urb
an p
op
ula
tio
n (
M)
0 day 1 day 2 day >=3 day population
exposure of urban population to SO2 in EEA32 countriesfrequency of exposure class; 4th highest SO2 daily mean
0
25
50
75
100
1997 1998 1999 2000 2001 2002 2003 2004 2005 2006 2007
frac
tio
n o
f u
rban
po
pu
lati
on
(%
)
0
30
60
90
120
urb
an p
op
ula
tio
n (
M)
0-20 ug/m3 20-40 ug/m3 40-125 ug/m3 >=125 ug/m3 population
Frank de Leeuw, 14th AQ EIONET, October 2009
14
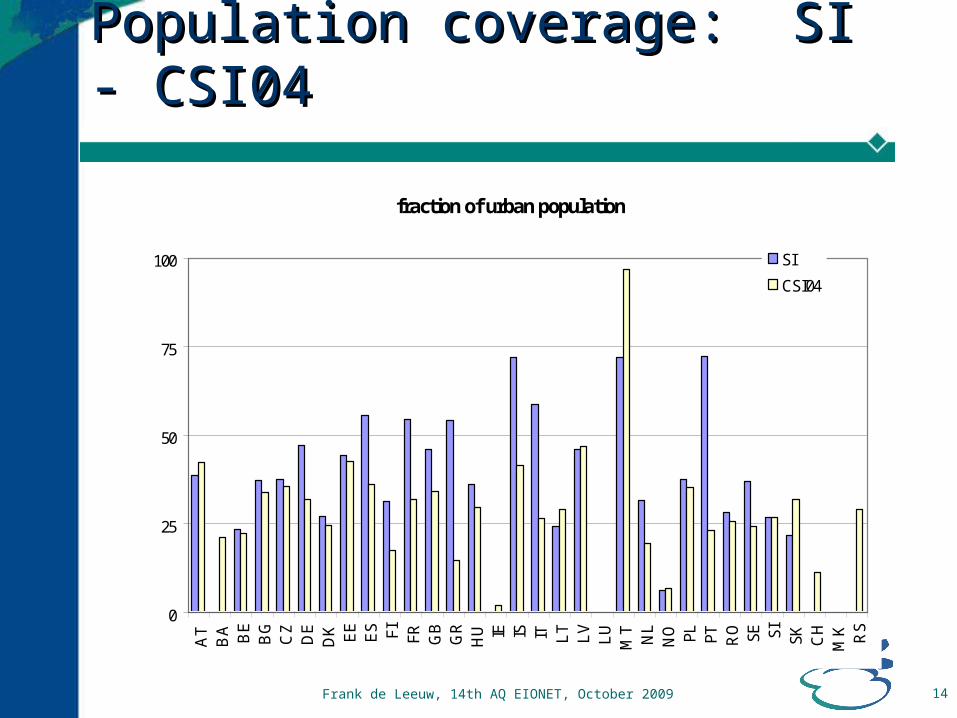
Population coverage: SI - CSI04Population coverage: SI - CSI04
fraction of total population
0
25
50
75
100
ATBA BE
BGCZDE
DK EEES FI FR GBGR
HU IE IS IT LTLVLU
MTNL
NO PL PT RO SE SI SK CH
MK RS
SI
CSI04
fraction of urban population
0
25
50
75
100
ATBA BE
BGCZDE
DK EEES FI FR GBGR
HU IE IS IT LTLVLU
MTNL
NO PL PT RO SE SI SK CH
MK RS
SI
CSI04
Frank de Leeuw, 14th AQ EIONET, October 2009
15
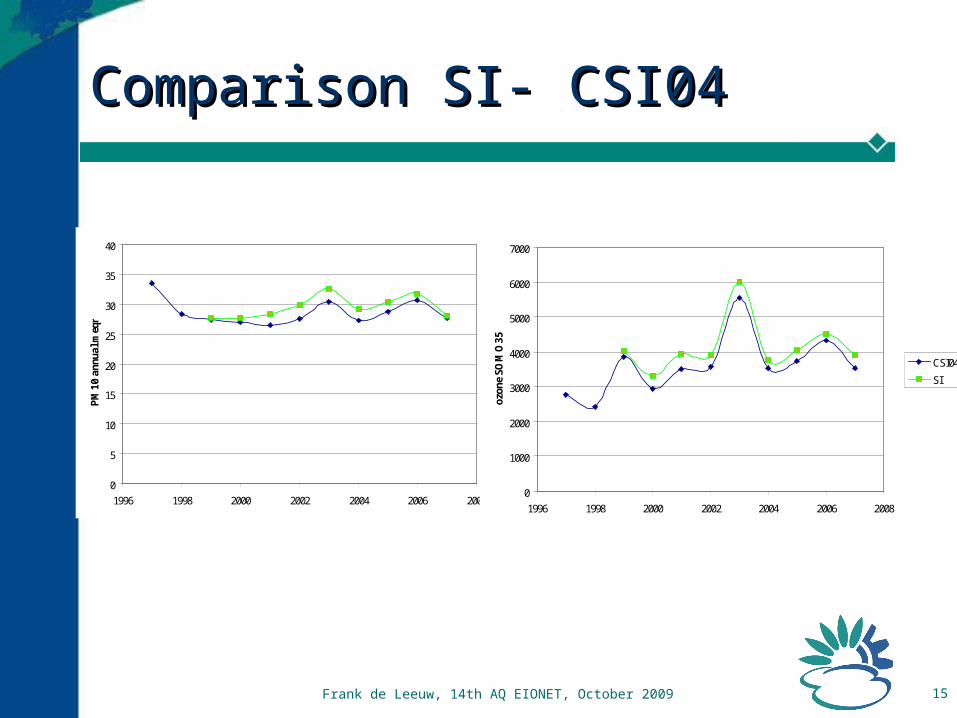
Comparison SI- CSI04Comparison SI- CSI04
0
5
10
15
20
25
30
35
40
1996 1998 2000 2002 2004 2006 2008
PM
10 a
nnua
l meq
n
CSI04
SI
0
1000
2000
3000
4000
5000
6000
7000
1996 1998 2000 2002 2004 2006 2008oz
one
SOM
O35
CSI04
SI
Frank de Leeuw, 14th AQ EIONET, October 2009
16
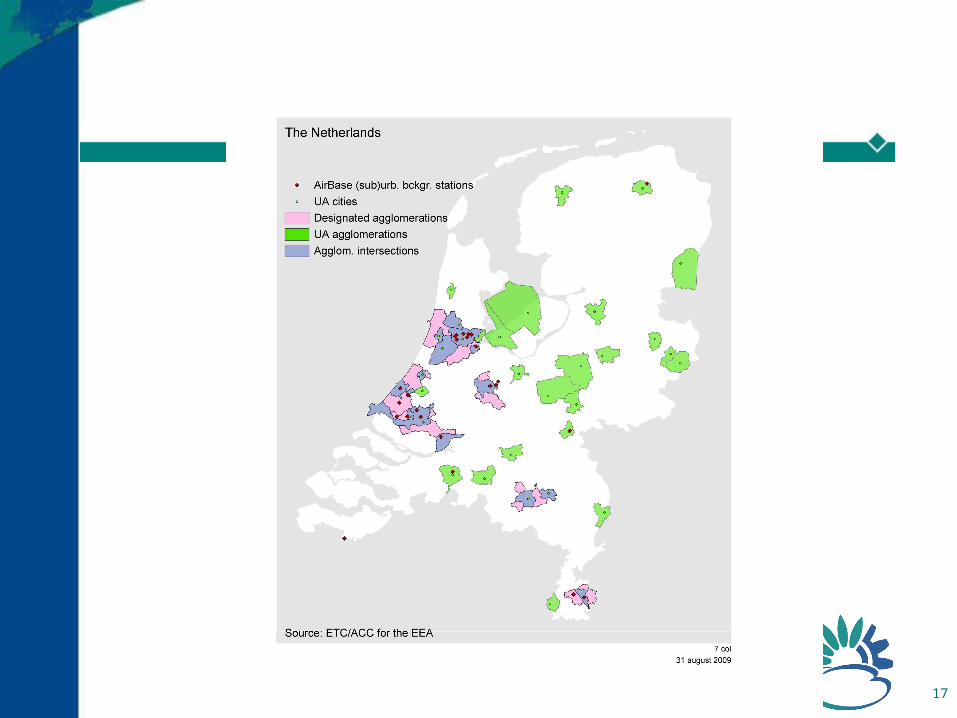
Frank de Leeuw, 14th AQ EIONET, October 2009
17
Frank de Leeuw, 14th AQ EIONET, October 2009
18
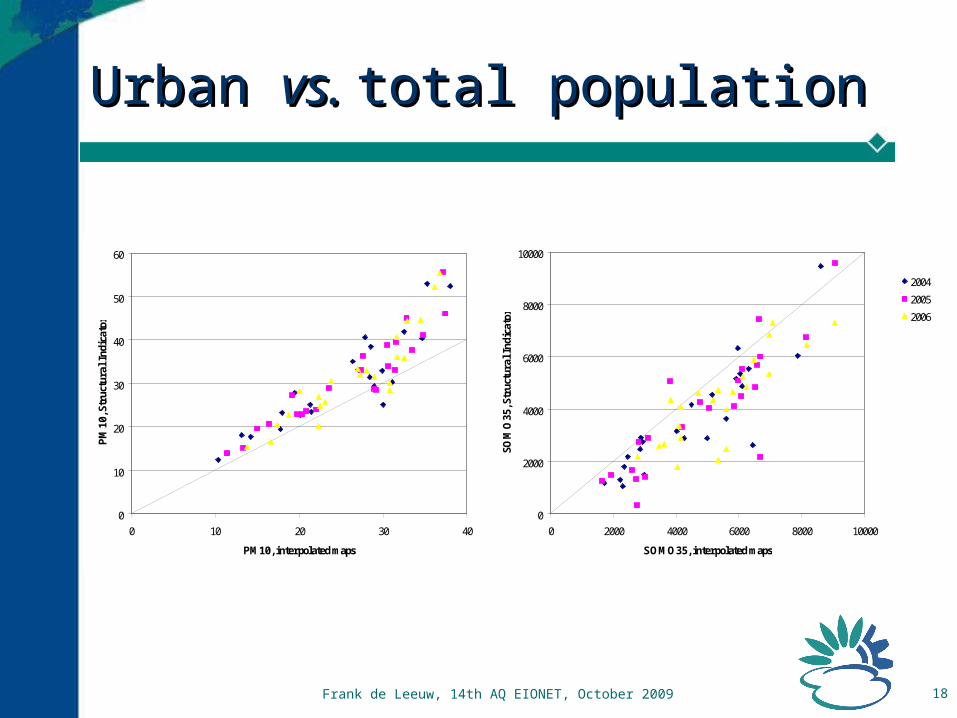
Urban Urban vs. vs. total populationtotal population
0
10
20
30
40
50
60
0 10 20 30 40
PM10, interpolated maps
PM
10, S
truc
tura
l Ind
icat
or 2004
2005
2006
0
2000
4000
6000
8000
10000
0 2000 4000 6000 8000 10000
SOMO35, interpolated maps
SOM
O35
, Str
uctu
ral I
ndic
ator
2004
2005
2006
Frank de Leeuw, 14th AQ EIONET, October 2009
19
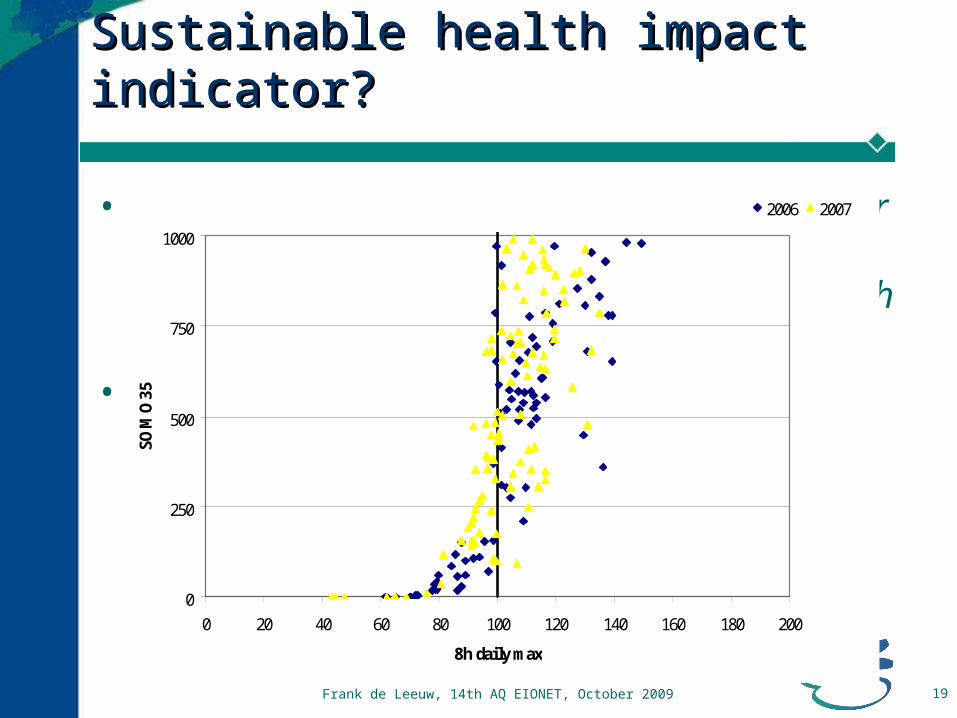
Sustainable health impact indicator?Sustainable health impact indicator?
• Objective set in 6th EAP: “levels of air quality that do not give rise to significant negative impacts on, and risk to human health and the environment”
• WHO AQGPM2.5 10 μg/m3 (annual)O3 100 μg/m3 (8h daily max)
500 (μg/m3).day (SOMO35)
0
250
500
750
1000
0 20 40 60 80 100 120 140 160 180 200
8h daily max
SOM
O35
2006 2007
Frank de Leeuw, 14th AQ EIONET, October 2009
20
Health indicatorHealth indicator
• Distance to target: loss in health compared to the sustainable levels: AQG
• Health loss expressed in …….
mortality in premature deaths or
life expectancy or
years of life lost
morbidity expressed in …..
Frank de Leeuw, 14th AQ EIONET, October 2009
21
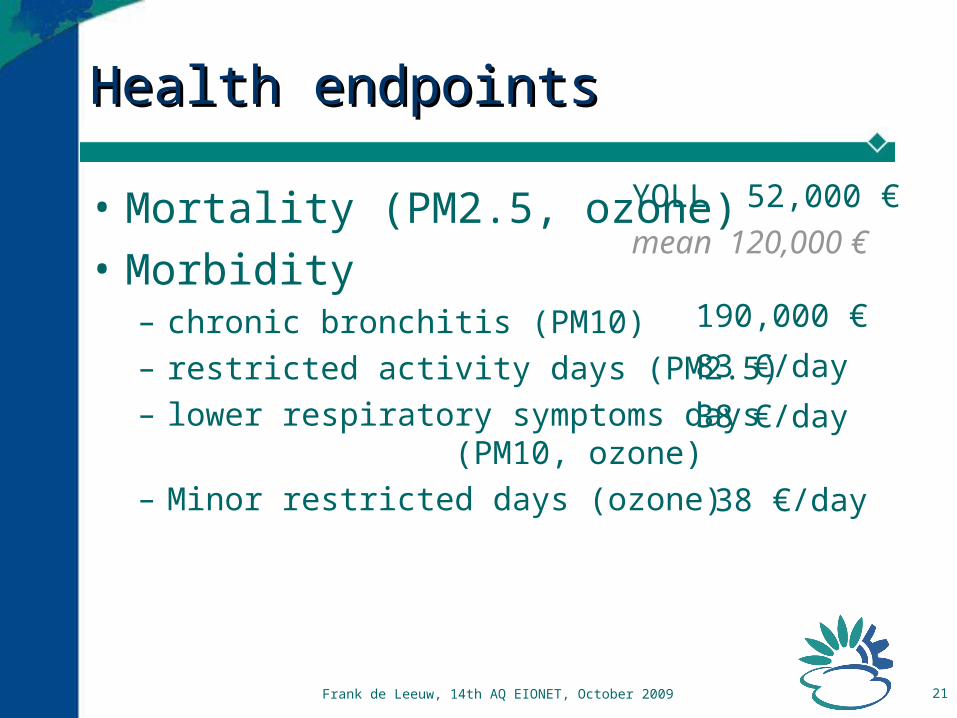
Health endpointsHealth endpoints
• Mortality (PM2.5, ozone)
• Morbidity – chronic bronchitis (PM10)– restricted activity days (PM2.5)– lower respiratory symptoms days
(PM10, ozone)– Minor restricted days (ozone)
YOLL 52,000 €
mean 120,000 €
190,000 €
83 €/day
38 €/day
38 €/day
Frank de Leeuw, 14th AQ EIONET, October 2009
22
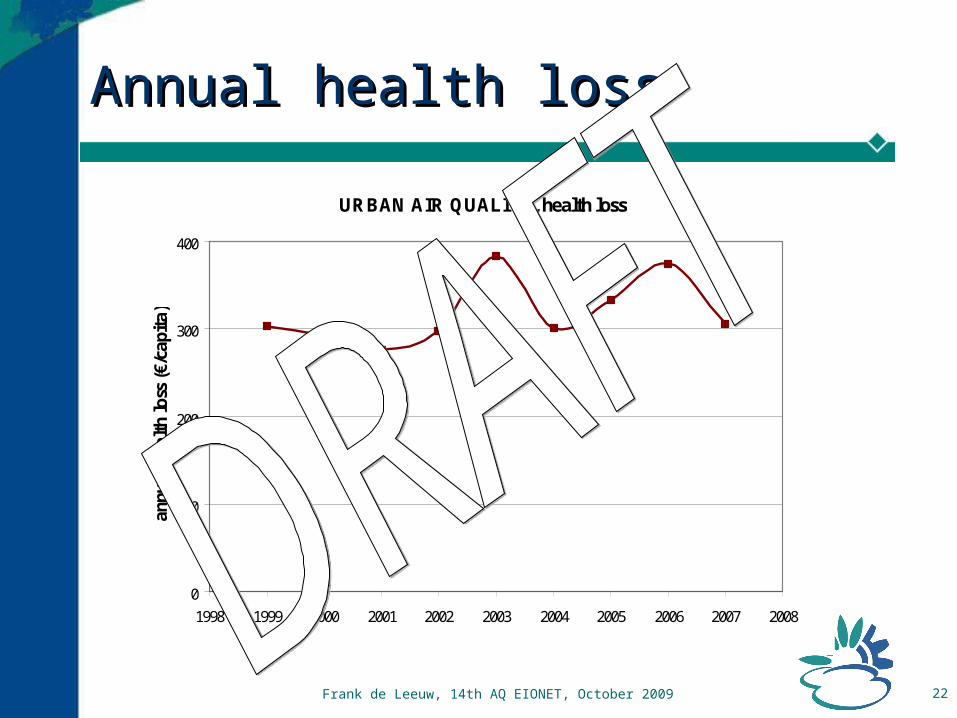
Annual health lossAnnual health loss
URBAN AIR QUALITY, health loss
0
100
200
300
400
1998 1999 2000 2001 2002 2003 2004 2005 2006 2007 2008
annu
al h
ealt
h lo
ss (
€/ca
pita
)
Frank de Leeuw, 14th AQ EIONET, October 2009
23
RecommendationsRecommendations
• include PM2.5
• how to present?
• steamline input: AirBaseUA cities & pop data
• selection of cities: all, >100k, >250k ?
• urban or total population?
• add health impact indicator?