global trends: emerging construction labour … trends: emerging construction labour markets march...
TRANSCRIPT

Global Trends: Emerging Construction Labour Markets
MARCH 2017

Global Trends: Emerging Construction Labour Markets March 2017
1
CONTENTS INTRODUCTION ...................................................................................................................................... 2
CANADA AND THE GLOBAL CONSTRUCTION MARKET ............................................................. 3
The turning tide ..................................................................................................................................... 5
CANADA’S COMPETITORS FOR GLOBAL CONSTRUCTION WORKERS .............................. 10
Language ............................................................................................................................................. 10
Age demographics ............................................................................................................................. 14
GLOBAL WORKFORCE SUPPLY ...................................................................................................... 15
Changes in migration by country ..................................................................................................... 17
Limitations of the analysis ................................................................................................................. 18
CONCLUSION ........................................................................................................................................ 18
APPENDIX .............................................................................................................................................. 19
REFERENCES ....................................................................................................................................... 22
Month Day Year
BuildForce Canada 220 Laurier Avenue, Suite 1150 Ottawa, ON K1P 5Z9 [email protected] buildforce.ca constructionforecasts.ca

Global Trends: Emerging Construction Labour Markets March 2017
2
INTRODUCTION BuildForce Canada’s 2017 Construction and Maintenance Looking Forward report shows that although the pace of construction growth is expected to slow, rising demands related to infrastructure and non-residential maintenance are expected to sustain demand for skilled workers. At the same time, demographic trends add to market challenges. As population growth slows, there are less youth available to enter the workforce as construction retirements increase. An estimated 248,000 construction workers, or 21 percent of the 2016 workforce, are expected to retire over the next decade and this represents a significant loss of skilled workers. Over the past decade of expansion, Canada ascended to one of the top 5 global construction markets. To meet the construction workforce demands of the expansion, industry significantly increased its reliance on international workers through the Temporary Foreign Worker (TFW) and Provincial Nominee programs. Canada’s ability to successfully recruit migrant workers was helped by weaker economic conditions in the United States and many other Western, English-speaking countries with similar education and trade standards, including the United Kingdom and Europe, still recovering from the effects of financial crisis. Much has changed since the 2015 collapse in oil prices and the extended contraction in capital investment that followed. The downturn led to significant declines in oil and gas engineering construction, which had substantial spillover effects on economic growth and the broader construction market in many parts of the country. Over the same period, energy-related construction demands slowed globally, but significant infrastructure investment and economic recovery continued to drive construction demands in many developed and developing countries, including the United States. Although the near-term demands for foreign workers have subsided, there are growing concerns about the potential loss of skilled workers in Canada to the United States and other countries experiencing relatively stronger demands. Once gone, there is a strong risk they will not be available when domestic engineering construction activity picks back up. This report revisits the state of global construction demands and changes in global migration flows to assess this risk in consideration of emerging competitive pressure. A key objective of this report is to identify any emerging changes in domestic and global construction demands or patterns in migration that may impact the supply of Canada’s construction labour force. The specific aims of this research are to identify:
1. Countries or regional hotspots with significant current and near-term energy and infrastructure construction requirements – These projects present the most significant recruitment challenges and require workers that tend to be more mobile and have specialized skills and qualifications.
2. Key competing markets – the subset of global construction hotspots with similar types of construction projects and similar skill and trade requirements that represent a source of direct competition to Canada’s recruiting from international markets
3. Source pools of global labour supply that currently provide workers to international construction markets
The first section of this report identifies and measures global construction activity, focusing specifically on identifying key global markets where energy and infrastructure projects are currently generating significant demand for construction workers, and where demand shifts are likely to occur in the near future. The second section explores the population and workforce characteristics of selected countries

Global Trends: Emerging Construction Labour Markets March 2017
3
that may pose the greatest direct competition to Canada when recruiting internationally. Finally, changes in global migration patterns are examined to identify where global hotspot countries are most likely to source construction workers to meet their workforce requirements.
CANADA AND THE GLOBAL CONSTRUCTION MARKET Construction activity in Canada continues to level off following a decade of exceptional growth driven by a protracted global resource expansion. In addition to resource-sector development in oil and gas and mining, Canada’s construction sector benefited from coinciding investments in mega electric power generation and transmission and other significant infrastructure. These combined investments propelled growth well ahead of other countries, elevating Canada to one of the top 10 construction markets in the world.1
The pace of the expansion put significant pressure on construction labour markets across Canada, drawing in thousands of international skilled workers with specialized skills and experience from the United States and countries from around the globe. Peaks in the number of foreign construction workers in Canada closely track recent high points in oil-and-gas-sector investment. As illustrated in Figure 1, the number of temporary foreign worker (TFW) positions on a Labour Market Impact Assessment (LMIA) in construction spiked in 2008 and again in 2012 and 2013. In the same years, well over half (56%) of TFW positions in construction were in Alberta. Many workers ultimately came from the United States, the United Kingdom and elsewhere.
Figure 1: Number of temporary foreign worker positions on positive Labour Market Impact Assessments, in the construction industry2
Source: Citizenship and Immigration Canada
1 Canada was ranked 7th largest construction market in 2010. https://infogr.am/worlds_largest_construction_markets 2 The data in this chart tracks temporary foreign worker (TFW) positions on a Labour Market Impact Assessment only; not TFWs that are issued a work permit or who enter Canada. Not all positions approved result in a work permit or a TFW entering Canada.
20,356
6,854 6,702 9,415
20,302
16,153
5,754 3,391
0
5,000
10,000
15,000
20,000
25,000
2008 2009 2010 2011 2012 2013 2014 2015
Num
ber o
f wor
kers

Global Trends: Emerging Construction Labour Markets March 2017
4
The collapse in the price of oil and other commodities marked a resounding end of the expansion, resulting in a sharp global recoil in capital spending and the delay or cancellation of billions of dollars in planned major energy-sector investment. According to Barclay’s annual E&P (Exploration and Production) spending survey, international capital expenditures fell 23 percent in 2015 with a further 18 percent decline in 2016. The decline was even more acute in North America where higher production and extraction costs contributed to a 50 percent drop in spending between 2014 and 2016; the first consecutive drop since the early 1980s.3 The scale of declines was similar to that in Canada, with a disproportionately large impact in Alberta’s oil sands.
In Canada, the slowdown in engineering construction was amplified by the winding down of various mega power and other infrastructure projects in several provinces. Notwithstanding the slowing pace of growth, in terms of project value, Canada still leads the globe in oil-and-gas-sector activity and maintains its position as one of the top 5 engineering construction markets in the world, surpassed only by India, the United States and China.
Table 1 compares aggregate project values, based on a custom data request from Construction Intelligence Center, for the top 10 countries with the largest aggregate value of known oil and gas, power and civil infrastructure projects, either currently under way or completed in 2016.4 At the start of 2017, the total value of tracked energy and infrastructure projects in Canada totalled just over US$1 trillion. Two-thirds ($615 billion) is attributed to oil-and-gas-sector projects, with an additional $300 billion in civil infrastructure and almost $120 billion in electric power infrastructure. China tops the list with nearly US$3 trillion in projects, with $2 trillion concentrated in civil infrastructure investments. The United States was in second place with US$1.9 trillion in energy and infrastructure projects distributed across all three categories. India leads in the value of power-sector projects and is third in spending on civil infrastructure.
Growth in power infrastructure investment is an important emerging trend in both developed and emerging economies. The need to build or rebuild electricity generation and transmission infrastructure is already a dominant driver of engineering construction in many countries, including the United Kingdom, China, Vietnam, Pakistan, Indonesia, Egypt and India, and is expected to grow in coming years.
3 Barclays research 4 Construction Intelligence Center data was selected to provide a consistent measure of construction project data across different countries. Total project values are reported in current $US. Oil and gas includes pipelines, O&G refinery and production facilities, storage tanks and liquefied natural gas (LNG). Power refers to electricity generation and transmission projects, and Civil infrastructure includes roads and bridges; air, rail and marine transportation; and water and sewage and communications infrastructure.

Global Trends: Emerging Construction Labour Markets March 2017
5
Table 1: Aggregate value ($US billions) of energy and infrastructure projects currently underway or completed in 2016, by top 10 countries
Country Ranks Oil and gas ($USb)
Power ($USb)
Civil infrastructure
($USb) Total
($USb)
China 1 $197 $707 $2,057 $2,961 United States 2 $582 $467 $882 $1,931 India 3 $162 $761 $760 $1,683 Canada 4 $615 $118 $295 $1,028 Australia 5 $252 $55 $667 $975 Russia 6 $223 $120 $390 $734 United Kingdom 7 $43 $312 $350 $705 Brazil 8 $234 $130 $194 $559 Indonesia 9 $162 $178 $214 $554 Vietnam 10 $66 $194 $206 $466
Source: BuildForce Canada; data provided by Construction Intelligence Center
The turning tide The latest 2017 BuildForce Canada outlook projects the pace of construction growth to continue to slow with the completion of major-energy sector projects still underway. Engineering construction investment, which contracted by 9.4 percent between the 2013 peak and 2016, is expected to decline further.5 While there are some new energy projects in the pipeline, they are fewer in number and are expected to be smaller in scale compared to the recent past. Overall engineering investment is anticipated to recover a modest 2.2 percent in 2017; decline in 2018 and then recede to below 2016 levels by 2023. This will likely result in the continued softening of labour market conditions in many regions of the country.
At the same time, there are indications that the construction industry south of the border is entering a “mature phase of expansion.” Dodge Data and Analytics predicts US construction starts to rise by 5 percent in 2017 and continue growth going forward.6 The forecast anticipates growth to be driven by both residential and non-residential segments, including strong gains in transportation and other civil infrastructure investment. According to Construct Connect, gains in transportation, communication and power investment will drive total civil engineering investment up 5.2 percent in 2017 and 7.8 percent in 2018.7
For the oil and gas sector, signals are emerging that global investment has bottomed out and may begin to rise. Barclays annual E&P spending survey estimates that global oil and gas capital expenditures will rise by 7 percent in 2017, led by a 27 percent increase in North America.8
5 2017 BuildForce Canada outlook 6 www.construction.com/news/new-construction-starts-2017-increase-5-percent-713-billion-dollars-dodge-data-analytics-oct-2016 7 www.constructconnect.com/blog/economy/u-s-construction-outlook-heading-2017 8 Barclays projects Global E&P spending will rise by 7 percent in 2017

Global Trends: Emerging Construction Labour Markets March 2017
6
These anticipated increases will raise demands at a time when unemployment rates in the United States have fallen to below historical norms, while rates in Canada have risen from lows experienced in 2012 and 2013. Figure 2 compares the average construction unemployment rates for the US and Canada between 2010 and 2017. As illustrated, the US rates have fallen from 21 percent in 2010 to 6.6 percent annualized rate in 2017, falling below rates in Canada which have trended upward since 2012.
Figure 2: Unemployment rate in construction, United States and Canada, annual average 2010 to 20179
Source: US Bureau of Labor Statistics, Statistics Canada, BuildForce Canada
The difference in the timing of construction cycles between Canada, the United States and other countries presents a potential “turning of the tide” in terms of labour flows. Slowing demands in Canada continue to reduce demands on temporary workers from outside the country, while growing requirements and low levels of unemployment in the United States are likely to increase the number of workers heading south of the boarder. The favourable exchange rate provides an added incentive for workers seeking opportunities resulting from softening conditions in Canada.
Rising engineering construction demands outside North America represent additional demands, which will likely increase global competition for skilled labour. To identify markets that represent the greatest competition for skilled labour, data on planned global energy and infrastructure construction projects was compiled from Construction Intelligence Center. Figure 3 shows the aggregate value ($US) of known energy and infrastructure projects with planned starts between 2017 and 2021 for the top 20 countries by total project value.
9 2017 estimate based on data for January and February only
20.6
16.4 13.8
11.3 8.9
7.3 6.3 6.6 9.3 8.4 7.6 7.9 8.0 8.9 8.7 7.9
0
5
10
15
20
25
2010 2011 2012 2013 2014 2015 2016 2017*Une
mpl
oym
ent r
ate
(%)
USA Canada

Global Trends: Emerging Construction Labour Markets March 2017
7
Figure 3: Aggregate value ($US billions) of energy and infrastructure projects with planned starts between 2017 and 2021, for top 20 countries
Source: BuildForce Canada; data provided by Construction Intelligence Center
The United States and India lead the way globally, each with well over a trillion dollars ($US) in planned energy and infrastructure projects. Canada, China and the United Kingdom follow, with aggregate project values upwards of $500 billion. Australia, Russia, France and Brazil round out the top countries, with projects valued at more than $250 billion.
This project-based analysis is consistent with other outlooks. The Global Construction 2030 report, published by Global Construction Perspectives and Oxford Economics, projects that growth in global construction will rise by $8 trillion, growing by 85 percent to 2030. According to the report, China, the United States and India are expected to account for more than half (57%) of anticipated growth. The primary growth drivers cited by the report are population growth, demographic shifts and the related needs to build or replace power and civil infrastructure.10
10 Global Construction Perspectives and Oxford Economics, Global Construction 2030 report

Global Trends: Emerging Construction Labour Markets March 2017
8
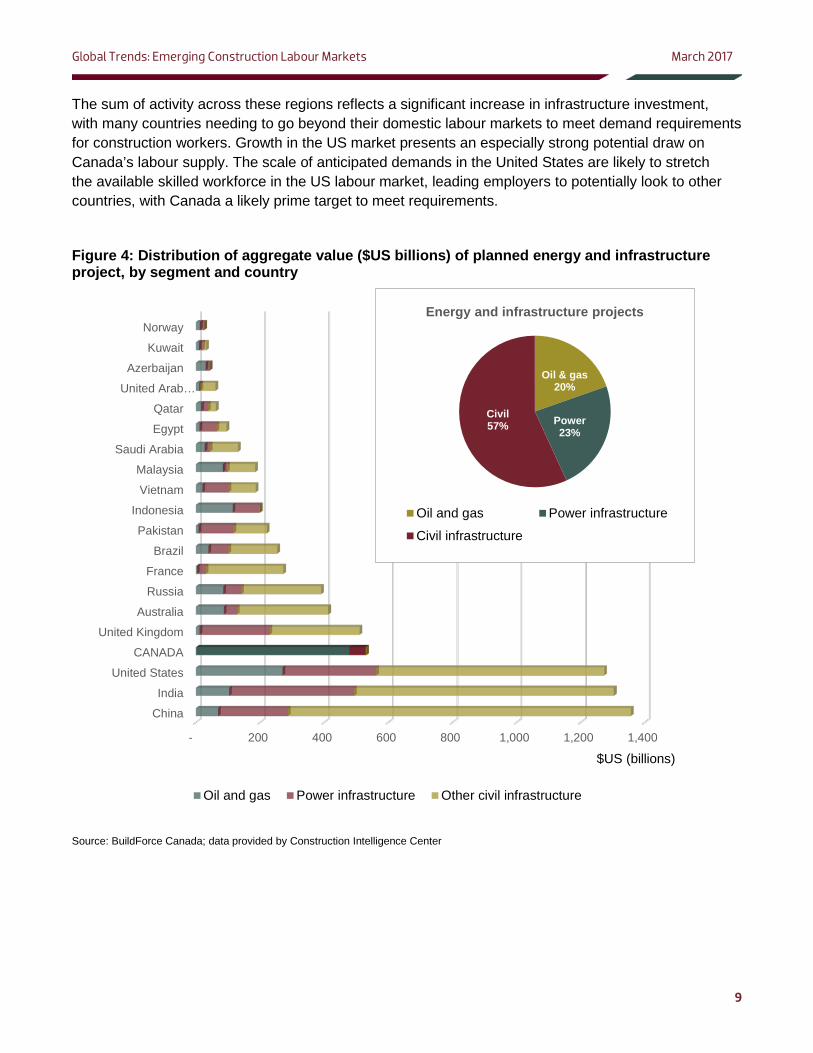
A closer analysis of energy and infrastructure project data, by category, reinforces the importance of power and civil infrastructure projects as the primary drivers of global engineering construction over the coming decade. Figure 4 shows the aggregate value of known planned energy and infrastructure projects broken out by oil and gas, power and infrastructure projects for individual countries.
Of the $7.5 trillion in planned energy and infrastructure projects tracked for the top 20 countries, civil infrastructure accounts for well above half (57%). The prominent role of infrastructure is evident in both developed and developing countries. In the developed world, infrastructure demands are driven by the need to replace, repair and modernize infrastructure built decades ago. This need is especially strong in the United States and the United Kingdom which have accumulated significant infrastructure deficits due to decades of underinvestment. These deficits were further impacted in many Western countries by government fiscal constraints brought upon by the financial crisis of 2009.
The value of known planned power and civil infrastructure projects in the United States sits at just over $1 trillion. The ambitious $1 trillion increase in infrastructure proposed by the new US administration would see the value of projects rise significantly higher. The time required to roll out the plan, however, will likely be years, rather than months, and the true value may be lower. In the United Kingdom, the $500 billion planned energy and infrastructure projects are split fairly evenly between power and civil infrastructure. Although there is increased uncertainty following the Brexit vote, economic growth is holding up better than economists expected and there is significant political pressure on the government to move forward on previous commitments, including ambitious transportation and other infrastructure projects.
In developing countries, led by China, India and other parts of Asia, population growth, the accelerating trend toward urbanization and changing geopolitics contribute to increased demands for new infrastructure.
China’s One Belt, One Road project, described as the reviving of a modern Silk Road trade route, aims to build new trade route corridors over land and sea connecting China and other countries across Asia. The government’s $1 trillion commitment to projects is motivated by China’s industrial overcapacity and the perceived need to increase cross-border trade.11 This adds to existing energy and infrastructure requirements.
India is expected to be the world’s fastest growing construction market, driven by rapid population growth and rate of urbanization. India’s government estimates it will need to $1.5 trillion in infrastructure over the next decade to connect 70,000 villages with roads as part of its modernization plans.12 The government will also need to invest billions in the country’s electricity infrastructure. India’s quality of electricity supply currently ranks 88th of 144 countries by the World Economic Forum.13
Canada’s 4th position, in terms of the overall value of planned energy and infrastructure projects, is largely due to its commanding lead in the value of oil-and-gas-sector projects. This value, however, includes many projects which were delayed or shelved as a result of the collapse in oil and commodity prices. The share of large oil and gas projects that go ahead depends largely on the long-term oil price outlook. That said, Canada also has ambitious infrastructure renewal plans and $200 billion in currently tracked infrastructure projects. 11 www.weforum.org/agenda/2016/06/why-china-is-building-a-new-silk-road 12 economictimes.indiatimes.com/news/economy/infrastructure/india-needs-1-5-trillion-for-infrastructure-arun-jaitley/articleshow/52922015.cms 13 The Global Competitiveness Report 2016–2017, World Economic Forum
Global Trends: Emerging Construction Labour Markets March 2017
9
The sum of activity across these regions reflects a significant increase in infrastructure investment, with many countries needing to go beyond their domestic labour markets to meet demand requirements for construction workers. Growth in the US market presents an especially strong potential draw on Canada’s labour supply. The scale of anticipated demands in the United States are likely to stretch the available skilled workforce in the US labour market, leading employers to potentially look to other countries, with Canada a likely prime target to meet requirements.
Figure 4: Distribution of aggregate value ($US billions) of planned energy and infrastructure project, by segment and country
Source: BuildForce Canada; data provided by Construction Intelligence Center
- 200 400 600 800 1,000 1,200 1,400
China
India
United States
CANADA
United Kingdom
Australia
Russia
France
Brazil
Pakistan
Indonesia
Vietnam
Malaysia
Saudi Arabia
Egypt
Qatar
United Arab…
Azerbaijan
Kuwait
Norway
$US (billions)
Oil and gas Power infrastructure Other civil infrastructure
Oil & gas 20%
Power 23%
Civil 57%
Energy and infrastructure projects
Oil and gas Power infrastructure
Civil infrastructure

Global Trends: Emerging Construction Labour Markets March 2017
10
CANADA’S COMPETITORS FOR GLOBAL CONSTRUCTION WORKERS The anticipated slower construction growth scenario in Canada means we are not likely to witness any significant spikes in demands for TFWs. Steady domestic demand alongside rising retirements and declining rates in natural population growth, however, will continue to increase Canada’s reliance on permanent immigration. At the same time, the workforce requirements represented by the global increase in energy and infrastructure construction are likely to restrict Canada’s access to the skilled worker class of immigrants, and recruitment of skilled workers internationally will become increasingly difficult.
Understandably, competition is strongest between countries and regions with the most similar construction workforce requirements in terms of trade standards, certification requirements and language.
This section examines the language, workforce education attainment and broad population demographics of countries identified as growth markets to provide insights into which countries pose the greatest direct competition to Canada’s international workforce requirements.
Language The ability for workers to communicate in one of Canada’s official languages (English or French) is a fundamental qualification for employment in the construction industry. Countries where English or French IS the official language, or IS commonly spoken, are a natural recruitment target among Canadian employers.
Of the 20 countries identified as global hotspots for energy and infrastructure construction activity, English or French is either the official language, or commonly spoken language in nine of them (identified in Table 2). Western countries, including the United States, the United Kingdom, Australia and France top the list as obvious sources and potential competitors, but other countries, including India, Algeria, Nigeria, Vietnam and South Africa, are also seeking English- and French-speaking workers to meet their domestic workforce requirements.

Global Trends: Emerging Construction Labour Markets March 2017
11
Table 2: Top 20 countries where English or French is either the official language, or is commonly spoken
Country Spoken language(s)
English French Algeria
Australia Brazil
Canada Chile China Egypt France India Iran Iraq
Mexico Nigeria
Pakistan Peru
Russia South Africa
United Kingdom United States
Vietnam Source: Central Intelligence Agency (CIA), The World Factbook: www.cia.gov/library/publications/the-world-factbook/fields/2098.html; New South Wales, Government Database (2007), www.hnehealth.nsw.gov.au/__data/assets/pdf_file/0003/92496/Languages_Spoken_in_Each_Country_of_the_World.pdf
Education attainment International workers need the right skills, training and experience to integrate with Canada’s construction workforce and make a meaningful contribution to meeting our country’s construction labour requirements. Countries with equivalent or similar occupational certification and training standards are hence the most likely source for international labour and, again, the greatest potential competitor for workers.
Obtaining detailed information about occupation certification requirements and training standards for individual countries is difficult. The educational attainment of the general population of a country, however, serves as a suitable gauge for the relative levels of education and training of the domestic workforce.
Population data obtained from the Organization for Economic Cooperation and Development (OECD) provides a comparison of education attainment. Education at the upper secondary and tertiary levels

Global Trends: Emerging Construction Labour Markets March 2017
12
was compared for the 25 to 64 age group for countries where data was available. Upper secondary education includes the equivalent of secondary school, trade certification and apprenticeship, while tertiary education includes those with a certificate from an advanced post-secondary institution (college and university or equivalent). A breakout of vocational training was available for some countries.
Figure 5 illustrates that Canada ranks first in terms of tertiary education attainment, with 55 percent of the 25 to 64 population. Canada, however, is well down the list when it comes to vocational education attainment, with only 11 per cent. In Germany, Poland and Hungary, the share of the population with vocational education attainment is at or above 50 per cent. This analysis suggests that many of the countries identified with significant construction labour demands also have well-educated populations and, in many cases, much larger proportions of the population that have attained vocational training. This suggests meeting skilled trades demands is relatively more challenging in Canada compared to many European countries. Although there is no directly comparable vocational attainment statistics for the United States, the higher proportion of upper secondary and non-tertiary to tertiary suggests a larger share of the working population is available to meet demands for skilled trades occupations.
Figure 5: Education attainment – share of population aged 25–64 that attained upper secondary, post-secondary and tertiary in 2015, percent (%)14
Source: OECD
14 Data reference year for some non-OECD countries ranges between 2010 and 2014
0 20 40 60 80 100
RussiaPoland
CANADAUnited States
LatviaGermanyHungaryNorwayIreland
United KingdomAustralia
FranceNetherlands
New ZealandIceland
ItalySaudi Arabia
BrazilPortugal
South AfricaChina
Upper secondary and post-secondary non-tertiary educationTertiary educationVocational education
%
Global Trends: Emerging Construction Labour Markets March 2017
13
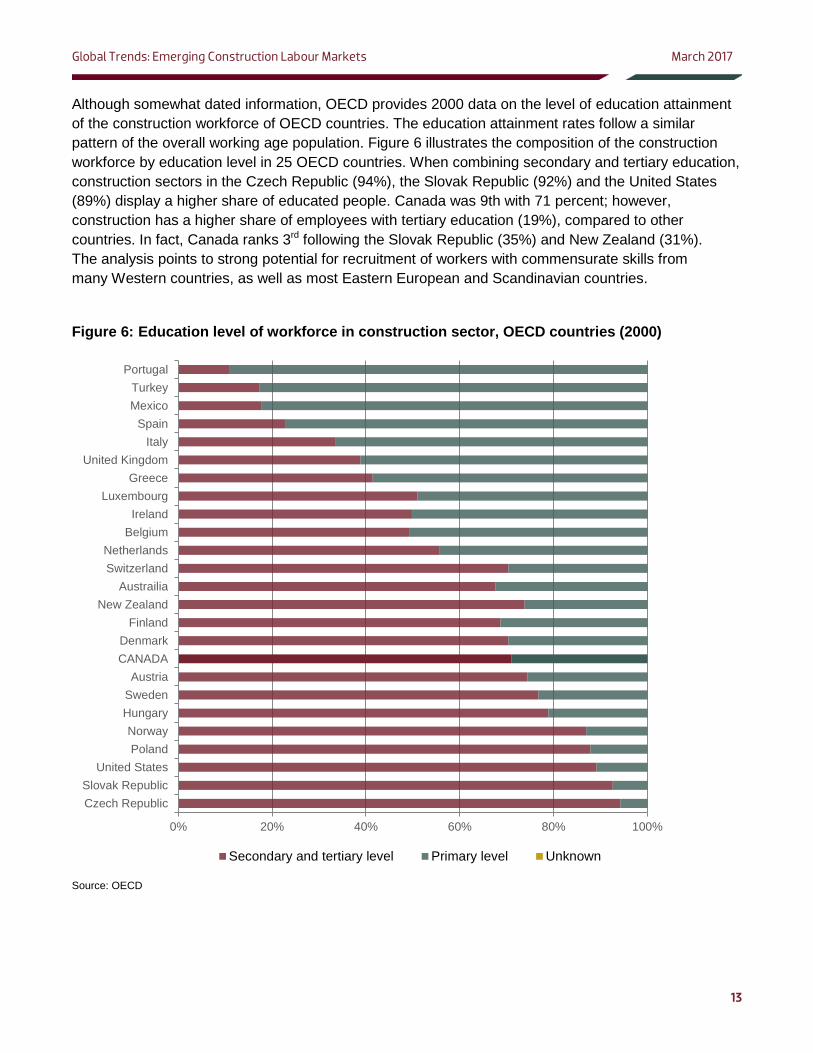
Although somewhat dated information, OECD provides 2000 data on the level of education attainment of the construction workforce of OECD countries. The education attainment rates follow a similar pattern of the overall working age population. Figure 6 illustrates the composition of the construction workforce by education level in 25 OECD countries. When combining secondary and tertiary education, construction sectors in the Czech Republic (94%), the Slovak Republic (92%) and the United States (89%) display a higher share of educated people. Canada was 9th with 71 percent; however, construction has a higher share of employees with tertiary education (19%), compared to other countries. In fact, Canada ranks 3rd following the Slovak Republic (35%) and New Zealand (31%). The analysis points to strong potential for recruitment of workers with commensurate skills from many Western countries, as well as most Eastern European and Scandinavian countries.
Figure 6: Education level of workforce in construction sector, OECD countries (2000)
Source: OECD
0% 20% 40% 60% 80% 100%
Czech RepublicSlovak Republic
United StatesPolandNorway
HungarySwedenAustria
CANADADenmark
FinlandNew Zealand
AustrailiaSwitzerlandNetherlands
BelgiumIreland
LuxembourgGreece
United KingdomItaly
SpainMexicoTurkey
Portugal
Secondary and tertiary level Primary level Unknown

Global Trends: Emerging Construction Labour Markets March 2017
14
Age demographics Age demographics are a dominant theme in the dialog about Canada’s workforce requirements. The aging of the population is contributing to an acceleration in annual retirements and workforce replacement demands. At the same time, slowing population growth results in an increased reliance on immigration to meet workforce demands and sustain economic growth, especially in Atlantic Canada.
As of 2015, 29 percent of Canada’s working age population (15 to 64) was between the ages of 50 and 64 and expected to retire or exit the labour market over the next decade. This is the second-oldest demographic profile among top 20 countries, but not significantly older than France, the United States and the United Kingdom. In the construction industry, BuildForce estimates that replacement demands will total 248,000 workers over the next decade.
Figure 7 shows the results of a review of age demographics across countries with similar construction demands provides insights into which countries might present opportunities for recruitment and those which may be competing with Canada for workers to meet their own domestic aging workforce challenges.
OECD population data shows that, like Canada, many Western countries are facing growing replacement demand challenges due to an aging workforce. India stands out as one of the few top construction market countries with significantly lower potential replacement demand requirements.
Figure 7: Age distribution of the working age population, 2015
Source: United Nations, Department of Economic and Social Affairs, Population Division (2015)

Global Trends: Emerging Construction Labour Markets March 2017
15
The central conclusion drawn from the analysis of the language, workforce education attainment and broad population demographics of countries identified as growth markets for energy and infrastructure construction is that they are facing similar workforce replacement demand requirements and many will be competing directly with Canada’s construction industry to recruit workers with the same language and qualification requirements.
GLOBAL WORKFORCE SUPPLY To better understand how current global labour requirements are being met through immigration, data from the United Nations’ Department of Economic and Social Affairs on trends in international migration was analyzed to map the change in global migration patterns between 2010 and 2015 from origin countries to countries with THE largest energy and infrastructure project demands.15 The data illustrates changes in the number and share of a country’s population that is foreign born. This provides a snapshot of recent migration flows and where migrants came from. Although these numbers are not specific to construction, they provide insights into established patterns of migration between countries that feed the overall labour market.
Figure 8 illustrates the countries with the strongest levels of energy and infrastructure construction activity and general patterns of in-migration to these countries. As indicated by the red regions, the United States and India lead globally with more than $1 trillion in planned energy and infrastructure projects with start dates between 2017 and 2021. The value of projects in Canada and China is in the order of $500 billion, as reflected by the orange regions on the map. The migrant patterns are reflected by:
• Source direction: the arrows link the source country to the destination country
• Number: the size and style of the line indicates the change in the number of migrants to a country for three levels of aggregation: migration of 100,000 or greater people to a country has the thickest solid line followed by countries with between 50,000 and 100,000 migrants, denoted by a dashed line, and finally the smallest group (thinnest dotted line) with less than 50,000 migrants.
• Share: the colour of the line reflects the source country’s share of the destination country’s total migrant population. The dark blue line indicates that the source country accounts for more than 20 percent, the red line greater than 10 percent; purple indicates between 5 and 10 percent and the light blue line is less than 5 percent of total in-migrants.
• The map also shows the overall change (%) in the number of migrants between 2010 and 2015. This is denoted by % next to the country name.
15 United Nations, Department of Economic and Social Affairs, Population Division

Global Trends: Emerging Construction Labour Markets March 2017
16
Figure 8: Mapping change in international migration flows to global construction hotspots (demand) and migrants’ countries of origin, 2010 to 2015
Source: BuildForce Canada; United Nations, Department of Economic and Social Affairs (2013), Trends in International Migrant Stock: Migrants by Destination and Origin (United Nations database, POP/DB/MIG/Stock/Rev.2015)
Figure 8 highlights a number of dominant global migration patterns and relationships with potential implications for Canada. Firstly, the analysis illustrates Canada’s dependence on migration from many of the same countries as some of the other large global construction markets, including the United States, the United Kingdom and Australia. All three rely heavily on migration from China, India, European countries, the Philippines and Vietnam. A second important feature is the significant flows of migration between them.

Global Trends: Emerging Construction Labour Markets March 2017
17
This dynamic has become increasingly important with the accelerating pace of recovery in the United States. The number of migrants in the United States increased by 6 percent over the five years following the financial crisis. This is considerably slower compared to increases in China (15%), Australia (15%), Canada and the United Kingdom (12%) over the same period. A stronger US growth outlook is likely to increase the number and share of global migrants to the United States, thus increasing competition for Canada.
Changes in migration by country In Canada, the number of migrants increased by 825,000, or 12 percent, between 2010 and 2015. The biggest contributions came from China (75,000), India (65,000), the United Kingdom (64,000) and the United States (36,000).
In the United States, Mexico remains the biggest single source of migrants. The number of Mexican migrants in the US increased by 480,000 and accounted for 20 percent of the total increase between 2010 and 2015. Over the same period, migration from Caribbean countries was just over 500,000. The United States also attracted an estimated 275,000 migrants from both China and India, 127,000 from Vietnam and 30,000 from the United Kingdom. That is almost four times the number of migrants from the very same countries Canada depends on for 25 percent of its immigration growth.
Australia, like Canada, also draws significant numbers of migrants from China (80,000), India (60,000) and Vietnam (38,000). This is not surprising given Australia’s geographic proximity to Asia. Australia, however, attracted its largest number of migrants from the United Kingdom (102,000). With common sources of immigration and similar oil and gas and mining construction requirements, Australia continues to pose direct competition to Canada’s immigration targets.
The United Kingdom stands out in this analysis because it is a large construction market and represents both a key source of supply of migrants for Canada and other Western countries and a destination for significant numbers of migrants from India, Pakistan, Eastern European countries and Germany. Its role as a global gateway for migration has a strong influence on global migration flows. It is unclear what, if any, impact Brexit may have on global migration patterns and the implications on possible changes.
China is one of the top 3 construction markets, but a net exporter of migrants. The migrant population rose to 978,000 in 2015, an increase of 15 percent from 2010. Excluding Hong Kong, the largest increase was attributed to an increase of 128,000 migrants from the Republic of Korea. China also attracts smaller numbers of migrants from many countries. The largest source countries include Brazil, the Philippines and Indonesia.
Other highlights:
• About a quarter of new migrants to Brazil come from Portugal, with the remainder from other South American countries. A significant number, however, also come from selected Western European countries and Japan.
• The Middle East depends almost entirely on workers from India, Pakistan and Sri Lanka to meet their domestic workforce requirements. Workforce requirements in Algeria and Nigeria are mostly met from neighbouring African countries, while many Algerian workers head north to France and other parts of Europe.

Global Trends: Emerging Construction Labour Markets March 2017
18
• Russia draws most of its migrants from neighbouring countries such as Ukraine, Kazakhstan and Uzbekistan, while France tends to pull migrants from North Africa, Turkey and other Eastern European countries.
Limitations of the analysis It is important to reiterate that the migration data does not track in what sectors individuals work, and only reflects the change in the migrant population and where they came from. Furthermore, the analysis of migration data is limited in that it does not identify motives for migration, nor does it provide any information about the nature of work performed in the destination country. The patterns, however, do provide useful insight into the relationships between countries with strong construction activity and the countries serving as source pools of migrant labour. Understanding these migration patterns helps form a better understanding of which countries are most likely to be in competition with Canada when recruiting workers internationally.
CONCLUSION Although the pace of construction growth is expected to slow in Canada, rising demands related to infrastructure and non-residential maintenance are expected to sustain employment levels at historically high levels and demographic trends are expected to steadily increase domestic market challenges.
There is a risk that short-term increases in unemployment caused by the current slowing pace of construction growth in many parts of the country will be absorbed by the rapidly rising demands in the United States, resulting in an outflow of skilled workers from Canada. This risk is elevated due to growing global construction demands driven by an increase in power and civil infrastructure project demands, which only intensifies global competition for skilled workers.
The potential supply risk for Canada’s construction workforce is that once the pace of construction growth accelerates, the presumed capacity may not exist and Canada’s construction industry’s ability to draw workers from the United States, the United Kingdom and other countries will be much more constrained compared to the past.
The new US administration’s immigration policies introduce a new factor of uncertainty and increased risk. From one perspective, Canada may experience an increase in migrants from certain countries that would otherwise be US bound, if they perceive Canada as a more favourable destination. Another perspective suggests, however, that any declines in immigration to the United States would simply aggravate skills shortages there and intensify the demand for Canadian skilled workers (and those from other Western countries favoured by those policies).

Global Trends: Emerging Construction Labour Markets March 2017
19
APPENDIX
Total project summary of energy & utilities (E&U*) and infrastructure sectors
Country E&U sum of
projects value in US$
million
E&U projects
count
Infrastructure sum of
projects value in US$
million
Infrastructure projects
count
E&U + infrastructure total sum of
projects value in US$
million
E&U + infrastructure total projects
count
Total $7,452,918 6,162 $6,726,943 4,217 $14,179,861 10,379 China $975,396 786 $1,986,096 700 $2,961,492 1,486 United States $1,136,779 1,067 $793,736 614 $1,930,515 1,681 India $972,559 936 $710,557 815 $1,683,116 1,751 CANADA $736,208 283 $291,902 99 $1,028,110 382 Australia $353,107 224 $621,469 293 $974,576 517 Russia $356,144 150 $377,549 205 $733,693 355 United Kingdom $365,225 375 $339,807 154 $705,032 529
Saudi Arabia $418,401 90 $242,242 57 $660,643 147 Brazil $367,529 287 $193,941 244 $561,470 531 Indonesia $346,693 300 $207,108 145 $553,801 445 Vietnam $267,941 146 $197,868 121 $465,809 267 Nigeria $343,655 165 $105,729 54 $449,384 219 France $111,639 100 $201,456 186 $313,095 286 Pakistan $203,347 169 $99,837 55 $303,184 224 Philippines $114,423 250 $91,592 76 $206,015 326 Mexico $88,129 160 $59,839 78 $147,968 238 Germany $56,821 81 $81,767 121 $138,588 202 Chile $102,017 306 $35,071 64 $137,088 370 Peru $66,948 232 $49,939 43 $116,887 275 Poland $69,957 55 $39,438 93 $109,395 148
* E&U includes both oil & gas and electricity
Source: BuildForce Canada; data provided by Construction Intelligence Center
Global Trends: Emerging Construction Labour Markets March 2017
20
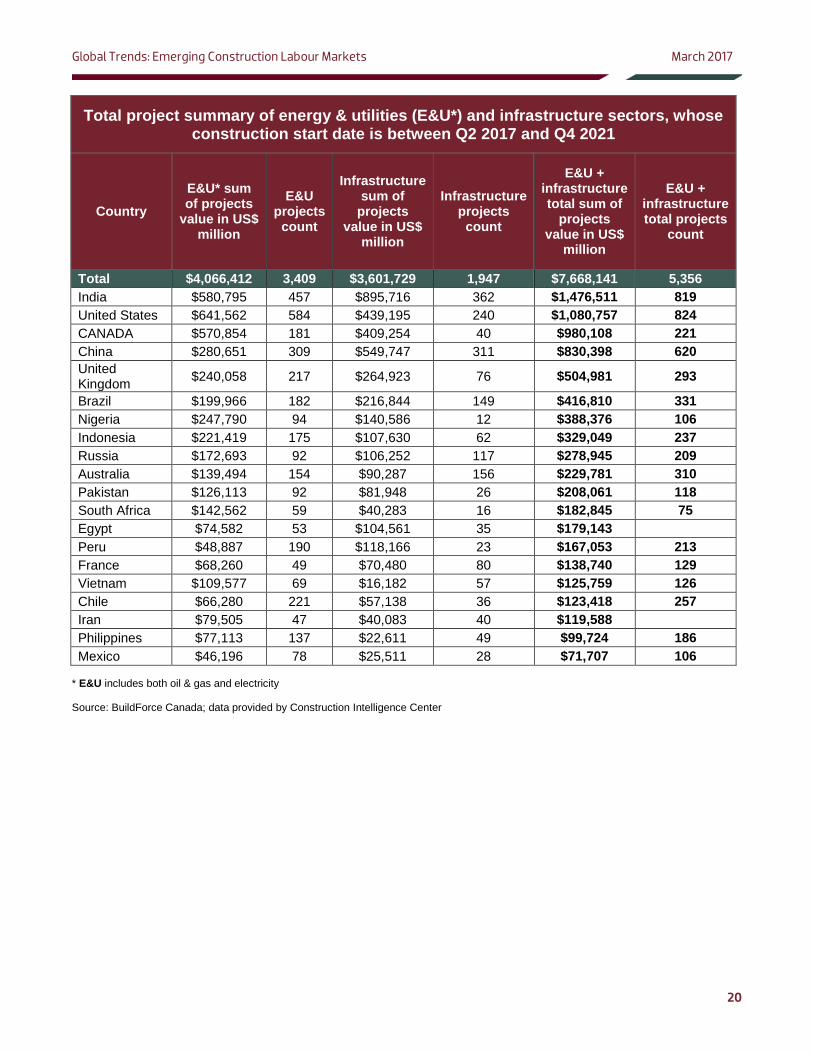
Total project summary of energy & utilities (E&U*) and infrastructure sectors, whose construction start date is between Q2 2017 and Q4 2021
Country E&U* sum of projects
value in US$ million
E&U projects
count
Infrastructure sum of
projects value in US$
million
Infrastructure projects
count
E&U + infrastructure total sum of
projects value in US$
million
E&U + infrastructure total projects
count
Total $4,066,412 3,409 $3,601,729 1,947 $7,668,141 5,356 India $580,795 457 $895,716 362 $1,476,511 819 United States $641,562 584 $439,195 240 $1,080,757 824 CANADA $570,854 181 $409,254 40 $980,108 221 China $280,651 309 $549,747 311 $830,398 620 United Kingdom $240,058 217 $264,923 76 $504,981 293
Brazil $199,966 182 $216,844 149 $416,810 331 Nigeria $247,790 94 $140,586 12 $388,376 106 Indonesia $221,419 175 $107,630 62 $329,049 237 Russia $172,693 92 $106,252 117 $278,945 209 Australia $139,494 154 $90,287 156 $229,781 310 Pakistan $126,113 92 $81,948 26 $208,061 118 South Africa $142,562 59 $40,283 16 $182,845 75 Egypt $74,582 53 $104,561 35 $179,143 Peru $48,887 190 $118,166 23 $167,053 213 France $68,260 49 $70,480 80 $138,740 129 Vietnam $109,577 69 $16,182 57 $125,759 126 Chile $66,280 221 $57,138 36 $123,418 257 Iran $79,505 47 $40,083 40 $119,588 Philippines $77,113 137 $22,611 49 $99,724 186 Mexico $46,196 78 $25,511 28 $71,707 106
* E&U includes both oil & gas and electricity
Source: BuildForce Canada; data provided by Construction Intelligence Center

Global Trends: Emerging Construction Labour Markets March 2017
21
Country Spoken language(s)
China Standard Chinese (Mandarin, Cantonese, Shanghainese, Fuzhou, Hokkien-Taiwanese)
United States English (82.1%) Spanish (10.7%)
India Hindi (41%) English (subsidiary official language)
Australia English (76.8%) Mandarin (1.4%)
Canada English (official, 58.7%) French (official, 22%)
Brazil Portuguese (official) Spanish
Russia Russian (official, 96.3%) Dolgan (5.3%)
Saudi Arabia Arabic (official)
United Kingdom English Welsh
United Arab Emirates Arabic (official) Persian
Iraq Arabic (official) Kurdish (official)
France French (official, 100%)
Vietnam Vietnamese (official) English
South Korea Korean (official)
Qatar Arabic (official) English
Nigeria English (official) Hausa
Venezuela Spanish (official) Indigenous dialects
Algeria Arabic (official) French
Germany German (official)
Turkey Turkish (official) Kurdish
Source: Central Intelligence Agency (CIA), The World Factbook: www.cia.gov/library/publications/the-world-factbook/fields/2098.html; New South Wales, Government Database (2007), www.hnehealth.nsw.gov.au/__data/assets/pdf_file/0003/92496/Languages_Spoken_in_Each_Country_of_the_World.pdf

Global Trends: Emerging Construction Labour Markets March 2017
22
REFERENCES International Labour Office (2013). Labour migration and development: ILO moving forward. Retrieved from www.ilo.org/migrant/events-and-meetings/WCMS_222548/lang--en/index.htm. United Nations Educational, Scientific and Cultural Organization (2006). International standard classification of education. Retrieved from www.uis.unesco.org/Library/Documents/isced97-en.pdf. Urban Land Institute and Ernst & Young. (2013). Infrastructure 2013: Global priorities, global insights. Retrieved from www.ey.com/Publication/vwLUAssets/Infrastructure_2013/$FILE/Infrastructure_2013.pdf. United Nations, Department of Economic and Social Affairs, Population Division (forthcoming). Trends in International Migrant Stock: The 2015 Revision (United Nations database, POP/DB/ MIG/Stock/Rev.2015). See www.unmigration.org. https://infogr.am/worlds_largest_construction_markets 2017 Construction and Maintenance Looking Forward, Build Force Canada Dodge data and analytics; www.construction.com/news/new-construction-starts-2017-increase-5-percent-713-billion-dollars-dodge-data-analytics-oct-2016. Construct Connect, www.constructconnect.com/blog/economy/u-s-construction-outlook-heading-2017. Barclays (2016). Global 2017 E&P spending outlook: North American spending to accelerate. Global Construction Perspectives and Oxford Economics, Global Construction 2030 Report. World Economic Forum, www.weforum.org/agenda/2016/06/why-china-is-building-a-new-silk-road. http://economictimes.indiatimes.com/news/economy/infrastructure/india-needs-1-5-trillion-for-infrastructure-arun-jaitley/articleshow/52922015.cms