global trans results14
TRANSCRIPT

Russia’s leading private freight rail group
Innovation
Partnerships
Independence
Performance
Full-Year 2014 Results
Sergey Maltsev, CEO and Alexander Shenets, CFO
Investor Conference Call: 30 March 2015

Full-Year 2014 Results
Disclaimer
1
Information contained in this presentation concerning Globaltrans Investment PLC, a company organized and existing under the laws of Cyprus (“Globaltrans” or the
“Company”, and together with its consolidated subsidiaries, the “Group”), is for general information purposes only. The opinions presented herein are based on general
information gathered at the time of writing and are subject to change without notice. The Company relies on information obtained from sources believed to be reliable but does
not guarantee its accuracy or completeness.
These materials may contain forward-looking statements regarding future events or the future financial performance of the Company. You can identify forward looking
statements by terms such as “expect”, “believe”, “estimate”, “anticipate”, “intend”, “will”, “could”, “may”, or “might”, the negative of such terms or other similar expressions.
These forward-looking statements include matters that are not historical facts and statements regarding the Company’s intentions, beliefs or current expectations concerning,
among other things, the Company’s results of operations, financial condition, liquidity, prospects, growth, strategies, and the industry in which the Company operates. By their
nature, forward-looking statements involve risks and uncertainties, because they relate to events and depend on circumstances that may or may not occur in the future. The
Company cautions you that forward-looking statements are not guarantees of future performance and that the Company’s actual results of operations, financial condition,
liquidity, prospects, growth, strategies and the development of the industry in which the Company operates may differ materially from those described in or suggested by the
forward-looking statements contained in these materials. In addition, even if the Company’s results of operations, financial condition, liquidity, prospects, growth, strategies and
the development of the industry in which the Company operates are consistent with the forward-looking statements contained in these materials, those results or developments
may not be indicative of results or developments in future periods. The Company does not intend to update these statements to reflect events and circumstances occurring
after the date hereof or to reflect the occurrence of unanticipated events. Many factors could cause the actual results to differ materially from those contained in forward-looking
statements of the Company, including, among others, general economic conditions, the competitive environment, risks associated with operating in Russia, market changes in
the Russian freight rail market, as well as many other risks specifically related to the Company and its operations. No reliance may be placed for any purposes whatsoever on
the information contained in this presentation or on its completeness, accuracy or fairness.
The information in this presentation is subject to verification, completion and change. Accordingly, no representation or warranty, express or implied, is made or given by or on
behalf of the Company or any of its shareholders, directors, officers or employees or any other person as to the accuracy, completeness or fairness of the information or
opinions contained in these materials. None of the Company nor any of its shareholders, directors, officers or any other person accepts any liability whatsoever for any loss
howsoever arising from any use of the contents of this presentation or otherwise arising in connection therewith. These materials do not constitute an offer or an advertisement
of any securities in any jurisdiction.

Full-Year 2014 Results
Presentation of information
2
The financial information contained in this presentation is derived from the consolidated financial statements of Globaltrans Investment PLC (“the Company” or,
together with its subsidiaries, “Globaltrans” or “the Group”) as at and for the year ended 31 December 2014 and 2013 and prepared in accordance with
International Accounting Standards as adopted by the European Union and the requirements of Cyprus Companies Law, Cap. 113 (“EU IFRS”).
The Group’s consolidated financial statements as at and for the year ended 31 December 2014 and 2013 along with selected historical financial and
operational information are available at Globaltrans’ corporate website (www.globaltrans.com).
The presentation currency of the Group’s consolidated financial statements was changed from US Dollars (“USD”) to Russian Roubles (“RUB”) effective for the
results for the year ending 31 December 2014. The Company believes that the presentation of financial results in RUB, which is the functional currency of the
Company as well as its Cypriot and Russian subsidiaries, provides greater transparency in the light of recent volatility of the RUB exchange rate and provides
shareholders with a more accurate reflection of the Company’s underlying performance. In accordance with relevant accounting standards, comparative
financial information for the year ended 31 December 2013 is provided in RUB.
Certain financial information which is derived from management accounts is marked in this presentation with an asterisk {*}.
In this presentation the Group has used certain non-GAAP financial information (not recognized by EU IFRS or IFRS) as supplemental measures of the
Group’s operating performance.
Information (non-GAAP and operating measures) requiring additional explanation or defining is marked with initial capital letters and the explanations or
definitions are provided at the end of this presentation.
Rounding adjustments have been made in calculating some of the financial and operational information included in this presentation. As a result, numerical
figures shown as totals in some tables may not be exact arithmetic aggregations of the figures that precede them.
The Group has obtained certain statistical, market and pricing information that is presented in this presentation on such topics as the Russian freight rail
transportation market and related subjects from the following third-party sources: Federal State Statistics Service of Russian Federation (“Rosstat”);
OJSC Russian Railways (“RZD”) and Federal Tariff Service of Russian Federation (“FST”). The Group has accurately reproduced such information and, as far
as it is aware and is able to ascertain from information published by such third-party sources, no facts have been omitted that would render the reproduced
information inaccurate or misleading. The Group has not independently verified this third-party information. In addition, the official data published by Russian
governmental agencies may be substantially less complete or researched than that of more developed countries.
All non-GAAP financial and operational information presented in this presentation should be used only as an analytical tool, and investors should not consider
such information in isolation or in any combination as a substitute for analysis of the Group’s consolidated financial statements and condensed interim financial
information reported under EU IFRS, which are available the Globaltrans’ corporate website www.globaltrans.com.
Full-Year 2014 Results
Highlights
Market and business review
Sergey Maltsev
Chief Executive Officer

Full-Year 2014 Results
Challenging market
environment continued
• Sluggish market reflecting macro headwinds
• Continued weak pricing environment
Solid operational
performance
• Freight Rail Turnover1 up 3% y-o-y with solid performance in priority segments
• Sustainably high operational efficiency with Empty Run Ratio for gondola cars at 38%
• >60% of Net Revenue from Operation of Rolling Stock covered by long-term service contracts2
Effective cost control,
strong Free Cash Flow
• Adjusted Revenue down 7% y-o-y to RUB 41.9 bln*, largely driven by weak pricing in the gondola segment
• Total Operating Cash Costs up 2% y-o-y: less than growth in Freight Rail Turnover, inflation impact mitigated
• Adjusted EBITDA Margin of 42%* with Adjusted EBITDA of RUB 17.6 bln*, down 16% y-o-y
• Strong Free Cash Flow of RUB 11.9 bln*, down 13% y-o-y
Continued focus
on deleveraging
• Net Debt down 21% y-o-y to RUB 23.7 bln*, Net Debt to Adj. EBITDA at 1.3x*
• The Board of Directors recommends to prioritize deleveraging and forgo a dividend for 2014 due to:
- preference for use of cash flow for debt repayments given current borrowing environment with excessive RUB interest rates
- continued weak pricing
• Shareholder remuneration remains a fundamental priority; dividend distribution will be reconsidered in 12 months
Highlights: Effective cost control, strong Free Cash Flow and continued deleveraging
4
Source: Globaltrans. Definitions for terms marked in this presentation with capital letters (including certain non-GAAP financial information) are provided at the end of this presentation.
1) Freight Rail Turnover (incl. Engaged Fleet); The Group’s Freight Rail Turnover (excl. Engaged Fleet) increased 3% y-o-y in 2014.
2) In 2014; Including service contracts with Rosneft, MMK and Metalloinvest.

Full-Year 2014 Results
Estimated number of railcars ending useful life
in 2015-20163
Overall Russian freight rail market performance
+5%
2,196
1,237
2,298
1,227
Freight Rail Turnover(bln tonnes-km)
Transporation Volume(mln tonnes)
2013 2014
Challenging market environment reflecting macro headwinds
5
Sluggish market
• Overall Russian Transportation Volumes down 1% y-o-y in 2014
- Coal (+1% y-o-y), oil products and oil (+2% y-o-y), metallurgical
cargoes (-1% y-o-y), construction materials (-14% y-o-y)1
• Changed logistics with longer distance trips drove overall Russian
Freight Rail Turnover up 5% y-o-y in 2014
• Stable overall industry volumes in Jan-Feb 2015 supported by
export industries2
Fragmented industry suffering from weak pricing, poised for
consolidation
• >1,000 players, many of them highly leveraged
• Players without outsourcing contracts suffering most
Pending regulatory changes to benefit efficient rail operators with
young fleets like Globaltrans
• From April 2015 payments to be introduced for railcar dwell time on
RZD’s network, creating additional pressure on inefficient players
• Mandatory modernization and certification requirements for extending
useful life of railcars are still in the development process, from August
2014 all railcars that reach the end of useful life must be taken out of
operation
-1%
c.50k
c.15k
c.50k
c.11k
Gondola cars Rail tank cars
2015 2016
c.18% of total gondola fleet
in Russia
c.9% of total rail tank fleet
in Russia
Source: Globaltrans; Rosstat. Definitions for terms marked in this presentation with capital letters (including certain non-GAAP financial information) are provided at the end of this presentation.
1) Coal (incl. coke); metallurgical cargoes (incl. ferrous metals, scrap metal and ores); construction materials (incl. cement).
2) The overall Russian Transportation Volume and overall Russian Freight Rail Turnover remained flat y-o-y in Jan-Feb 2015.
3) Estimated by the Company; as a proportion of the overall railcar fleet in Russia of respective type as of the end of 2014.

Full-Year 2014 Results
Continued growth in business volumes, all railcars fully
deployed
• Freight Rail Turnover increased 3% y-o-y led by metallurgical
cargoes1 (+6%) and oil products and oil (+2%)
• Market Share stable at 8.4%
• Average Rolling Stock Operated up 1% to 53,813 units
Freight Rail Turnover (bln tonnes-km)
155.5 159.7
2013 2014
Average Price per Trip down 7% y-o-y
• Weak pricing in gondola segment partially offset by solid
performance of rail tank car segment
Average Price Per Trip (RUB)
28,948 26,804
2013 2014
6
Solid operational performance, all railcars fully deployed
High operational efficiency despite difficult market
• Empty Run Ratio for gondola cars stable at 38%
• Decrease in Empty Run Ratio for rail tank cars drove improvement
of Total Empty Run Ratio to 51% (2013: 53%)
• Average Number of Loaded Trips up 1% y-o-y with Average
Distance of Loaded Trip increased 2% y-o-y
Historical Empty Run Ratio (%)
42% 41% 38% 38% 38%
62% 62% 57% 53% 51%
2010 2011 2012 2013 2014
Empty Run Ratio for gondola cars Total Empty Run Ratio
-7%
+3%
Source: Globaltrans. Definitions for terms marked in this presentation with capital letters (including certain non-GAAP financial information) are provided at the end of this presentation.
1) Metallurgical cargoes including ferrous metal, scrap metal and iron ore.

Full-Year 2014 Results
Duration of service contracts
(years, from end 2014)
4.2
2.0
1.2
MMK
Metalloinvest
Rosneft
Operational platform adds value for clients; long-term service contracts now >60% of Net Revenue from Operation of Rolling Stock
7
An effective operational platform
• c. 40,000 gondola cars are operated from a single dispatching
centre
• Rail tank car business enhanced by unique locomotive
competencies
• Engaged Fleet of c.10,000 railcars1 provides capacity to cover
excessive demand and dampens volume volatility
Sizable long-term contracts create win-win partnerships
• >60% of Net Revenue from Operation of Rolling Stock covered by
long-term service contracts in 2014
• Dedicated tailored solutions improve the speed and reliability of
cargo off take and reduce costs for the customer
• Logistics of interconnected plants facilitates efficient matching of
inbound and outbound traffic thus minimising Empty Runs
Globaltrans extended all key service contracts in 2014
• Metalloinvest contract2 extended for an additional 19 months to the
end of 2016
• MMK contract3 extended for an extra year to the end of Feb 2019
• Service contract with Rosneft extended until the end of March 2016
Net Revenue from Operation of Rolling Stock (2014)
34%
18%
11%37%
Rosneft (oil products and oil)
MMK (bulk cargo)
Metalloinvest (bulk cargo)
Other clients63%
End of February 2019
End of 2016
End of March 2016
Source: Globaltrans. Definitions for terms marked in this presentation with capital letters (including certain non-GAAP financial information) are provided at the end of this presentation.
1) As of the end of 2014.
2) Globaltrans is responsible for 100% of Metalloinvest’s freight rail transportation needs under the current service contract.
3) Globaltrans is responsible for 70% of MMK’s freight rail transportation needs under the current service contract.

Full-Year 2014 Results
Financial review
Alexander Shenets
Chief Financial Officer

Full-Year 2014 Results
Net Debt (RUB mln), Net Debt / Adjusted EBITDA
29,773 *23,658 *
31.12.2013 31.12.2014
Free Cash Flow (RUB mln)
13,632 * 11,907 *
2013 2014
Profit for the year (RUB mln)3
Adjusted Revenue (RUB mln)
44,910 *41,890 *
2013 2014
Total Operating Cash Costs (RUB mln)
Adjusted EBITDA (RUB mln), Adj. EBITDA Margin
Financial highlights1,2: Operating Cash Costs contained, strong Free Cash Flow, debt reduced
9
Source: Globaltrans. Definitions for terms marked in this presentation with capital letters (including certain non-GAAP financial information) are provided at the end of this presentation.
1) The presentation currency of the Group’s consolidated financial statements was changed from USD to RUB effective from the results for the year ending 31 December 2014 and was applied retrospectively. The Company believes that the presentation of financial results in RUB, which is the functional currency of the Company as well as its Cypriot and Russian subsidiaries, provides greater transparency in the light of recent volatility of the RUB exchange rate and provides shareholders with a more accurate reflection of the Company’s underlying performance.
2) The average exchange rate of the Russian Rouble against the US Dollar depreciated by 21% y-o-y in 2014. The 2014 year end exchange rate of the Russian Rouble against the US Dollar weakened by 72% compared to the end of 2013.
3) In 2014 the Group’s Profit for the year was negatively affected by the impairment of goodwill in the amount of RUB 5,828 million associated with the acquisition of captive rail operators in 2012-2013. The impairment primarily reflects increased cost of capital in Russia, deterioration of economic conditions, as well as the continued weak pricing environment in the gondola segment.
23,702 * 24,152 *
2013 2014
20,840 *17,560 *
2013 2014
Adj. EBITDA MarginAdj. EBITDA
Net Debt to Adj. EBITDANet Debt
46%* 42%*
1.4x* 1.3x*
-7%
+2%
-16%
-13%
-21%
8,068
571 (5,828)
2013 2014 2014 (adjusted)
Profit for the year Impairment of goodwill
6,399*-21%
571

Full-Year 2014 Results
Net Revenue from Operation of Rolling Stock, a key component of Adjusted Revenue, fell 6% y-o-y
• Average Price per Trip declined 7% y-o-y
• Average Rolling Stock Operated up 1% y-o-y to 53,813 units
• Average Number of Loaded Trips up 1% y-o-y
Revenue from Operating lease of rolling stock decreased 14% y-o-y
• Primarily reflecting a decline in the leasing rates
Net Revenue from Engaged Fleet decreased 13% y-o-y
• Driven by weak pricing environment in the gondola segment
Revenue analysis
10
2013 2014 Change
(RUB mln) (RUB mln) %
Revenue 74,289 68,700 -8%
Minus
Infrastructure and locomotive tariffs: loaded trips1
24,391 23,251 -5%
Services provided by other transportation organisations2
4,988 3,560 -29%
Adjusted Revenue 44,910* 41,890* -7%
Including
Net Revenue from Operation of Rolling Stock 38,856* 36,661* -6%
Operating lease of rolling stock 3,785 3,259 -14%
Net Revenue from Engaged Fleet 1,872* 1,622* -13%
Railway transportation – freight forwarding 62 29 -53%
Other revenue3
336 319 -5%
Source: Globaltrans. Definitions for terms marked in this presentation with capital letters (including certain non-GAAP financial information) are provided at the end of this presentation.
1) “Infrastructure and locomotive tariffs: loaded trips” comprises revenue resulting from tariffs that customers pay to the Group and the Group pays on to RZD, which are reflected in equal amounts in both the Group’s
revenue and cost of sales.
2) “Services provided by other transportation organizations” is revenue resulting from the tariffs that customers pay to the Group and the Group pays on to third-party rail operators for subcontracting their rolling stock,
which are reflected in equal amounts in both the Group’s revenue and cost of sales. The net result of Engaged Fleet operations is reflected as Net Revenue from Engaged Fleet being a part of Adjusted Revenue.
3) Including revenue from repair and maintenance services provided to third parties.

Full-Year 2014 Results
Cost of sales, selling and marketing costs and administrative expenses adjusted for “pass-through” cost items remained flat y-o-y
Total Operating Cash Costs up 2% y-o-y, below the 3% growth in Freight Rail Turnover
• Effective cost control mitigated inflation impact
Total Operating Non-Cash Costs down 7% y-o-y
• Mainly driven by decrease in impairment charge for receivables combined with decline in Depreciation of property, plant and equipment
11
Cost analysis: Effective cost control mitigated inflation impact
2013 2014 Change
(RUB mln) (RUB mln) %
Cost of sales, selling and marketing costs and administrative expenses
adjusted for “pass-through” cost items30,524* 30,515* 0%
Including
Total Operating Cash Costs 23,702* 24,152* 2%
Empty Run Costs 9,857* 10,354* 5%
Repairs and maintenance 4,165 3,800 -9%
Employee benefit expense 3,067 3,236 6%
Operating lease rentals - rolling stock 1,280 1,249 -2%
Fuel and spare parts - locomotives 1,212 1,403 16%
Infrastructure and Locomotive Tariffs - Other Tariffs 972* 1,018* 5%
Engagement of locomotive crews 450 468 4%
Legal, consulting and other professional fees 160 102 -36%
Other Operating Cash Costs 2,539* 2,522* -1%
Total Operating Non-Cash Costs 6,822* 6,363* -7%
Including
Depreciation of property, plant and equipment 5,246 5,085 -3%
Amortisation of intangible assets 1,021 1,079 6%
Impairment charge for receivables 369 178 -52%
Source: Globaltrans. Definitions for terms marked in this presentation with capital letters (including certain non-GAAP financial information) are provided at the end of this presentation.

Full-Year 2014 Results
Empty Run Costs (43% of OCC) • 3% y-o-y increase in Freight Rail Turnover
• Changed logistics in the segment for rail transportation of oil products and oil
• RZD regulated tariff for the traction of empty railcars remained flat y-o-y
• Total Empty Run Ratio improved to 51% (2013: 53%); Share of Empty Run km paid
by Globaltrans improved to 87% (2013: 89%)
Employee benefit expense (13% of OCC)
• 2014 saw inflation-driven increases in salaries, increase in social insurance taxes
along with increase in employment termination expenses
• Period-end headcount down 3% compared to the end of 2013
Repairs and maintenance (16% of OCC)• Increase in Average Rolling Stock Operated (+1% y-o-y) along with increase in
number of current repairs
• More than offset by improved pricing for repairs and spare parts as well as decline in
expenses related to repairs and maintenance of locomotives
Operating lease – rolling stock (5% of OCC)
• Increase in the average number of railcars leased-in to meet additional
demand for the Group’s services, offset by a decline in leasing rates
9,857 * 10,354 *
2013 2014
4,165 3,800
2013 2014
3,067 3,236
2013 2014
1,280 1,249
2013 2014
12
Major Operating Cash Cost (“OCC”) items
+5%
-9%
+6%
-2%
Source: Globaltrans. Definitions for terms marked in this presentation with capital letters (including certain non-GAAP financial information) are provided at the end of this presentation.

Full-Year 2014 Results
Comfortable debt level (RUB mln)
33,17928,30629,773*
23,658*
31.12.2013 31.12.2014
Total debt Net Debt
Comfortable leverage level
• Net Debt of RUB 23,658 mln* with Net Debt to Adj. EBITDA of 1.3x*
• Very low FX exposure and interest rate risk
• Weighted average effective interest rate of 10.3%*
A balanced maturity profile with sizable repayments due in 2015
• RUB 10 bln bond has already been redeemed in March 2015,
financed with a 5-year RUB denominated credit facility
Board of Directors recommends to prioritize further deleveraging
and forgo a dividend for 2014
Debt repayment schedule as at 31.12.2014 (RUB mln)1
11,907*
4,648
15,000
21,902
14,434*
3,822*6,723*
3,327*
Free CashFlow (2014)
Cash andcash
equivalents
Registeredunissued
bonds
Undrawnborrowingfacilities
H1 2015 H2 2015 2016 2017-2019
Net Debt down 21% y-o-y, priority on further deleverage
13
RUB 28,306 mln
Total debt at 31.12.2014
by interest rate type (%)
Total debt at 31.12.2014
by currency (%)
Net Debt to Adjusted EBITDA
1.3x*1.4x*
RUB 10 bln
bonds redeemed
in March 2015
2%
98%
USD
RUB
90%*
10%*
Fixed
Floating
Source: Globaltrans. Definitions for terms marked in this presentation with capital letters (including certain non-GAAP financial information) are provided at the end of this presentation.
1) Including accrued interest of RUB 374 mln* as of 31.12.2014.

Full-Year 2014 Results
Management priorities for 2015
Key takeaways
Sergey Maltsev
Chief Executive Officer

Full-Year 2014 Results
Management priorities for 2015
15
Challenging outlook
in the near term
• Weak pricing environment with continued downward pressure primarily in gondola segment
• Continued market weakness and pending regulations along with limited access to financing likely to
drive industry consolidation
• Two regulatory changes pending (introduction of payments for railcar dwell time on RZD’s network
and more demanding useful life extension requirements) benefiting efficient players with young fleets
like Globaltrans
Management priorities
for 2015
• Continued focus on fleet efficiency, cost cutting and maximization of Free Cash Flow
• Prudent capital allocation
- Expansion CAPEX on hold
- Free Cash Flow to be used for repayment of debt
• Monitor potential consolidation opportunities
Source: Globaltrans. Definitions for terms marked in this presentation with capital letters (including certain non-GAAP financial information) are provided at the end of this presentation.

Full-Year 2014 Results
Key takeaways: here for the long haul
16
• Immediate industry outlook remains challenging, but Globaltrans has a strong business model
able to navigate the current market weakness
• Expected regulatory changes will reward efficient players with young fleets like Globaltrans
• Strong Free Cash Flow generation supported by rail tank car business and long-term contracts
- CAPEX remains on hold, focus on deleveraging
• Globaltrans has a unique strategic position in an industry with strong long-term fundamentals
- Industry consolidation to be driven by continued market weakness, pending regulations and
limited access to financing
- Globaltrans is well-positioned to continue its business expansion when markets stabilize and
the right opportunities arise
Source: Globaltrans. Definitions for terms marked in this presentation with capital letters (including certain non-GAAP financial information) are provided at the end of this presentation.

Full-Year 2014 Results
• Questions and answers

Full-Year 2014 Results
• Appendices
Full-Year 2014 Results
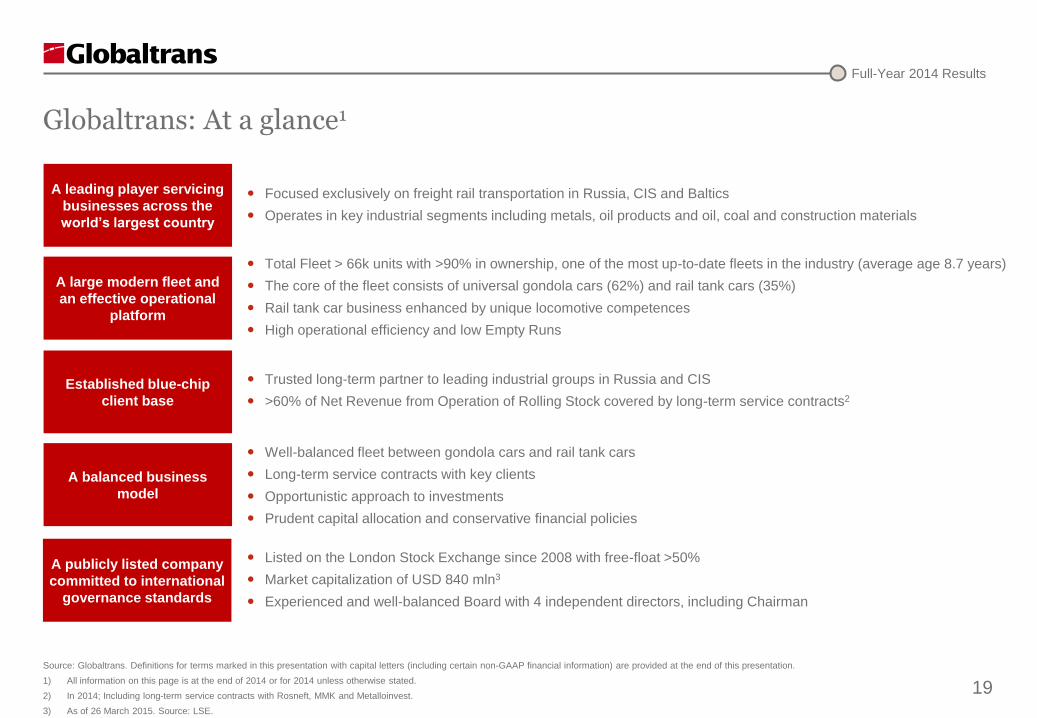
Globaltrans: At a glance1
19
Focused exclusively on freight rail transportation in Russia, CIS and Baltics
Operates in key industrial segments including metals, oil products and oil, coal and construction materials
A leading player servicing
businesses across the
world’s largest country
A large modern fleet and
an effective operational
platform
Established blue-chip
client base
A balanced business
model
A publicly listed company
committed to international
governance standards
Total Fleet > 66k units with >90% in ownership, one of the most up-to-date fleets in the industry (average age 8.7 years)
The core of the fleet consists of universal gondola cars (62%) and rail tank cars (35%)
Rail tank car business enhanced by unique locomotive competences
High operational efficiency and low Empty Runs
Trusted long-term partner to leading industrial groups in Russia and CIS
>60% of Net Revenue from Operation of Rolling Stock covered by long-term service contracts2
Well-balanced fleet between gondola cars and rail tank cars
Long-term service contracts with key clients
Opportunistic approach to investments
Prudent capital allocation and conservative financial policies
Listed on the London Stock Exchange since 2008 with free-float >50%
Market capitalization of USD 840 mln3
Experienced and well-balanced Board with 4 independent directors, including Chairman
Source: Globaltrans. Definitions for terms marked in this presentation with capital letters (including certain non-GAAP financial information) are provided at the end of this presentation.
1) All information on this page is at the end of 2014 or for 2014 unless otherwise stated.
2) In 2014; Including long-term service contracts with Rosneft, MMK and Metalloinvest.
3) As of 26 March 2015. Source: LSE.

Full-Year 2014 Results
Overall Russian freight rail Transportation Volumes
(for key cargoes, mln tonnes)
189
5343 33 22
189
52 43 3517
Total Coal Oil productsand oil
Metallurgicalcargoes
Constructionmaterials
Jan-Feb 2014 Jan-Feb 2015
Overall Russian Freight Rail Turnover
(bln tonnes-km)
Market watch, January-February 2015
20
Overall Russian Freight Rail Turnover
(last 12 months, monthly performance, bln tonnes-km)
Source: Rosstat. Note: Definitions for terms marked in this presentation with capital letters (including certain non-GAAP financial information) are provided at the end of this presentation.
1) Coal including coke.
2) Metallurgical cargoes including ferrous metals, scrap metal and ores.
3) Construction materials including cement.
Overall Russian freight rail Transportation Volumes
(by type of freight in %, Jan-Feb 2015)
2,196 2,298
362 363
2013 2014 Jan-Feb 2014 Jan-Feb 2015
28%
23%18%
9%
22%Coal
Oil products and oil
Metallurgical cargoes
Construction materials
Other
+5%
0%
0%
0% +4% -20%
183 181186
177
181184
179
191 189
199198
189191
188192 191 193 195
196202
191
171
188
174
+8% +4% +3% +6% +6% +4% +8% +2% +3% +1% -1% +2%
Mar Apr May June July Aug Sep Oct Nov Dec Jan Feb
2013 2014 2015 y-o-y
1
2
3
1
2 3
-2%

Full-Year 2014 Results
11.5%
11.5%
11.5%
6.3%
4.5%
0.2%
54.5%
Maple Valley Investments
Onyx Investments
Marigold Investments
Litten Investments
Goldriver Resources
Other entities controlled by Directors and management of Globaltrans
Free float (BNY Mellon as a nominal holder)
21
Corporate governance structure
Nominations CommitteeChaired by Independent Director
Remuneration CommitteeChaired by Independent Director
General Meeting of Shareholders
The Board of Directors (15 members, 4 Independent Directors, 3 Committees)
Michael Zampelas
Chairman, Independent
Non-Executive Director
John Carroll Colley
Independent Non-
Executive Director
Hans Durrer
Senior Independent
Non-Executive Director
George Papaioannou
Independent Non-
Executive Director
Sergey Maltsev
Executive Director, CEO
Michael Thomaides
Non-Executive DirectorAlexander Storozhev
Executive Director
Konstantin Shirokov
Executive Director
Alexander Tarasov
Executive Director
Alexander Eliseev
Non-Executive Director
Andrey Gomon
Non-Executive Director
Melina Pyrgou
Non-Executive Director
Elia Nicolaou
Non-Executive Director
Marios Tofaros
Non-Executive Director
Sergey Tolmachev
Executive Director
Audit CommitteeChaired by Independent Director
Internal Audit
3
Source: Globaltrans. Definitions for terms marked in this presentation with capital letters (including certain non-GAAP financial information) are provided at the end of this presentation.
1) Konstantin Nikolaev, Nikita Mishin and Andrey Filatov are beneficiaries with regard to 11.5% of Globaltrans’ ordinary share capital each through their respective SPVs (Maple Valley Investments, Onyx Investments and Marigold Investments). These
individuals are co-founders of Globaltrans.
2) Beneficially owned by Alexander Eliseev, Non-Executive Director and co-founder of Globaltrans.
3) Beneficially owned by Sergey Maltsev, Chief Executive Officer, Executive Director and co-founder of Globaltrans.
1
1
1
2

Full-Year 2014 Results
22
Extracts from the Group’s consolidated financial statements for the year ended 31 December 2014
Source: Globaltrans. Definitions for terms marked in this presentation with capital letters (including certain non-GAAP financial information) are provided at the end of this presentation.
The Directors’ report and consolidated financial statements for the year ended 31 December 2014 is available for viewing at the Globaltrans’ corporate website (www.globaltrans.com).
Consolidated income statement for the year ended 31 December 2014
2014 2013
RUB’000 RUB’000
Revenue 68,700,394 74,289,393
Cost of sales (52,789,268) (55,151,675)
Gross profit 15,911,126 19,137,718
Selling and marketing costs (334,218) (536,056)
Administrative expenses (4,202,172) (4,215,319)
Impairment of goodwill (5,828,085) -
Other gains – net 30,596 37,180
Operating profit 5,577,247 14,423,523
Finance income 735,744 320,433
Finance costs (3,523,555) (3,833,032)
Finance costs – net (2,787,811) (3,512,599)
Share of (loss)/profit of associates (12,164) 6,804
Profit before income tax 2,777,272 10,917,728
Income tax expense (2,206,019) (2,849,642)
Profit for the year 571,253 8,068,086
Profit/(loss) attributable to:
Owners of the Company (1,415,739) 5,825,602
Non-controlling interests 1,986,992 2,242,484
571,253 8,068,086
Basic and diluted (losses)/earnings per share for (loss) profit attributable to the equity
holders of the Company during the year (expressed in RUB per share)(7.92) 32.59

Full-Year 2014 Results
Extracts from the Group’s consolidated financial statements for the year ended 31 December 2014
23
Source: Globaltrans. Definitions for terms marked in this presentation with capital letters (including certain non-GAAP financial information) are provided at the end of this presentation.
The Directors’ report and consolidated financial statements for the year ended 31 December 2014 is available for viewing at the Globaltrans’ corporate website (www.globaltrans.com).
31 Dec 2014 31 Dec 2013 1 Jan 2013
RUB’000 RUB’000 RUB’000
ASSETS
Non-current assets
Property, plant and equipment 71,380,758 71,294,019 69,306,493
Intangible assets 4,442,396 11,349,076 5,984,756
Income tax assets 57,892 78,773 54,671
Trade and other receivables 32,233 160,247 -
Investment in associate 110,182 83,228 67,731
Total non-current assets 76,023,461 82,965,343 75,413,651
Current assets
Inventories 735,694 588,522 415,347
Current income tax assets 1,010,322 156,201 52,089
Trade and other receivables 6,701,470 6,299,444 7,996,980
Restricted cash - - 303,727
Cash and cash equivalents 4,647,787 3,406,303 5,412,111
Total current assets 13,095,273 10,450,470 14,180,254
TOTAL ASSETS 89,118,734 93,415,813 89,593,905
31 Dec 2014 31 Dec 2013 1 Jan 2013
RUB’000 RUB’000 RUB’000
EQUITY AND LIABILITIES
Equity attributable to the owners of the Company
Share capital 516,957 516,957 516,957
Share premium 27,929,478 27,929,478 27,929,478
Common control transaction reserve (10,429,876) (10,429,876) (10,429,876)
Translation reserve 3,397,222 750,823 296,392
Capital contribution 2,694,851 2,694,851 2,694,851
Retained earnings 19,100,433 24,517,956 22,959,475
Total equity attributable to the owners of the Company 43,209,065 45,980,189 43,967,277
Non-controlling interests 6,927,315 5,727,409 4,807,026
TOTAL EQUITY 50,136,380 51,707,598 48,774,303
Non-current liabilities
Borrowings 10,049,915 24,117,625 25,427,265
Trade and other payables 13,278 - -
Deferred tax liabilities 5,207,410 4,710,052 3,798,835
Total non-current liabilities 15,270,603 28,827,677 29,226,100
Current liabilities
Borrowings 18,256,223 9,061,736 7,226,668
Trade and other payables 5,245,646 3,804,253 4,117,565
Current tax liabilities 209,882 14,549 249,269
Total current liabilities 23,711,751 12,880,538 11,593,502
TOTAL LIABILITIES 38,982,354 41,708,215 40,819,602
TOTAL EQUITY AND LIABILITIES 89,118,734 93,415,813 89,593,905
Consolidated balance sheet as at 31 December 2014

Full-Year 2014 Results
Consolidated cash flow statement for the year ended 31 December 2014
24
Extracts from the Group’s consolidated financial statements for the year ended 31 December 2014
Source: Globaltrans. Definitions for terms marked in this presentation with capital letters (including certain non-GAAP financial information) are provided at the end of this presentation.
The Directors’ report and consolidated financial statements for the year ended 31 December 2014 is available for viewing at the Globaltrans’ corporate website (www.globaltrans.com).
2014 2013
RUB’000 RUB’000
Cash flows from operating activities
Profit before tax 2,777,272 10,917,728
Adjustments for:
Depreciation of property, plant and equipment 5,084,746 5,245,570
Amortisation of intangible assets 1,078,644 1,021,262
Loss on sale of property, plant and equipment 21,839 186,689
Impairment on property, plant and equipment 223 -
Interest income (184,956) (113,601)
Interest expense 3,092,683 3,902,788
Other finance income (11,337) -
Share of loss/(profit) of associates 12,164 (6,804)
Foreign exchange (gains)/losses on finance income/costs (108,579) (276,588)
Impairment of goodwill 5,828,085 -
17,590,784 20,877,044
Changes in working capital:
Inventories (90,651) (58,344)
Trade and other receivables (246,148) 2,323,186
Trade and other payables 1,599,638 (2,016,841)
Cash generated from operations 18,853,623 21,125,045
Tax paid (2,285,626) (2,664,726)
Net cash from operating activities 16,567,997 18,460,319
2014 2013
RUB’000 RUB’000
Cash flows from investing activities
Acquisition of subsidiaries-net of cash acquired - (6,120,090)
Indemnification received 78,400 -
Loan repayments received from third parties 1,332 2,603
Purchases of property, plant and equipment (1,532,167) (1,275,200)
Purchases of intangible assets (49) -
Proceeds from disposal of property, plant and equipment 220,724 172,401
Interest received 189,913 112,660
Net cash used in investing activities (1,041,847) (7,107,626)
Cash flows from financing activities
Proceeds from borrowings 6,688,521 20,210,826
Repayments of borrowings (10,494,675) (23,244,309)
Acquisition of non-controlling interest (2,433) -
Finance lease principal payments (1,586,842) (1,276,720)
Interest paid (3,128,620) (3,552,997)
Dividends paid to Company’s shareholders (3,983,892) (3,906,954)
Dividends paid to non-controlling interests (2,306,714) (1,715,413)
Net cash used in financing activities (14,814,655) (13,485,567)
Net increase/(decrease) in cash and cash equivalents 711,495 (2,132,874)
Exchange gains on cash and cash equivalents 529,989 127,066
Cash, cash equivalents at beginning of year 3,406,303 5,412,111
Cash, cash equivalents at end of year 4,647,787 3,406,303

Full-Year 2014 Results
Selected operational information the year ended 31 December 2014
25Source: Globaltrans. Definitions for terms marked in this presentation with capital letters (including certain non-GAAP financial information) are provided at the end of this presentation.
Selected operational information for 2014 and prior periods are available in xls format at the corporate website (www.globaltrans.com)
Rolling stock fleet
2014 (EoP) 2013 (EoP) Change Change, %
Owned Fleet
Gondola cars 40,019 40,095 (76) 0%
Rail tank cars 18,916 19,061 (145) -1%
Locomotives 75 75 - 0%
Other railcars 1,615 1,893 (278) -15%
Total 60,625 61,124 (499) -1%
Owned Fleet as % of Total Fleet 92% 93% - -
Leased-in Fleet
Gondola cars 913 533 380 71%
Rail tank cars 4,483 4,151 332 8%
Other railcars 173 - 173 n/a
Total 5,569 4,684 885 19%
Leased-in Fleet as % of Total Fleet 8% 7% - -
Total Fleet (Owned Fleet + Leased-in Fleet) 66,194 65,808 386 1%
Total Fleet by type of rolling stock, %
Gondola cars 62% 62% - -
Rail tank cars 35% 35% - -
Locomotives 0.1% 0.1% - -
Other railcars 3% 3% - -
Total 100% 100% - -
Leased-out Fleet
Gondola cars 353 600 (247) -41%
Rail tank cars 9,113 8,887 226 3%
Locomotives 3 3 - 0%
Other railcars 713 893 (180) -20%
Total 10,182 10,383 (201) -2%
Leased-out Fleet as % of Total Fleet 15% 16% - -
Average age of Owned Fleet
Gondola cars 7.1 6.4 - -
Rail tank cars 11.4 10.5 - -
Locomotives 12.8 11.8 - -
Other railcars 16.2 18.6 - -
Total 8.7 8.0 - -
Operation of rolling stock (incl. Engaged Fleet)
2014 2013 Change Change, %
Freight Rail Turnover, billion tonnes-km
Metallurgical cargoes 92.8 87.6 5.3 6%
Ferrous metals 34.3 32.2 2.1 6%
Scrap metal 4.3 3.7 0.6 15%
Iron ore 54.2 51.6 2.6 5%
Oil products and oil 26.4 25.7 0.6 2%
Coal (incl. coke) 22.5 23.2 (0.6) -3%
Construction materials 9.8 11.2 (1.4) -12%
Crushed stone 8.7 10.1 (1.4) -14%
Cement 0.4 0.3 0.1 32%
Other construction materials 0.7 0.8 (0.1) -10%
Other 8.1 7.8 0.3 4%
Total 159.7 155.5 4.2 3%
Freight Rail Turnover by cargo type, %
Metallurgical cargoes (incl. ferrous metal, scrap
metal and iron ore)58% 56% - -
Oil products and oil 17% 17% - -
Coal (incl. coke) 14% 15% - -
Construction materials (incl. cement) 6% 7% - -
Other 5% 5% - -
Total 100% 100% - -
Transportation Volume, million tones
Metallurgical cargoes 50.6 50.0 0.6 1%
Ferrous metals 18.4 18.2 0.2 1%
Scrap metal 3.9 3.6 0.3 8%
Iron ore 28.4 28.2 0.1 0%
Oil products and oil 23.5 23.9 (0.4) -2%
Coal (incl. coke) 10.9 10.8 0.1 1%
Construction materials 10.6 11.0 (0.3) -3%
Crushed stone 9.4 9.7 (0.3) -3%
Cement 0.3 0.2 0.1 51%
Other construction materials 0.9 1.1 (0.1) -13%
Other 7.0 6.7 0.3 4%
Total 102.7 102.4 0.3 0%
Employees
2014 (EoP) 2013 (EoP) Change Change, %
Employees by departments (simplified)
Operations 1,052 1,102 (50) -5%
Administrative 523 518 5 1%
Total 1,575 1,620 (45) -3%

Full-Year 2014 Results
Selected operational information for the year ended 31 Dec 2014 (continued)
26
Operation of rolling stock (excl. Engaged Fleet)
2014 2013 Change Change, %
Freight Rail Turnover, billion tonnes-km
Metallurgical cargoes 73.6 65.9 7.7 12%
Ferrous metals 28.8 25.5 3.3 13%
Scrap metal 3.7 2.1 1.7 80%
Iron ore 41.1 38.3 2.7 7%
Oil products and oil 25.3 25.1 0.2 1%
Coal (incl. coke) 19.1 21.2 (2.2) -10%
Construction materials 9.3 11.0 (1.7) -15%
Crushed stone 8.3 9.9 (1.7) -17%
Cement 0.4 0.3 0.1 24%
Other construction materials 0.7 0.8 (0.1) -14%
Other 7.8 7.8 0.1 1%
Total 135.1 131.0 4.1 3%
Transportation Volume, million tones
Metallurgical cargoes 38.9 35.7 3.1 9%
Ferrous metals 14.6 13.4 1.1 9%
Scrap metal 3.4 2.3 1.1 49%
Iron ore 20.9 20.0 0.9 4%
Oil products and oil 22.3 23.0 (0.7) -3%
Coal (incl. coke) 9.1 9.8 (0.7) -7%
Construction materials 9.9 10.8 (0.9) -8%
Crushed stone 8.8 9.5 (0.7) -7%
Cement 0.3 0.2 0.1 38%
Other construction materials 0.8 1.0 (0.3) -27%
Other 6.7 6.6 0.1 1%
Total 86.9 86.0 0.9 1%
Average Rolling Stock Operated, units
Gondola cars 39,469 38,920 549 1%
Rail tank cars 13,393 13,535 (142) -1%
Locomotives 46 38 8 20%
Other railcars 905 952 47) -5%
Total 53,813 53,445 368 1%
Average Number of Loaded Trips per Railcar
Gondola cars 24.5 23.9 0.6 3%
Rail tank cars 27.3 28.3 (0.9) -3%
Other railcars 39.7 32.1 7.7 24%
Total 25.4 25.1 0.3 1%
Average Distance of Loaded Trip, km
Gondola cars 1,723 1,706 17 1%
Rail tank cars 1,124 1,076 48 4%
Other railcars 1,153 1,483 (329) -22%
Total 1,547 1,521 27 2%
2014 2013 Change Change, %
Average Price per Trip, RUB 26,804 28,948 (2,144) -7%
Net Revenue from Operation of Rolling Stock by cargo type, RUB million
Metallurgical cargoes 11,680 12,472 (791) -6%
Ferrous metals 6,553 6,986 (434) -6%
Scrap metal 750 573 177 31%
Iron ore 4,378 4,912 (535) -11%
Oil products and oil 19,091 19,202 (112) -1%
Coal (incl. coke) 2,755 3,370 (615) -18%
Construction materials (incl. cement) 1,522 2,093 (571) -27%
Other 1,612 1,719 (106) -6%
Total 36,661 38,856 (2,195) -6%
Net Revenue from Operation of Rolling Stock by cargo type, %
Metallurgical cargoes (incl. ferrous metal, scrap metal and iron ore) 32% 32% - -
Oil products and oil 52% 49% - -
Coal (incl. coke) 8% 9% - -
Construction materials (incl. cement) 4% 5% - -
Other 4% 4% - -
Total 100% 100% - -
Net Revenue from Operation of Rolling Stock by largest clients (incl. their affiliates and suppliers), %
Rosneft 34% 29% - -
MMK 18% 17% - -
Metalloinvest 11% 13% - -
Gazpromneft 9% 8% - -
Evraz 4% 3% - -
Sovfracht 4% 2% - -
TMK 1% 1% - -
Severstal 1% 2% - -
Lukoil 0% 2% - -
Mechel 0% 1% - -
Other (incl. small and medium enterprises) 17% 22% - -
Empty Run Ratio, %
Gondola cars 38% 38% - -
Rail tank car and other railcars 102% 109% - -
Total Empty Run Ratio, % 51% 53% - -
Empty Run Costs, RUB million 10,354 9,857 497 5%
Share of Empty Run Kilometres Paid by Globaltrans 87% 89% - -
Net Revenue from Engaged Fleet, RUB million 1,622 1,872 (250) -13%
Source: Globaltrans. Definitions for terms marked in this presentation with capital letters (including certain non-GAAP financial information) are provided at the end of this presentation.
Selected operational information for 2014 and prior periods are available in xls format at the corporate website (www.globaltrans.com)

Full-Year 2014 Results
Definitions (in alphabetical order)
27
Adjusted EBITDA (a non-GAAP financial measure) represents EBITDA excluding “Net foreign exchange transaction (gains)/losses on borrowings and other liabilities”, “Net foreign exchange transaction (gains)/gains on cash and cash equivalents and other monetary assets”, “Share of profit/(loss) of associates”, “Other gains - net” and “(Gain)/loss on sale of property, plant and equipment.
Adjusted EBITDA Margin (a non-GAAP financial measure) is calculated as Adjusted EBITDA divided by Adjusted Revenue.
Adjusted Revenue (a non-GAAP financial measure) is calculated as “Total revenue” less the following “pass through” items “Infrastructure and locomotive tariffs: loaded trips” and “Services provided by other transportation organisations”.
Average Distance of Loaded Trip is calculated as the sum of the distances of all loaded trips for a period divided by the number of loaded trips for the same period.
Average Number of Loaded Trips per Railcar is calculated as total number of loaded trips in the relevant period divided by Average Rolling Stock Operated.
Average Price per Trip is calculated as Net Revenue from Operation of Rolling Stock divided by total number of loaded trips during the relevant period in the respective currency.
Average Rolling Stock Operated is calculated as the average weighted (by days) number of rolling stock available for operator services (not including rolling stock in maintenance, purchased rolling stock in transition to its first place of commercial utilisation, rolling stock leased out or Engaged Fleet).
EBITDA (a non-GAAP financial measure) represents “Profit for the period” before “Income tax expense”, “Finance costs - net” (excluding “Net foreign exchange transaction gains/(losses) on borrowings and other liabilities” and “Net foreign exchange transaction gains on cash and cash equivalents and other monetary assets”), “Depreciation of property, plant and equipment”, “Amortisation of intangible assets”, “Impairment of property, plant and equipment” and “Impairment of intangible assets”.
Engaged Fleet is defined as rolling stock subcontracted or otherwise engaged from a third-party rail operator for a loaded trip from the point of origination to the cargo’s destination, at which point the railcar is then released to such third-party.
Empty Run or Empty Runs means movement of railcars without cargo for the whole or a substantial part of the journey.
Empty Run Costs (a non-GAAP financial measure meaning costs payable to RZD for forwarding empty railcars) is derived from management accounts and presented as part of the “Infrastructure and locomotive tariffs: empty run trips and other tariffs” component of “Cost of sales” reported under EU IFRS. Empty Run Costs do not include costs of relocation of rolling stock to and from maintenance, purchased rolling stock in transition to its first place of commercial utilisation, rolling stock leased in or leased out and Engaged Fleet.
Empty Run Ratio is calculated as the total of empty trips in kilometers by respective rolling stock type divided by total loaded trips in kilometers of such rolling stock type. Empty trips are only applicable to rolling stock operated (not including rolling stock in maintenance, purchased rolling stock in transition to its first place of commercial utilisation, rolling stock leased out or Engaged Fleet).
Free Cash Flow (a non-GAAP financial measure) is calculated as “Net cash from operating activities” (after “Changes in working capital” and “Tax paid”) less “Purchases of property, plant and equipment” (which includes maintenance CAPEX) and “Interest paid”.
Freight Rail Turnover is a measure of freight carriage activity over a particular period calculated as the sum of tonnage of each loaded trip multiplied by the distance of each loaded trip, expressed in tonnes-km. It includes volumes transported by the Engaged Fleet, unless otherwise stated.
Infrastructure and Locomotive Tariffs - Other Tariffs (a non-GAAP financial measure) is presented as part of the ‘‘Infrastructure and locomotive tariffs: empty run trips and other tariffs’’ component of “Cost of sales” reported under EU IFRS
.

Full-Year 2014 Results
28
Leased-in Fleet is defined as rolling stock fleet leased-in under operating leases, including both railcars and locomotives.
Leased-out Fleet is defined as rolling stock fleet leased out to third parties under operating leases.
Market Share is calculated as a percentage of the overall Russian freight rail transportation volume or as a percentage of overall Russian freight rail transportation volume of respective cargoes. It includes the volumes transported by Engaged Fleet unless otherwise stated.
Net Debt (a non-GAAP financial measure) is defined as the sum of total borrowings (including interest accrued) less “Cash and cash equivalents”.
Net Revenue from Engaged Fleet (a non-GAAP financial measure) represents the net sum of the price charged for transportation to clients by the Group utilising Engaged Fleet less the loaded railway tariff charged by RZD (included in the EU IFRS line item “Infrastructure and locomotive tariffs: loaded trips”) less the cost of attracting fleet from third-party operators (included in the EU IFRS line item “Services provided by other transportation organisations”).
Net Revenue from Operation of Rolling Stock (a non-GAAP financial measure) is defined as the sum of “Revenue from railway transportation - operators services (tariff borne by the Group)” and “Revenue from railway transportation - operators services (tariff borne by the client)” less “Infrastructure and locomotive tariffs: loaded trips”, “Services provided by other transportation organisation” and Net Revenue from Engaged Fleet.
Total Operating Cash Costs (a non-GAAP financial measure) represent operating cost items payable in cash and calculated as “Total cost of sales, selling and marketing costs and administrative expenses” less the “pass through” items: “Infrastructure and locomotive tariffs: loaded trips” and “Services provided by other transportation organisations” and non-cash items: “Depreciation of property, plant and equipment”, “Amortisation of intangible assets”, “Impairment charge for receivables”, “Impairment of property, plant and equipment” and “(Gain)/loss on sale of property, plant and equipment”.
Total Operating Non-Cash Costs (a non-GAAP financial measure) include line items such as “Depreciation of property, plant and equipment”, “Amortisation of intangible assets”, “Impairment charge for receivables”, “Impairment of property, plant and equipment” and “(Gain)/loss on sale of property, plant and equipment”.
Other Operating Cash Costs (a non-GAAP financial measure) include line items such as “Operating lease rentals - office”, “Auditors’ remuneration”, “Advertising and promotion”, “Communication costs”, “Information services”, “Taxes (other than income tax and value added taxes)” and “Other expenses”.
Owned Fleet is defined as the rolling stock fleet owned and leased in under finance lease as at the end of the reporting period. It includes railcars and locomotives unless otherwise stated and excludes Engaged Fleet.
Share of Empty Run Kilometers Paid by Globaltrans is defined as the percentage of empty run kilometers paid by Globaltrans divided by the total amount of empty run kilometers incurred by the fleet operated by Globaltrans (not including relocation of rolling stock to and from maintenance, purchased rolling stock in transition to its first place of commercial utilisation, and rolling stock leased out or Engaged Fleet) in the relevant period.
Total Empty Run Ratio is calculated as total kilometers travelled empty divided by the total kilometers travelled loaded by the fleet operated by Globaltrans (not including the relocation of rolling stock to and from maintenance, purchased rolling stock in transition to its first place of commercial utilisation, or rolling stock leased out or Engaged Fleet) in the relevant period.
Total Fleet is defined as the total rolling stock owned and leased in under finance and operating leases as at the end of period. It includes railcars and locomotives unless otherwise stated and excludes Engaged Fleet.
Transportation Volume is a measure of freight carriage activity over a particular period measuring weight of cargo carried in million tonnes. It includes volumes transported by Engaged Fleet, unless otherwise stated.
Definitions (in alphabetical order, continued)

Full-Year 2014 Results
Get more online atwww.globaltrans.com
You can find other useful information at our corporate
website including latest news and presentations,
events calendar, selection of historical financial and
operational information, share price data and other
information on Globaltrans and its performance.
We are committed to providing our shareholders with
the most up-to-date information and increasing
understanding of our business and industry.
On the move?
Why not visit our mobile
site, and keep up to date
with our latest information
and share prices.
Mikhail Perestyuk
Phone: +357 25 503 153
Email: [email protected]
Investor Relations