global supply chain operation in the apec region: case
TRANSCRIPT

Global Supply Chain Operation in the APEC Region: Case Study of the Electrical and Electronics Industry
APEC Policy Support Unit July 2013

PrepareChristopJames TWashinEmail: c ProduceAsia-PaAsia-Pa35 HengTel: (65Email: p APEC#
The viethose ofBayhaqcommenInvestm
ed by: pher Wood
Tetlow ngton COREchris@wco
ed for: acific Econoacific Econog Mui Keng5) 6891-950psugroup@
#213-SE-01
ews expressf APEC Me
qi and Bernnts to the
ment as well
E re.com
omic Coopeomic Coopeg Terrace 00 Fax: (65)
@apec.org W
.12.
This workShareAlikehttp://creat
sed in this pember Econnadine Zhadraft. The l as APEC m
eration Policeration Secr
) 6891-9690Website: ww
k is licensed e 3.0 Singativecommons
paper are thnomies and ang Yuhua author also
member eco
cy Support retariat
0 ww.apec.org
under the Capore Licens.org/licenses/b
hose of the APEC Forafrom the
o could likeonomies for
Unit
Creative Comse. To viewby-nc-sa/3.0/s
authors ana. The authoAPEC Pol
e to thank providing s
mmons Attribuw a copy osg/.
d do not neors thank Dlicy Supporthe Commisupport and
ution-NonComof this licen
ecessarily rDenis Hew, A
rt Unit to mittee on Trd comments
mmercial-nse, visit
epresent Akhmad provide
rade and .

Executive Summary i
EXECUTIVE SUMMARY
This study, conducted on behalf of the Asia-Pacific Economic Cooperation (APEC) Policy
Support Unit (PSU) aims to provide a detailed understanding of current electrical and
electronics (E&E) industry supply chain operations, strategies, and challenges, and suggest
approaches APEC might adopt to make these supply chains and others more efficient and
better contribute to economic integration in the region.
Primary study findings include the following:
Regarding the overall characteristics of E&E supply chains in the APEC region, as
covered in Chapter 1, final assembly of consumer electronics has become increasingly
centered on Asia, particularly China since 2001. At the same time, it is important to
note that China’s high electronics export volumes contain a large percentage of
products that are merely assembled locally, using parts manufactured in other APEC
economies such as Chinese Taipei, Korea, Japan, and Malaysia. Additionally, the
rising cost of labor in China has begun to cause some of these assembly operations to
shift to lower cost ASEAN economies such as Viet Nam.
Smartphones, laptop PCs, and LCD flat panel TVs were chosen for case studies on
E&E supply chains as they represent three of the top five highest sales volume
consumer electronics products around the world today and are the subject of
considerable media and academic analysis. Particular attention is paid to the twelve
APEC economies most active in these supply chains: China, the United States, Japan,
Korea, Chinese Taipei, Singapore, Malaysia, Mexico, Thailand, the Philippines, Viet
Nam and Indonesia. Regarding the structure and trends for each selected product’s
supply chains, as covered in the Chapter 2 case studies, suppliers for all three products
are based almost entirely in a small group of developed economies – Korea, the
United States, Japan, Chinese Taipei, plus increasingly in relative newcomer China.
The developing economies, particularly Malaysia, Thailand, Mexico, and Viet Nam,
then compete for the relatively small share of total supply chain value represented by
labor intensive assembly of parts and final products.
In the case of the relatively younger and more robust smartphone industry, there tends
to be a higher degree of vertical integration and vendor micromanagement in supply
chain operations, making it more challenging for new suppliers to join. The more
mature and price-sensitive laptop and LCD TV industries tend to have more
decentralized supply chains with heavy use of contract manufacturers.
The key factors impacting the selection and location of suppliers, as covered in
Chapter 3, are 1) strong technical workforce skills, 2) ease of labor mobility, 3) access
to financing, 4) incentives for foreign direct investment, 5) low labor costs, 6) high
scalability, 7) well-regulated working conditions, 8) advanced infrastructure, and 9)
proximity to end markets, which all contribute to the potential for the development of
domestic and regional supply chain operations. Challenges that may reduce the
competitiveness of certain suppliers or regions include short product life cycles,
natural disasters, and trade barriers.
Executive Summary ii
For the benefits of supply chain participation, as covered in Chapter 4, economies
may realize direct economic benefits in the form of increased employment and tax
revenue, as well as tangential benefits such as technology transfer to other sectors of
the economy. In an optimal situation, a sizable cluster of supply chain production
operations will attract a variety of supporting businesses to provide services,
multiplying benefits to the community. At the same time, governments need to be
careful that regulatory measures keep pace with the demands of supply chains upon
the local economy, lest there be any collateral damage such as increased occupational
health risks for factory workers.
Current government initiatives to enhance E&E supply chain competitiveness are
described in Chapter 5. Depending on each government’s focus on policy planning,
current policy initiatives range from China’s highly targeted and heavily funded next
generation information technology/electronics development plan, to the United States
government’s very modest investments in support of general manufacturing activities.
Policy priorities vary somewhat according to the evolutionary stage of the electronics
supply chains in each economy. Workforce skill upgrading stands above all as the
most common policy priority, and is likely to remain so as rapid technology change
constitutes a relentlessly moving target for economies at all levels of development.
Finally, based on analysis of findings from this study, focus areas for potential APEC
policy action to support E&E supply chain growth are discussed in Chapter 6.
Building up human capital through technical skills training and flexible immigration
policies is paramount to E&E supply chain competitiveness. Other valuable forms of
government support for supply chain growth include access to financing, education
for suppliers on trade regulation variations in the region, wider regional free trade
agreements, regional IP rights protection, and combinations of localized financial
incentives and advanced infrastructure to promote cluster development.

Table of Contents iii
TABLE OF CONTENTS
EXECUTIVE SUMMARY ................................................................................... i
Table of Contents ................................................................................................ iii
List of Figures ...................................................................................................... iv
List of Tables ....................................................................................................... iv
Introduction ......................................................................................................... 1
Chapter 1 Overall Characteristics of Global Supply Chains for the
Electronics Industry ............................................................................................ 2
1. Evolution of Trade Flows of Parts and Finished Products among APEC Economies ...... 3
2. Current Production Trends for Electronics Products within Key Supply Chain
Economies in APEC .............................................................................................................. 9
Chapter 2 Case Studies: Three Electronics Supply Chain Examples.......... 20
1. Case study 1: Smartphones .............................................................................................. 20
2. Case study 2: Laptops ...................................................................................................... 37
3. Case study 3: Flat panel TVs ........................................................................................... 46
4. Case Study Comparison ................................................................................................... 55
Chapter 3 Factors Impacting Supply Chain Strategy ................................... 60
1. Key Factors for Supplier and Site Selection .................................................................... 60
2. Challenges for Suppliers .................................................................................................. 63
Chapter 4 Local Impact of Supply Chain Participation ............................... 69
1. Benefits ............................................................................................................................ 69
2. Challenges ........................................................................................................................ 71
Chapter 5 Government Initiatives ................................................................... 74
1. Early Stage ....................................................................................................................... 74
2. Midterm Stage .................................................................................................................. 75
3. Mature Stage .................................................................................................................... 76
Chapter 6 Trends and Recommendations ...................................................... 77
1. Future supply chain trends ............................................................................................... 77
2. Recommendations for APEC ........................................................................................... 79
Abbreviation list ................................................................................................ 82
References .......................................................................................................... 83
Appendix ............................................................................................................ 91

List of Figures and tables iv
LIST OF FIGURES
Figure 1: Electronics supply chain steps (smartphones) ............................................................ 2
Figure 2: APEC electronics and appliance IEG and FEG trade flows in 2000 ......................... 5
Figure 3: APEC electronics and appliance IEG and FEG trade flows in 2010 ......................... 5
Figure 4: Annual electronics exports 2006-2011 (Developed economies and China) .............. 8
Figure 5: Annual electronics exports 2006-2011 (Developing economies and China) ............. 9
Figure 6: Foreign content in gross exports .............................................................................. 10
Figure 7: 2013 US market shre forecast for leading consumer electronics products .............. 20
Figure 8: 2011 worldwide production of the 4 key precious materials used in mobile device
manufacturing .......................................................................................................................... 25
Figure 9: Locations of smartphone production activities in APEC region .............................. 25
Figure 10: Apple and HTC combined smartphone parts purchases in 2011 by economy ....... 27
Figure 11: Locations for laptop production activities in the APEC region ............................. 41
Figure 12: locations of LCD TV production activities in the APEC region ............................ 50
LIST OF TABLES
Table 1: Economic and electronics trade indicators for APEC economies ............................... 7
Table 2: Economic indicators for APEC economies active in E&E product manufacturing .... 8
Table 3: Worldwide smartphone shipments leaders in 4Q12 .................................................. 22
Table 4: Key parts and leading suppliers for smartphones ...................................................... 24
Table 5: Current parts production and assembly locations for smartphones ........................... 27
Table 6: Samsung Galaxy S4 primary parts suppliers ............................................................. 30
Table 7: Samsung Galaxy S4 estimated part and manufacturing costs ................................... 31
Table 8: Nokia N95 Bill of Materials as of 2007 ..................................................................... 33
Table 9: Smartphone supply chain activities by location ........................................................ 35
Table 10: Worldwide PC shipments leaders in 2012 ............................................................... 38
Table 11: Key parts for laptops ................................................................................................ 39
Table 12: Current parts production and assembly locations for laptops .................................. 41
Table 13: Laptop supply chain activities by location .............................................................. 45
Table 14: Worldwide flat panel TV market share leaders in 2012 .......................................... 48
Table 15: Key parts and leading suppliers for flat panel TVs ................................................. 49
Table 16: Parts production and assembly locations for flat panel TVs ................................... 50
Table 17: Structure of LCD TV supply chain .......................................................................... 54
Table 18: Case study summary ................................................................................................ 55
Table 19: Vendor strategy ........................................................................................................ 58
Table 20: Total number of jobs provided by (Japanese) electronics manufacturing in APEC
economies in 2011 ................................................................................................................... 70

Introduction 1
INTRODUCTION
This study was conducted to support the APEC Committee on Trade and Investment’s (CTI)
ongoing efforts to better understand and improve the operations of E&E supply chains in the
21 member economies of the APEC region.
The E&E industry was selected because it accounts for a very substantial share by value of
APEC goods traded both intra-regionally and to external export markets. The E&E industry
encompasses the manufacturing of consumer electronics products such as mobile phones and
computers, industrial equipment products such as motors and climate control systems,
household appliances such as refrigerators and washing machines, and parts for all of these
products1. In this report, the term “E&E products” and “electronics products” will be used
interchangeably and refer to the same category or grouping of general consumer electronics
products.
The contents of this report are as follow:
Chapter 1 of the report provides background on general trends for manufacturing and
supply chains in the electronics industry, and the economic data and supply chain
roles of key APEC economies that are most active in the E&E industry.
Chapter 2 provides case studies which examine how supply chains operate for the
three selected products. Each case study considers the market background and the
overall trends for a product, as well as the supply chain details for a leading vendor
for each product. For smartphones, the supply chain operations of Samsung and Nokia
are considered, while those of Lenovo and Sony are examined for laptops and LCD
TVs respectively.
Chapter 3 analyzes common key factors impacting competitiveness and challenges for
suppliers in the electronics supply chain. These key factors include manufacturing
capacity/responsiveness and local labor costs, while challenges include issues such as
employee training and short product life cycles.
Chapter 4 explores the benefits and challenges experienced by host economies which
participate in these supply chains.
Chapter 5 considers current government initiatives to improve the operation of local
electronics supply chains, with illustrative examples from economies at different
stages of supply chain development: China, Malaysia, and Japan.
Finally, Chapter 6 suggests some action items for the consideration of APEC
policymakers, with the goal of improving the efficiency of these supply chains.
1 Definition from the Malaysian Investment Development Authority.

Chapter 1 Overall Characteristics of Global Supply Chain for Electrical and Electronics Industries 2
CHAPTER 1 OVERALL CHARACTERISTICS OF GLOBAL SUPPLY
CHAINS FOR THE ELECTRONICS INDUSTRY
This chapter explores general characteristics of the electronics industry and supply chains,
recent economic growth data and levels of electronics supply chain participation for APEC
economies, and regional trade flow trends. Supply chains are very complex networks with
many different participants performing many different functions. Figure 1 below provides a
simple structural overview, using the example of Apple iPhones:
Figure 1: Electronics supply chain steps (smartphones)
Source: author based on literature and interview research.
As seen above, in step 1) the product is first designed by the vendor’s R&D department, often
in the vendor’s home economy. In this case Apple conducts R&D in the United States. In
steps 2) and 3), according to the product specification, parts of varying complexity and cost
are produced by a variety of suppliers across multiple APEC economies. In the case of the
iPhone, some of these key components, such as camera modules and flash memory, come
from Japanese and Korean suppliers, produced either in their home economies or more likely
in economies with lower labor costs such as Thailand and China. Next in step 4) the parts are
assembled into the final product, in massive facilities in China in the case of the iPhone.
Finally, in steps 5) and 6) the vendor markets and coordinates the distribution of the finished
product to end consumers, who are currently most concentrated in the United States and the
European Union (EU), but also increasingly in China.

Chapter 1 Overall Characteristics of Global Supply Chain for Electrical and Electronics Industries 3
This report focuses primarily on steps 2) – 4) as pictured above: the production of parts, also
known as intermediate electronic goods (IEG), as the suppliers that produce IEG typically
capture the largest share of the value-added to finished electronic goods (FEG), with the
exception of the vendor itself. Short of creating a large FEG vendor, nurturing the
development of high-value added IEG suppliers is the most effective way for APEC
economies to benefit from electronics supply chains.
1. EVOLUTION OF TRADE FLOWS OF PARTS AND FINISHED PRODUCTS
AMONG APEC ECONOMIES
E&E parts and products account for a commanding share of the value of exports from the
APEC economies, especially among leading Asian economies such as China, Korea, Japan,
Chinese Taipei, and Singapore. The lion’s share of parts in intraregional trade flowing
between APEC Asian economies is comprised of IEG, and the largest export category from
these economies to the world is FEG. (Thorbecke, 2012)
One reason the APEC region has continued to grow despite slowdowns in the United States
and EU economies is this increasing level of intraregional trade, enabled through both better
business opportunities and, increasingly, government cooperation. According to the Asian
Development Bank (ADB), progress in regional integration has come about as a result of the
expanding scope of Asian markets; the rise of various functional programs (trade, money and
finance, infrastructure); emergence of subregional institutions and intraregional forums—
such as APEC, the Association of Southeast Asian Nations (ASEAN), ASEAN+3, East Asia
Summit (EAS), Asia–Europe Meeting (ASEM), and the Greater Mekong Subregion (GMS)
Program among others; and the creation of mechanisms for macroeconomic and financial
cooperation. (Azis, 2012, pg11-19)
Real GDP in the APEC region grew by an estimated 4.1 percent in both 2011 and 2012,
exceeding the global rate of 3.2 percent in 2012. However, weak import demand from the EU
and the United States caused growth to vary among APEC members. GDP growth in the
newly industrialized Asian economies slowed sharply to 1.7 percent in 2012, due in part to
reduced export demand for electronics goods. (APEC PSU, 2013)
For the APEC region, the value of exports grew by just 2.6 percent in 2012 to USD 8.7
trillion, significantly less than the growth rate of 17.2 percent in 2011. However, intra-APEC
trade grew by 3.9 percent, compared with a contraction of 1.8 percent for the rest of the world.
(APEC PSU, 2013)
Intra-regional merchandise exports and imports amongst APEC economies have been robust,
both growing at an annual average of 8.1 percent since 1992. In 2011, intra-regional
merchandise exports accounted for 67.2 percent of APEC’s total merchandise exports, while
intra-regional merchandise imports accounted for 65.1 percent of imports. (Australia
Department of Foreign Affairs and Trade, 2012)
One recent study found that APEC members increased their intra-regional trade by around
100 percent during the period between 1989 and 2007. (Jung and Hyun-Hoon, 2012) Other
studies have found that APEC members typically export 2.8 times more to other APEC
members than to non-APEC economies, and an APEC member typically imports 1.9 times
more from other APEC members than from non-APEC economies. (APEC PSU, 2009) These
Chapter 1 Overall Characteristics of Global Supply Chain for Electrical and Electronics Industries 4
differences are particularly apparent for electronics trade, as the vast majority of production
activities and several of the largest end markets are located within APEC.
As noted, E&E products play a very significant role in the trade of developing APEC
economies. In 2011 trade in E&E products and parts accounted for almost 40 percent of
exports from developing Asian economies, such as China, Malaysia, Thailand, Viet Nam,
Indonesia, and the Philippines.2 Over two-fifths of these developing economies’ electronics
exports are shipped directly to the key consumer markets of the United States, the EU, and
Japan. Another two-fifths of these exports are traded intra-regionally, more than a third of
which are parts that are used in regional and global production networks (Izvorski, 2009, pg
6).
Weak demand in the major consumer markets therefore also reduces intra-regional trade in
this sector. Unfortunately the global E&E market is still struggling to fully recover from the
2008 global financial crisis, with annual sales growth remaining well below 2005 levels. The
sector’s weakness may persist as demand in the EU appears likely to remain weak for the
near future. (Quillin, 2012, pg 4-12)
2 This World Bank data covers the following developing Asian economies: China, Malaysia, Thailand, Viet
Nam, Indonesia, Philippines, Papua New Guinea, Cambodia, Fiji, Lao PDR, Mongolia, Solomon Islands, and
Timor-Leste.

Chapter 1 Overall Characteristics of Global Supply Chain for Electrical and Electronics Industries 5
Figure 2: APEC electronics and appliance IEG and FEG trade flows in 2000
Source: Japan Research Institute of Economy, Trade and Industry
Figure 3: APEC electronics and appliance IEG and FEG trade flows in 2010
Source: Japan Research Institute of Economy, Trade and Industry.
As illustrated by Figures 2 and 3 above, final production of consumer electronics and
appliances within APEC electronics supply chains has become more and more centered
around China since it joined the World Trade Organization (WTO) in 2001. For example, for
the last ten years Japanese electronics manufacturers have primarily produced parts in Japan

Chapter 1 Overall Characteristics of Global Supply Chain for Electrical and Electronics Industries 6
and in ASEAN economies, especially, Thailand, Viet Nam, and Malaysia, which are then
sent to China for assembly, and from there the finished products are exported to the United
States and other markets. Recently, however, the rising cost of labor in China has caused
some new assembly operations to locate in ASEAN economies. This is known as the
“China+1” movement. Another growing trend for Japanese suppliers is to manufacture parts
in China for the huge Chinese domestic market.3
The flow of IEG to China is exceeded by the flow of final goods from China to end markets
such as the United States and the EU. In 2000 the value of China’s FEG exports to the world
equaled USD 50 billion, less than the value of FEG exports from either Japan or ASEAN and
about the same as the value of FEG exports from the newly industrialized economies (NIEs)
of Korea and Chinese Taipei. By 2010 China’s exports of FEG equaled USD 415 billion,
almost twice the value of FEG exports from Japan, ASEAN, and the NIEs combined.
(Thorbecke, 2012)
As Tables 1 and 2 and Figures 4 and 5 illustrate below, China has easily led APEC
economies and the world in electronics exports since the mid-2000s, and continues to handily
outpace all the major APEC electronics exporters in annual export growth. However, it is
worth noting that the huge export figures for China contain a large percentage of electronics
products that were merely assembled locally, using IEG manufactured in other APEC
economies such as Chinese Taipei, Korea, Japan, and Malaysia. Therefore China’s big export
numbers are indicative of the high percentage of FEG assembly conducted there, but not an
accurate representation of the value captured by China from electronics supply chains.
Outside of China, Chinese Taipei, Indonesia, and Mexico have enjoyed some of the healthiest
export growth in recent years, but none come anywhere near equaling the dramatic surge of
Viet Nam, whose annual exports have on average nearly doubled annually since 2006,
drawing even or ahead of both Indonesia and Canada in 2011. On the other end of the
spectrum, exports from advanced and mature players such as the United States and Japan are
nearly flat or declining.
3 Japan Ministry of Economy, Trade and Industry. Interview with Washington Core. (February 2013)

Chapter 1 Overall Characteristics of Global Supply Chain for Electrical and Electronics Industries 7
Table 1: Economic and electronics trade indicators for APEC economies
Economy
GDP 2011
(USD
trillions)
GDP average
growth rate 2009-
2011
(%)
Share of global
electronics exports
2011
(%)
Share of global
electronics
imports 2011
(%)
Australia 1.37 1.83 0.1 1.2
Brunei 0.01 0.40 NA NA
Canada 1.74 0.97 0.7 2.1
Chile 0.25 3.70 0.002 0.3
China 7.32 9.63 24.4 14.5
Hong Kong, China 0.24 3.17 8.6 8.5
Indonesia 0.85 5.77 0.5 0.8
Japan 5.86 -0.60 5.4 4.2
Malaysia 0.28 3.57 2.9 2.1
Mexico 1.15 1.07 3.6 3.2
New Zealand 0.14 0.70 0.04 0.2
Papua New Guinea 0.01 7.50 NA NA
Peru 0.18 5.50 0.004 0.2
Philippines 0.22 4.13 0.6 0.3
Korea 1.11 3.40 5.0 2.8
Russia 1.85 0.27 0.1 1.4
Singapore 0.24 6.23 5.2 4.8
Chinese Taipei 0.46 4.37 5.7 2.7
Thailand 0.34 1.87 1.7 1.5
United States 15.09 0.40 7.6 13.9
Viet Nam 0.12 6.00 0.5 0.6
Source: APEC, UN Comtrade (retrieved on 3 May 2013).
Note: Repeating decimals for GDP growth are rounded to the nearest decimal. Electronic imports and exports
are derived from HS Codes 8471 (Computers) and 85 (Electrical machinery and equipment and parts thereof;
sound recorders and reproducers, television image and sound recorders and reproducers, and parts and
accessories of such articles). GDP data for Brunei and New Zealand are for the year 2010. NA means data not
available. Data for Chinese Taipei are retrieved from WTO International Trade Statistics 2012.

Chapter 1 Overall Characteristics of Global Supply Chain for Electrical and Electronics Industries 8
Table 2: Economic indicators for APEC economies active in E&E product manufacturing
Economy
Value of
electronics
exports 2011
(USD billions)
% Change 2009-
2011 of value of
electronics
exports
Value of
electronics
imports 2011
(USD billions)
% Change 2009-
2011 of value of
electronics
imports
China 597.79 48.5 380.31 43.2
Hong Kong, China 211.00 38.8 223.56 42.4
United States 186.24 28.3 364.48 33.9
Japan 132.08 12 109.52 43.7
Singapore 128.08 33.5 93.91 34.2
Korea 121.85 33.7 74.50 31.5
Chinese Taipei 116.97 50.5 62.01 54.2
Mexico 87.15 27.6 83.49 38.0
Malaysia 71.04 29.5 53.88 36.5
Thailand 41.66 24.1 38.39 42.3
Canada 17.17 7.8 54.90 36.3
Philippines 14.86 -30.2 9.11 -30.8
Viet Nam 13.45 213.5 15.34 69.9
Indonesia 11.63 28.8 20.44 63.1
Russia 3.50 25.9 36.20 69.5
Australia 3.19 32.4 30.75 38.8
New Zealand 0.94 42.4 4.03 29.6
Chile 0.57 14 7.41 47.6
Peru 0.10 11.1 4.17 68.1
Brunei NA NA NA NA
Papua New Guinea NA NA NA NA
Source: UN Comtrade (retrieved on 3 May 2013). Data for Chinese Taipei were provided by Bureau of Foreign
Trade, Ministry of Economic Affairs, Chinese Taipei.
Note: Electronic imports and exports are derived from HS Codes 8471 and 85. Data for Chinese Taipei is
provided by Chinese Taipei Customs. Figure 4: Annual electronics exports 2006-2011 (Developed economies and China)
Source: WTO (Retrieved in April 2013).
Note: Data includes smartphone, laptop, and TV final products and parts, as well as other kinds of computer,
telecommunications, and audio/visual equipment. China totals represented on right axis.
0
100000
200000
300000
400000
500000
600000
0
20000
40000
60000
80000
100000
120000
140000
160000
2006 2007 2008 2009 2010 2011
US
D m
illi
on
s
China
United States
Singapore
Chinese Taipei
Korea
Japan

Chapter 1 Overall Characteristics of Global Supply Chain for Electrical and Electronics Industries 9
Figure 5: Annual electronics exports 2006-2011 (Developing economies and China)
Source: Data from WTO (Retrieved in April 2013).
Note: Data includes smartphone, laptop, and TV final products and parts, as well as other kinds of computer,
telecommunications, and audio/visual equipment. China totals represented on right axis.
2. CURRENT PRODUCTION TRENDS FOR ELECTRONICS PRODUCTS WITHIN
KEY SUPPLY CHAIN ECONOMIES IN APEC
This section provides an overview of the nature and extent of involvement in electronics
supply chains by twelve key participating APEC economies: China, the United States, Korea,
Japan, Chinese Taipei, Singapore, Malaysia, Mexico, Thailand, Viet Nam, Indonesia, and the
Philippines. These twelve were selected for their relatively high levels of electronics exports
and /or high growth rates for these exports.
Hong Kong, China also has a fairly high level of electronics exports, but is not discussed
separately as most goods are produced almost entirely in China; rather parts and final
products pass through Hong Kong, China’s port on their way to and from factories in China4.
Therefore, Hong Kong, China’s role in E&E global supply chain is less on manufacturing,
but more on services, such as being the provider of transport, sourcing and distribution
services that supports the expanding trade in electronics goods.
Canada is also not discussed directly, because, although it has comparable electronics export
volumes to some of the economies on the low end of this list, it is not a major IEG production
or FEG assembly location for the products discussed. The other economies in APEC
currently have very small presences in electronics supply chains.
4 Almost all of Hong Kong, China’s exports are produced elsewhere, a fairly large amount of electronic goods
pass through Hong Kong, China. China comprised 62% of HKC’s overall electronic exports in 2011, while the
United States and Japan accounted for 6.9% and 3.6% respectively. On the other hand, China comprised 51%
of HKC’s overall electronic imports in 2011, followed by Singapore (9.5%), Japan (7.6%) and Korea (4.6%),
United States (3.9%) and Malaysia (3.6%) (based on data provided from HKC’s government).
0
100000
200000
300000
400000
500000
600000
0
10000
20000
30000
40000
50000
60000
70000
2006 2007 2008 2009 2010 2011
US
D m
illi
on
s
China
Malaysia
Mexico
Thailand
Philippines
Vietnam
Indonesia

Chapter 1 Overall Characteristics of Global Supply Chain for Electrical and Electronics Industries 10
Electronics production in the APEC region is generally fragmented into distinct tasks, which
are located in different economies to minimize costs where labor costs or regulatory burdens
are lower. This practice can be conducted cost-effectively due to relatively liberal trade and
investment regimes, relatively efficient port and communication systems, and flexible
logistics and transport systems across most of the region. Additionally, rapid economic
growth in several economies has expanded the size of domestic markets, leading electronics
suppliers to establish local operations to be near the end customers. (Aziz, 2012, pg 11-19)
The International Monetary Fund (IMF) in 2011 observed the development of a “Factory
Asia” phenomenon in recent years, in which NIEs such as Chinese Taipei and Korea
relocated lower-end labor-intensive assembly processes to economies with low labor costs
such as China and ASEAN, spurring competition for investment and jobs in East Asia which
resulted in unilateral tariff-cutting in the region. (IMF, 2011)
Recent increases in exports have been accompanied by rises in imported content, especially
for some key APEC economies such as China and Japan, as seen in Figure 6 below. This
indicates a trend toward increasingly vertically integrated global supply chains since the mid-
1990s.
Figure 6: Foreign content in gross exports
Source: IMF (2011).
Note: DVA refers to domestic value added. CHN refers to China. OEA refers to other East Asia, including Hong
Kong, China; India; Indonesia; Korea; Malaysia; the Philippines; Singapore; Chinese Taipei; Thailand; and Viet
Nam.EA refers to Euro Area, including Austria, Belgium, Cyprus, Estonia, Finland, France, Germany, Greece,
Ireland, Italy, Luxembourg, Malta, Netherlands, Portugal, Slovak Republic, Slovenia, and Spain. ROW refers to
rest of the world. Non EA refers to non- Euro Area.
China
China functions as the epicenter of electronics supply chains. The vast majority of assembly
operations for FEG are located in China, along with production of generally lower-value

Chapter 1 Overall Characteristics of Global Supply Chain for Electrical and Electronics Industries 11
added parts. In 2011 the value of electronic exports was equal to approximately 8.2 percent of
China’s GDP.5 China has become the world’s largest exporter, with a value of almost USD
1.6 trillion in 2010 and almost USD 1.8 trillion in 2011. One-third of its exports are FEG.
China is also a major importer, with imports exceeding USD 1.1 trillion in 2010 and USD 1.4
trillion in 2011. 20 percent of its imports are IEG that are used to produce FEG for re-export.
The Ministry of Industry and Information Technology of China reported that electronics
exports increased by 12 percent in 2011 and were growing steadily in 2012. Thus, the
Chinese FEG export surge seems likely to continue. (Thorbecke, 2012)
The value of IEG going to China was about USD 160 billion in 2010. Almost 90 percent of
these imports came from East Asian economies such as Chinese Taipei, Japan, Korea,
Malaysia, the Philippines, Singapore, and Thailand. Trade statistics often credit the entire
values of FEG assembled from IEG to China, thus misleadingly inflating the export value
added by China. For instance, in 2009 China’s exports of the Apple iPhone amounted to USD
4.6 billion, of which only 3.6 percent was the value added by assembly by Chinese workers.
The same year, China’s annual exports of laptop PCs were valued at USD 52 billion, but
local assembly accounted for only 3 percent of the gross value. However, as industrial
clusters have developed in China around assembly operations, the gross value of electronics
goods and other sophisticated exports produced in China is increasing. (Thorbecke, 2012)
Another factor to be considered in assessing China’s true contribution to electronics exports
is that 83 percent of China’s electronics exports were attributed to foreign invested/owned
firms, especially firms from Chinese Taipei. Electronics companies from Chinese Taipei have
relocated 95 percent of their production/assembly capacity into mainland China, particularly
for smartphones, laptops, and digital cameras. (Xing, 2011) Although domestic Chinese firms
currently are mostly engaged in assembly and the production of lower cost parts, there is a
small but increasing number of globally competitive Chinese vendors such as Huawei and
ZTE in smartphones, and Lenovo in laptops.
United States
Today the main role of the United States in electronics supply chains is providing R&D and
design functions, particularly for computer-related products, with some limited parts
production. As of 2011 the value of United States electronics exports was equal to 1.2 percent
of United States GDP. Once itself the epicenter of electronics production, since the 1960s
globalization has greatly reduced the extent of electronics manufacturing in the United States.
United States-based multinational enterprises are looking for ways to reduce costs by
establishing research centers in developing economies, outsourcing labor-intensive
manufacturing and service activities, and contracting out easily replicated technological work
to lower-cost engineers in the developing world. (Hira and Hira, 2005)
In smartphones, Apple continues to be a highly profitable leading vendor, although for years
now part manufacturing and product assembly have been concentrated in East Asia,
especially China. R&D activities have tended to remain in the United States, while marketing
activities concentrate wherever there is a major market, such as the United States, or
increasingly China.
5 In this section, electronic exports as a percentage of GDP is calculated from data retrieved from Stats APEC
(GDP) and UN Comtrade (export data).

Chapter 1 Overall Characteristics of Global Supply Chain for Electrical and Electronics Industries 12
Computer manufacturing, once concentrated in the United States, followed the same shift
overseas as smartphones, partly driven by Dell’s strategy, beginning in the 1990s, of lowering
costs through heavy reliance on contract manufacturing. In the mid-2000s PC industry
pioneer IBM exited the market completely, selling its manufacturing operations to Lenovo,
now one of the world’s leaders in laptop sales. Apple, its own laptop manufacturing
operations now predominantly based in China, made the surprising announcement in
December 2012 that it would invest USD 100 million to make laptops through contractors in
the United States. It remains to be seen whether this is the start of a larger reshoring trend due
to rising labor costs in China, or a short-term political gesture to assuage the United States
government’s concerns over the loss of advanced manufacturing capacity.
Regarding TVs, production activities ceased in the United States by the 1980s, moving
instead to Asia and Mexico. Similar to Apple, in 2012 United States vendor Element
Electronics made headlines by announcing it would open the first United States -based TV
assembly facility since the 80s, although this is expected to be a small operation with a few
hundred employees. (Roush, 2012)
Korea
Korea’s role in electronics supply chains is primarily to provide R&D and produce high-
value parts. In 2011, the total export value of Korea reached USD 552.8 billion (8th largest in
the world), (US CIA Factbook, 2013) accounting for about 56 percent of the economy’s GDP.
(World Bank, 2013) The same year, the value of Korea’s electronics exports was equal to 11
percent of Korea’s GDP, including products such as television and computer displays, and
components including dynamic random access memory (DRAM)6 chips, and memory circuits.
Korea’s primary export partners are China, the United States, and Japan. (US CIA Factbook,
2013)
Since the mid-1990s, the Korean electronics and IT sectors drastically increased their
production and market capacities as a result of five government-led policies. First, the
government has promoted close and strong ties between public and private actors, especially
in R&D. Second, the government has invested in advanced infrastructure such as wired and
wireless broadcast networks. Third, the government introduced liberalization policies to the
market. Fourth, the Ministry of Information and Communication issued several technology
development policies and plans such as the IT 839 policy in 2004. Fifth, the government
created a new work visa for foreign IT researchers to encourage their intellectual
contributions to IT development in Korea. (Joe, 2012, pg 4)
The government-driven initiatives to develop the Korean electronics and IT industries,
especially the display and semiconductor industries, have gradually enabled the major
vendors of electronics products, such as Samsung and LG, to predominate the market.
Samsung is a world leader in smartphones, flat panel TVs, and DRAM memory. In the first
quarter of 2012, Samsung had a 22.8 percent market share in the global large-sized LCD
panels market.(Sweta, 2012) It also had a 50 percent share of internet-accessible, 3D
television in both North America and Europe in the first quarter of 2011.(Jewon, 2011, pg.3)
Domestic competitor LG Electronics focuses on similar types of electronics products. Its
6 According to TechTarget: Dynamic random access memory (DRAM) is common in laptops and mobile
devices. Random access means that the processor can access any part of the memory directly rather than having
to proceed sequentially. DRAM stores each bit of memory in a storage cell consisting of a capacitor and a
transistor.

Chapter 1 Overall Characteristics of Global Supply Chain for Electrical and Electronics Industries 13
global market share of large sized-LCD panels reached 28.1 percent in the first quarter of
2012.(Sweta, 2012) There are two major LCD industry clusters in Korea located in Paju and
Tangjeong.(Invest Korea, 2013)
Some major foreign electronics and IT manufacturers have invested heavily in supply chain
operations in Korea, including Philips (Netherlands), Asahi Kasei (Japan) and Toshiba
(Japan).(Invest Korea) Companies from China and Chinese Taipei such as BOE-OT, IVO,
Century, Innolux, and HannStar also have manufacturing facilities in Korea.(Invest Korea,
2013)
Japan
Today Japan’s main role in the E&E supply chain is providing R&D and production of some
high-value added parts, although its large vendors notably own and operate extensive part
manufacturing operations in ASEAN economies. The value of electronics exports was equal
to 2.3 percent of Japan’s GDP in 2011.
Japan, formerly the dominant electronics
manufacturer in Asia up until the 1990s, has been overtaken during the last couple decades by
surging competition from Korea and China. To deal with increasing competitive pressures,
Japanese manufacturers began transferring factories to lower cost areas in Asia following the
drastic appreciation of the yen in the late 1980s. Initially production was shifted to the newly
industrialized economies such as Chinese Taipei, later to ASEAN economies, and then to
China.
In 2010, Japan received about USD 40 billion in intermediate goods exports. This small
volume, only a fourth of that going to China, reflects the fact that Japan is upstream in the
value chain, producing high-value parts and shipping them to other APEC economies for
processing and assembly. (Thorbecke , 2012)
There are numerous large consumer electronics vendors in Japan, although their products do
not dominate oversea markets as they did in the 1990s, and several have been forced into
consolidation in recent years to survive fierce competition from Korean and other Asian
competitors. Nevertheless Sony continues to be a major player in smartphones, and
companies like Toshiba and Hitachi have large shares of markets for high-value added parts
such as flash memory for smartphones and hard disk drives for laptops.
Chinese Taipei
Chinese Taipei’s supply chain role ranges from R&D to a wide variety of parts production to
limited FEG assembly. As of 2011 the value of electronics exports from Chinese Taipei was
equal to 20.9 percent of the Chinese Taipei GDP. Chinese Taipei has developed formidable
export competitiveness, particularly in electronics subsectors such as information and
communications technology (ICT), flat panel displays, and semiconductor chips and
machinery. Chinese Taipei companies also own and operate extensive parts and FEG
production facilities in China.
Chinese Taipei typically leads the world in the percentage of trade accounted for by
intermediate goods. According to 2011 WTO statistics, 71 percent of Chinese Taipei’s
imports and 65 percent of its exports consist of intermediate goods. However, Chinese Taipei
faces some challenges to maintain its strong supply chain position. Its population is aging
faster than most of its Asian trading partners. Additionally, according to the World Bank’s
Doing Business Report, Chinese Taipei’s business climate ranks below its major Asian

Chapter 1 Overall Characteristics of Global Supply Chain for Electrical and Electronics Industries 14
competitors, including Hong Kong, China; Japan; Korea; Malaysia; and Thailand. (Barfield,
2011)
Chinese Taipei has nineteen domestic firms in the Organisation for Economic Co-operation
and Development’s (OECD) list of top 250 global ICT firms, compared to nine from Korea
and 39 from the EU (see Appendix)7
. Despite this achievement, Chinese Taipei has
developed only a few internationally well-known vendors (smartphone and laptop
manufacturers Acer and ASUS), and is largely characterized by numerous small and
medium-sized enterprises (SMEs) that account for over 80 percent of industrial output. A
large majority of Chinese Taipei’s ICT exports are produced by niche firms or contract
manufacturers producing for customers of consumer and technology brands from the United
States, Japan, the EU, and, recently, China. Chinese Taipei’s companies have strong global
market shares in smartphones, laptops, and Wi-Fi routers.
Singapore
Singapore’s main supply chain roles are providing R&D, some parts production, and a
shipping hub for the ASEAN region. The value of electronics exports was equal to 53.4
percent of Singapore’s GDP in 2011. The electronics industry also accounted for USD 68.3
billion and employment of more than 82,000 workers in 2011. It is important to note though
that the majority of these exports are transshipments passing through the port of Singapore,
and not domestically produced products. The Singapore government hopes to strengthen
Singapore’s position as a world-class electronics manufacturing hub with extensive R&D
capabilities.
Currently there are 14 silicon wafer semiconductor fabrication plants (fabs), 20 assembly and
test operations and about 40 integrated circuit (IC8) design centers in Singapore. The industry
currently employs about 4,600 R&D engineers in areas such as IC design, wafer fabrication
process development, assembly, package and test development, as well as embedded software
development. According to the Singapore Economic Development Board, this includes the
world’s top three wafer foundry companies, three of the top five assembly and test
subcontractor companies, and nine of the world’s top 10 fabless semiconductor companies9.
Other electronics products manufactured in Singapore include advanced substrates10
,
batteries, LCD displays, capacitors (Singapore Economic Development Board), and hard
disks. High-value added manufacturing is supported by a growing cost-efficient supply chain
of suppliers in the immediate region at locations such as Iskandar in Malaysia and Batam,
Bintan and Karimun in Indonesia.
Singapore also hosts a number of leading international consumer electronics players. It is the
regional headquarters for Samsung Electronics, LG Electronics, Panasonic, Electrolux, BSH
and Karcher. Some companies, including HP and IBM, have established research labs there.
(Singapore Economic Development Board),
7 OECD, “OECD Internet Economy Outlook 2012.” (2012) 8 An integrated circuit (IC) is a set of microminiaturized, electronic circuits fabricated on a single piece of
semiconducting material, normally silicon, and is used in virtually all electronic equipment today.
(Encyclopedia) 9 These companies do design and testing, but outsource actual manufacturing to a third party semiconductor
foundry. http://www.pcmag.com/encyclopedia_term/0,1237,t=fabless&i=42966,00.asp 10 Advanced substrates are printed circuit board materials with superior thermal properties, which enable the use
of multichip modules for products requiring high-frequency transmissions. http://www.lectronics.net/glossary

Chapter 1 Overall Characteristics of Global Supply Chain for Electrical and Electronics Industries 15
Malaysia
Malaysia’s main supply chain role is contract manufacturing of parts. As of 2011 the value of
electronics exports was equal to 25.4 percent of Malaysia’s GDP. In the past Malaysia was
also a major location for final product assembly, but this function has largely moved to China
since the early 2000s due to lower labor costs.11
Part of the reason for this shift to China was an acute shortage of labor that occurred in
Malaysia in the 1990s, largely due to tight government restrictions on mobility. Recognizing
this dilemma, the government moved to liberalize foreign labor mobility, and today foreign
labor comprises roughly 50 percent of the production labor base in Malaysia.
The government is also concerned that the Malaysian economy is not benefiting as much as
the manufacturers who source from there. The domestic supply chains are seen to be
disorganized and uncoordinated, suffering from a lack of domestic investment. Rather, these
supply chains are largely the result of foreign direct investment (FDI), which has little
incentive to support the development of potential domestic competitors. Roughly 96 percent
of electronics industry operations in Malaysia are foreign-owned.12
While FDI projects have
benefited from attractive investment incentives, their contract manufacturing operations do
not actively promote much transfer of R&D and design capabilities to the local workforce.
Researchers at TalentCorp, the government’s human resource development agency, and the
Malaysia University of Science and Technology have expressed concern about the limited
capabilities of the Malaysian electronics workforce in these areas. (TalentCorp, 2012)
The Malaysian Ministry of International Trade and Industry has conducted studies on how to
make Malaysia the center for electronics supply chains in the ASEAN region, but so far the
government has struggled to increase domestic investment in the electronics industry, largely
because investors are uncertain of the return on investment.13
As a result, Malaysia has had limited opportunities to develop internal innovative capabilities
and capacities, and instead merely migrated to higher-end applied manufacturing process and
service technologies. Foreign parts suppliers make use of Malaysia mostly as a base for
assembly of components. R&D is performed in the suppliers’ homeland, often Japan, or a
third economy. There are very few sizable domestically owned suppliers. The establishment
of design houses and certification labs is seen to be crucial to driving innovation throughout
the domestic supply chains. (Vingkam and Choon Heng)
Mexico
Mexico’s main role in global electronics supply chains is assembly of products destined for
North American markets, due to its proximity, relatively low labor costs, and importantly its
membership in the North American Free Trade Agreement (NAFTA). As of 2011 the value
of electronics exports was equal to 7.6 percent of Mexico’s GDP. Mexico’s electronics
sector has demonstrated strong growth in export potential and employment generation.
Currently, Mexico is the second largest supplier of electronics products to the United States
market (Mexico Today, 2011). In 2011, the United States received 83 percent of the sector’s
exports, followed by Canada with 6 percent (Pro Mexico Trade and Investment, 2011).
11 Malaysia University of Science and Technology, interview with Washington Core. (February 2013) 12 Ibid. 13 Ibid.

Chapter 1 Overall Characteristics of Global Supply Chain for Electrical and Electronics Industries 16
According to Alix Partner’s Outsourcing- Manufacturing Cost Index 2010 and to KPMG’s
Competitive Alternatives 2010 reports, Mexico is the economy with the lowest component
manufacturing costs in the industry, with an 18.2 percent savings compared to other industrial
economies such as Japan (Mexico Today, 2011).
Electronics manufacturing is located primarily in the northern region of Mexico, in the
governments of Baja California, Chihuahua and Tamaulipas (Marca Pais-Imagen de Mexico,
2011). As of 2011, over 730 manufacturing plants had been established, with 709 companies
dedicated to the electric industry and 197 electric-appliance companies. Eighty percent of the
world’s largest manufacturing service suppliers operate in Mexico, including firms such as
Foxconn, Compal, Flextronics, Jabil Circuit, Celestica and Sanmina SCI. (Pro Mexico Trade
and Investment, 2011)
Multinational companies such as Sony, Samsung, JVC and Pioneer have established
themselves in the Tijuana and Mexicali cluster. The assembly and some design of flat panel
plasma, LCD and LED televisions is the single largest sector of the Mexican electronics
industry, representing 25 percent of Mexico's electronics export revenue. (Marca Pais-Imagen
de Mexico, 2011) This sector is currently generating the highest manufacturing output in
Mexico. Furthermore, Mexico was ranked the largest exporter of flat panel TVs in the world
in 2009, above economies like China, Germany and the United States.(Mexico Today, 2011)
Companies such as Sony, Samsung, Sharp, LG, and Panasonic are manufacturing televisions
in Mexico. (NexTV Latam, 2013)
In 2009, Mexico was the third largest exporter of mobile phones, with exports manufactured
in Mexico reaching USD 9.84 billion. (Pro Mexico Trade and Investment, 2011) Mexico’s
computer manufacturing industry includes both domestic companies such as Lanix, Texa,
Meebox, Spaceit, and Kyoto; and foreign companies such as Dell, Sony, HP, Acer, Compaq,
Samsung, and Lenovo.
The domestic electric appliances industry is also a major focus of manufacturing in Mexico.
This sector has played a large role in Mexico’s electronics industry, whose 2009 exports
represented 30 percent of Mexican non-petroleum exports. In 2010 this sector grew 11.37
percent while generating 35,000 direct and 110,000 indirect jobs. (Mexico Today, 2011)
Thailand
Thailand’s main role in electronics supply chains is in the production of parts, especially data
storage components, as used in smartphones and laptops. As of 2011 the value of electronics
exports was equal to 12.3 percent of Thailand’s GDP.
Foreign direct investment (FDI) by multinational enterprises has been a major driver of
Thailand’s economic growth. The manufacturing sector share in net FDI flows increased
from an average of 31.4 percent during 1980-86 to 53 percent in 2007. (Decharuk, 2009)
Within the manufacturing sector, electronics has consistently received a large share of FDI,
amounting to an estimated 25 percent of total FDI in 2011. (Fernquest, 2012)
Currently Thailand is the world leader in the production of hard disk drives (HDDs), used for
digital storage not only in laptops and smartphones but also in vehicles and others consumer
electronics such as video game consoles. The growth of this industry is still continuing. The
Chapter 1 Overall Characteristics of Global Supply Chain for Electrical and Electronics Industries 17
total export value of HDDs and components in 2007 was approximately USD 14.5 billion.
(Kachainchai, 2010)
As a result of the world’s largest HDD companies (i.e. Seagate, Western Digital, and
Toshiba) concentrating operations in Thailand, many related suppliers also decided to
establish production facilities there, particularly upstream production. By contrast, most
downstream companies involved with the computer industry base their production in the
economy where there is a large volume end user market such as the United States or China.
(Kachainchai, 2010)
Viet Nam
Viet Nam’s main supply chain role is the assembly of FEG such as smartphones, along with
some supporting parts production. As of 2011 the value of electronics exports was equal to
11.2 percent of Viet Nam’s GDP. Multinational electronics companies have become eager
to invest in production facilities in Viet Nam in recent years. One reason for companies to
invest in Viet Nam is to decrease their dependency on China, where labor costs are rising.
Viet Nam’s low labor costs and its large emerging domestic market make it an attractive
alternative.
According to the Dutch sustainable development research non-profit SOMO (Centre for
Research on Multinational Corporations), Viet Nam’s electronic sector remains in a very
early stage, even after two decades of development and government investment incentives
such as tax reductions and cheap land rent (Kakuli and Schipper, 2011). This first stage of
development primarily consists of importing parts and assembling consumer products, which
provides low-value added, and only low-skilled and low-paid jobs. The labor force in the
electronics hardware sector totaled 121,300 workers in 2009, of which 75 percent were
female. Most of the employees in the sector are migrants from the rural provinces. As in
Malaysia, the industry is dominated by foreign companies. In 2008, two thirds of the
economy’s 436 electronics companies were foreign-owned and together accounted for 95
percent of the sector’s total exports.
In the past decade, Viet Nam’s cheap labor and laws restricting negotiations between the
workforce and employers have led to 400-500 strikes annually. In 2010, eight percent of
these strikes were at electronics factories. The workers’ biggest complaint has been that their
salary has not kept pace with rising living costs. In 2011, minimum wage levels varied from
USD 37–69 per month depending on the region. For 2012, the Viet Nam government
increased minimum wage levels to between USD 62–89. (Kakuli and Schipper, 2011)
Indonesia
Indonesia’s main supply chain role is FEG assembly, and also produces some low-value
added components. As of 2011 the value of electronics exports was equal to 1.4 percent of
Indonesia’s GDP. Beginning in the 1980s, the production and export of electronics from
Indonesia grew rapidly, the value of exports increasing from USD 118.3 million in 1985 to
USD 865.5 million in 1992. In 1992, consumer electronics contributed 49 percent of total
production while industrial electronics and components accounted for 29 percent and 22
percent respectively.
The development of the Indonesian consumer electronics industry is linked to the role played
by FDI, particularly from Japan and later Korea. Initially, during the 1970s, Japanese

Chapter 1 Overall Characteristics of Global Supply Chain for Electrical and Electronics Industries 18
electronics firms such as Panasonic, Toshiba, Sanyo and Sharp established joint ventures or
technical cooperation agreements to establish assembly facilities in Indonesia to access the
Indonesian domestic market, protected from imports by tariffs.
In the 1980s the government gradually eased restrictions on foreign ownership, making it
possible to have fully foreign-owned subsidiaries. Under this export-orientated
industrialization strategy, foreign electronics firms, particularly Korean companies such as
Samsung and LG, chose Indonesia as one of their export bases.
Eventually, some domestic investors terminated their technical cooperation agreements with
Japanese and Korean electronics firms, and graduated from supplier roles to become
independent electronics firms. In recent years, the technical cooperation arrangement has
regained its popularity among some global consumer electronics firms, particularly from
China, as a strategy to enter the Indonesian domestic market. Thus some Indonesian
domestic-owned firms have established themselves as subcontractors for Chinese vendors.
The United States and the EU are the main export destinations of consumer electronics from
Indonesia while Singapore, Thailand and Chinese Taipei are the main export destinations for
parts. Singapore plays an important role in Indonesia’s electronics trade by re-exporting
products produced in Indonesia to overseas end markets. (Kadarusman, 2012)
Philippines
The Philippines’ main electronics supply chain role is the production of IEG, notably HDDs
and semiconductors. As of 2011 the value of electronics exports was equal to 6.8 percent of
the Philippines’ GDP.
In 2010, electronics made up 61 percent of the Philippines’ exports, or USD 31 billion of a
total USD 51 billion in exports. (Ernie, 2011) Most electronics were exported to Japan (15
percent), China (13 percent), and the rest of Asia (36 percent), while EU and the United
States imported 22 percent and 14 percent respectively. (Ernie, 2011)
The Philippines has a strong presence in the IEG market for parts such as semiconductors.
According to the industry organization for semiconductor and electronics industries in the
Philippines, the economy supplies 2.5 million HDD per month, and captures 10 percent of
global semiconductor manufacturing. The Philippines has a labor supply of 36 million
workers, with approximately 100,000 engineering and technical graduates per year. (Ernie,
2011)
In 2011, electronics exports from the Philippines fell by 26 percent, which likely reflected the
delayed impact of regional supply-chain distortions after Japan's earthquake. (BBC News,
2011) There was slight growth in 2012, but exports dropped again by 2013. In February
2013, the National Statistics Office reported that shipments of electronics had fallen 36.5
percent from a year earlier to USD 1.48 billion, while overall exports fell by 15.6 percent.
(Wall Street Journal, 2013)
According to an analyst at a regional financial firm, the recent fall was partly caused by a
stronger Philippine Peso, and a baseline of high export earnings in 2012, as well as long-term
weaknesses in the sector that have been worsened by years of under-investment. An
economist with Credit Suisse noted that "many [Association of Southeast Asian Nations]

Chapter 1 Overall Characteristics of Global Supply Chain for Electrical and Electronics Industries 19
countries [are] facing slow growth in their merchandise exports, given the current weakness
in the global economy." (Wall Street Journal, 2013)
The Philippines’ electronics industry is dominated by foreign companies, which made up 72
percent of 936 electronics firms in 2010 (Ernie, 2011). Firms are based mainly in the
northern part of the Philippines, particularly in metro Manila and Calabarzon.
According to SEIPI, the industry organization for Semiconductor and Electronics Industries
in the Philippines, seven of the top 20 chipmakers in the world have facilities based in the
Philippines. These include TIPI, Philips, Fairchild, Analog, Sanyo, On Semi, and Rohm. Four
major Japanese HDD producers (Hitachi, Toshiba, Fujitsu, and NEC) also have facilities in
the Philippines. Cebu Mitsumi, Inc., a manufacturing company focused on computer and
camera parts, employs over 20,000 people and is the largest employer in the Philippines
(Ernie, 2011). Other electric and electronic manufacturers include Amkor Technology,
Epson, and Lexmark. Some domestic suppliers to the electronics industry include IMI,
Ionics, PSI, Fastech, and Team.
The Philippines is encouraging firms to base their design and R&D phases of production
locally. Companies that do some design and development work in the Philippines include
Rohm LSI Design Philippines, Sanyo Semiconductor, Eazic, Symphony, BiTMICRO, TI, and
Fairchild Semicon. (Ernie, 2011)
Due to its strong performance, the electronics industry has been named by the Philippine
government as one of the economy’s export champions, making the industry eligible for
government support and incentives (Chito, 1998). These include tax exemptions and
concessions and the Subic Bay Free Zone, which is considered a special customs territory
where there is free flow of goods and capital equipment (Philippine Board of Investment,
2011).

Chapter 2 Case Studies: Three Electronics Supply Chain Examples 20
CHAPTER 2 CASE STUDIES: THREE ELECTRONICS SUPPLY
CHAIN EXAMPLES
The following case studies provide a step by step breakdown of the supply chain processes
for each product from basic parts manufacture to assembly of final products, providing
background on who performs which activities where.
Smartphones, laptop PCs, and LCD flat panel TVs were chosen for case studies as they
represent three of the top five highest sales volume consumer electronics products around the
world today. Taking the example of the United States, the largest single consumer electronics
market, the United States Consumer Electronics Association (CEA) estimates that
smartphones, laptops, and LCD TVs will be the leading consumer electronics product
categories in terms of sales revenue in 2013, as seen below in Figure 7.14
Figure 7: 2013 US market share forecast for leading consumer electronics products
Source: CEA.
Additionally, these products’ supply chains are deeply rooted in the APEC region. APEC
economy-based companies dominate leading positions in all three markets, particularly
vendors from Korea, China, Japan, Chinese Taipei, and the United States. Although today the
unit sales volume of tablet computers is on a pace to exceed laptops in the near future, the
latter was chosen for the purpose of diversity because the key vendors and suppliers for
tablets are almost identical to those for smartphones.
1. CASE STUDY 1: SMARTPHONES
A. Market background
i. Sales trends
According to International Data Corporation (IDC), the worldwide smartphone market grew
46 percent year over year in 2012, as vendors shipped 722.4 million smartphones for the year
14 Consumer Electronics Association, interview with Washington Core. (February 2013)
20.3%
9.3%
8.2% 62.2%
Smartphones
Laptops
LCD TVs
Other

Chapter 2 Case Studies: Three Electronics Supply Chain Examples 21
compared to 494.5 million units in 2011, partly due to strong growth in the Chinese market.
(IDC, 2012)
Smartphones first became popular with consumers in 2007, when Nokia and Apple
respectively released the very popular N95 and iPhone. Rapid sales growth began when faster
3G networks became widely available around 2008, enabling consumers to take advantage of
more advanced features like streaming video. The current strong smartphone market growth
is expected to start to level off around 2014, because global mobile penetration is quickly
approaching 100 percent of the world population, predicted to reach 95.8 percent, or 6.8
billion out of 7.1 billion, in 2013 (ITU, 2013). The International Telecommunication Union
(ITU) estimates that in 2013, 3.5 billion of these mobile phone subscriptions will be in the
Asia-Pacific region. (ITU, 2013)
There is a notable divergence in sales trends between developed and emerging markets.
Smartphone sales in developed economies are almost entirely branded products from well-
known brands such as Samsung and Apple, while in emerging markets a large percentage of
sales are for low cost white label products from small domestic vendors.15
A lower level of
technical skills is needed to compete in the white label market as the products compete
mainly on price, so the barriers to entry for new firms are low in comparison to the branded
market, in which most leading firms have highly advanced R&D and design capabilities.
The continued strong growth of smartphone sales provides a promising opportunity for
expansion of related parts production operations in the APEC region. The smartphone app
processor market provides a telling example of the upwards sales trend, growing 77 percent
year-over-year in 2010 to reach USD 4.52 billion. (Strategic Analytics, 2011) In addition,
many smartphone parts can be repurposed to use in tablets, so flexible suppliers have the
opportunity to reach these two large and fast-growing markets.
ii. Leading manufacturer trends
Table 3 describes the market share, roles, and recent activities of the top five smartphone
vendors by global unit sales volume at the end of 2012. This list has undergone considerable
change since smartphones first became prevalent in the mid-2000s. Most of the early market
leaders from North America, the EU, and Japan such as Motorola, Blackberry, and Nokia
have faded from the top of the list, unable to keep up with the rapid pace of innovation, with
the very notable exception of Apple and recently rebounding Sony. Otherwise the market is
quickly becoming dominated by Korean and Chinese brands, the former leading in developed
markets and the latter surging in developing markets and beginning to challenge in developed
markets.
15 Ibid.

Chapter 2 Case Studies: Three Electronics Supply Chain Examples 22
Table 3: Worldwide smartphone shipments leaders in 4Q12
Company Market
share
Recent developments
Samsung
29.0%
(63.7
million
units)
Based near Seoul in Korea, in 2012 Samsung set a new record for the
number of smartphones shipped in a single year, benefitting from its broad
and deep line-up of Android smartphones, combined with sustained demand
for its mid-range and entry-level models. 2013 is shaping up to be a pivotal
year for the company shifts its smartphones from Google’s Android
operating system (OS) software to Samsung’s internally developed Tizen
OS, allowing greater independence and product customization.
Additionally, Samsung is a major supplier of smartphone parts used in both
its own smartphones and those of other vendors, so that even when rival
vendors sell competing smartphones, Samsung can still generate revenue
and profits from the parts in those phones.
Apple 21.8%
(47.8
million
units)
Based near San Francisco in the United States, Apple achieved record
iPhone shipments in the 4Q12, driven by successes in the Chinese market,
where shipments more than doubled, as well as strong growth in the United
States. Apple benefits from a mature software application ecosystem driven
by its popular online app store, and equipped with innovative user interface
design capabilities. It is also working to expand the reach of the iPhone
portfolio to the entry-level smartphone market.
Huawei 4.9%
(10.8
million
units)
Based in Shenzhen, China, Huawei and fellow Chinese vendor ZTE have
cost advantages over the established branded vendors like Samsung, and are
benefitting from the recent emergence of entry-level smartphone markets.
Huawei became one of the top three smartphone vendors for the first time in
4Q12, fueled by a dual strategy of simple and inexpensive smartphones for
the mass market and its Ascend-branded product line for the high-end
market.
The company has also developed increasingly more innovative products,
such as the world's thinnest (6.68 mm) smartphone, and is currently working
on the largest smartphone display to date (6.1-inch). At the same time,
Huawei is innovating on the software side with applications including
Magic Touch, which enables extra-sensitive touchscreen control.
Sony 4.5%
(9.8
million
units)
Based in Tokyo, Japan, Sony's strategy for becoming the worldwide leader
in mobile entertainment combined with its growing portfolio of high-end
Xperia smartphones, with the industry’s most powerful cameras, drove its
smartphone volumes higher throughout 2012.
ZTE 4.3%
(9.5
million
units)
Based in Shenzhen, China, ZTE maintained a narrow lead over veteran
competitors such as Nokia, Blackberry, and HTC to remain in the top five in
4Q12, thanks to continued international diversification efforts. ZTE has
recently grown its smartphone sales due to an increase in lower-cost
smartphone sales in many emerging markets. The company has traditionally
relied on sales of phones to its home market of China, but is now making
significant inroads in developed markets as well. Source: IDC (2012), Tsan W. et al (2013, pg 179)

Chapter 2 Case Studies: Three Electronics Supply Chain Examples 23
iii. Key parts and typical costs
Smartphones contain more than two dozen major components of varying complexities and
costs, from state of the art memory chips to their plastic shells. This case study will focus on
a few prominent components in different price ranges to gain a more diverse perspective of
the supply chain participants.
Not surprisingly, the high end parts are dominated by the advanced electronics leaders such
as Korea, Japan, and the United States. In the moderate cost range there is also a strong and
growing presence from Chinese Taipei firms. Somewhat surprisingly, United States
companies are also dominant in some of the low-value categories. This is partly because
these categories overlap with the computer industry, where the United States has always been
very strong, and partly because it is a huge consumer market, which attracts suppliers to
locate close to the end users.
With respect to specific part trends, strong sales of high-end smartphones doubled demand
for flash memory between 2010 and 2011. While Samsung and Toshiba continue to dominate
this market, Chinese Taipei suppliers have traditionally struggled to compete due to
inadequate proprietary research and development capacity for mobile phone memory
Integrate Circuits (IC). Therefore Chinese Taipei IC design houses have been mainly limited
to supplying the entry-level to mid-range mobile phone markets. However some Chinese
Taipei suppliers have begun to make inroads. Powerchip has begun mass producing flash
memory products, leveraging flash technology licensed from Japan’s Renesas. Powerchip is
also producing mobile DRAM licensed from Japan’s Elpida, with Elpida handling sales.
(Tsan et al, 2012, pg 181)
Currently, smartphones mainly use small-and medium-sized TFT-LCD (Thin Film Transistor
Liquid Crystal Display) displays, although AMOLED (Active Matrix Organic Light Emitting
Diode)16
is emerging as a more advanced possible future replacement. Samsung produces 97
percent of AMOLED displays. (Tsan et al, 2012, pg 182)
Qualcomm has easily led the smartphone applications processor market on the strength of its
strong participation in the multiple software ecosystems for popular smartphones and its
broad range of integrated processors. Qualcomm is expected to hold its lead over its
competitors for at least the next few years.
Both Korean and Japanese smartphone vendors have become concerned about Qualcomm’s
dominant position in the supply of app processors and baseband ICs, and are making efforts
to diversify supply sources. Japanese companies such as NTT DoCoMo, NEC, Fujitsu, and
Panasonic are exploring collaboration with Samsung in jointly developing baseband ICs for
3G, while Samsung and LG have also invested heavily in the development of baseband
technology for LTE (4G) communications, jointly holding one-fifth of relevant patents.
Similarly, Samsung, moved to reduce its dependence on Qualcomm baseband ICs by
selecting VIA Telecom of Chinese Taipei to supply CDMA baseband ICs for the Samsung
Droid Charge smartphone, marking a significant achievement for a baseband IC design house
from Chinese Taipei. (Tsan et al, 2012, pg 180-181)
16 AMOLED displays provide very high quality resolution with relatively low power requirements.

Chapter 2 Case Studies: Three Electronics Supply Chain Examples 24
Table 4: Key parts and leading suppliers for smartphones
Cost Part Supplier Headquarters Market share in
2011
High ($20 and
up)
Flash memory Samsung Korea 31
Toshiba Japan 27
SanDisk United States 19
Display Samsung Korea 25
Japan Display Japan 20
LG Display Korea 15
App processor Qualcomm United States 35
Texas Instruments United States 20
Samsung Korea 12
Moderate
($5-$20)
Baseband
Integrated circuit
(IC)
Qualcomm United States 45
MediaTek Chinese Taipei 13
Intel United States 10
Camera module Sharp Japan 10–15
LG Innotek Korea 10–15
Foxconn Chinese Taipei 8–10
Battery Simplo Chinese Taipei 40-50
Dynapak Chinese Taipei 35-40
Low (<$10) Image sensors Omnivision United States 30
Samsung Korea 25
Aptina United States 20
Power management Qualcomm United States 40
TI United States 20
ST Ericsson Switzerland 12
Microphone AAC Tech
Holdings
China 15-20
Knowles United States 15-20
Akustica United States 10-15 Source: Nomura Research (2012).
For the foreseeable future, hardware part costs are expected to continue to drop due to
increased production efficiencies, and therefore smartphone retail prices should also fall as a
result. (Tsan et al, 2012, pg 178) In 2011 manufacturing costs for baseband and apps
processors fell by roughly nine percent, while costs for memory fell roughly 30 percent and
displays nearly 50 percent. (BNP Paribas, pg 20-21)
B. Production trends
i. Overview
In terms of the flow of production in smartphone supply chains, the first step is the extraction
and processing of raw materials, including critical metals. The four key critical metals used in
mobile devices are antimony, beryllium, palladium, and platinum. The concentrations of
these metals in a handful of economies, mostly in APEC as seen in Figure 7 below, as well as
the small number of companies engaged in mining these metals, can make it difficult and
expensive for part suppliers to acquire the materials needed for production, and may compel
them to locate operations in these economies for easier access. (Tsan et al, 2012)

Chapter 2 Case Studies: Three Electronics Supply Chain Examples 25
Figure 8: 2011 worldwide production of the 4 key precious materials used in mobile device manufacturing
Source: United States Geological Survey (accessed on 10 May 2013).
ii. Manufacturing locations
During manufacturing, mobile device components such as batteries, cases, and integrated
circuits are fabricated from processed raw material inputs by upstream component suppliers.
Mobile device manufacturers assemble these components into devices according to
specifications established during the design stage (Tsan et al, 2012). Packaging typically
occurs near the manufacturing location, from where the final products are transported to their
points of sale to consumers.
Figure 9: Locations of smartphone production activities in APEC region
Source: author based on literature.
0
10
20
30
40
50
60
70
80
90
100
Antimony Beryllium Palladium Platinum
%
China
United States
Russia
South Africa

Chapter 2 Case Studies: Three Electronics Supply Chain Examples 26
In general, smartphone vendors tend to keep production of high-end models in-house, while
low-end model production is outsourced to contract manufacturers.17
Figure 8 above
illustrates where smartphone production activities are concentrated in the APEC region.
Economies are ranked relative to one another from low to high based on their involvement in
product R&D, production of low-, medium-, and high-value parts production, and assembly
of final products. Each supply chain step and the economy itself are colored to indicate high
(green), medium (orange), or low (red) involvement.
As the figure indicates, smartphone components are manufactured in a variety of APEC
economies, generally chosen for cheap labor costs with the exception of high end components
like flash memory, which may be produced in places with higher labor costs but greater
technical and automation skills such as Japan and Korea. As mentioned in Chapter 1,
Japanese companies also maintain production facilities for simpler parts such as motors and
bearings in economies such as Thailand and Viet Nam. More than 50 percent of final product
assembly is concentrated in China, with limited operations in a few other economies to
supply domestic customers. Recently Samsung and Nokia have established assembly
facilities in northern Viet Nam, causing Japanese and other parts suppliers to cluster around
them.18
Korea is very strong in the production of high value-added memory and LCD panels, and
most smartphone components are manufactured in Korea. Due to the high value-added nature
of semiconductor manufacturing, Korea has retained the entire supply chain locally and also
manufactures processors for Apple' in domestic factories.
As mentioned in Chapter 1, Chinese Taipei has been moving rapidly to close ground with
Japan and Korea over the last decade. Chinese Taipei’s suppliers initially had difficulty
advancing from the entry-level phones market to the upscale 3G market due to
communications patents and technology limitations. To gain access to state of the art
baseband ICs, in 2009 IC design house MediaTek of Chinese Taipei entered into a WCDMA
(Wideband Code Division Multiple Access) patent agreement with Qualcomm. The
agreement exempts MediaTek from paying up front fees and royalty fees, although
MediaTek's customers must still pay for the use of Qualcomm's patents and technologies.
MediaTek now supplies an integrated application processor and baseband IC solution for
Chinese vendor Lenovo’s smartphones, and as mentioned supplies baseband ICs to Samsung
along with fellow leading domestic firm VIA Telecom (Tsan et al, 2012).
17 Japanese smartphone vendor. Interview with Washington Core. (April 2013) 18 Japan Ministry of Economy, Trade and Industry, interview with Washington Core. (February 2013)
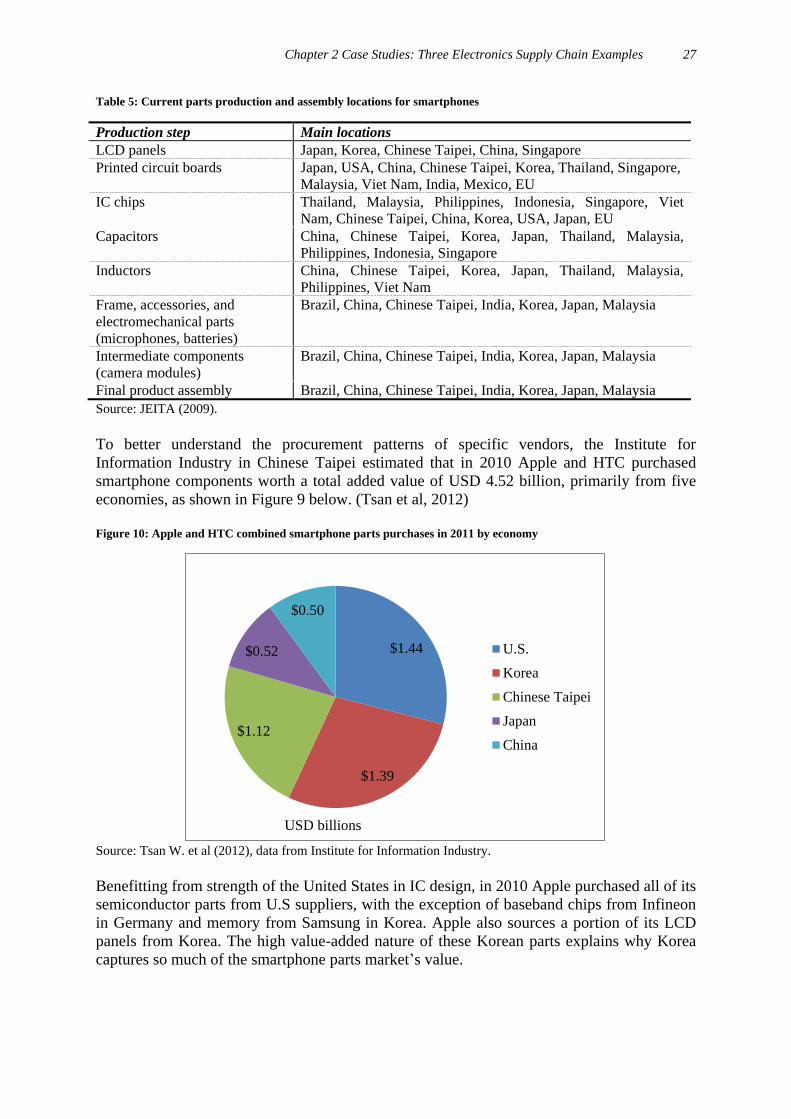
Chapter 2 Case Studies: Three Electronics Supply Chain Examples 27
Table 5: Current parts production and assembly locations for smartphones
Production step Main locations
LCD panels Japan, Korea, Chinese Taipei, China, Singapore
Printed circuit boards Japan, USA, China, Chinese Taipei, Korea, Thailand, Singapore,
Malaysia, Viet Nam, India, Mexico, EU
IC chips Thailand, Malaysia, Philippines, Indonesia, Singapore, Viet
Nam, Chinese Taipei, China, Korea, USA, Japan, EU
Capacitors China, Chinese Taipei, Korea, Japan, Thailand, Malaysia,
Philippines, Indonesia, Singapore
Inductors China, Chinese Taipei, Korea, Japan, Thailand, Malaysia,
Philippines, Viet Nam
Frame, accessories, and
electromechanical parts
(microphones, batteries)
Brazil, China, Chinese Taipei, India, Korea, Japan, Malaysia
Intermediate components
(camera modules)
Brazil, China, Chinese Taipei, India, Korea, Japan, Malaysia
Final product assembly Brazil, China, Chinese Taipei, India, Korea, Japan, Malaysia
Source: JEITA (2009).
To better understand the procurement patterns of specific vendors, the Institute for
Information Industry in Chinese Taipei estimated that in 2010 Apple and HTC purchased
smartphone components worth a total added value of USD 4.52 billion, primarily from five
economies, as shown in Figure 9 below. (Tsan et al, 2012)
Figure 10: Apple and HTC combined smartphone parts purchases in 2011 by economy
Source: Tsan W. et al (2012), data from Institute for Information Industry.
Benefitting from strength of the United States in IC design, in 2010 Apple purchased all of its
semiconductor parts from U.S suppliers, with the exception of baseband chips from Infineon
in Germany and memory from Samsung in Korea. Apple also sources a portion of its LCD
panels from Korea. The high value-added nature of these Korean parts explains why Korea
captures so much of the smartphone parts market’s value.
$1.44
$1.39
$1.12
$0.52
$0.50
U.S.
Korea
Chinese Taipei
Japan
China
USD billions

Chapter 2 Case Studies: Three Electronics Supply Chain Examples 28
Chinese Taipei is a major supplier of low-value passive components19
- resistors, inductors
and capacitors - to both Apple and HTC. Japan is also a major source of passive components,
but has control over critical materials and more advanced technologies, allowing it to produce
high end components that command a much higher price. Apple and HTC also procure LCD
display panels from Japan.
A more recent participant in these supply chains, China’s main role is final product assembly,
although those massive assembly facilities have drawn some parts production to China as
well, and of course Huawei and ZTE have quickly grown to join the list of the top five global
smartphone vendors. The other leading vendors such as Samsung and especially Apple have
large assembly operations in China. Apple’s heavy reliance on contractor Foxconn’s massive
China assembly operations has been the focus of much international media coverage, often
expressing admiration at the scale and smooth functioning of Apple’s iPhone and iPad tablet
production, although occasionally expressing concern about conditions for workers at these
facilities, which have received some scrutiny from human rights groups.
C. Leading manufacturer supply chain details
i. Overview and total costs
The following section provides some representative examples of leading smartphone vendor
supply chains structures and costs, profiles of some leading suppliers, major production
locations, and analysis of product value captured by different supply chain participants.
Samsung and Nokia smartphones were chosen to provide examples of a supply chain with
very high vertical integration of parts production (Samsung) and one mostly reliant on third
party suppliers (Nokia).
This discussion is generally focused on mid- or high-end branded smartphone products, of
which the majority is destined for consumers in developed economies. In rapidly developing
economies such as China and Viet Nam, there are also growing markets for entry-level and
often white label smartphones, but according to the United States Consumer Electronics
Association, market data is not readily available on these products.
Samsung supply chain example
As the market leading smartphone vendor and also a leading high-value IEG supplier,
Samsung’s provides an interesting example of a high volume smartphone supply chain with
high vertical integration. The supply chain of the Samsung S4 Galaxy Phone (launched in
March 2013) follows the process created in previous iterations of the Samsung Galaxy, in
which Samsung controls the production of several key parts. (Raymond, 2012)
Samsung makes extensive use of its own internally manufactured parts in all of its phones,
including the Galaxy S4, as indicated in Tables 6 and 7 below. Samsung supplied the Galaxy
S4’s display and touch-screen module, as well as the apps processor and power management
integrated circuit. Samsung also is the primary supplier of the DRAM and flash memory,
although the company could employ alternative sources for these commodity parts. In total,
Samsung accounts for at least USD 149 worth of component content in the 3G network
19 Passive electronic components consume but do not produce energy.

Chapter 2 Case Studies: Three Electronics Supply Chain Examples 29
version of the Galaxy S4, representing 63 percent of the total Bill of Materials (BOM). (HIS
iSupply a, 2013)
According to analysis by one global supply chain management expert, Samsung’s largely
vertically integrated supply chain has served that company well in its ability to continuously
refresh innovation in products, quickly ramp products to enormous global wide volumes and
deal with multiple global channel partners (Bob, 2013). In addition, vertical integration
provides more control of part design and costs. (Strategy Analytics, 2012)
The general consensus among analysts in Korea is that strong Galaxy S4 sales will drive
demand for Samsung's parts businesses. Galaxy production will support processors, memory
and Samsung's AMOLED next generation display business, which is 85 percent owned by
Samsung Display (Larry, 2013). It is interesting to note that as a specialized supplier of
electronic parts, about a third of Samsung’s revenue “comes from companies that compete
with it in producing the TVs, cellphones, computers, printers and cameras where it gets the
rest of its money.” (Wall Street Journal, 2009)
Another strength of Samsung’s supply chain is its strategy to focus on one handset for its
flagship phone rather than offer multiple handset models as competitors such as HTC have
done. With one phone model, Samsung benefits from economies of scale and use of common
parts. (Business Week, 2012)

Chapter 2 Case Studies: Three Electronics Supply Chain Examples 30
Table 6: Samsung Galaxy S4 primary parts suppliers
Components Technologies Suppliers
OS Android 4.2 Jelly Bean Google Inc.
Application
Processor
Exynos Octa 2.0GHz Samsung Electronics Co., Ltd.
Samsung Electro-mechanics
Baseband
Processor
4G LTE Connectivity Samsung Electronics Co., Ltd.
QUALCOMM Incorporated
MediaTek
VIA Telecom
Display 5.0" 1080p Full HD Super AMOLED+ Samsung Display Co. , Ltd.
OLED Material Duksan Hi-Metal Co., Ltd.
CS Corp.
Thin Glass Soulbrain Co., Ltd.
Chemtronics Co, Ltd.
Touchscreen Module Samsung Electronics Co., Ltd.
Touch IC Synaptics (USA)
DRAM 2 GB LPDDR3 Samsung Electronics Co ., Ltd.
NAND 16/ 32/64 GB NAND Samsung Electronics Co. , Ltd.
Battery 3,100mAh Samsung SDI Co., Ltd.
Camera 13 MP Rear Samsung Electro-mechanics
Samsung Electronics Co ., Ltd.
2MP Front Partron Co ., Ltd.
Camera Lens Digitaloptics co, Ltd.
Sekonix co., Ltd.
Kolen Co., Ltd.
Filter Lens Optrontec Inc.
NANOS Co, Ltd.
AF Actuator Jahwa Electronics Co., Ltd.
IM Ltd.
Case External Case Intops Co., Ltd.
Shinyang Co., Ltd.
CrucialEms Co., Ltd.
Mobase Co., Ltd.
Housing Internal Frame KHVatec Vp. Ltd.
U-ONE COMTECH Corp.
Antenna Antenna Partron Co ., Ltd.
PCBs FPCB BH Co., Ltd.
INTERFLEX Co., Ltd.
FLEXCOM INC.
Daeduck GDSCo., Ltd.
INNOX Corporation
PCBs PCBs Samsung Electro-mechanics
Daeduck Electronics Co., Ltd.
Korea Circuit Co., Ltd.
Passive
Components
Connectors UJU ELECTRONICS
MLCC Samsung Electro-mechanics
RF RF Modules Partron Co., Ltd.
Saw filter WISOL
SW Mobile Office Infraware
Charging Wireless Charger (Option) RFTech Co., Ltd.
Apps 5 Health Infopia Co., Ltd.
Source: iTiers News (2013).

Chapter 2 Case Studies: Three Electronics Supply Chain Examples 31
Table 7: Samsung Galaxy S4 estimated part and manufacturing costs
Samsung
Galaxy S4 (H5PA Version)
Samsung
Galaxy S3 (H5PA Version)
Total BOM Cost $236 $205
Manufacturing Cost $8.50 $8.00
BOM+Manufacturing $244 $213
Major Cost Drivers
Memory (NAND
Flash. DRAM)
16GB eMMC +
2GB LPDDR3
$28.00 16GB eMMC + 1GB
LPDDR2
$29.00
Display &
Touchscreen
5" 1920x1 080 Super AI.IOLED
(441ppi), w/ Gorilla®Glass3
by Corning
$75.00 4.8" 1280x 720 Super
A MOLED, w/
Gorilla®Glass2
by' Corning
$65.00
Processor Samsung Exynos 5 Octa (5410) $30.00 Samsung Exynos 4 Quad $17.50
Camera(s) 13MP+2MP $20.00 8MP+1.9MP $19.00
Wireless Section -
BBIRF/PA
Possibly contains Intel
PMB9820 + PMB5745 +
Front End
$16.00 Contains Intel PMB9811
+
PMB5712 +
Front End
$14.50
User Interface &
Sensors
Contains accelerometer, RGB
Light, e- compass, Gyro,
Barometer, Temperature &
Humidity, IR Gesture
$16.00 Contains Capella
CM3663 ALS /
Proximity, ST
LSM330DLC
Accelerometer / Gyro,
AKM AK8975C
e-Compass & ST
LP331AP Barometer
Sensors
$12.70
WLAN / BT / FM /
GPS
Possibly contains Broadcom
BCM4335+
BCM47521
$9.00 Contains Broadcom
BCM4334 + BCM47 11
$8.20
Power Management Samsung PMIC (TBD) $8.00 Contains Maxim PMIC $7.00
Battery 3.8V, 2600mAh
w/ NFC Antenna (TBD)
$5.60 3.8V, 2100mAh
w/ NFC Antenna
$4.90
Mechanical / Electro-
Mechanical
NA $22.00 NA $21.40
Box Contents NA $6.00 NA $6.00
Source: IHS iSuppli Research (2013).
Nokia supply chain example
The supply chain of the Nokia N95, one of the first widely popular smartphones at the time of
its launch in 2007, provides an example of a supply chain with a lower degree of vertical
integration. The participants in the N95 supply chain can be categorized into four groups:
mines and refiners, component suppliers and sub-assemblers, software and technology
providers and licensors, and final assembly by Nokia. In 2007, Nokia conducted 80 percent
of the assembly of all its phones internally (US Security and Exchange Commission, pg. 36).
In the case of N95, all final assembly was done by Nokia itself, similar to Samsung.
In the first step, the raw outputs of miners/refiners are turned to sheets of metal and other
elementary processed goods that are traded to parts suppliers. They in turn deliver to sub-
assemblers (which may in turn deliver to other sub-assemblers) which supply Nokia for the
final product assembly. Standalone software is acquired as necessary. Depending on the

Chapter 2 Case Studies: Three Electronics Supply Chain Examples 32
market, Nokia’s end customers are typically distributors – who in turn supply wholesalers
and retailers – or telecommunications carriers. (Ali-Yrkko, 2011)
Nokia’s final assembly process consists of two steps:
Engine – This step involves all aspects core hardware and software of the phone that
do not vary by order, also known as the engine.
Assembly-to-order – This step finalizes the configuration of the engine, adding
varying customer-specific elements ranging from the choice of languages to adding a
carrier’s logo
Nokia considers this two-stage assembly process as one of its key competitive advantages
within the industry, enabling it to deliver customized phones from initial order to final
delivery within 48 hours. (Ali-Yrkko, 2011)
Typical costs for the components of the Nokia N95 are listed in Table 8. The N95’s bill-of-
materials - the direct components, parts, sub-assemblies, software, and licenses of the phone -
amounted to about USD 260 in 2007. However, since Nokia is a major holder of intellectual
property rights (IPRs) in the GSM/WCDMA cellular communication standards, it is exempt
from paying some licensing fees that other manufacturers may be subject to (Ali-Yrkko,
2001). Furthermore, cross-licensing is quite common within the industry, in which case fees
paid may not reflect the full value of the intellectual property (IP) used in production.
Licensing fees aside, the most costly components of the phone were processors and other
integrated circuits as well as the display. (Ali-Yrkko, 2011)

Chapter 2 Case Studies: Three Electronics Supply Chain Examples 33
Table 8: Nokia N95 Bill of Materials as of 2007
Part/license Cost ($) % of total cost
Processors 44.73 17.3
Display 28.17 10.9
Main camera module (5 MP) 21.52 8.3
Memory 18.91 7.3
Battery 3.91 1.5
Video conference camera (VGA) 1.56 0.6
Other integrated circuits (excl. processors and memories) 41.08 15.9
Mechanics 24.38 9.4
All other hardware inputs 27.51 10.6
BOM (excl. supporting material, license fees and final assembly) 211.74 81.8
Supporting material 20.21 7.8
BOM (excl. license fees and final assembly) 231.94 89.6
GSM/WCDMA license fees 17.60 6.8
Symbian OS 3.91 1.5
Other license fees 5.48 2.1
BOM (excluding final assembly) 258.94 100
Source: ETLA from Ali-Yrkko (2011).
ii. Key suppliers for 3 key parts
a. High-value: Samsung (Flash, display, apps processor)
Samsung Group is the largest industrial group or Chaebol in Korea. Samsung Electronics is
the largest subsidiary with a 2011 Korean consolidated income of USD 128 billion. The
company has recently emerged as a world leader in production of DRAM chips, liquid-crystal
display screens and smartphones.
Components are sourced from existing Samsung plants or affiliates and will only be sourced
from external partners if they are not available through this route. External partners will
normally be existing accredited partners with a proven track record. Samsung handles its
logistics in Asia for components through three key centers in Tianjin, Shanghai and Hong
Kong, China.
As mobile phones have relatively high labor intensive content, increasingly the final
assembly is taking place overseas, with Viet Nam being the fastest growing location,
followed by China and Gumi in Korea. China is still seen as the future of all Samsung major
component manufacturing and the company has about 30 subsidiaries there, but Samsung
will continue to develop its Viet Nam factory capacity and output as Chinese labor costs rise.
No outsourcing of assembly takes place as far as is known.
R&D and design for smartphones takes place in multiple R&D centers, with the solution
divisions in Korea preparing products for external customers like Apple, and for its internal
customers in Samsung. For example, the iPhone, Nokia N95 (Ali-Yrkko, 2011), and
Blackberry all have used displays and/or flash memory chips from Samsung (Davies, 2013).
In 2012 Samsung announced it would open a new software center in Korea and a new media
center looking for content and apps in the United States Silicon Valley. (Korea Associates
Business Consultancy Ltd, 2012)

Chapter 2 Case Studies: Three Electronics Supply Chain Examples 34
b. Moderate cost: MediaTek (baseband)
Basebands control the communications between a smartphone and the telecom carriers’ base
stations. In recent years leading baseband suppliers such as MediaTek of Chinese Taipei and
market leader Qualcomm have been increasing their value-add by integrating and providing
other key parts, such as the radio transceiver, and applications and graphics processor.
Baseband vendors now commonly provide tools, testing and help with carrier certification,
creating a platform around the baseband product.
Before Qualcomm entered the market, much of the software used in basebands was written
by the mobile phone vendors, requiring considerable engineering expertise and expense. By
taking on these services, Qualcomm developed strong appeal for smartphone vendors and
was able to leverage this strategy to become the baseband market leader.
At the same time MediaTek has been growing quickly, and become a formidable competitor
to Qualcomm. In its early days, MediaTek sold chips for DVD players and optical drives for
many years to low-margin assemblers of PCs and other electronics. Eventually the company
realized that their customers typically had very limited engineering talent in house, limited to
simple assembly tasks such as putting chips on a board. These companies relied on their chip
suppliers to provide basic software like device drivers and user interfaces.
So like Qualcomm, MediaTek created a complete package, known as a “reference design”,
which provided their chip along with the design instructions needed to build a smartphone.
MediaTek also added device drivers and software options to provide their small customers
some ability to customize phones. In so doing, MediaTek inadvertently helped establish a
market for small assemblers in China to become vendors and sell basic white label phones to
the domestic market. Other suppliers have since followed MediaTek’s lead, including
Shanghai-based Spreadtrum and RDA Micro. MediaTek’s global reach has been growing,
and MediaTek-powered phones are now common in the EU and gaining adoption in the
United States.
So far MediaTek’s strategy seems to be highly successful, and the company went from
shipping 10 million reference designs in 2011 to 110 million in 2012, with 200 million
projected for 2013. Current customers include Motorola (Rassweiler) and a large number of
small white label vendors. It was reported in April 2013 that MediaTek had received orders
from additional top vendors including Huawei, ZTE, and Sony (Shen, 2013). This is a
welcome development for MediaTek, as there has been some media speculation that other
leading smartphone vendors might follow Apple’s lead and start building their own chips,
which would pose a significant challenge for MediaTek’s future growth. (Goldberg, 2013)
MediaTek has substantial R&D operations in Singapore. In 2011 MediaTek doubled the size
of its Singapore IC design team to 200 employees. (Singapore Economic Development
Board)
c. Low-value: Murata (capacitors, combo chips)
Japan’s Murata Manufacturing Co. leads the global passive components market, followed by
SEMCO (Samsung Electro-Mechanics Corporation), and Japan’s Taiyo Yuden Co. Passive
components can be divided into resistors, inductors and capacitors, with capacitors

Chapter 2 Case Studies: Three Electronics Supply Chain Examples 35
accounting for the largest share of the global passive component industry by value. Murata
customers include Apple, Samsung (Seth, 2012), and Nokia. (Negishi and Hamada, 2011)
MLCC (Multi-layer Ceramic Capacitor) is the current mainstream capacitor, with a 40
percent market share by total shipment value. The number of capacitors used in a smartphone
ranges between 400 and 500 units. This large number of capacitors required, combined with
market pressures to produce increasingly compact and lightweight devices, has prompted the
development of MLCCs that can provide large storage capacity in a small footprint. Murata
has led the market in delivering the smallest, most advanced MLCCs available.
The global financial crisis left Murata and other Japanese manufacturers reluctant to expand
production. However, resumed growth for demand for smartphones increased demand for
passive components by over 15 percent year on year in 2011. To cost effectively respond to
this demand, and to better distribute risks from natural disasters, Murata has moved an
increasing share of production to China since 2010.
Unfortunately for Murata, SEMCO and Chinese Taipei suppliers are gradually narrowing
Murata’s technology lead. SEMCO's production capacity grew 150 percent between 2007 and
2011, and it has begun to compete on price in order to build market share. Chinese Taipei
passive components manufacturers are already capable of providing entry-level and mid-
range standard MLCCs, and are expanding production in China to supplement MLCC
production lines in Chinese Taipei. (Tsan et al, 2012)
iii. Location of supply chain activities by function
Most part production and R&D for smartphones is concentrated in developed APEC
economies such as Korea, Japan, Chinese Taipei, and Singapore, with final assembly
concentrated in China. Whereas Japanese suppliers was once completely dominant in
production of high value parts, in recent years Korean and later Chinese Taipei suppliers have
gradually developed to become strong competitors. Table 9 below lists some examples of
significant suppliers of key parts. As noted in the following text about Nokia’s supply chain,
far more value is captured by an economy which conducts the R&D and design than an
economy which conducts only assembly.
Table 9: Smartphone supply chain activities by location
Activity Supplier (s) Part (s) Economy (s)
R&D ST Kinetics and STL
Energy Technology
Batteries Singapore
High-value part
production
Samsung Flash memory chips
and apps processor
Korea
Intel and Micron Flash memory chips Singapore
Medium-value part
production
Infineon Baseband IC Chinese Taipei
Sony Lithium batteries Singapore
Low-value part
production
Murata Combo chips Chinese Taipei,
Japan
Capacitors China, Japan
Final product
Assembly
Foxconn Smartphones (for
Apple, others)
China
Source: author based on literature.

Chapter 2 Case Studies: Three Electronics Supply Chain Examples 36
iv. Value captured by location
Added value is a useful tool for assessing the contribution of the electronics industry to the
economic growth of APEC economies. For each economy participating in the global
smartphone components industry, the value created locally after the purchase of raw
materials makes a real contribution to its economy. The continued strong growth of the
smartphone market enables an economy to create more economic benefits for itself by
promoting related high added-value industries. (Tsan et al, 2012)
Not all economies participating in electronics supply chains benefit equally. A study by
ETLA (Research Institute of the Finnish Economy) of the supply chain of one of the early
smartphone megasellers, the Nokia N95, revealed that third party parts suppliers captured
about 11 percent of the value of the final USD 804 retail price of the N95, while Nokia’s own
internal suppliers captured about 19 percent (Ali-Yrkko,2012). ETLA estimates that over the
N95’s life cycle 51 percent of the value added was captured by Nokia and EU economies,
particularly Finland, even though final assembly occurred in China and most of final sales in
the United States.
The EU was able to capture so much of the value from its seemingly supporting role because
Nokia in Finland and other EU economies was dominant in the branding, development,
design, and management for the N95. Final assembly on the other hand accounted for only
two percent of the overall value added. (Ali-Yrkko, 2012)
Samsung, the current smartphone leader, captures an even higher percentage of value in its
supply chains owing to the fact that it produces many of the key high value parts internally.
In the case of the current flagship smartphone, the Samsung Galaxy S4, based on information
provided by the teardown analyses in Tables 6 and 7 and Samsung’s 2012 annual report,
Samsung captures about 64.3 percent of the retail price of USD 68420
, while its internal
suppliers capture about 19.7 percent, and third party suppliers capture about 14.8 percent.
Final product assembly, which accounts for about 1.2 percent of the retail price, is conducted
at Samsung’s own facilities: 20 percent located in Korea, and the remaining 80 percent
evenly split between China and Viet Nam.
By economy the value capture of the final retail phone price is roughly 97.5% Korea, 3.7%
United States, 2.1% China, and 0.4% Viet Nam. Due to rising labor costs in China, Samsung
has aggressively expanding operation in Viet Nam over the last few years, and therefore Viet
Nam’s share is likely to grow at the expense of China.
The case of the also highly popular Apple iPhone is similar. According to estimates by
researchers at the University of California, Irvine, as of 2011 Apple was capturing
approximately 58 percent of the final sales price of the iPhone 4, a far greater share than any
other firms in its supply chain.
The next biggest beneficiaries in iPhone supply chains are Korean suppliers such as LG and
Samsung, who provide the high-value display and memory chips, and whose gross profits
account for 5 percent of the sales price for the iPhone. United States, Japanese and Chinese
Taipei suppliers capture 1-2 percent each.
20 Ibid.

Chapter 2 Case Studies: Three Electronics Supply Chain Examples 37
The main financial benefit to China is derived from wages paid for the assembly of the
product or for manufacturing of some of the inputs. Many parts, such as batteries and
touchscreens, receive their final processing in China in factories owned by foreign firms. The
University of California, Irvine study estimated that USD 10 or less in direct labor wages that
go into an iPhone, which retails for around USD 500 in the United States,21
are paid to
workers in China. (Kenneth et al, 2011)
Seeking to capture a greater share of supply chain revenues, the Chinese government is
currently pursuing a long-term strategy to shift toward performing more product design
functions. This initiative is discussed further in Chapter 5.
2. CASE STUDY 2: LAPTOPS
A. Market background
i. Sales trends
According to IDC, worldwide laptop PC shipments fell 3.4 percent year on year in 2012, as
vendors shipped only 202 million laptops for the year compared to 209.1 million units in
2011.(IDC) This decline can be partly attributed to the rapid rise in the popularity of highly
functional and more portable smartphones and tablets, (Gartner, 2012) which grew by 46.1
percent and 78.4 percent respectively in 2012, and for many young and emerging economy
users are increasingly replacing laptops as the gateway computing device. Smartphone
shipments are already more than triple the total for laptops, and tablet shipments should also
surpass laptops in a few years. (IDC)
The first significant laptop sales began in the early 1990s, and by 2000 it was a major market
with over 28 million units sold worldwide. Sales grew at a rapid pace as more and more users
sought to access the Internet. By 2010 sales reached 170 million units, but this same year
Apple introduced its bestselling iPad tablet. As noted, since then the dramatic growth in PC
sales has been focused on tablets.
According to the United States Consumer Electronics Association, unit sales of laptops in the
United States should recover from the 2012 slide and experience very slight growth in 2013.
Similar to smartphone trends discussed earlier in this chapter, the product sales mix in the
United States and other developed economies differs somewhat from developing economies
in that there is a much higher percentage of exclusive branded products, such as HP or
Lenovo, as opposed to white-label products.22
Morgan Stanley forecasts global laptop sales to
remain nearly flat for the near future, rising from 209 million units sold in 2011 to an
estimated 219 million in 2015. (Morgan Stanley, 2012, pg. 29)
21 According to Amazon.com as of May 23, 2013. 22 Consumer Electronics Association. Interview with Washington Core. (February 2013)
Note: White-label products are generally low-cost and generally non-differentiated basic products
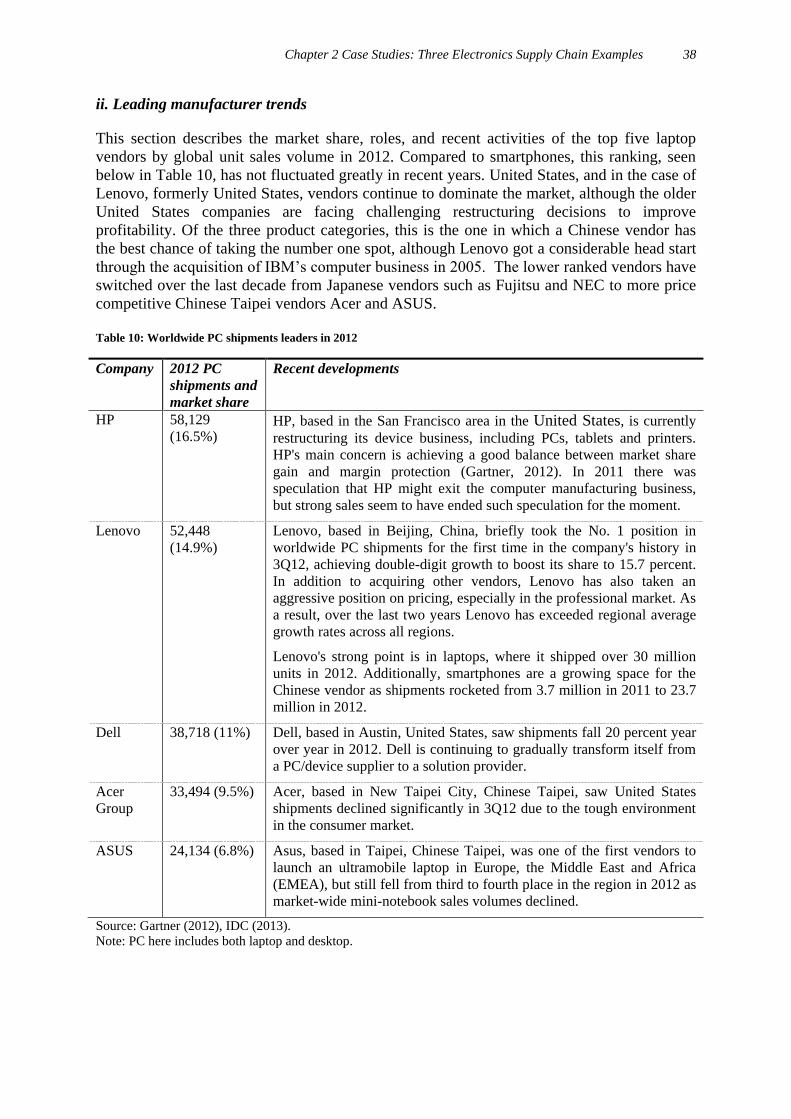
Chapter 2 Case Studies: Three Electronics Supply Chain Examples 38
ii. Leading manufacturer trends
This section describes the market share, roles, and recent activities of the top five laptop
vendors by global unit sales volume in 2012. Compared to smartphones, this ranking, seen
below in Table 10, has not fluctuated greatly in recent years. United States, and in the case of
Lenovo, formerly United States, vendors continue to dominate the market, although the older
United States companies are facing challenging restructuring decisions to improve
profitability. Of the three product categories, this is the one in which a Chinese vendor has
the best chance of taking the number one spot, although Lenovo got a considerable head start
through the acquisition of IBM’s computer business in 2005. The lower ranked vendors have
switched over the last decade from Japanese vendors such as Fujitsu and NEC to more price
competitive Chinese Taipei vendors Acer and ASUS.
Table 10: Worldwide PC shipments leaders in 2012
Company 2012 PC
shipments and
market share
Recent developments
HP 58,129
(16.5%) HP, based in the San Francisco area in the United States, is currently
restructuring its device business, including PCs, tablets and printers.
HP's main concern is achieving a good balance between market share
gain and margin protection (Gartner, 2012). In 2011 there was
speculation that HP might exit the computer manufacturing business,
but strong sales seem to have ended such speculation for the moment.
Lenovo 52,448
(14.9%)
Lenovo, based in Beijing, China, briefly took the No. 1 position in
worldwide PC shipments for the first time in the company's history in
3Q12, achieving double-digit growth to boost its share to 15.7 percent.
In addition to acquiring other vendors, Lenovo has also taken an
aggressive position on pricing, especially in the professional market. As
a result, over the last two years Lenovo has exceeded regional average
growth rates across all regions.
Lenovo's strong point is in laptops, where it shipped over 30 million
units in 2012. Additionally, smartphones are a growing space for the
Chinese vendor as shipments rocketed from 3.7 million in 2011 to 23.7
million in 2012.
Dell 38,718 (11%) Dell, based in Austin, United States, saw shipments fall 20 percent year
over year in 2012. Dell is continuing to gradually transform itself from
a PC/device supplier to a solution provider.
Acer
Group
33,494 (9.5%) Acer, based in New Taipei City, Chinese Taipei, saw United States
shipments declined significantly in 3Q12 due to the tough environment
in the consumer market.
ASUS 24,134 (6.8%) Asus, based in Taipei, Chinese Taipei, was one of the first vendors to
launch an ultramobile laptop in Europe, the Middle East and Africa
(EMEA), but still fell from third to fourth place in the region in 2012 as
market-wide mini-notebook sales volumes declined.
Source: Gartner (2012), IDC (2013).
Note: PC here includes both laptop and desktop.

Chapter 2 Case Studies: Three Electronics Supply Chain Examples 39
iii. Key parts and typical costs23
The following table provides a breakdown of key laptop parts by price range, along with their
approximate share of the total factory cost of a typical laptop. As seen here, high end
components have been dominated by Japanese suppliers, although recently Korean
companies and for some parts Chinese Taipei suppliers are highly competitive. At the other
end of the scale, Japanese and United States suppliers also have strong presences for
comparatively simple, low-value parts.
Table 11: Key parts for laptops
Approximate
cost
Part Supplier Headquarters Approximate % of
total laptop cost
High ($50 -
$200)
Main chipset + Wi-Fi Intel United States 24%
Display Module Toshiba Japan 16%
Hard Disk Drive Fujitsu
Japan 7.9% Hitachi
Moderate
($20-$50)
Battery Sony Japan 4.7%
Simplo Chinese Taipei
DVD drive Matsushita Japan 4.6%
Hitachi-LG Japan/Korea
Memory board Samsung Korea 3.4%
Hynix
Low ($1 -
$20)
Synchronous dynamic
random-access memory
(SDRAM)
Hynix Korea
0.6% Elpida Japan
Power supply controller Texas
Instruments United States
0.4%
Toshiba Japan
I/O controller Broadcom
United States 0.2% Standard
Microystem
(SMSC)
Source: Personal Computing Industry Center, University of California Irvine (2008).
B. Production trends
i. Overview
In the 1990s, PC supply chains began to become much more globally diversified as strong
consumer demand exceeded the capacity of existing PC supply chains in the United States,
Japan, and Europe. Numerous PC companies opted to invest in overseas facilities and
outsource certain activities to contract manufacturers (CMs) based in the APEC region. By
the mid-1990s the majority of PC companies began outsourcing the production of key
components to CMs. (Qasim, 2011)
Emerging economies, such as Mexico, increased their stake in the industry, but the largest
growth in total global share of hardware production occurred in East Asia (in particular in
Singapore, Chinese Taipei, China, Thailand, Korea, and Malaysia) from three percent in 1985
23 J.P. Morgan (2009).

Chapter 2 Case Studies: Three Electronics Supply Chain Examples 40
to 28.9 percent in 2000. Consequently, Japan experienced a sharp drop in the global share of
the hardware industry from 29.2 percent in 1990 to 16.3 percent by 2000. In the 2000s China
grew to become the largest exporter of ICT goods, as a result of FDI and outsourcing.
Nevertheless, China’s production remains closely linked to neighboring economies such as
Singapore, Malaysia, Korea, and Japan. As PC companies proliferated in number, the
increase in competition contributed to a drop in the costs of components. (Qasim, 2011)
By the 1980s, the new direction of liberal economic policies in Southeast Asia fostered
greater trade, resulting in a significant increase in FDI towards China and economies of the
ASEAN. The global economic climate facilitated investments in the region, with Singapore
being one of the first Southeast Asian economies to take advantage of liberalization in FDI
flows. These policies attracted FDI in high-tech industries in East Asia through reduced costs
for manufacturing firms and the elimination of trade barriers for intermediate goods.
Singapore reinvested in infrastructure to encourage design and R&D, while its port increased
customs efficiency to facilitate supply chain movement of intermediate products. Following
Singapore’s path, Malaysia streamlined the foreign investment approval process, and created
tax incentives for design and R&D. Similar approaches were taken by Thailand, the
Philippines, and in the late 1990s by China. Consequently, FDI in computer manufacturing
increased significantly in the late 1990s.
With the influx of foreign companies, East Asian economies initiated a new policy direction
in the 1990s to help develop local companies, diversify part production, and promote skill
development. In Thailand, the Board of Investment created a program in 1992 to form
linkages between multinational companies (MNCs) and local companies. In addition, the BOI
created incentives for projects affiliated with the National Science and Technology
Development Agency to help develop Thailand’s R&D capabilities. In 1993, Malaysia
initiated the Vendor Development Program where local and multinational companies provide
assistance to local vendors. In 1999, the Global Supplier Program was created to help enable
local subcontractors of MNCs to be part of the international supply market. By the mid-
1990s, China began to prioritize development in the PC industry, with the formation of the
Ninth Five-Year National Development Plan. This created greater opportunities for FDI, and
joint ventures to developing domestic PC production.
Market liberalization policies also changed supply chain patterns in Latin America. With a
quick transition to free markets, Mexico experienced a rapid development in export
industries, and a sudden rise in contract manufacturing. Today the PC industry landscape in
Mexico remains heavily dominated by United States companies, although a number of Asian
firms are also present. (Qasim, 2011)
ii. Manufacturing locations
Figure 10 and Table 12 below illustrates the major locations for laptop supply chain
production operations. As with smartphones, laptop assembly is concentrated in China with
parts produced in various nearby economies, shifting increasingly from developed economies
such as Japan, Korea, Chinese Taipei and Singapore to lower cost economies such as China
and Thailand.

Chapter 2 Case Studies: Three Electronics Supply Chain Examples 41
Figure 11: Locations for laptop production activities in the APEC region
Source: author based on literatures and interviews.
Table 12: Current parts production and assembly locations for laptops
Production step Main locations
LCD panels China, Chinese Taipei, Singapore
Hard disk drives Thailand, Singapore
Final product assembly China, Mexico Source: Lemon S. (2010), interview with Ministry of Economy Trade and Industry, Japan (2013).
A 2010 survey of electronics firms conducted by the University of California noted primary
reasons for outsourcing new product development include increased revenue, and cost and
availability of labor. These factors are common to East Asia contributing to the growth in
laptop and desktop PC FDI in the region. Similarly, proximity to customers has played a
significant role in the PC industry outsourcing activities to Mexico.(Qasim, 2011)
ASEAN economies’ ascension to WTO membership increased regional competition and the
movement of PC assembly and manufacturing firms within the region, creating more
international opportunities for PC global production networks (GPN). (Thorbecke, 2012)
Parts of semiconductor devices accounted for 59 percent of ASEAN exports in 2003 to 2004,
with the ASEAN Free Trade Agreement (AFTA) playing a significant role in enabling the
intra-regional flow of parts.
Similar to the regional trade trend in ASEAN, much of the international trade is between
firms for IEG within GPNs rather than FEG between economies. Around 75 percent of the
goods exported to China from ASEAN economies are considered high- or medium-value
goods. China is the largest recipient of parts from Japan, ASEAN, and Korea. While some
final assembly processes are still strongly concentrated in Mexico, most activity has moved to
China, causing a drop in Mexico and ASEAN’s share in the manufacturing of parts, and
creating strong competition within the region. Along with the strong competition in
manufacturing, ASEAN economies have focused efforts in more profitable areas such as
design, R&D, and the creation of regional headquarters for the PC industry.

Chapter 2 Case Studies: Three Electronics Supply Chain Examples 42
The use of CMs by PC companies has grown substantially, increasing by more than fourfold
during the 1990s. One factor driving investment in China was the government decision of
Chinese Taipei to deregulate outgoing FDI by laptop PC makers into China in 2001.
Manufacturers from Chinese Taipei subsequently established a value chain centered in
China’s Yangtze River Valley, where today the majority of the world’s laptop computers are
made by CMs. (Dedrick, 2008)
For example, approximately 95 percent of Japanese manufacturers’ laptops are assembled in
China today, out of parts mostly manufactured in Japan and Thailand, as well as Malaysia
and the Philippines. The Philippines is convenient because it is fairly close to assembly
facilities in China. In Thailand, Japanese and United States vendors have developed a huge
hard disk drive design and manufacturing cluster, which has made Thailand the world’s
largest supplier of hard disk drives.24
Other developing economies attempting to graduate
from low-value add assembly activities may want to consider a similar cluster approach to
develop strong capabilities in another high-value part sector.
C. Leading manufacturer supply chain details
i. Overview and total costs
The cost of laptops is heavily concentrated in the main chipset and display, and market power
is focused in the hands of a few strong well-established players. Other parts are open to a
wider field of competitors from multiple economies. Recent detailed cost information on
laptop components is not readily available, especially since most market analysts have
switched their focus to the much faster-growing tablet computers since the introduction of the
wildly popular Apple iPad. The Lenovo case below provides a representative example of
supply chain structure and trends.
Lenovo example
Lenovo, a USD 30 billion global personal technology company, is a close second to HP in the
global PC market, and has a very strong position in developing economies. According to
market research firm Gartner, Lenovo sold 13.98 million PCs in fourth quarter 2012 and had
a global market share of 15.5 percent, second only to HP's 16.2 percent (Wall Street Journal,
2013). Lenovo presents an interesting case because a large percentage of its core operations
are based in China, rather than just assembly. Lenovo has headquarters in Beijing, China and
Morrisville, North Carolina, the United States; major research centers in Yokohama, Japan;
Beijing, Shanghai, Wuhan and Shenzhen, China; and Morrisville; and manufacturing centers
in China, India, Mexico, and soon in the United States. (John, 2012)
Lenovo argues that its balanced mix of in-house and outsourced manufacturing delivers a
competitive advantage by strengthening control and agility in the end-to-end supply chain
through investment and wider deployment of in-house plants; increasing responsiveness to
customer needs in all market segments. (John, 2012)
Lenovo focuses on in-house manufacturing specialization to lower its marginal costs, in what
a Center for Strategic and International Studies (CSIS) report refers to as a “one-stop shop”
24 Japan Ministry of Economy, Trade and Industry; interview with Washington Core. (February 2013)
Chapter 2 Case Studies: Three Electronics Supply Chain Examples 43
approach with product lines covering mid- to high-end products. (CSIS, 2013, pg24) The
Vendor-Managed Inventory Model (VMI) – a cooperative strategy between manufacturers
and raw materials suppliers, where upstream enterprises in the supply chain centralize
management of inventory – has improved the company’s logistical efficiency and cut down
costs. According to one report, after more than a year of implementing VMI, Lenovo’s
Shanghai manufacturing plant reduced its overall logistics operation time from 30–100 hours
to 3–5 hours and its inventory turnover period from 7–10 days to 0.5 days. (CSIS, 2013, pg.
24)
Lenovo has also spread its manufacturing centers throughout China and other developing
economies. Since 2009, it has focused more on developing economies, particularly markets in
India and Russia. (Wall Street Journal, 2012) The company has five manufacturing centers in
China (in Beijing, Huiyang, Shanghai, and two plants in Shenzhen), one in Mexico, and one
in India. The company also plans to open a manufacturing plant for desktops and tablets in
North Carolina, USA, in early 2013. (Lenovo, 2012) The internationalization of R&D has
helped Lenovo to develop a more varied range of products based on different markets and
allowed more sophisticated high-end innovation in developed markets. (CSIS, 2013)
Lenovo’s domestic manufacturing operations have benefited from access to reliable suppliers
in China’s east coast industrial clusters. By 1993, companies from Chinese Taipei that had
dominated the global supply chain of low-cost PC products had moved much of their
production capacity to the mainland, so Chinese PC makers like Lenovo could set up
factories in the same areas and buy components from Chinese Taipei suppliers at a low cost
compared to the global market. (CSIS, 2013, pg24) While many of its competitors have
trended towards out-sourcing manufacturing, Lenovo’s senior leadership decided in 2009 to
increase the company's in-house manufacturing from less than 30 percent to 50 percent, based
on the belief that Lenovo would be able to move its products more rapidly if the company
were more vertically integrated. (Wall Street Journal, 2012)
Lenovo has benefited from its early history as a distributor for foreign PC companies as it has
developed its own brand. Prior to China’s accession to the WTO, Lenovo was in the
advantageous position of being both the CM and the primary distributor for its PC
competitors. Lenovo has invested heavily in maintaining its distribution network in China,
which gives it a distinct local advantage (CSIS, 2013). The Chinese PC market represents
about 20 percent of global volume, and while Lenovo holds 34 percent of the large enterprise
market in China, it has only 19 percent of the small and medium-sized business market,
where Lenovo has strong potential for future growth.
In recent years the rising standard of living, costs, and prices in eastern China have
increasingly pressured high tech firms such as Lenovo to pursue manufacturing further west
in China, or abroad (though according to estimates by Lenovo, labor still accounts for only 2-
3 percent of total costs). (CNet, 2012; CSIS, 2013) As companies such as Lenovo move to
the western parts of China, their suppliers are also moving with them (CSIS, 2013). Abroad,
by expanding manufacturing in the United States and elsewhere, Lenovo expects faster
turnaround times in those regions, as well as lower fuel costs. (CNet, 2012)
Lenovo also credits its partnership with Taipei-based Compal Electronics as a “core” part of
its success. Lenovo and Compal in September 2011 signed an agreement to spend USD 300
million on a PC factory in Hefei city in eastern China. Lenovo owns 51 percent of the facility
and Compal the remaining 49 percent. (CSIS, 2013, pg24) Compal is expected to supply

Chapter 2 Case Studies: Three Electronics Supply Chain Examples 44
world-class electronics manufacturing skills and a knowledge/skill transfer platform between
the two companies. (John, 2012)
Lenovo has also learned lessons from several disruptive challenges to its supply chain in the
past few years due to multiple natural disasters. The biggest short-term supply chain
challenge for Lenovo, according to a 2011 talk by John Zapko, VP of Global Procurement at
Lenovo, was the 2011 flooding in Thailand that disabled upwards of 20 percent of Thailand’s
HDD capacity (John, 2012). The flooding caused a shortage of some types of hard drives for
the computer industry, and Lenovo had to first compete with other companies to procure
more hard drives. But because Lenovo assembles many of its own computers, it was able to
quickly shift the mix of products in its pipeline to focus on products for which the hard drives
were available, and prioritize products that had higher profit margins. The result was that
Lenovo’s global market share climbed upwards while its competitors’ shares dropped. (Wall
Street Journal b, 2012)
In terms of long-term or structural supply chain challenges that Lenovo faces, company
executives have highlighted shorter product lifecycles as a challenge for the company. This
concern with shorter product lifecycles is shared by executives from other high-tech
companies such as Intel and Epson. When discussing obstacles to high-tech distribution in the
Asia-Pacific region, a Lenovo executive also cited trade regulation compliance regulation as
a major concern. (PRweb, 2011)
ii. Key suppliers for 3 key parts
1. High-value: Intel Corporation (processors)
Long a giant in the PC industry, United States-based Intel generates USD 53 billion in annual
revenue, employs 105,000 people and operates dozens of offices and plants around the world.
Intel’s high-value added processors are used in roughly 80 percent PCs, and account for
nearly a quarter of a laptop’s total cost. However, in recent years Intel has been facing severe
competitive pressures as the public’s mobile computing preference switch from laptops to
tablets and smartphones. The latter products require lower energy processors than Intel is
accustomed to in the PC world, and the company is struggling to catch up with more mobile-
focused competitors. The decline in overall PC sales in 2012 caused a 15 percent decline in
Intel's profit.
Although Intel has been working to develop chips with lower energy requirements, even if
they are successful, they face a difficult challenge in that prices and margins are much lower
for mobile chipsets. Intel hopes to reinvigorate its competitive edge by focusing on its core
strengths of engineering expertise and huge, state of the art chip factories, which feature
industry-leading production technologies and processes that optimize economies of scale.
(Michael Liedtke, 2013)
2. Medium-value: Simplo (batteries)
Chinese Taipei's Simplo Technology is currently the world's largest supplier of laptop battery
packs, and despite weak growth in the laptop market has been experiencing solid sales due to
the surging demand for tablet computers. During the first six months of 2011, Simplo earned
net income of USD 55.6 million, an increase from USD 54.9 million in the same period of

Chapter 2 Case Studies: Three Electronics Supply Chain Examples 45
2010. The company forecast battery pack unit sales to rise by 10-20 percent in 2012, despite
nearly flat laptop sales.
Simplo supplies batteries to leading laptop vendors including HP, Acer and Apple. Batteries,
a medium-value part, account for approximately than five percent of the cost of a typical
laptop. The company expects that lithium polymer batteries, which are used in super-light
laptops, will account for more than 50 percent of total sales going forward. To help cope with
expected growth in the tablet market, Simplo established a new plant in Chongqing, China in
2010, which is expected to produce more than 30 percent of Simplo’s total battery shipments
by 2013 (Want China Times, 2011). The choice of the western city of Chongqing, away from
ports, was likely motivated by rising labor costs on the eastern coast.
3. Low-value: Elpida (DRAM)
Elpida Memory, based in Japan, has recently been grappling with very difficult market
conditions as the market price of DRAM chips has fallen. In response, the company is
considering several new initiatives to restore its competiveness.
In response to weak DRAM prices, Elpida plans to increase its DRAM chip density
from the current 2Gb to the more profitable large-density 4Gb.
To reduce its manufacturing costs Elpida plans by accelerating technology transition
to more cost-efficient processes at its Hiroshima plant. Additionally the company has
proposed shifting some DRAM chip production from its plant in Hiroshima Japan to
its subsidiary Rexchip Electronics in Chinese Taipei. Elpida holds a 70 percent stake
in Rexchip, which currently runs a 12-inch fab at a Science Park in Taipei with a
monthly capacity of nearly 90,000 wafers.
Additionally, Elpida is hoping looking to capitalize more on its IP rights by generating more
revenue from its patent license deals. In a related move, Elpida filed a lawsuit against
Chinese Taipei-based DRAM supplier Nanya Technology in the US, demanding
compensation for alleged infringement of Elpida’s DRAM patents. (DigiTimes, 2011)
On the bright side, recently Samsung has reportedly been increasing purchases of Elpida’s
DRAM chips for its smartphones (Michael Wu, 2013). DRAM chips account for less than
five percent of the cost of a typical laptop.
iii. Location of supply chain activities by function
Part production for laptops is conducted in a mix of developed and developing APEC
economies such as United States, Chinese Taipei, China, and Thailand, with final assembly
mostly concentrated in China. United States and Japanese suppliers continue to maintain
dominant positions on a few key high-value parts such as processors and disk drives, while
Chinese Taipei and Korean suppliers have become very competitive for most medium- and
low- value parts. Table 13 below lists some examples of significant suppliers of key parts.
Table 13: Laptop supply chain activities by location
Activity Supplier (s) Part (s) Economy (s)
High-value part
production
Intel Processors United States, China, Malaysia, Viet Nam
Hitachi HDD Thailand

Chapter 2 Case Studies: Three Electronics Supply Chain Examples 46
Medium-value part
production
Simplo Batteries Chinese Taipei, China
Low-value part
production
Elpida DRAM Chinese Taipei, Japan
Final product
assembly
In-house by
Lenovo
Finished
laptops
China, Japan
Source: author based on literature and interviews.
iv. Value captured by location
In the case of laptops, the vendor earns the largest profit per unit, but not the highest margin.
United States high-value parts and software suppliers such as Microsoft and Intel, tend to
earn the highest margins. Microsoft and Intel’s ownership and maintenance of valuable
standards (operating system and processor architecture, respectively) allow them to charge a
considerable premium for their parts, and at the same time make it harder for vendors like HP
and Lenovo to differentiate their computers in the market.
Suppliers of other chips such as Broadcom and Hynix also earn fairly high margins. Suppliers
of the optical drive, main memory and the battery earn lower but still greater margins than the
vendor itself. The lowest margins go to suppliers of part such as the graphics processor
supplier, display, and the hard drive. In most of these categories there are strong competitors
from the United States, Japan, Korea, and Chinese Taipei. (Jason, Kenneth and Greg, 2009)
3. CASE STUDY 3: FLAT PANEL TVS
A. Market background
i. Sales trends
According to display industry market research firm DisplaySearch, annual global LCD TV
shipments, the largest category of flat panel TVs, declined for the first time ever in 2012,
down one percent to 203 million units. Impacted by difficult global economic conditions,
shipments to developed economies fell by 18 percent year on year, and were not quite offset
by growth in emerging markets.
Before flat panel TVs became affordable, Cathode Ray Tube (CRT) TVs dominated the
market. By 2006 LCD TV sales had caught up with CRT, and by 2010, in part propelled by
consumers transitioning to digital television in most top world markets, LCD sets dominated
the global TV market.25
Japanese vendors such as Sony and Sharp, long sales leaders in CRT
sets, initially led the flat panel market as well, but once low price LCD sets became available
Korean and Chinese Taipei vendors began to rapidly gain market share.
While total global TV shipments fell over six percent year on year in 2012, from 249 million
to 233 million, China strengthened its position as the world’s largest market for TV
shipments, with demand rising six percent to a record-breaking 52 million units.
25 Fraunhofer Center for Sustainable Energy Systems (2012).

Chapter 2 Case Studies: Three Electronics Supply Chain Examples 47
The preliminary outlook for LCD TV sales growth in 2013 is cautious, and vendors are likely
to be looking more to streamline operations and reduce costs than to invest in new supply
chain capacity. (DisplaySearch, 2013)
ii. Leading manufacturer trends
Korean brands Samsung and LG dominated flat panel TV sales in 2012, accounting for a
combined total of almost 40 percent of global revenue. Japanese brands Sony, Panasonic, and
Sharp rounded out the top 5 global flat panel TV brands, but their collective share declined
six percent in 2012 as these companies’ focus shifted from pursuing volume to trying to
increase profits, and also due to a steep decline in Japan’s domestic TV market. Chinese TV
brands experienced strong growth in 2012 largely on the basis of strong domestic growth, but
they also gained share outside of China. Collectively, Chinese TV brands accounted for more
than 20 percent of global flat panel TV revenues and are aggressively targeting expansion
overseas, although no single vendor is yet big enough to reach the top of the global sales
charts (DisplaySearch, 2013). Table 14 below provides a list of the top five flat panel LCD
TV vendors by market share in 2012.

Chapter 2 Case Studies: Three Electronics Supply Chain Examples 48
Table 14: Worldwide flat panel TV market share leaders in 2012
Company
Global
market
revenue
share
Recent developments
Samsung 27.7% Samsung’s global flat panel TV revenue share reached a new record high
of 27.7 percent in 2012, up from 25% in 2011, with total flat panel TV
revenues increasing 6 percent year on year.
LG 15% LG Display, based near Seoul in Korea, has struggled with the tough
display market, and posted a $156 million operating loss for 1Q12, despite
its parent company’s strong profitability.
In 2012 LG was the first vendor to launch a 55-inch flat panel TV using
the next-generation organic light emitting display (OLED) technology,
which may eventually replace the currently prevalent LCD displays once
the price falls. An executive at LG Display said an internal study indicated
consumers would start buying OLED TVs once the price falls to 1.3 to 1.4
times that of an LCD set.
Sony 7.8% In 2011 Sony’s TV division, the former market leader based in Tokyo,
Japan, posted a loss for the eighth straight year. Sony was first to market
OLED with a small display in 2007, but has been slow to follow-up with
larger models.
Panasonic 6.0% Panasonic, based in Osaka, Japan, posted a USD 9.7 billion net loss in
2011, partly due to declining sales of flat panel TVs. Panasonic's president
Fumio Ohtsubo stated that the management made a mistake by investing
excessively in the production of LCD and plasma televisions prior to the
economic downturn. Revitalizing the TV division is a top priority for
Panasonic.
In 2011 Panasonic’s unit sales of LCD and plasma TVs fell 28 percent and
41 percent respectively. It remains to be seen if Panasonic will stick to its
traditional strength in plasma TVs, or refocus on OLED as its competitors
are doing.
Sharp 5.4% Sharp, based in Osaka, Japan, announced a partnership In March 2012 with
powerhouse OEM Foxconn of Chinese Taipei. Foxconn paid JPY 66
billion for a 40 percent stake in a Sharp LCD TV display plant in Osaka
that has been consistently losing money. Sharp and Foxconn are now
jointly operating the plant.
Source: DisplaySearch (2013), Reuters (2012), USA Today (2012), Hardware Zone (2012).
iii. Key parts and typical costs
LCD TVs contain more than a dozen major components of varying complexities and costs,
and are highly modular in construction, making assembly a relatively easy task. This case
study will focus on a few prominent components in different price ranges to gain a more
diverse perspective of the supply chain participants.
The display panel commands the lion’s share of value, as much as 70 percent of total costs.
Originally panel sales were dominated by Japanese suppliers, but falling TV prices and
aggressive competition have badly squeezed their profit margins, allowing Korean and

Chapter 2 Case Studies: Three Electronics Supply Chain Examples 49
especially Chinese Taipei suppliers to rise in their place, in some cases acquiring
manufacturing facilities from the Japanese companies.
Table 15: Key parts and leading suppliers for flat panel TVs
Value Part Supplier Headquarters
High ($100 and
up)
Display module Samsung Korea
Innolux Chinese Taipei
AUO
Color filter TPN Japan
Sintek Chinese Taipei
Moderate
($20-$100)
Backlight Formosa Epitaxy Chinese Taipei
Sharp Japan
Heesung Korea
Polarizer Nitto Japan
Optimax Chinese Taipei
Glass Corning United States
AGC Japan
Low (under $20) Driver IC Samsung Korea
Novatek Chinese Taipei
Source: Jurichich (2007).
B. Production trends
i. Overview
Ordinary LCD TVs are currently regarded as commodity products, and competition on cost
will have the effect of reducing margins on most standard parts. The more attractive
opportunity for parts suppliers lies in parts that support emerging new technologies such as
3D and AMOLED. The markets for these sorts of premium performance TVs remain
relatively small at the moment, but may see significant growth as prices begin to fall.
Furthermore, expertise in advanced display technologies may cross over to the much more
robust smartphone and tablet markets.
ii. Manufacturing locations
As illustrated in Table 16 and Figure 11 below, manufacturing for the LCD TV business is
spread across many APEC economies. Key parts and display modules tend to be made in
Japan, Korea, Chinese Taipei, and China. Assembly of finished TVs occurs primarily in
China, but for the United States market some final assembly steps are performed in Mexico in
order to avoid a United States import duty on flat panel TVs with no North American content.

Chapter 2 Case Studies: Three Electronics Supply Chain Examples 50
Table 16: Parts production and assembly locations for flat panel TVs
Production step Main locations
Liquid crystal panels Japan, Korea, Chinese Taipei, China
Power supplies China, Chinese Taipei, India, Indonesia, Japan, Korea,
Malaysia, Singapore, Thailand, Viet Nam
IC chips Thailand, Malaysia, Philippines, Indonesia, Singapore,
Viet Nam, Chinese Taipei, China, Korea, USA, Japan, EU
Capacitors Thailand, Malaysia, Philippines, Indonesia, Singapore
Resistors Thailand, Malaysia, Philippines, Indonesia, Singapore
Connectors Thailand, Malaysia, Philippines, Viet Nam
Inductors Malaysia, Philippines, Viet Nam
Relays Philippines
Frame, accessories, and
electromechanical parts
China, Chinese Taipei, India, Indonesia, Japan, Korea, Malaysia,
Thailand, Mexico, Brazil
Intermediate components
(liquid crystal modules, Image
processing units, tuner units)
China, Chinese Taipei, India, Indonesia, Japan, Korea, Malaysia,
Singapore, Thailand
Final product assembly China, Chinese Taipei, India, Indonesia, Japan, Korea, Malaysia,
Thailand, Mexico, Brazil, Viet Nam
Source: JEITA (2009).
Figure 12: Locations of LCD TV production activities in the APEC region
Source: author based on literature and interviews.
C. Leading manufacturer supply chain details
i. Overview and total costs
The LCD TV business is very mature and, with the exception of a growing but still small
premium segment for 3D, AMOLED, and other next generation technologies, the main point
of competition is price for most products. This has resulted to continuous efforts by all major
vendors to reduce costs by any means possible. In the case of Japanese vendors such as Sony,

Chapter 2 Case Studies: Three Electronics Supply Chain Examples 51
whose case is described below, this has meant outsourcing most manufacturing activities to
partners or CMs overseas, particularly to companies based in Korea and Chinese Taipei.
Sony example
Sony, once the world's leading supplier of CRT (cathode ray tube) TVs, has struggled to keep
pace with its competitors, especially Samsung and LG, in the LCD (Liquid Crystal Display)
TV market, and makes an interesting case as it has been making a series of structural changes
to its supply chain configuration in recent years to try to reinvent itself and turn around
profitability.
To cut costs, Sony has sought to build partnerships and joint ventures with its competitors.
Back in 2004, Sony joined with Samsung Electronics in a joint venture for LCD TVs, called
S-LCD, partly because Sony believed it would enable the company to build an economical
supply of LCD panels. However, while Samsung Electronics has emerged as one of the
world's top three LCD TV suppliers, Sony’s TV operation remained unprofitable. As a result,
the two sides decided in 2012 to dissolve the joint venture, with Samsung Electronics buying
up S-LCD's shares held by Sony (CSNS, 2012). Sony mentioned as part of the break-up that
it “aims to secure a flexible and steady supply of LCD panels from Samsung, based on
market prices and without the responsibility and costs of operating a manufacturing facility.”
(Industry Leader, 2011). Leaving the joint venture gives Sony flexibility on procuring LCD
panels for its televisions, but Sony is surrendering control of the manufacturing process,
which reduces its control of quality.
Following the joint venture dissolution, Sony’s new CEO, Kazuo Hirai, announced an
ambitious restructuring plan in 2012, including the elimination some 10,000 jobs (six percent
of Sony’s global work force), and is planning to spin its expensive small- and mid-sized LCD
production off into joint ventures, letting partners shoulder some of the costs (Jeff, 2012).
Sony has also reduced its partnership in LCD TVs with another competitor, Sharp, declining
to make additional investments in their LCD joint venture or in their state-of-the-art LCD-
panel production facility in western Japan. (Wall Street Journal a, 2012)
Through years, Sony has increasingly outsourced production of major components for its
products. Sony has sold off several of its LCD TV factories to contract manufacturers. In
2009 and 2010, production outsourcing agreements surrounding Sony’s former factories in
Slovakia and Mexico were struck with global CM Foxconn, based in Chinese Taipei (Supply
Chain Movement, 2010). By March 2010, Sony had closed 20 percent of its manufacturing
plants, including four of Sony’s eight television production plants, and eliminated 20,000
jobs (Bob, 2010). Sony currently outsources more than 50 percent of its production to outside
companies such as Chinese Taipei’s Hon Hai Precision Industry, also known as Foxconn.
(Industry Leader, 2011)
With the Samsung partnership dissolved in 2012, many of Sony’s contract manufacturers saw
an up-swing in contract orders from Sony. Many of Sony’s partners and contractors are based
in Chinese Taipei, with factories in China. These include display panel makers as AU
Optronics Corp. and Innolux Corp., TV assemblers such as Foxconn, Compal, and Wistron,
LED-backlit module suppliers as Everlight Electronics Co., Ltd. and Epistar Corp., and IC
chipset designers like MediaTek Inc. (HIS, 2012)
Sony’s pursuit of outsourcing its LCD TV production to contract managers is not unique
among Japanese TV manufacturers. In 2011 the LCD TV market suffered a sharp

Chapter 2 Case Studies: Three Electronics Supply Chain Examples 52
deceleration in sales growth to just eight percent, compared to a 37 percent rise in 2010,
which forced LCD TV manufacturers to look for ways to control their costs. According to
IHS, increased outsourcing by Japanese vendors of their LCD TV production drove up the
percentage of LCD TVs that were made by contract manufacturers in 2011 to 35.4 percent,
up from 33.5 percent in 2010 and 27.5 percent in 2009. As the LCD TV industry continues to
mature, vendors will be forced to resort to outsourcing strategies in order to remain profitable.
As a result, IHS predicts that the rate of outsourced manufacturing will continue to climb in
the next few years, reaching 43.7 percent by 2016, while in-house manufacturing will account
for the remaining 56.3 percent, down from 64.6 percent in 2011. (IHS, 2012)
Appreciation of the Japanese yen by approximately 25 percent from 2007 through 2011 also
made it more expensive for Japanese manufacturers like Sony, Sharp and Panasonic to
compete abroad, which compelled them to employ outsourcing entities for lower-cost
production (IHS, 2012). Other drivers for outsourcing in general include the need by vendors
to save on research and development expenses, which contract manufacturers are able to
shoulder; to mitigate supply chain risks by offloading inventory and material management;
and to stretch asset flexibility by reducing capital expenditures and high overhead. (IHS,
2012) As of 2013 the yen has fallen back to its 2008 value, which appears likely to reduce
orders for CMs for the near future.
Sony also has faced several unusual supply chain challenges in recent years. The 2008 global
financial crisis had a major impact on Sony, which was forced to close a television
manufacturing plant in Pennsylvania as part of its overhaul of its business.(AFP, 2008) The
devastating earthquake and tsunami that occurred in northern Japan in March 2011 also
impacted a number of Sony production facilities.
ii. Key suppliers for 3 key parts
1. High-value: Innolux (display modules)
The global top LCD module suppliers include AUO, CPT, HannStar, Innolux, Samsung, LG
Display, Sony, Sharp and Toshiba, based in Chinese Taipei, Korea, and Japan. Samsung is
the current market leader, and continuously invests in technology and process innovation to
pursue next-generation manufacturing. Samsung has also moved aggressively to try to take
market share from the main market challengers: LG, AUO and Innolux, which have been
steadily gaining ground.
Innolux, based in Chinese Taipei, is working to maintain existing market share, and enhance
the uniqueness and attractiveness of its product offerings. The company was also badly
impacted by the financial crisis and had to reposition itself to target smaller market segments
and provide specialized services. Innolux’s TV vendor customers include Sharp and Sony.
(Hsieh, 2011)
While Japanese display competitors in similar circumstances such as Sony, Sharp, and
Toshiba have focused on high added-value technology and process innovation, Innolux has
focused on strengthening downstream integration and building up strategic alliances with
distributors. Innolux saves R&D costs by obtaining technology support from the upstream
venders, and increases profitability by cooperating with downstream firms to try to head off
competition from Korea and Japan’s strong brands (Lee, 2012).

Chapter 2 Case Studies: Three Electronics Supply Chain Examples 53
2. Moderate cost: Formosa Epitaxy (LED backlights)
LED (light-emitting diode)-backlights are placed behind the displays of LCD TVs to provide
illumination, as the displays themselves are not lit. The global LED-backlight industry is led
by Chinese Taipei companies such as Formosa Epitaxy. The leading application for Chinese
Taipei LED products so far has been mobile phones, with a 37 percent share of total revenue
as of 2010, but TVs are expected to consume an increasing share. Competition amongst
leading LED-backlight TVs vendors such as Sony, LG, Sharp, and Toshiba has been intense.
This has increased demand for LEDs, and encouraged Formosa Epitaxy to significantly
expand manufacturing capacity. Formosa Epitaxy’s TV vendor customers include LG
(LEDinside, 2011) and Samsung. ( LEDinside, 2012)
Chinese Taipei leads the world in terms of LED production by volume, and the government
aims to support further growth by creating a comprehensive development plan, including
domestic standards, enactment of regulations, and innovation awards programs.
Large-sized display backlighting should be the largest single LED application market for the
near future, according to the Photonic Industry and Technology Development Association
(PIDA). LED applications in displays were estimated to grow from one percent of displays in
2009 to 23 percent in 2012. (PIDA, 2010)
3. Low-value: Novatek (display driver ICs)
Driver IC suppliers include a few large companies such as Samsung, Toshiba, and Texas
Instruments, as well as subsidiaries such as NEC Display Solutions and Himax Display, Inc.
(Display Search, 2006) One of the smaller companies competing in this space is Novatek
Microelectronics Corp. a fabless chip design company that specializes in the design,
development and sales of display driver ICs & System on Chip (SoC) solutions for flat-panel
LCD displays.26
Headquartered in Hsinchu Science Park, Chinese Taipei, with subsidiaries
in Tokyo and Hong Kong, China, the company has approximately 1,500 workers. Currently
the market leader, Novatek provides driver ICs to most of the major TV display module
suppliers, including Samsung and AUO. (Victoria, 2007)
Like many electronics companies based in Chinese Taipei, Novatek has subsidiaries in
several cities in China (Suzhou, Shenzhen, Shanghai, Cheng Du, and Xi'an). These
subsidiaries are either located on the eastern coast of China, where most initial electronics
manufacturing in China was initially clustered, or located in central China, where electronics
manufacturing has grown as labor and property costs along the eastern coast have risen.
iii. Location of supply chain activities by function
LCD panel display production was initially focused in Japan, before moving to Korea and
Chinese Taipei, with materials and equipment production largely remaining in Japan. This
transition demonstrates the general rule that production of products and parts with loosely
26 Novatek website, accessed 5/16/2013: http://www.novatek.com.tw/index.asp
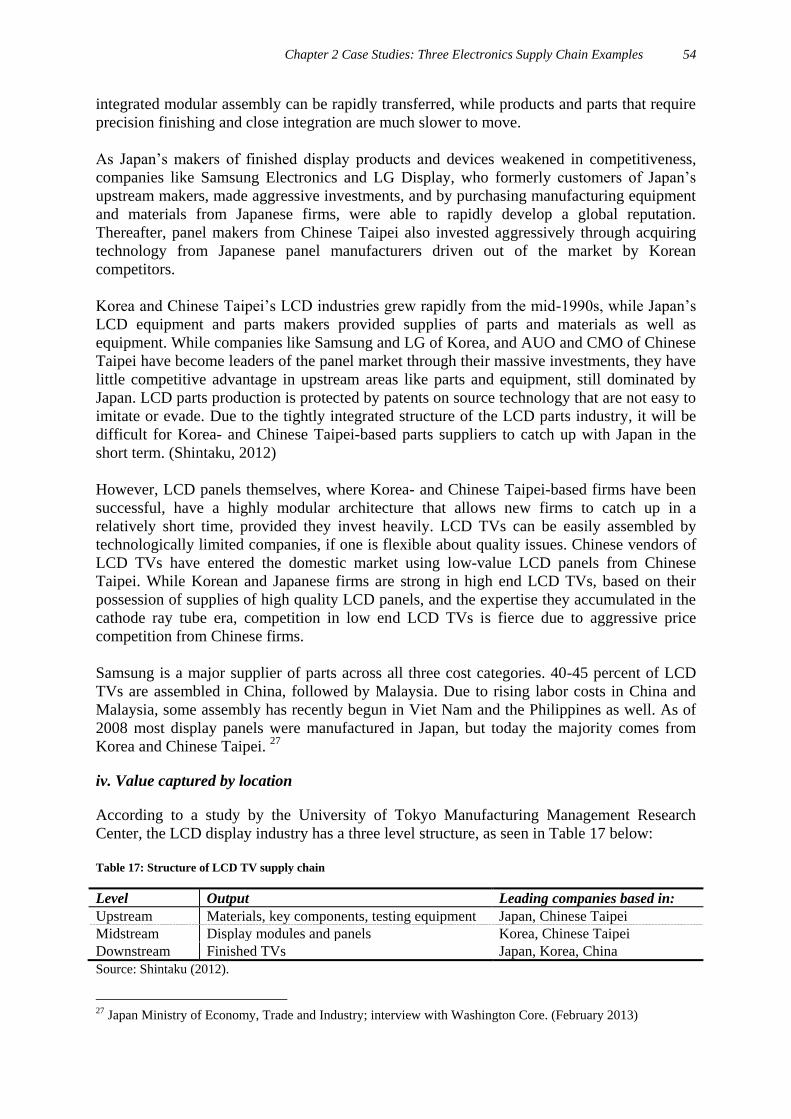
Chapter 2 Case Studies: Three Electronics Supply Chain Examples 54
integrated modular assembly can be rapidly transferred, while products and parts that require
precision finishing and close integration are much slower to move.
As Japan’s makers of finished display products and devices weakened in competitiveness,
companies like Samsung Electronics and LG Display, who formerly customers of Japan’s
upstream makers, made aggressive investments, and by purchasing manufacturing equipment
and materials from Japanese firms, were able to rapidly develop a global reputation.
Thereafter, panel makers from Chinese Taipei also invested aggressively through acquiring
technology from Japanese panel manufacturers driven out of the market by Korean
competitors.
Korea and Chinese Taipei’s LCD industries grew rapidly from the mid-1990s, while Japan’s
LCD equipment and parts makers provided supplies of parts and materials as well as
equipment. While companies like Samsung and LG of Korea, and AUO and CMO of Chinese
Taipei have become leaders of the panel market through their massive investments, they have
little competitive advantage in upstream areas like parts and equipment, still dominated by
Japan. LCD parts production is protected by patents on source technology that are not easy to
imitate or evade. Due to the tightly integrated structure of the LCD parts industry, it will be
difficult for Korea- and Chinese Taipei-based parts suppliers to catch up with Japan in the
short term. (Shintaku, 2012)
However, LCD panels themselves, where Korea- and Chinese Taipei-based firms have been
successful, have a highly modular architecture that allows new firms to catch up in a
relatively short time, provided they invest heavily. LCD TVs can be easily assembled by
technologically limited companies, if one is flexible about quality issues. Chinese vendors of
LCD TVs have entered the domestic market using low-value LCD panels from Chinese
Taipei. While Korean and Japanese firms are strong in high end LCD TVs, based on their
possession of supplies of high quality LCD panels, and the expertise they accumulated in the
cathode ray tube era, competition in low end LCD TVs is fierce due to aggressive price
competition from Chinese firms.
Samsung is a major supplier of parts across all three cost categories. 40-45 percent of LCD
TVs are assembled in China, followed by Malaysia. Due to rising labor costs in China and
Malaysia, some assembly has recently begun in Viet Nam and the Philippines as well. As of
2008 most display panels were manufactured in Japan, but today the majority comes from
Korea and Chinese Taipei. 27
iv. Value captured by location
According to a study by the University of Tokyo Manufacturing Management Research
Center, the LCD display industry has a three level structure, as seen in Table 17 below:
Table 17: Structure of LCD TV supply chain
Level Output Leading companies based in:
Upstream Materials, key components, testing equipment Japan, Chinese Taipei
Midstream Display modules and panels Korea, Chinese Taipei
Downstream Finished TVs Japan, Korea, China
Source: Shintaku (2012).
27 Japan Ministry of Economy, Trade and Industry; interview with Washington Core. (February 2013)

Chapter 2 Case Studies: Three Electronics Supply Chain Examples 55
More specifically, the upstream segment consists of materials and key components,
midstream of panel factories and module plants, and downstream of system and module
factories. The upstream manufacturers can be further categorized into mask, polarizing film,
backlight module, driver IC, LCD, cold cathode fluorescent lamp, color filter, and glass
substrate manufacturers. The middle-stream can be classified as large panel and small panel
manufacturers. The firms in downstream include TV makers, laptop makers and consumer
electronics makers. The middle part of this supply chain enjoys the largest annual output
value (close to USD 69 billion). The world's leading vendors are primarily located in Korea,
Chinese Taipei and Japan with a combined 83 percent of total global market share. (Lee,
2012)
As noted, FEG assembly takes place chiefly in China and Mexico. Similar to the smartphone
and laptop industries, low-value added assembly activities capture a comparatively small
share of value in LCD TV supply chains.
4. CASE STUDY COMPARISON
This section provides a summary and comparison of findings for the three case studies. Table
18 below compares some of the key characteristics of these supply chains. The criteria used
in the table were chosen to illustrate variations and commonalities in geographic focus and
market forces for the three products that may impact structure and growth trends.
Table 18: Case study summary
Criteria Smartphones Laptops Flat panel TVs
Market sales growth High Moderate Low
Locations of top
vendors
1) Korea
2) United States
China
1) United States
2) China
3) Chinese Taipei
1) Korea
2) Japan
Locations of major
IEG suppliers
1) United States
Korea
2) Chinese Taipei
1) Japan
2) United States
3) Korea
1) Chinese Taipei
2) Korea
3) Japan
Primary FEG
assembly locations
1) China
2) Viet Nam
1) China
2) Mexico
1) China
2) Mexico
Primary IEG
production locations
1) China
2) Malaysia
3) Chinese Taipei
1) China
2) Thailand
3) Malaysia
1) China
2) Malaysia
3) Thailand
Market concentration Moderate-High Moderate Moderate-High
Source: author based on literature and interviews.
To begin with, market sales growth was compared based on near future forecasts of annual
unit volume growth, to indicate where there may be the greatest future revenue growth
potential. In this context “High” refers to growth over 50 percent growth, “Moderate” to
growth between 10-50 percent, and “Low” to growth under 10 percent.
Next, the locations of top vendors and IEG suppliers are compared to indicate where
R&D/design capabilities and therefore the most value capture are located. Vendors and high-
value part suppliers typically conduct the majority of R&D/design work in these supply
chains, and capture the majority of supply chain value based on the high-added value of these
activities. On the other hand, the primary sites of IEG production and FEG assembly indicate

Chapter 2 Case Studies: Three Electronics Supply Chain Examples 56
where the most local employment opportunities are located, as these are typically very labor
intensive activities.
Market concentration refers to how much market share is held by top vendors and high-value
parts suppliers. “High” indicates market power is heavily concentrated in the hands of a small
number of companies, making it more difficult for small companies to compete.
Comparing the information in Table 18, the key trends and characteristics of the three supply
chains are discussed for 1) market sales growth; 2) locations of suppliers, part production,
and assembly; and 3) market concentration.
Market sales growth
In terms of the richest future sales potential for FEGs and IEGs, the smartphone market is
easily the biggest and most robust of the three and unit sales are expected to grow by 110
percent between 2012 and 2017 to reach annual sales of 1,516 million units, (IDC, 2012)
reflecting the relative level of market maturity for this product compared to other two
products. Additionally, many technologies used in smartphones are also, with some
modification, applicable to the emerging tablet computer market, which is forecast to grow
by 175 percent during the same period, reaching 352 million units in 2017.
For the more mature laptop and flat panel TV markets, sales growth is expected to be modest
or flat for the near future. With many new computer users opting for the greater mobility of
tablet computers, laptops are forecast to grow by only 19 percent from 2012-2017, reaching
241 million units in 2017. (IDC, 2012)
Although sales growth is very flat and margins razor thin for flat panel TVs overall, there are
some premium segments with new advanced display technologies like 3D that are showing
strong growth. These premium segments for now remain quite small and the retail prices
high. So far the industry has not been able to convince the mass market that these advanced
features are worth the high cost, but if a more mutually agreeable price point can be reached
there could be a new surge in TV sales and margins.
Locations of suppliers, part production, and assembly
In terms of geographic location, supply chain activities are distributed in a roughly similar
manner for the three products, although since the value to weight ratio is not as high for LCD
TVs as the other products, production activities tend to concentrate closer to end markets to
minimize transportation costs28
. For all products, the vendors and medium- and high-value
parts suppliers, the groups that capture the lion’s share of electronics supply chain value, are
located almost entirely in a small group of developed economies – Korea, United States,
Japan, Chinese Taipei, and increasingly in relative newcomer China.
The developing economies, particularly China, Malaysia, Thailand, Mexico, and Viet Nam,
then compete, often aggressively on price, for the fairly small share of value represented by
assembly, normally not more than three percent of the retail price for the products studied. At
this time with the exception of China, the developing economies have almost no first tier
parts suppliers. The relative success of Chinese companies as first tier suppliers of mostly
28 McKinsey Global Institute (November 2012).

Chapter 2 Case Studies: Three Electronics Supply Chain Examples 57
low-value parts can be explained partly by the massive concentration of FEG assembly
operations for all three products in China, making it advantageous to have suppliers close at
hand. Additionally Chinese suppliers have benefited from a large and rapidly expanding
domestic market, which likes foreign brand products but also has an appetite for cheaper
domestic products.
For the other developing economies, it has so far been much harder to make the transition
from assembler to supplier. While China has a few strong domestic vendors in the form of
Lenovo, Huawei, and ZTE, the vast majority of electronics supply chain operations in the
other developing economies are foreign-owned, typically by Japanese or Korean companies.
As noted, in some cases these tightly organized supply chains are starting to open up more to
the idea of using local suppliers. With greater technical skills and financial resources these
domestic suppliers may gradually be able to play more integral roles in local part production
and eventually serve overseas markets as well.
Economies that can support high-value parts production stand to capture the most value from
electronics supply chains over the long run. Korea and Chinese Taipei pose interesting recent
examples of supply chain evolution, both graduating from low- to high- value parts
production to establishing leading global vendors in the smartphone and laptop categories
respectively in less than two decades. Furthermore, by nimbly exploring new product and
supply chain opportunities, these two economies have thus far managed to avoid the malaise
that struck the United States and Japan electronics industries when their price
competitiveness waned. How quickly other APEC economies can follow Korea and Chinese
Taipei’s leads will depend heavily on their abilities to build workforces with top technical
skills.
Market concentration
The smartphone and flat panel TV markets are considered to have high market concentration
as both are dominated by a couple of top vendors with a combined market share of close to
50 percent: Samsung and Apple in the former case and Samsung and LG in the latter. The
former market remains somewhat fluid as Chinese vendors continue to rise up the sales
ranking driven by customers in emerging markets. Whether they can effectively challenge
Samsung and Apple in developed markets remains to be seen. In the case of TVs, for the
moment the low margins make it very difficult for anyone to compete with the scale of
Samsung’s operations, and the other vendors are mostly fighting to maintain their small
existing market shares.
The playing field in the laptop market is somewhat more level, and indeed the only market
where an economy (Chinese Taipei) other than the top three electronics producers (Korea,
Japan, United States) has been able to consistently compete in developed markets. But long
term growth prospects laptops appear to be limited, and even market leader HP has expressed
thoughts of getting out of the market.
To supplement the point above, a similar phenomenon can be observed in terms of key high-
value parts, which for all three product categories a few key suppliers dominate market share.
For example Samsung and Qualcomm respectively dominate flash and DRAM memory,
displays, app processors, and basebands in smartphones, Intel dominates processors in
laptops, and Samsung dominates displays in the TV market.

Chapter 2 Case Studies: Three Electronics Supply Chain Examples 58
Key differentiating factors
Comparison of the fundamental characteristics of the supply chains for the three products
shows that differences are rather subtle, with the exception of market growth. However, there
is a significant difference in vendor supply chain strategy amongst the three, which influences
the nature of participation by APEC economies.
Table 19: Vendor strategy
Criteria Smartphones Laptops Flat panel TVs
Vertical integration High Low Low
Vendor value capture High Moderate Moderate-low
Source: author based on literature and interview.
The key differentiating factor between the three supply chains is the degree of vertical
integration, which indicates how comprehensively the vendor controls design and production
activities, and which in turn affects how much value they capture. The smartphone industry
features a considerably higher degree of vertical integration than those of the other products.
According to Professor David Hsu (University of Pennsylvania), markets that are not
commoditized, such as smartphones, benefit most from vertical integration. For example,
smartphone market leaders Samsung and Apple have both long pursued highly integrated
supply chains, albeit with different approaches. Samsung has pursued a traditional vertical
integration model, not only designing and assembling its smartphones, laptops, and TVs, but
also designing and producing many of the key high-value parts internally. (Vergara, 2012)
Apple also designs the iPhone’s hardware and software, including the processors, internally.
However, the actual parts production and final assembly is performed by outside contractors,
notably Foxconn in China. Apple is large enough that it can impose terms to contractors, a
leverage point that smaller vendors cannot match. Apple’s ownership of core intellectual
property including systems design, semiconductors, battery chemistry and software has
enabled them to tweak iPhone performance to deliver a user experience superior to
competitors, while realizing low production costs.
However, once markets become less differentiated, as is the case in the laptop and flat panel
TV industries, a specialized approach, in which each member of a supply chain has a unique
role based on core strengths, becomes more cost effective. In the laptop and flat panel TV
industries most parts are produced by third party suppliers which do their own design. A
vertical approach does not provide a significant advantage if a firm is unable to stay ahead of
the competition, and this is very apparent in the TV industry in recent years. Japanese TV
vendors, once highly vertically integrated and reliant on charging premium prices for
products with premium performance, have found that in the consumer’s eye there is no longer
enough product differentiation to command premium prices, and therefore as the market
share of the Japanese vendors has declined they have moved to sell off internal production
operations and reduce costs by relying more on outside contractors. (Wharton School of
Business, 2012)
Therefore vendors in the smartphone industry capture a higher share of the retail price of
products than in the laptop and TV industries, and this means the vendor’s home economy
has a correspondingly high degree of value capture. This high degree of vertical integration

Chapter 2 Case Studies: Three Electronics Supply Chain Examples 59
can be especially problematic for small suppliers with little track record. Not only is it
especially difficult to establish a relationship with the vendor, but the vendors’ tight control
over the technology leaves the supplier little room to innovate and increase its value capture
by creating its own designs

Chapter 3 Factors Impact Supply Chain Strategy 60
.
Chapter 3 Factors Impacting Supply Chain Strategy
This chapter describes the key factors that influence electronics supply chain structures and
strategies, based on the consensus of findings from interviewees and literature resources.
Section 1 first presents five key factors that drive selection of suppliers and locations. Section
2 next presents seven challenges that may inhibit economies from more fully participating in
supply chains.
To encourage local development and expansion of supply chain operations, APEC economies
need to carefully evaluate whether the positive factors listed below are sufficiently supported
in their economies. Proactive initiatives to promote workforce skills, legitimate labor
mobility, access to financing, and incentives for FDI will help domestic suppliers greatly to
compete in world markets.
1. Key Factors for Supplier and Site Selection
This section describes five key criteria that vendors and large suppliers will carefully
consider when deciding on which suppliers to work with or which economies to locate
production activities in. Any suppliers facing significant handicaps in several of these areas
will be at a substantial disadvantage.
Low labor costs (High priority)
It is clear from the concentration of electronics supply chain activities in economies with
relatively low labor costs that this continues to be a major factor in choosing production
locations. Most FEG assembly operations continue to be very labor intensive, making it very
important to mitigate labor costs as best possible.
For example, as described by the Ministry of Economy, Trade, and Industry of Japan (METI),
the case of Japan is an example of the never-ending search for lower labor costs. Beginning
in the 1970s, Japanese vendors and parts suppliers initially responded to rising labor costs at
home by establishing wholly-owned subsidiaries or joint ventures, firstly in newly
industrialized economies such as Chinese Taipei, and then when costs rose there, they
established operations in ASEAN economies such as Thailand and Malaysia.
Today, however, intensified price competition in the electronics industry has caused Japanese
parts suppliers to fundamentally change their supply chain strategies, and they have shifted
away from their traditional focus on heavy in-house production to instead procure more parts
from local CMs overseas, which have lower staffing costs than subsidiaries with Japanese
management. Thailand, for example, has many capable local CMs that Japanese
manufacturers procure from. This shift toward outsourcing is also seen in the case study for
Sony LCD televisions in Chapter 2, which describes how Sony has radically changed its
strategy to outsource more than 50 percent of its production to outside CMs, mostly to
factories located in low labor cost economies such as mainland China. (Industry Leader,
2011) Now, with the cost of labor rising even in China, Japanese vendors and suppliers are

Chapter 3 Factors Impacting Supply Chain Strategy 61
seeking to increase procurement in Viet Nam, where there is a growing concentration of not
only Viet Namese but also Korean and Chinese Taipei CMs trying to leverage the low labor
costs there. 29
IHS predicts that the rate of outsourced manufacturing in the LCD industry will continue to
climb in the next few years, reaching 43.7 percent by 2016, while in-house manufacturing
will account for the remaining 56.3 percent, down from 64.6 percent in 2011. (IHS, 2012)
As seen in the Japan example, eventually the popularity of a low-cost location for production
leads to a tighter labor market and rising labor costs, even in a very populous economy such
as China. The massive scale and dense concentration of electronics assembly operations near
the eastern coast have caused significant rises in labor costs since 2009.30
As mentioned in
the case studies presented in Chapter 2, these factors have driven various vendors heavily
dependent on cheap assembly operations in China to expand capacity in lower cost areas.
Laptop vendor Lenovo established additional laptop assembly facilities in less crowded parts
of western China, while Samsung established a large smartphone assembly facility in Viet
Nam.
High scalability
It is important that suppliers have the capacity to efficiently and flexibly execute high volume
tasks at a high level of quality. This requires infrastructure, capital and skilled employees.
The sheer scale of assembly operations clustered in China makes it difficult for other
economies to compete. As discussed in Chapter 2, Chinese computer manufacturer Lenovo
retains five manufacturing centers in China (in Beijing, Huiyang, Shanghai, and two plants in
Shenzhen). Being situated in China’s manufacturing center allows Lenovo to produce and
access parts at extremely high volumes, and allows for customization of product offerings
scaled to customers’ needs.
Apple provides another very notable example. Once proud of a “Made in the U.S.A.”
reputation, for years now Apple has heavily relied on the Chinese production facilities of
Chinese Taipei’s Foxconn. Tim Cook, Apple's CEO, has stated that the primary reason that
Apple uses Foxconn and other Asian manufacturers is their flexibility for new products,
design changes and volume changes. In one example of this high flexibility, former Apple
CEO Steve Jobs allegedly once demanded a new glass screen be included in the iPhone
design just weeks before the product launch, requiring Foxconn to quickly locate suppliers,
develop new processes and reconfigure assembly lines. (Lee Quarterman, 2012)
Steven Jobs commented in 2011 that these kinds of assembly operations cannot be brought
back to the United States. No United States supplier has the capacity to replicate Foxconn’s
level of responsiveness in the United States. As mentioned in Chapter 1, Apple actually did
recently announce that some tablet computer production would be established in the United
States, but apparently only on a very small scale. (Duhigg and Bradsher, 2012)
Developing economies also may face this scale disadvantage, despite the general availability
of cheap labor. As mentioned in Chapter 1, Malaysia used to perform many of the assembly
activities that China does today, but was not able to scale up to meet rising demand in the
1990s, and China gradually absorbed these activities as its capacity grew. Today the
29 Japan Ministry of Economy, Trade and Industry; interview with Washington Core. (February 2013) 30 Japanese smartphone vendor, interview with Washington Core. (April 2013)

Chapter 3 Factors Impacting Supply Chain Strategy 62
differential in capacity is so great that it is difficult to attract large FEG assembly operations
back to Malaysia.31
Supportive business and regulatory climate
Governments can create a very welcoming environment for electronics supply chain activities
by providing incentives such as exemptions from import duties, tax credits, and solid
infrastructure. According to METI, electronics manufacturers and parts suppliers often seek
to locate production in economies which provide attractive incentives for foreign investment.
For example, the ASEAN AFTA agreement makes it attractive to cluster supply chain
functions in the ASEAN region, as no customs duties need to be paid to ship goods between
the member economies. Thailand for example has appealed to foreign manufacturers by
providing generous corporate tax breaks and industrial parks with solid utility and
transportation infrastructure. Many parts suppliers are SMEs, and they highly value the
existence of advanced infrastructure because they do not have the resources to fund major
infrastructure improvements to support their facilities.
Due to this combination of factors, Thailand, and to a lesser extent Malaysia, have been very
successful at attracting Japanese SME parts suppliers to base production there, as mentioned
in Chapter 1. More recently Viet Nam and the Philippines have also drawn some Japanese
parts suppliers to industrial parks.32
Also noted in Chapter 1, the Philippines has attracted
seven of the top chipmakers in the world, as well as four major Japanese HDD producers
(Hitachi, Toshiba, Fujitsu, and NEC) to construct manufacturing facilities in the Philippines.
(Ernie, 2011)
Humane working conditions
Large vendors typically maintain strict working condition standards that they expect all
suppliers to adhere to, regardless of the location. Therefore worker rights concerns must be
monitored even by suppliers in developed economies if they have production facilities
located overseas. For example, most Chinese Taipei parts suppliers have factories in China. It
is critical for potential suppliers to inform themselves about any requirements the vendor
expects them to comply with. As discussed in Chapter 2, vendors which have strong vertical
control over the supply chain process, such as Samsung and Lenovo, naturally have stronger
control over work conditions at their factories. Other companies that rely more heavily on
contract manufacturers, such as Sony and Apple, must be vigilant to ensure that their
suppliers maintain legal working conditions. Vendors try to choose suppliers whose facilities
have clean labor rights records, in order to avoid potential scandals such as Apple’s PR
debacle in 2010, when employee protests over allegedly severe working conditions at a
Foxconn assembly plant in China made headlines.33
Proximity to end markets
Freight transportation across the APEC region is generally efficient enough that production of
small, light parts can be located wherever cost-effective capacity exists, without much
31 Malaysia University of Science and Technology, interview with Washington Core. (February 2013) 32 Japan Ministry of Economy, Trade and Industry; interview with Washington Core. (February 2013) 33 National Chung Cheng University, interview with Washington Core. (January 2013)

Chapter 3 Factors Impacting Supply Chain Strategy 63
concern for shipping costs. Japanese manufacturers tend to consolidate parts production in a
single ASEAN economy, and then ship the parts to where they are needed, usually to an
assembly facility in China. For example, as noted in Chapter 2, Thailand is the preferred
location for Japanese manufacturers’ production of hard disk drives, which allows the
manufacturers to consolidate the cost of transportation. However, heavier, labor-intensive
parts naturally incur much higher transportation costs, and therefore are typically procured
from local suppliers located as close to the end markets as possible.34
As noted in Chapter 2,
the Philippines is convenient for many manufacturers because it is fairly close to assembly
facilities in China.
2. Challenges for Suppliers
This section looks at other factors that suppliers need to carefully plan for in order to
maximize their competitiveness and growth potential. APEC governments should devise
adaptable strategies that reduce potential risks and maximize their individual potential.35
Employee training (High priority)
Growing and advancing to higher value-added activities in electronics supply chains requires
a large supply of workers with sufficient technical skills to cover the full range of key supply
chain functions. Both in speaking with interviewees and reviewing development roadmaps of
APEC economies, this study found that critical importance of a highly skilled workforce was
repeatedly stressed as a top priority. Although economies may initially compete in electronics
supply chains by performing labor-intensive work at low costs, eventually rising labor costs
will cause much of this low-value work to shift to a cheaper location, and the economy will
need to transition to higher-value activities to differentiate itself and continue growth.
As noted in Chapter 1, Malaysia lost much of its low-value assembly business to lower cost
China, in the early 2000s, and is hoping to replace that revenue by building its share of
higher-value parts production. However, for Malaysian companies to take on more central
roles in vendors’ supply chains, they need to have strong technical skills to participate in
product design.
The government’s TalentCorp agency has determined that Malaysia’s share of electronics
supply chain activities is likely to continue to erode if it does not move beyond competing on
cost and offer more advanced design capabilities as competitors in Singapore and Chinese
Taipei have done. To make this transition, the availability of adequately trained and skilled
talent in Malaysia needs to be increased, particularly in the areas of R&D and other technical
areas such as engineering support. (TalentCorp, 2012)
In the case of Thailand, the typical pattern for achieving this kind of skill enhancement is for
local workers to get jobs at established multinational suppliers to get training and experience,
34 Japan Ministry of Economy, Trade and Industry, interview with Washington Core. (February 2013) 35 This study asked all interviewees about the eight Supply Chain Chokepoints identified by APEC as obstacles
to trade. In general interviewees stated that they did not feel that these issues were the most pressing concerns
for their economies/industries. This is not to suggest that these are not important issues for electronics supply
chains, but merely that interviewees were more focused on other concerns.
Chapter 3 Factors Impacting Supply Chain Strategy 64
and then later leave to start their own SMEs to produce certain simple parts and materials for
Japanese, Korean, or Chinese Taipei manufacturers. 36
Economies such as Viet Nam, Cambodia, and Myanmar are even earlier in the supply chain
evolutionary process than Thailand and Malaysia, and their workforces have very limited
technical abilities. In recent years, multinational vendors and parts suppliers have begun to
expand production activities in these economies, particularly in Viet Nam. According to
METI, Japanese manufacturers operating in these economies would be very interested in
procuring advanced parts from local companies. However, the number of local suppliers
capable of producing such parts remains relatively small, so Japanese companies often still
have to rely instead on purchasing from more expensive Japanese parts suppliers that have set
up their own facilities in those economies.37
Shortened product life cycles
As mentioned in Chapter 2, many recent popular electronics products such as smartphones
have increasingly brief product life cycles, as models must be updated very frequently as the
technology evolves, requiring goods to be delivered to end markets in a very short time
frame. For example, company executives at Lenovo have highlighted shortened product life
cycles as one of the key long-term or structural supply chain challenges that Lenovo faces.
This concern with shorter product lifecycles is shared by executives from other high-tech
companies such as Intel and Epson. (PRWeb, 2011)
Short product life cycles can pose a considerable transportation challenge for locating supply
chain activities in economies which are located far from the main world markets. For
example, a Malaysian supplier trying to service the United States market faces a
disadvantageous shipping time of more than 2 weeks from Malaysia to the United States,
twice the shipping time from China’s east coast, and also longer than from Viet Nam.. A
further disincentive to locating production for short life cycle products like smartphones in
Malaysia is that current domestic consumer demand for such products remains relatively
small.
One way for economies with similar geographic disadvantages to circumvent the shipping
time disadvantage would be to focus on producing less time-sensitive products like industrial
equipment, rather than consumer electronics.38
Natural disasters
Unfortunately over the last decade several APEC economies critical to electronics supply
chains experienced severe natural disasters. Most recently, the 2011 Japan tsunami and
Thailand flood caused major supply chain challenges as production of flash memory and hard
drives fell precipitously in the short term. As noted in Chapter 2, both Sony and Lenovo as
well as many other vendors experienced substantial supply chain disruptions as a result of
these disasters. For Lenovo, the company’s largely successful response to these disasters was
seen as a validation of its carefully structured vertical supply chain strategy.
36 Japan Ministry of Economy, Trade and Industry; interview with Washington Core. (February 2013) 37 Ibid. 38 Malaysia University of Science and Technology, interview with Washington Core. (February 2013)

Chapter 3 Factors Impacting Supply Chain Strategy 65
As climate trends seem to indicate that this sort of severe weather will become more frequent
in the future, there is some indication that electronics firms have become more wary of
concentrating production in too narrow a geographic area, and are seeking to diversify to
improve resilience. However, this does not necessarily mean they are abandoning production
sites in the disaster areas. In the case of Thailand, Japanese manufacturers have not shifted
production out of the economy, but they have focused new investment in other economies
such as the Philippines and Viet Nam.39
Currency fluctuation
As seen in the Chapter 2 case studies, the supply chains for most consumer electronics
products typically stretch across multiple APEC economies. This means that large swings in
currency exchange rates can have significant impacts on the cost effectiveness of electronics
supply chain structures. The case of the Japanese electronics industry provides an informative
example of how vendors respond to dramatic currency swings, with resulting impacts on their
relationships with suppliers.
Beginning in 2007, the yen entered a 4 year period of unprecedented strength, rising 38
percent in value from 123 yen to the dollar to 76. This rise severely reduced the cost
competitiveness of Japan's domestically-focused electronics industry, forcing it to execute a
transformational level of restructuring that included shedding assets, slashing workforces, and
revamping business models.
Taking the example of the LCD TV industry, Japanese firms, used to an export-focused
model, were producing low-margin televisions in domestic factories when the yen’s surge in
value began in 2007. Combined with the relative weakness of the Korean won at the time, the
competitiveness of Japanese TVs against Korean rivals Samsung and LG was severely
compromised. This resulted in massive financial losses and job cuts for vendors such as
Sony, Sharp, and Panasonic.
Before the yen had begun its ascent, Sharp had already begun shifting its supply chain
strategy to consolidate TV production in house in hopes of cutting production costs and
becoming more competitive with Korean vendors. To this end Sharp built a large state of the
art LCD display panel factory in Japan in order to leverage economies of scale. Unfortunately,
by the time the factory opened in late 2009, the global recession and surging yen had severely
depressed panel sales, leaving the factory operating well below capacity and a huge financial
liability for Sharp. In 2012, Sharp turned to its longtime CM Foxconn for help, and the latter
invested $675 million to become co-owner of the panel factory.
At Sony, the TV division, facing the difficult currency situation and 9 years of losses, decided
to stop trying to compete on price to build up market share, and instead turned to maximizing
profits on its premium models. Sony’s TV unit sales subsequently dropped nearly 40 percent
from 22.4 million in 2010 to 13.5 million in 2012. This kind of abrupt strategic shift on the
part of vendors entails risk for their suppliers as well, who may invest in production capacity
on the expectation of a certain volume of orders from the vendor.
39 Japan Ministry of Economy, Trade and Industry; interview with Washington Core. (February 2013)
Chapter 3 Factors Impacting Supply Chain Strategy 66
Sony’s smartphone business also struggled during this period, although more due to strong
competition from United States and Korean vendors than to disadvantageous exchange rates.
At the time Sony was engaged in a joint venture with Swedish telecom vendor Ericsson to
produce smartphones, leading to a fairly diverse international supply chain based mostly on
USD transactions.
The extended period of strong yen would prove to be very difficult for all of Japan’s
electronics vendors, but as a result of this challenging experience and aggressive restructuring
efforts they gradually became much more nimble and better able to respond to currency and
demand changes.
In 2012 the yen suddenly began to rapidly drop in value, falling 34 percent to 102 yen to the
dollar by May 2013.40
As of 2013, Sony claims that it has structured its supply chains so that
they are effectively "dollar-yen neutral", meaning that the yen's fall had no net negative effect
on its earnings. However, as mentioned, Sony’s smartphone supply chain is structured so that
many parts have to be procured from overseas suppliers in USD, and therefore the yen's
growing weakness against the USD does increase production costs. According to Sony, for
the 2013 fiscal year started in April, each further one-yen decline against the dollar reduces
its operating profit by JPY3 billion, or approximately $30 million. (Wall Street Journal,
2013)41
Currently, about half of Sony's products are manufactured by overseas CMs. Foxconn
manufactures approximately 6 million TV sets for Sony every year, while fellow Chinese
Taipei CMs TPV Technology and Wistron have been responsible for another 300,000 and
500,000 units, respectively.
In response to the yen’s decline, Sony has reportedly decided to reduce orders to CMs for
2014, and instead bring manufacturing operations back in house for at least 70% of its
products. Accordingly, Sony plans to increase production at its own TV plant in Malaysia. As
a result, Sony’s orders to TPV Technology and Wistron reportedly declined, although
apparently Foxconn has been spared so far. Other CMs will be similarly challenged if other
Japanese vendors follow Sony's lead42
. Therefore, it is important for suppliers themselves to
also attempt to insulate themselves from currency fluctuation by maintaining a diverse
customer base and quickly adapting to changes in vendor circumstances and needs. Naturally,
such measures are easier for a large supplier like Foxconn with large reserves and a wide
international reach.
Trade barriers
Tariffs and export restrictions can pose significant impediments to the trade flows of IEGs
and FEGs. Even very low tariffs can pose a formidable supply chain obstacle, as mature,
commodity-like electronics products typically have very low profit margins, For example, as
mentioned in Chapter 2, the United States still maintains an import tariff on finished flat
panel TVs. Since the profit margin on these products is generally less than five percent, even
a small tariff might make their import unprofitable. This forces some TV assembly steps to be
40 As of May 28, 2013 according to Bloomberg. http://www.bloomberg.com/quote/USDJPY:CUR 41 Dollar amount is based on 100 yen to the dollar exchange rate on June 3, 2013. 42 Want China Times, May 15, 2013.

Chapter 3 Factors Impacting Supply Chain Strategy 67
conducted in Mexico, which as a participant to NAFTA, can ship goods to the United States
tariff-free.43
In addition, understanding tariffs can be complex for suppliers due to the quickly changing
characteristics of electronics technologies, which government regulators can struggle to keep
up with, and sometimes misapply tariffs. For example, according to the National ICT
Association of Malaysia, GPS tracking devices, used by logistics providers to track
shipments, were initially taxed in Malaysia at the same 12-15 percent rate as smartphones
since they use the same GSM communications standard, even though communications is only
a minor part of the functionality of GPS trackers.44
It took several years for the government to
recognize GPS trackers as a separate product category, and lower the tariff to a more
reasonable 10 percent.
Additionally, export restrictions on electronics trade, although they may be used to serve
worthy policy objectives such as environmental protection, promotion of downstream
industries, revenue maximization, and preservation of resource reserves for future use, can
also have unintended negative impacts. Trade restrictions relevant to the electronics industry
include export restrictions on strategic raw materials and import/export restrictions on used
electrical and electronic equipment (UEEE). As discussed in Chapter 2 of this report, the first
step in the life cycle of mobile devices is the extraction and processing of raw materials,
including critical metals. To include these materials in, for example, a mobile device, they
must first be mined and processed to be suitable for subsequent manufacturing of
components. As mentioned, critical metals used in mobile device component production are
heavily concentrated in a small number of APEC economies, and have few substitutes.
Export restrictions can have a significant impact on the critical metal supply chain making it
difficult and more expensive for manufacturers reliant on imported materials needed for new
mobile device components. It does not appear that today any export restrictions exist that
pertain specifically to the four key rare materials used in mobile devices, but since export
restrictions are generally not reported to any international body, there is no comprehensive
reference list of such measures.
In the raw materials extraction and processing phase of the mobile device life cycle, export
restrictions can have a negative impact on economic efficiency, because overseas
manufacturers reliant on the import of these metals must either spend unnecessary time and
money to identify alternate sources of raw materials that also may be more expensive to
extract and process. For example, Japan announced in its 2011 budget that it will spend USD
650 million on securing rare earth elements and other natural resources. Of this, USD 19.5
million will be spent on developing rare earth element recycling and rare earth element
alternative technologies that drive efficient production, allocation, and use of resources.
Alternatively, overseas manufacturers may have to consider moving their manufacturing
operations into the economy imposing the ban in order to gain access to the material. Either
outcome can lead to increased prices throughout the production cycle, which are passed on to
consumers. (Borkey, 2012)
43 Consumer Electronics Association, interview with Washington Core. (February 2013) 44 PIKOM: The National ICT Association of Malaysia, interview with Washington Core. (April 2013)

Chapter 3 Factors Impacting Supply Chain Strategy 68
Balance between product and process innovation
To build up brand equity and maintain market share, it is important for both final product
vendors and parts suppliers to maintain an appropriate balance of investment in product and
process innovation. Most major Japanese parts suppliers have traditionally focused very
heavily on costly product innovation, in order differentiate their products and open new
market opportunities. Smaller competing suppliers from Chinese Taipei, Korea, and other
places typically have not had the financial resources to fund as much product innovation, so
instead they have relied on copying pioneering new products and selling them more cheaply.
To this end they focus investment on manufacturing process innovations to reduce production
costs. Therefore while the Japanese suppliers may gain an early market lead by launching a
highly innovative product, this lead is often overtaken by lower-priced competitors within a
year or so.45
For example, Sharp was able to successfully grow its LCD TV business for many years by
releasing unique, innovative products and incorporating their own premium components in
the product lines. In recent years however, it appears that many consumers no longer see
enough appeal in Sharp’s unique products to warrant paying premium prices. As noted in
Chapter 2, consumers have increasingly come to view LCD TVs as commodity products, and
expect prices to match.
Sharp is trying to respond to this dilemma by focusing on production of small and medium-
size panels, a category in which there is strong demand due to surging smartphone and tablet
computer sales, and in which Sharp currently maintains a technology lead. However, so far
mass production using this technology has proven to be relatively difficult, and these
products seem unlikely to enhance the company’s profitability unless process innovation can
make their manufacture more efficient. (Satō, 2012)
Investment capital
It has become increasingly difficult for small companies to succeed as electronics parts
suppliers due to the high levels of investment needed to achieve process innovation as the
amount of automation increases. Additionally, this is a very risky business for new suppliers,
because there is a great amount of competition and there are typically no long term contracts
with customers, so revenue can fluctuate greatly. These factors make it difficult for small
companies to obtain financing, and contribute to a growing consolidation trend amongst
electronics parts suppliers. (Harada, 2013)
45 Chinese Taipei electronics parts supplier, interview with Washington Core. (April 2013)

Chapter 4: Local Impact of Supply Chain Participation 69
Chapter 4 Local Impact of Supply Chain Participation
This section describes the key benefits derived and challenges, both economic and social,
faced by APEC economies participating in electronics supply chains, based on the consensus
of findings from interviewees and literature resources.
The impact of electronics supply chain participation on host economies is generally positive,
and the sector represents a valuable engine of current and potentially future economic growth.
However, for an economy to optimize this contribution, it is important to focus on attracting
the highest value-added activities. It is also important to keep in mind that growth in the
electronics sector will have to be supported by appropriate regulations.
1. Benefits
Benefits from supply chain participation can fall under the categories of direct economic
benefits in the form of employment and tax revenue, and tangential benefits such as improved
health services funded by increased tax revenues, and technology transfer to other sectors of
the economy. In an optimal situation, a sizable supply chain cluster will attract a variety of
supporting businesses to locate nearby, multiplying its benefits to the community.
GDP growth
Economic growth is a key benefit of close participation in electronics supply chains. From
Japan to Korea to Malaysia to China, most of the major Asia Pacific economies were
jumpstarted through successful electronics export growth. The healthiest GDP growth today
is found in APEC economies with strong electronics supply chain presences, such as China,
Singapore, and Viet Nam, all of whose GDPs grew at more than 6 percent annually from
2009-2011.
Employment growth
Electronics supply chains can be a substantial source of employment, especially for labor
intensive assembly activities. As mentioned in Chapters 1 and 2, in several cases, such as in
Malaysia and coastal areas of China, the resulting demand for labor has been so great as to
overwhelm supply. Table 20 below provides a general idea of the numbers of people
employed per economy across the region, looking at the example of the electronics supply
chains of Japanese companies across the APEC region. Unsurprisingly, China stands way out
in first, followed distantly by Japan’s longtime close ASEAN trading partners Thailand and
the Philippines. However, it is important to keep in mind that these figures reflect not only
the scope of supply chain operations in each economy, but also the extent of automation and
employee productivity. Therefore, moderate differences in employee totals do not necessarily
indicate which economy has a greater level of production.

Chapter 4 Local impact of supply chain participation 70
Table 20: Total number of jobs provided by (Japanese) electronics manufacturing in APEC economies in 2011
Economy Electronics Telecommunications
equipment
Total
Companies Jobs Companies Jobs Companies Jobs
China 244 156,528 395 370,674 639 527,202
Thailand 58 61,164 51 62,093 109 123,257
Philippines 17 23,638 51 69,160 68 92,798
Viet Nam 12 5,169 34 83,546 46 88,715
Malaysia 12 11,502 79 57,192 91 68,694
Indonesia 10 3,273 30 45,484 40 48,757
United States 42 15,530 68 30,577 110 46,107
Chinese
Taipei
17 4,095 56 12,969 73 17,064
Korea 14 2,462 32 11,578 46 14,040
Singapore 15 3,157 29 9,502 44 12,659
Source: METI (2012)
Additionally, the growth of local supply chain operations can contribute to the health and
socio-economic well-being of host economy populations. Large electronics vendors may
contribute to the wellness of workers through monitoring of its supplier network. For
example, Samsung Electronics includes performance on Corporate Social Responsibility
(CSR)-related issues as a part of supplier appraisal criteria.
In 2011 Samsung conducted site surveys of Chinese suppliers that are not subjected to
assessment with CSR-related criteria, in order to check compliance status on health and
safety and environmental management practices. Suppliers with less than adequate
performance on any of the CSR issues were requested to implement improvement measures.
Samsung also implemented an audit process for key suppliers, conducted by an Electronic
Industry Citizenship Coalition (EICC)-certified third-party verification agency on their CSR
promotion status for improved reliability and transparency. (Samsung, 2012)
Beyond facility conditions, some vendors provide extensive wellness programs that can
contribute to the wellbeing of employees and contractors. For example, Lenovo makes
informational resources available to assist employees on various wellness matters and disease
prevention, and health and safety information is offered and shared with non-Lenovo
employees on an as needed basis. Additionally, Lenovo engages in a number of
comprehensive wellness initiatives, and provides employee assistance programs and medical
consulting services to promote overall employee health. For instance, medical screening
services offered in a number of China locations, eye care services offered in India and a
fitness center is available to United States employees. Examples of other employee health
promotion offerings include health risk assessments, immunization clinics and a wellness
program that reward employees for engaging in healthy behaviors and activities. (Lenovo,
2012)
Technology transfer
The operation of electronic supply chains normally leads to the transfer of technology to the
host economy, which can take several forms. FDI is one strong driver of technology transfer,
as local suppliers need access to some of the technologies required for assembling and
manufacturing the products needed by the principal multinational vendors or suppliers. The
host economy in general can benefit from this technology transfer, if the acquired technology

Chapter 4 Local impact of supply chain participation 71
is allowed to diffuse into the wider economy. This requires close linkages between the
technology owners, other potential beneficiaries and relevant public institutions.
Governments can facilitate such linkages through the use of incentives, training programs and
science parks.
For example, technology transfer played a vital role in making Thailand a major
manufacturer of HDD and other electronic products and facilitated the acquisition of the
skills needed to operate and manage production facilities to assemble IEG and FEG products.
Thailand was able to achieve these goals through a multi-pronged technology transfer and
diffusion promotion approach: (Zhan, 2005)
The National Science and Technology Development Agency established Software
Park Thailand in 1997 to promote innovation and facilitate development of startup
firms
The Thailand Board of Investment developed the Unit for Industrial Linkage
Development (BUILD) program to encourage the development of support industries,
strengthen linkages and help small and medium-sized contract manufacturers
improve their productivity and facilitate cooperation between foreign and domestic
firms.
Thailand is continuing efforts to build the capacity needed to operate increasingly
sophisticated assembly plants and generate novel processes and products. These initiatives
could further ensure that Thailand gradually moves further up the value chain.
As mentioned in Chapter 2, patent control is a related factor in technology transfer, and a lack
of adequate patent technology can hinder development of a local industry even when a
significant portion of the supply chain is available. For example, in the smartphone industry
leading vendors like Samsung and Apple and leading suppliers of high-value parts like
Qualcomm have control over critical IP that market newcomers may have to license at great
expense if they do not have the knowhow develop alternatives internally or the resources to
purchase others’ knowhow. As mentioned in Chapter 2, Chinese Taipei suppliers have
struggled to compete for high-value parts such as memory due in part to inadequate
proprietary research and development capacity. Powerchip finally began to make inroads in
this market by licensing technology from Elpida. (Tsan et al, 2012)
2. Challenges
Although the overall impact of participation in electronics supply chains is a net economic
benefit for host economies, if regulatory measures do not keep pace with the needs of these
businesses there is potential for collateral damage in the form of increased social costs. Two
such examples are provided below.
Occupational health risks
While the expansion and growth of electronics supply chains has provided increased job
opportunities for both high and low skilled labor in the APEC region, at the same time poor
and sometimes unregulated working conditions placed the low skilled labor force at greater
risk of occupational health hazards. Even though leading vendors increasingly use CSR
criteria to assess the quality of working conditions at suppliers, problems can still occur.

Chapter 4 Local impact of supply chain participation 72
Both Samsung and Apple have faced criticism about alleged adverse effects to health caused
by working conditions in their factories. A number of cancer cases amongst former Samsung
factory workers in Korea brought the risks of chemical exposure under scrutiny, and stories
of employees being required to work extreme amounts of overtime at Foxconn’s iPhone
assembly facilities likewise caused human rights groups to examine Foxconn’s working
conditions. No clear evidence of causation has so far been established between working in
electronics factories and developing cancer, but research on this sensitive subject has been
fairly limited to date.
Intellectual property (IP) infringement and environmental issues
The difficulty of monitoring health risks in the electronics industry is partly linked to the
industry’s strong emphasis on protecting IP, which forms the basis of a firm’s competitive
advantage. This protection also hinders the transparency of firm activity, limiting
understanding of the chemicals utilized in production, some of which could potentially harm
staff and the environment. The rapid pace of technological advancement can result in new
chemicals being utilized during manufacturing every two to four years (Qasim, 2011).
Consequently, to effectively prevent public health and environmental damage, regulations
governing potential health issues during production must be consistently updated at the same
rate as technological advancements.
Labor mobility concerns
The electrical and electronics product supply chains have long been a major contributor to
employment in the APEC region. In the future however, it appears likely that some of the
major participating economies will struggle to maintain enough labor supply to meet demand.
This in turn can lead to high levels of undocumented mobility that can cause high social costs
for economies with large electronics production operations.
Rapidly-maturing working-age populations in labor-receiving economies such as Japan,
Korea, and Thailand will reduce labor supply. On the other hand, rising demand for services
and non-tradable goods will increase labor demand from a number of labor-sending
economies such as Indonesia and Viet Nam. Combined, these forces will create important
labor shortages in a number of economies, creating a great need for migrant workers from
other economies. As a result, international labor mobility will become part of the growing
push toward “deep” economic integration in East Asia being advanced through Association
of Southeast Asian Nations (ASEAN) and various ASEAN Plus agreements. For example the
ASEAN Economic Community Goals include liberal labor mobility requirements for skilled
workers by 2015.
Given these factors, the key question concerning international labor mobility in East Asia is
how policies should be designed so as to positively enhance the returns of international labor
flows for sending and receiving economies and migrants. Although much of the legal
mobility in the region is facilitated through bilateral agreements designed to encourage
temporary or circular mobility, there is a lack of transparency and communication between
the knowledge of recruiting agencies, employing firms, potential workers, and governments.
These information gaps and the demand for longer term, rather than temporary, mobility in
many economies produce large incentives for undocumented mobility. For example, as
pointed out by research at the Malaysia University of Science and Technology, factories in
some ASEAN economies are staffed with large numbers of undocumented migrants. In

Chapter 4 Local impact of supply chain participation 73
Malaysia, undocumented workers comprise half of the two million migrants, and in Thailand,
it is estimated that only 47 percent (1.3 million) of migrant workers are documented or
partially regularized through the registration process.
Undocumented labor mobility can be very costly for host economies in terms of various
health and other social services, and should be addressed through improved multilateral and
regional agreements that promote proper and documented labor mobility. Regional charters,
such as the ASEAN Declaration on the Protection and Promotion of Migration, provide
potentially useful and constructive guidelines. At present, bilateral agreements on the
temporary movement of persons and labor across economies provide the best prospects for
enhancing international labor mobility, yet they must recognize that the labor market needs to
balance supply as well as demand by allowing firms to hire the workers that they need
through legal and transparent channels. (Quillin, 2012)
Chapter 5 Government Initiatives 74
Chapter 5 Government Initiatives
Recognizing the importance of the E&E industries to their economies, governments in many
key supply chain participants have adopted policy measures with varying degrees of structure
and intensity to help their E&E sectors to advance or grow. Depending on the nature of the
government, approaches range from China’s very targeted and heavily funded next
generation information technology/electronics development plan, to some very modest
investments in the United States in general support of manufacturing. This chapter will
provide several examples of government initiative being implemented in several APEC
economies.
All of the principle electronics supply chain economies in APEC have launched some kind of
initiative in support of the electronics industry. Many of these have followed similar themes,
such as employee skills building. This section focuses on a few representative examples of
policies created to deal with pressing supply chain concerns for economies at different stages
of development:
Early stage – primary activity is FEG assembly, with limited production of simple,
low-value parts
Midterm stage – primary activities include production of low- and medium- value
parts and FEG assembly
Mature stage – primary activity is R&D/design and production of high-value parts
Based on their respective stages of development along the supply chain evolutionary curve,
Governments across the region face common challenges in maintaining competitiveness in
electronics supply chains, and are pursuing similar policies appropriate to their respective
stages of development along the supply chain evolutionary curve. Workforce skill upgrading
stands above all as the most common policy priority, and is likely to remain so as rapid
technology change constitutes a relentlessly moving target for economies at all levels of
development.
1. EARLY STAGE
China – advanced manufacturing capacity
As noted in Chapter 1, today China’s primary role in electronics supply chains is the
assembly of FEG from IEG parts and components, which mostly come from other economies
such as Korea, Japan, and Chinese Taipei, or their subsidiaries in China or ASEAN
economies. As Chinese labor costs rise, it is becoming more difficult for manufacturers
located in China to compete on price with economies like Viet Nam and Indonesia for simple
assembly tasks, and the Chinese government is hoping to move the industry toward domestic
design and manufacture of IEGs. China’s twelfth 5-year strategic economic development plan
targets seven strategic emerging industries with strong links to manufacturing that is want to
grow over 2011-2015 from five percent of GDP to eight percent. One of the selected
industries is next generation information technology, which includes the following product
categories (Shippe, 2012, pg 68):
Next generation mobile communications

Chapter 5 Government Initiatives 75
Integrated circuits
Next generation displays
A key priority of the plan is for China to transition from products being “Made in China” to
products that are instead “Designed in China”. In order to achieve this goal, the government
plans to heavily invest in science and technology education and R&D, and further develop
China’s intellectual property rights system to protect innovation. China’s indigenous
innovation drive to promote the use of Chinese technical standards will also continue to play
a central role in this sector throughout the period. (APCO Worldwide, 2010)
The Strategic Emerging Industries Decision calls specifically for:
Increasing R&D expenditures in enterprises, industrial pilot/demonstration projects,
and research alliances involving labs and universities led by backbone industries.
Creating financial incentives for intellectual property development.
Improving research environments.
Building improved financial and consulting support for industry.
Building mechanisms to aid the commercialization of technology (Shippe, 2012).
2. MIDTERM STAGE
Malaysia – workforce skills development
Malaysia was involuntarily propelled beyond the FEG assembly stage when those activities
largely moved out to lower cost China in the early 2000s. Like Mexico, Malaysia has a few
decades of IEG production experience now, but these are primarily low or medium value-
added products involving little domestically created design, and competition from other
developing APEC economies is growing in these sectors. To maintain and grow its
electronics industry, Malaysia needs to move into more sophisticated high value-added parts
production. However, as noted in Chapter 3, the Malaysian government has assessed that its
electronics sector workforce’s technical skills and ability to perform R&D and engineering
functions is quite limited.
Therefore, looking ahead, Malaysia’s government efforts are focused on developing a first-
world talent base, both in general and especially for the electronics sector. During the Tenth
Plan period (2011-2015), the government will adopt an integrated human capital and talent
development framework, seeking to provide broader access to quality technical education and
vocational training.
Specifically, Malaysia is seeking to increase enrollment in technical education and vocational
training (TEVT) and improve overall training quality. In Malaysia, only ten percent of
students enroll in upper secondary technical and vocational education, whereas the average
enrolment rate for OECD economies is 44 percent. During the Tenth Plan period, the
following strategies will be adopted to mainstream and broaden access to quality TEVT:
Improving the perception of TEVT and attracting more trainees
Developing highly effective TEVT instructors
Upgrading and aligning TEVT curriculum quality with industry requirements

Chapter 5 Government Initiatives 76
Currently, only 28 percent of the total Malaysian workforce is employed in the higher skilled
jobs bracket, reflecting the low level of educational attainment among a large segment of the
workforce. The government aims to have 33 percent of the workforce employed in the higher
skilled jobs bracket by 2015, and up to 50 percent by 2020. The Skills Development Fund
will be expanded to promote skills advancement and retraining the workforce. It will be
extended beyond new graduates to include existing workers. Recognizing that not all workers
have enough funds to pay for their own training, preferential loans will be provided by the
fund to pay for training costs incurred in skills upgrading (OECD, 2012).
3. MATURE STAGE
Japan- overseas market development
In Japan, not only FEG but also most IEG production has already moved overseas in response
to cost pressures. This has been discussed in detail in Chapter 2 and the Sony case study for
flat screen TVs, which notes that drivers for outsourcing production in general include the
need by vendors to save on research and development expenses, to mitigate supply chain
risks by offloading inventory and material management, and to stretch asset flexibility by
reducing capital expenditures and high overhead (IHS, 2012).
Both Korea and Chinese Taipei face similar situations, although to a lesser degree.
Accordingly, small Japanese IEG suppliers are now trying to follow their customers overseas
and set up operations nearby in ASEAN economies, according to METI.
To help support these efforts to seek out new markets, in 2010 METI helped launch the
Mekong-Japan Economic and Industrial Cooperation Initiative (MJ-CI) Action Plan, an
example of a comprehensive government effort to build local capacities to support the
development of markets and industries in electronics and other sectors in the Mekong region
to the advantage of both host economies and Japanese companies.
The plan seeks to facilitate manufacturing in the Mekong region and the quick transport of
finished products and parts across borders (Shinoda, 2010). The Plan provides financial and
technical assistance to build and improve critical transportation infrastructure such as roads,
seaports, and airports, as well as energy infrastructure such as power grids and power plants.
It seeks to speed up trade flows by helping to automate customs clearance procedures and
establishing regional cross-border trade agreements. Finally, the Plan directly supports both
Japanese and overseas SMEs by providing training on the regulatory environment and
matchmaking between Japanese vendors and overseas suppliers (Japan METI, 2012). It is
hoped that new electronics production clusters can be established where Japanese suppliers
can service not only Japanese vendors but vendors from Korea and other economies as well. 46
46 Japan Ministry of Economy, Trade and Industry; interview with Washington Core (February 2013).

Chapter 6 Recommendations 77
Chapter 6 Trends and Recommendations
1. FUTURE SUPPLY CHAIN TRENDS
The structure and challenges of electronics supply chains are dynamic and evolve over time,
often rapidly in accordance with dramatic shifts in technology. The characteristics described
in this report can be expected to hold true for the foreseeable future, but the urgency of
certain priorities will grow faster than others.
In terms of geographic focus, China can be expected to remain the core hub of global
electronics supply chains for the foreseeable future, despite recent wage increases in urban
areas of 20 percent or more to improve employee morale and retention. This increase is
expected to cause supplier and vendor margins to decline, but have only a modest impact on
supply chain strategies, as manufacturing efficiency improvements can offset the additional
costs. At the same time, for vendors that currently outsource mainly to CMs in China, other
low cost economies such as Viet Nam, Thailand, Malaysia and Indonesia may become more
attractive as production locations, presuming that the local infrastructure is sufficiently
developed and enough skilled manpower is available (Wright, 2011).
Regarding supply chain strategy, vendors are likely to continue to outsource non-core
operations while at the same increasing vertical integration of core competencies. As seen in
the case of the Japanese TV vendors, electronics vendors don’t want to become locked down
by costly assets, and are therefore fueling growth in the business of CMs like Foxconn. Top
vendors such as Apple, HP and Dell are employing contract manufacturing for their non-core
operations so that they can concentrate on design and sales.
On the other hand, as seen in the case of Samsung, core competencies in design and
innovation that differentiate product advantages are being retained in house as manufacturing
becomes commoditized. Similarly, Apple recently acquired a supplier with specialized
capabilities to enhance the performance of its mobile devices, clearly pointing to the need to
grow vertical competencies. Both the need to outsource non-core operations and the need for
vertical integration of core competencies can be attributed to rapid technology growth
requiring complex manufacturing capabilities, and shrinking product lifecycles that require
faster time to market, and therefore require vendors to concentrate on design and sales.
While reliability and Quality of Service are top concerns for vendors concerning supplier
performance, the risk of non-adherence to delivery schedules and the risk of non-compliance
to environmental regulations will be challenges that vendors will face as they increase their
reliance on outsourcing. Large vendors may invest in core product manufacturing and also
vertically integrate or acquire certain semiconductor design houses. Vendors will increasingly
consider corporate social responsibility criteria to avoid environmental and other compliance
issues, making selection of contract manufacturers more stringent, and leading vendors to
take more direct control of raw material and supplier management. As noted in Chapter 2,
Lenovo has cited its closely controlled Vendor-managed inventory (VMI) approach as a key
to its success.

Chapter 6 Recommendations 78
Across the electronics industry, the time to respond to market demands and changes is
shrinking. Vendors need to be agile and flexible, ready to expand and grow their supply and
production networks in an environment that does not allow accurate forecasting.
These rapid changes in technology also result in the growth of e-waste. With increased
government regulation of e-waste management, vendors are being forced to undertake the
responsible management of product returns. Consumers, too, are beginning to demand
products that have a lowered packaging footprint, reduced usage of hazardous material, and
safe product disposal guarantees. The economic value of sustainability initiatives will create
stricter methods of evaluating suppliers (Dhekne and Chittal, 2011).
There is a clear need for the creation of a supply chain risk management strategy, allowing
vendors to respond to increasing numbers of natural disasters such as earthquakes, tsunamis,
floods & hurricanes, which are potential threats that have caused major disruptions to key
electronics supply chains in the past. Accidents such as fires or major electrical power
outages in factories can also have an adverse effect on supply chains.
To mitigate such risks, vendors will outsource critical parts from multiple suppliers, across
multiple factories in multiple economies. There is likely to be increased usage of widely-
available, standard components instead of proprietary, custom-built parts that are difficult to
substitute. Vendors and suppliers will try to keep a little excess manufacturing capacity in
factories, and will strive to design factories that are capable of building a wide portfolio of
products in order to respond to sudden supply chain disruptions.
To increase responsiveness to customer needs, supply chains will enhance their ability to
produce on a demand driven basis, enabling more efficient delivery of products. For example,
after implementation of a Demand Driven Supply Chain strategy, Lenovo reported a 17%
increase in sales, to nearly $16.4 billion, and a 30% increase in gross margins, to nearly $2.5
billion. Before it launched its demand-driven initiative, the percentage of Lenovo’s PC
shipments, for example, filled within the company’s eight-day target was somewhere
between 34% and 37%. Now more than 70% of Lenovo desktop orders are filled within eight
days (EIU, 2009). Similarly, to increase responsiveness CM Flextronics has put in place an
online collaboration platform for its 2,500 suppliers in 32 economies where suppliers can
view demand changes, adjust production plans, and share information about delivery dates
and volumes.
The need for greater demand driven supply chain planning is being driven by the ever falling
time that companies have to adjust to sudden changes in their markets, fueled by reduced
differentiation, constant new product introductions, shrinking product lifecycles due to
increased customer expectations and technology obsolescence, and diminished forecast
accuracy due to the cannibalization effect of new products.
Therefore vendors will need to capture detailed information about demand signals and
communicate this information across their supply chains. To accomplish this, greater
collaboration amongst supply chain members will be needed to enable global visibility across
internal and external supply chains combined with proactive alerting to allow suppliers to
accurately align all supply and demand considerations. Real time demand sensing, such as

Chapter 6 Recommendations 79
RFID,47
will come into greater use to quickly read and communicate demand signals close to
the end consumer to drive the supply chain and adjust direction.
The future of electronics supply chain structures is being driven by technological, social and
environmental changes. The deeper concerns of vendors, such as compliance to regulatory
norms, social responsibility, reducing exposure to business risk, response to growing
competition, meeting consumer demands and shrinking product development cycles, will
need to be addressed through more sophisticated supply chain risk management strategies.
The following section proposes ways in which APEC policymakers may support suppliers as
they try to adapt to these and other changes.
2. RECOMMENDATIONS FOR APEC
Overall electronics supply chains continue to have a very beneficial impact on economic
growth and development in the APEC region, and the future outlook is generally bright.
However, there are many opportunities to further enhance the participation and benefit
realized by individual economies. To do so requires the greater development of certain local
capacities, strategic refocusing as supply chain roles evolve, and supportive regional
regulatory frameworks.
It is important to keep in mind that the location of the final assembly of electronics products
commands only a few percent of the supply chain’s overall value added. Contrary to what the
cross-border flows of the related physical components and goods and sensational media
headlines about China’s manufacturing dominance would seem to suggest, developed
economies continue to capture the lion’s share of E&E value added generated globally. Even
in the case of manufactured goods, it is often intangibles such as licensing intellectual
property that capture most of the value added. Final assembly remains an important step of
the supply chain, but more due to its links to other stages of the supply chain than as a
standalone enterprise.
This reality demonstrates that international commodity trade statistics that record the gross
values of cross-border goods flows can be misleading because most of the value of a product
may be added before it reaches the final assembly location. International efforts should be
taken to develop value-added based trade statistics.
Ultimately economies in the world compete for their citizens’ high value-adding roles in
globally dispersed supply chains; for a given level of effort, the objective is then to capture as
much value and generate as much wealth as possible. For example, China is showing
determination not to remain a “two percent” value-add assembly location and is moving
rapidly to increase higher-value adding functions. At the other end of the spectrum,
developed economies such as the United States, Korea, and Japan maintain, for the moment,
many advantages in providing globally differentiating high-value R&D and parts (Ali-Yrkko,
2011). With time the gap between the two sides will narrow, providing the opportunity for
other enterprising developing APEC economies to follow China’s lead.
To grow E&E supply chain efficiency and economic success, economies should:
47 Radio-frequency identification (RFID) is the wireless non-contact use of radio-frequency electromagnetic
fields to transfer data from identifying and tracking tags attached to objects.

Chapter 6 Recommendations 80
Build up human capital:
Development of human resources, providing technical and managerial training and
flexible immigration policies to foster the growth of a large and capable workforce.
For example, Malaysia’s efforts to build its domestic labor supply are discussed in
Chapters 1 and 5.
Maintaining and improving good working conditions for workers. As noted in Chapter
3, large vendors typically maintain working condition standards that they expect all
suppliers to adhere to, regardless of the location. Vendors try to choose suppliers
whose facilities have clean human rights records, in order to avoid potential scandals.
Promoting the legal mobility of high skilled workers and researchers. This helps
economies to build the scale of their electronics industry, and increases the potential
to develop high-value patents. For example, as mentioned in Chapter 1, Korea has
created a new work visa for foreign IT researchers to encourage their intellectual
contributions to IT development.
Assist and facilitate business:
Exploring possibilities to develop further along or down the supply chain as
appropriate. For example, China’s initiatives to promote the “Designed in China”
movement for electronic products are discussed in Chapters 1 and 5. As discussed in
Chapter 2, the United States is active in the smartphone supply chain at multiple
levels, including design and R&D (at Apple), low-cost parts, and high-cost parts.
This is partly because these categories overlap with the computer industry, where the
United States has always been very strong, and partly because it is a huge consumer
market, which attracts suppliers to locate close to the end users. As discussed in
Chapter 2, given the high value-added in semiconductor manufacturing, Korea has
retained the entire smart phone supply chain locally and also manufactures Apple's
processor in domestic factories. Samsung’s largely vertically integrated supply chain
for smartphones has served that company well in its ability to continuously refresh
innovation in products, quickly ramp products to enormous global wide volumes and
deal with multiple global channel partners, while having stronger control over costs
and quality.
Access to financing and education on overseas regulatory environments to help
SMEs to expand abroad. Information for example on free trade agreements may not
be well-known by SMEs. Similarly, governments hoping to encourage large
multinational electronics vendors and suppliers to come to their economies to
establish supply chain facilities need to both provide a supportive regulatory
environment for business and perform outreach to explain the details and advantages
of this environment to overseas companies. Particularly in low-margin product
sectors such as LCD TVs, it may be unprofitable for suppliers to operate in
economies with heavy regulatory burdens. In general, it is important for economies to
help SMEs to grow and expand their production and technological capacity,
especially since the scale of electronics supplier is very important to their success.
Creating the necessary climate to develop high tech “clusters” to build innovation
and technology development. Some APEC electronics clusters noted in this report
include Singapore for the semiconductor industry, Thailand for hard disk drives,
China’s coastal cities for final products manufacturing, Paju and Tangjeong in Korea

Chapter 6 Recommendations 81
for LCD manufacturing, and audio and video electronics industry clusters in Baja
California, Mexico. Some tools that have been found useful to develop these clusters
include free trade zones, local universities, and the creation of industrial parks to
encourage local development and innovation.
Established economies such as the United States and Japan can find opportunities to
reduce costs by establishing research centers in developing economies, outsourcing
labor-intensive manufacturing and service activities, and contracting out easily
replicated technological work to lower-cost engineers in the developing world. For
examples, see the discussion of Apple and the United States in Chapter 1, and the
discussion of Sony and its policies to build partnerships and joint ventures in the case
study of the television supply chain in Chapter 2.
Encouraging Foreign Direct Investment (FDI) in economies. As noted in Chapter 2,
FDI in Asia’s computer manufacturing increased significantly in the late 1990s as a
result of a variety of policies undertaken by Asian economies to encourage design
and R&D, increase customs efficiency, streamline the foreign investment approval
process, and to create tax incentives for investment. For example, as noted in Chapter
3, Thailand has appealed to foreign manufacturers (particularly in Japan) by
providing generous corporate tax breaks and industrial parks with solid utility and
transportation infrastructure.
Strengthen regional integration:
Continuing to promote free trade agreements and reduce tariffs. The Trans-Pacific
Partnership (TPP), being negotiated by eight APEC economies in the Asia-Pacific
area (Australia, Brunei, New Zealand, Malaysia, Peru, Singapore, US, and Viet Nam)
is an example of such agreement that may serve as good model. The TPP aims to
address not only tariff barriers but also a wide range of regional trade issues such as
intellectual property protection and labor and environmental laws. Similar dialogues
should be held that encompass a broader range of APEC economies.
As discussed in Chapter 1, economies that have followed successful liberalization of
trade policies in the past include Korea, Malaysia, and Singapore, each of which
loosened previously strict economic restrictions in ways that improved the
international competitiveness of their electronics industries. As noted in Chapter 2,
the North American Free Trade Agreement (NAFTA) made Mexico a key location for
final assembly processes in the PC industry, and the reduction and elimination of
trade barriers among ASEAN states has facilitated the horizontal specialization of PC
supply chain activities with the distribution of firms based on the comparative
advantages of an economy.
Build up physical and ICT capabilities:
Developing infrastructure such as transportation networks and telecommunications
networks. Development of physical infrastructure has been an important contributing
factor for attracting FDI for economies such as Thailand and Malaysia, as noted in
Chapter 3, and some economies, such as Singapore, have found a unique niche in the
electronics supply chain by promoting themselves as shipping hubs for electronic
goods. Meanwhile, economies such as Hong Kong, China; Japan and Korea have
developed some of the most advanced information technology infrastructures in the
world, which in turn support their domestic industries.

Abbreviation list 82
ABBREVIATION LIST
ADB
AFTA
APEC
ASEAN
ASEM
BOM
CM
CSIS
CSR
CTI
DRAM
EAS
E&E
EICC
ETLA
EU
FDI
FEG
GMS
GPN
HDD
IC
IDC
IEG
IMF
ITU
LCD
LED
METI
MJ-CI
MLCC
MNC
NAFTA
NIEs
OECD
OELD
OS
PC
PIDA
SEMCO
SMEs
SoC
SOMO
TEVT
TRIPs
UEEE
VMI
WCDMA
WTO
Asian Development Bank
ASEAN Free Trade Agreement
Asia Pacific Economic Cooperation
Association of Southeast Asian Nations
Asia-Europe Meeting
Bill of Materials
Contract manufacturer
Center for Strategic and International Studies
Corporate social responsibility
Committee on Trade and Investment
Dynamic random access memory
East Asia Summit
Electrical and electronics
Electronic Industry Citizenship Coalition
Research Institute of the Finnish Economy
The European Union
Foreign Direct Investment
Finished electronic goods
Greater Mekong Subregion
Global production networks
Hard disk drive
Integrated circuit
International Data Corporation
Intermediate electronic goods
International Monetary Fund
International Telecommunication Union
Liquid-crystal display
Light-emitting diode
Ministry of Economy, Trade and Industry (Japan)
Mekong-Japan Economic and Industrial Cooperation Initiative
Multi-layer ceramic capacitor
Multinational companies/corporations
North American Free Trade Agreement
Newly Industrialized Economies
Organisation for Economic Co-operation and Development
Organic light emitting display
Operation System
Personal computer
Photonic Industry and Technology Development Association
Samsung Electro-mechanics Corporation
Small and medium-sized enterprises
System on Chip
Centre for Research and Multinational Corporation (Dutch)
Technical education and vocational training
Trade Related Aspects of Intellectual Property Rights
Used electrical and electronic equipment
Vendor-Managed Inventory Model (lenovo)
Wideband Code Division Multiple Access
World Trade Organization

References 83
REFERENCES
AFP (December 2008), “Sony to Close LCD TV Plant in Pennsylvania”, available at:
http://www.industryweek.com/companies-amp-executives/sony-close-lcd-tv-plant-
pennsylvania
Ali-Yrkkö, J. (2001), “Nokia’s Network – Gaining Competitiveness from Co-Operation”
Helsinki: Taloustieto (ETLA B 174).
Ali-Yrkkö, Jyrki (February 2011), “Who Captures Value in Global Supply Chains?” ETLA
(Research Institute of the Finnish Economy), available at:
http://brie.berkeley.edu/publications/WP_196.pdf
APCO Worldwide (December 2010), “China’s 12th Five-Year Plan”, available at:
http://apcoworldwide.com/content/PDFs/Chinas_12th_Five-Year_Plan.pdf
APEC Policy Support Unit (October 2009), “Trade Creation in the APEC Region:
Measurement of the Magnitude of and Changes in Intra-regional Trade since APEC’s
Inception”, available at: http://www.rcie-cn.org/**workshops/1209/papers/lee.pdf
APEC Policy Support Unit (April 2013), “Growth sustained by intra-regional trade,
investment and domestic consumption, noted APEC Trade Ministers”, available at:
http://www.apec.org/Press/News-Releases/2013/0420_monitor.aspx
Australia Department of Foreign Affairs and Trade (August 2012), “The APEC Region Trade
and Investment 2012” , available at: http://www.dfat.gov.au/**publications/stats-
pubs/**downloads/APEC_2012.pdf
Azis, Iwan J. (July 2012), “Asian Economic Integration Monitor”, Asian Development Bank,
Pg. 11-19, available at: http://aric.adb.org/pdf/aeim/AEIM_2012July_FullReport.pdf
Barfield, Claude (November, 2011), “Chinese Taipei and East Asian Regionalism” American
Enterprise Institute.
BNP Paribas (2012), “Smartphone Spotlight Q1’2012 Earnings Takeaways” , available at:
http://pg.jrj.com.cn/acc/Res/CN_RES/INVEST/2012/5/24/0ac1a434-b93b-48da-94d5-
871c96c1c446.pdf pg. 20-21
Börkey, Peter. (September 2012), “Case Study on Critical Metals in Mobile Devices” OECD,
available at:
http://search.oecd.org/officialdocuments/publicdisplaydocumentpdf/?cote=ENV/EPOC/WPR
PW(2012)4/FINAL&docLanguage=En
Business Week (November 2012), “Why Only Samsung Builds Phones that Outsell iPhones”,
http://www.businessweek.com/articles/2012-11-09/why-only-samsung-builds-phones-that-
outsell-iphones
Campbell, Joel (September 2012) “Building an IT Economy: South Korean Science and
Technology Policy” Pg.4. , available at:
http://www.brookings.edu/~/media/Research/Files/Papers/2012/9/12%20korean%20technolo
gy%20campbell/CTI_19%20_Korea_Tech_Paper_Formatted.pdf
Chito Salazar (1998), “Global Product Chains: Northern Consumers, Southern Producers,
and Sustainability: Semi-conductors from the Philippines” , available at:
http://www.inti.gov.ar/cadenasdevalor/documentacion/semiconduct.pdf
CNet (October 2012), “Lenovo: Making it in the U.S.A. (Q&A)” , available at:
http://news.cnet.com/8301-1001_3-57531906-92/lenovo-making-it-in-the-u.s.a--q-a/
References 84
CSIS (January 2013), “China’s Competitiveness - Myth, Reality, and Lessons for the United
States and Japan: Case study: Lenovo,”, Pg. 24, , available at:
http://csis.org/files/publication/130129_competitiveness_Lenovo_casestudy_Web.pdf
CSNS.com (January 2012), “…LCD TV Makers May Benefit from Undermined Partnership
between Sony and Samsung”, available at:
http://cens.com/cens/html/en/news/news_inner_38844.html
Davies, Chris. (February 2013), “BlackBerry Z10 teardown tips Samsung inspiration”
SlashGear, available at: http://www.slashgear.com/blackberry-z10-teardown-tips-samsung-
inspiration-12268936/
Decharuk, Krist (2009),“Thailand’s Investment in the Post-Crisis Era: Issues and Challenges”
Bank of Thailand, available at:
http://www.bot.or.th/English/EconomicConditions/Publication/Documents/dp042009_eng.pdf
Dedrick Jason (May 2008), “Globalisation of Innovation : The Personal Computing Industry”.
University of California, Irvine.
Dedrick, Jason; Kenneth Kraemer and Greg Linden (June 2009), “Who Profits from
Innovation in Global Value Chains? A Study of the iPod and notebook PCs.” Personal
Computing Industry Center, University of California Irvine,, available at: http://
web.mit.edu/is08/pdf/ _Linden.pdf
Dhekne, Rajesh & Chittal, Shyam Sadanand (May 2011), “Supply Chain Strategy For The
Consumer Electronics Industry.” Wipro. Available at:
http://www.wipro.com/documents/insights/The%20Future%20of%20Supply%20Chain%20St
rategy%20for%20Consumer%20Electronics.pdf
DigiTimes. (September 2011), “Elpida moves to cope with weak DRAM prices, strong yen”,
available at: http://www.digitimes.com/tag/elpida/003242.html
Dignan, Larry (March 2013), “Samsung's Galaxy S4: The supply chain halo effect,” ZDNet,
available at: http://www.zdnet.com/samsungs-galaxy-s4-the-supply-chain-halo-effect-
7000012623/
DisplaySearch (May 2006), “DisplaySearch 2006 TFT LCD and Component Market Trend”,
available at: http://www.scribd.com/doc/465871/LCD-Cost-Breakdown-2006-by-
Displaysearch
DisplaySearch. (March 2013), “Global LCD TV Shipments Fall for the First Time in 2012;
Outlook Cautious for 2013”, available at:
http://www.displaysearch.com/cps/rde/xchg/displaysearch/hs.xsl/130321_global_lcd_tv_ship
ments_fall_for_the_first_time_in_2012.asp
Duhigg, Charles and Bradsher, Keith. (January 2012), “How the U.S. Lost Out on iPhone
Work.” The New York Times, available at:
http://www.nytimes.com/2012/01/22/business/apple-america-and-a-squeezed-middle-
class.html?pagewanted=all
Duncan, Jeff (April 2012), “Can Kazuo Hirai save Sony?”, Digital Trends, available at:
http://www.digitaltrends.com/computing/can-kazuo-hirai-save-sony/
Economic Times (India) (January 2012), “Lenovo: How & why world's No. 2 computer
maker is building a brand worth its business” , available at:
http://articles.economictimes.indiatimes.com/2012-01-16/news/30627898_1_lenovo-pc-
business-dell
Economist Intelligence Unit (2009), “The demand-driven supply chain: A holistic approach”,
available at: http://www.oracle.com/uk/solutions/scm/localuk-scm/oracle-demand-driven-
supply-chain-321590-en-gb.pdf

References 85
Santiago, Ernie B. (2011), “The Philippine Electronics Industry,” SEIPI (Semiconductor and
Electronics Industries in the Philippines), available at:
http://www.germanclub.ph/ecoforum/The-Philippine-Semiconductor-and-Electronics-
Industry.pdf
Fernquest, Joe (February 2012), “Foreign Direct Investment: Charting the future.” Bangkok
Post, available at: http://www.bangkokpost.com/learning/learning-from-
news/278017/foreign-direct-investment-charting-the-future
Ferrari, Bob (March 2010), “Will Sony’s supply chain rise to yet another new challenge?”,
The Ferrari Group, available at: http://www.theferrarigroup.com/supply-chain-
matters/2010/03/12/will-sonys-supply-chain-rise-to-yet-another-new-challenge/
Ferrari, Bob (April 2013), “Two of the World’s Most Competitive Supply Chains Adjust to
Different Business Needs” The Ferrari Group, available at:
http://www.theferrarigroup.com/supply-chain-matters/tag/samsung-supply-chain
Fraunhofer Center for Sustainable Energy Systems. (2012) “Televisions, Computers, and Set-
top Boxes: The Big Three of 2010 Home Consumer Electronics Energy Consumption.”
Available at: http://www.aceee.org/files/proceedings/2012/data/papers/0193-000295.pdf
Gartner (2012), “Gartner Says Worldwide PC Shipments Declined 8 Percent in Third Quarter
of 2012 as the Market Prepares for the Launch of Windows 8” , available at:
http://www.gartner.com/it/page.jsp?id=2194017
Goldberg, Jonathan (May 2013), “The MediaTek Phenomenon: the new smartphone
disruption”, available at: http://www.visionmobile.com/blog/2013/05/the-mediatek-
phenomenon-the-new-smartphone-disruption/
Hardware Zone (May 2012), “Panasonic Suffers Record Loss, Plasma TV Sales in The Red”,
available at: http://www.hardwarezone.com.sg/tech-news-panasonic-suffers-record-loss-
plasma-tv-sales-red
Hira, Ron and Hira, Anil (2005), “Outsourcing America: What's Behind Our National Crisis
and How Can we Reclaim American Jobs” New York: American Management Association
Hsieh, David (May 2011), “Collaboration Between Sharp, Chimei Innolux, and Foxconn”,
available at:
http://www.displaysearch.com/cps/rde/xchg/displaysearch/hs.xsl/collaboration_between_shar
p_chimei_innolux_and_foxconn.asp
IDC (May 2012), “Worldwide Smartphone Market Continues to Soar…” , available at:
http://www.idc.com/getdoc.jsp?containerId=prUS23455612
IDC (January 2013), “Strong Demand for Smartphones and Heated Vendor Competition
Characterize the Worldwide Mobile Phone Market at the End of 2012” , available at:
http://www.idc.com/getdoc.jsp?containerId=prUS23916413#.UTi44daB3-p
IDC (January 2013), “Soft PC Shipments in Fourth Quarter Lead to Annual Decline as HP
Holds Onto Top Spot, According to IDC” , available at:
http://www.idc.com/getdoc.jsp?containerId=prUS23903013#.UUEME9aB3-p
IDC (2012), “Mobility Reigns as the Smart Connected Device Market Rises 29.1% in 2012
Driven By Tablet and Smartphone Growth”, available at
http://www.idc.com/getdoc.jsp?containerId=prUS23958513#.US5wz6KB3-o
IHS iSuppli (September 2012), “Troubled Japanese OEMs Drive Outsourced LCD TVs
Against In-House Production”, available at: http://www.isuppli.com/Manufacturing-and-
Pricing/MarketWatch/Pages/TroubledJapaneseOEMsDriveOutsourcedLCDTVsAgainst.aspx
IHS iSuppli (March 2013), “Samsung Galaxy S4 Carries $236 Bill of Materials, IHS iSuppli
Virtual Teardown Reveals”, available at: http://press.ihs.com/press-release/design-supply-
chain/samsung-galaxy-s4-carries-236-bill-materials-ihs-isuppli-virtual-t

References 86
IHS iSuppli Research (March 2013), “Preliminary Samsung Galaxy S4 Virtual Teardown
BOM Estimates”, available at:
http://press.ihs.com/sites/ihs.newshq.businesswire.com/files/2013-03-19_Samsung-S4-
Table1.jpg
Industry Leaders (December 2011), “Samsung Pays USD 934 Million as Sony Quits its LCD
Joint Venture”, available at: http://www.industryleadersmagazine.com/samsung-pays-us-934-
million-as-sony-quits-its-lcd-joint-venture/
International Monetary Fund (June 2011), “Changing Patterns of Global Trade”, the Strategy,
Policy, and Review Department, available at:
http://www.imf.org/external/np/pp/eng/2011/061511.pdf
Invest Korea “Displays”. Accessed on May 2, 2013, available at:
http://www.investkorea.org/ikwork/iko/eng/cont/contents.jsp?code=1020204
Invest Korea “Success Stories” , available at:
http://www.investkorea.org/ikwork/iko/eng/cont/contents.jsp?code=1020102
ITU (February 2013), “ICT Facts and Figures.” Pg. 1, available at: http://www.itu.int/ITU-
D/ict/facts/material/ICTFactsFigures2013.pdf
Izvorski, Ivailo (November 2009), “Transforming the Rebound into Recovery”, East Asia and
Pacific Economic Update, Volume 2. World Bank. Pg. 6, available at
https://openknowledge.worldbank.org/bitstream/handle/10986/2691/514980PUB0REVISION
0Box345550B01PUBLIC1.pdf?sequence=1
Japan Electronics & Information Technology Industries Association (JEITA) & Japan
Electrical Manufacturers’ Association (JEMA) (September 2009). “Energy Efficient Products:
Technology and Supply Chains.”
Japan Research Institute of Economy, Trade and Industry,. “RIETI-TID database.” Accessed
March 26, 2013. http://www.rieti-tid.com/trade.php
Japan Ministry of Economy, Trade and Industry (2012) “Mekong Development Roadmap” ,
available at:
http://www.meti.go.jp/policy/trade_policy/east_asia/dl/Mekong_Develop_Roadmap.pdf
Japan Ministry of Economy, Trade, and Industry (July 2012), “42nd Overseas Business
Survey.”
Jiang, Jason (March 2013), “Samsung Galaxy S4: Who are at the bottom layer of the supply
chain” iTiers News, available at: http://itersnews.com/?p=26667
Jung Hur, Hyun-Hoon Lee (August 2012) “APEC Indeed Has Created Intra-regional Trade: A
Systematic Empirical Analysis” , available at:
http://cc.kangwon.ac.kr/~**hhlee/paper/Hur_Lee_120807.pdf
Jurichich, Steve (2007), “Summary of The TFT LCD Materials Report” , available at:
http://www.displaysearch.com/products/samples/execsummary-materials.pdf
Kachainchai, Vorawit and Weerawat, Waressara (2010), “Supplier Evaluation And Selection
In Thailand's Hard Disk Drive Industry” Mahidol University, available at:
http://www.internationalconference.com.my/proceeding/icber2010_proceeding/PAPER_137_
SupplierEvaluation.pdf
Kadarusman, Yohanes. (July 2012), “Knowledge Acquisition: Lessons from Local and Global
Interaction in the Indonesian Consumer Electronics Sector.” Prasetiya Mulya Business School,
available at: http://ijie.um.edu.my/filebank/published_article/3943/Fulltext4.pdf
Kakuli, Anna & Schipper, Iren. (November 2011), “Out of Focus: Labour Rights in Viet
Nam’s Digital Camera Factories.” Swedwatch, available at:
http://www.swedwatch.org/sites/default/files/vietnamrreport_final171111.pdf

References 87
Korea Associates Business Consultancy Ltd (February 2012), “Global Value Chain Analysis
on Samsung Electronics” , available at:
http://albertacanada.com/korea/images/GlobalValueChainAnalysisSamsungElectronics.pdf
Kraemer, Kenneth; Linden, Greg and Dedrick, John (July 2011), “Capturing Value in Global
Networks: Apple’s iPad and iPhone” , available at:
http://pcic.merage.uci.edu/papers/2011/Value_iPad_iPhone.pdf
LEDinside (May 2011), “LED Perspective from Mr. Feng-Ren Chien, Chairman of Formosa
Epitaxy”, available at: http://www.ledinside.com/interview/2011/5/professional_forepi
LEDinside (March 2012), “New LED TVs fueled LED utilization rate”, available at:
http://electronicsfeed.com/news/1868
Lee, Jewon (May 2011), “Korean Electronics Industry”. Pg.3. http://www.tsb-
berlin.de/media/uploads/artikel/korean_electronic_industry.pdf
Lee, Zon-Yau. (2012), “Integrating Grey Relational Analysis and Multi-Dimensional
Scaling for TFT-LCD Competitiveness” International Proceedings of Economics
Development and Research, available at: http://www.ipedr.com/vol43/017-ICFME2012-
M10026.pdf
Lemon, Sumner. (March 2010), “AUO to Acquire Toshiba LCD Plant in Singapore”, IDG
News Service, available at: http://www.pcworld.com/article/192993/article.html
Lenovo (October 2012), “Lenovo to Open Computer Manufacturing Line in the United
States” , available at: http://news.lenovo.com/article_display.cfm?article_id=1635
Lenovo (2012), “Sustainability for the PC+ Era.”, available at:
http://www.lenovo.com/social_responsibility/us/en/FY2012_Lenovo_Sustainability_Report.p
df
Liedtke, Michael (May 2013), ‘‘Intel’s CEO pick sticks to tried-and-true formula’’, available
at: http://www.journal-news.net/page/content.detail/id/594136/Intel-s-CEO-pick-sticks-to-
tried-and-true-formula.html?nav=5061
Malaysian Investment Development Authority (MIDA) (September 7, 2011), “Electrical and
Electronics Industry,” Available at: http://www.mida.gov.my/env3/index.php?page=ee
Marca Pais – Imagen de Mexico (October 2011), “Mexican Consumer Electronics Industry
Second Largest Supplier of Electronics to the United States Market,” , available at:
http://www.prnewswire.com/news-releases/mexican-consumer-electronics-industry-second-
largest-supplier-of-electronics-to-the-us-market-131233479.html
McKinsey Global Institute (November 2012) “Manufacturing the future: The next era of
global growth and innovation” Pg. 29, available at:
http://www.mckinsey.com/insights/manufacturing/the_future_of_manufacturing
Mexico Today (November 2011), “Mexico’s Flourishing Electronics Industry: 8 out of 10 of
the World’s Largest Electrical and Electronics Companies Are Doing Business in Mexico” ,
available at: http://mexicotoday.org/article/mexico%E2%80%99s-flourishing-electronics-
industry-8-out-10-world%E2%80%99s-largest-electrical-and-electronic
Morgan Stanley (May 2012), “Tablet Landscape Evolution”: Pg. 29, available at:
http://www.morganstanleyfa.com/public/projectfiles/bd5f553e-719f-4e6f-886c-
e92829767590.pdf
Negishi, Mayumi, Hamada, Kentaro (October 2011), “Japan's Murata sees muted recovery,
no yr-end demand surge”, Reuters, available at:
http://uk.reuters.com/article/2011/10/04/idUKL3E7L41G420111004
NexTV Latam (January 2013). “Tijuana leads digital TV set manufacturing”, available at:
http://nextvlatam.com/index.php/7-cross-tv/tijuana-leads-digital-tv-set-manufacturing/

References 88
Nomura. (2012), “Nomura 2012 Smartphone Guide” , available at:
http://images.businessweek.com/bloomberg/pdfs/nomura_smartphone_poster_2012.pdf
Novatek website, accessed May 16, 2013: http://www.novatek.com.tw/index.asp
OECD (2012), “Skill Pathways Asia”, available at: http://www.oecd-
ilibrary.org/docserver/download/5k94hdlll7vk.pdf?expires=1368213215&id=id&accname=gu
est&checksum=B359CE4992AFE53C2D9607FBD5C5A99C
Philippines Board of Investments. (February 2011), “The Philippine Electronics Industry
Profile” , available at: http://www.investphilippines.gov.ph/downloads/sector/Electronics.pdf
PIDA (May 2010), “LED-Backlit Displays And Street Lighting Fuel Chinese Taipei’s LED
Growth”, available at: http://www.compoundsemiconductor.net/csc/features-
details.php?id=19731913
Pro Mexico Trade & Investment (November 2011), “Electronic Industry, Plug & Succeed” ,
available at: http://negocios.promexico.gob.mx/english/09-2011/art01.html
PRWeb (September 2011), “Senior supply chain executives from Intel, Lenovo & Epson
discussed challenges facing hi-tech supply chains, and obstacles facing hi-tech distribution in
APAC in a Q&A discussion with eyefortransport” , available at:
http://www.prweb.com/releases/2011/9/prweb8760385.htm
Qasim, Asim. (May 2011), “Linking Health with Global Production Networks: The Case of
the Personal Computer Industry”, available at:
http://www.globalhealthequity.ca/electronic%20library/Linking%20health%20with%20Globa
l%20Production%20Networks.pdf
Quarterman, Lee (June 2012), “Apple, Foxconn & Manufacturing Strategy” Strategos, Inc. Pg.
10, available at: http://www.strategosinc.com/downloads/Apple-Foxconn-dl1.pdf
Quillin, Bryce (May 2012), “Capturing New Sources of Growth”, World Bank East Asia and
Pacific Economic Update 2012, Volume 1. Pg. 4-12, available at:
http://siteresources.worldbank.org/inteaphalfyearlyupdate/resources/550192-
1337701176079/eap-update-may-2012-full-report.pdf
Rassweiler, Andrew. “Motorola WX395-MediaTek Based Handset for Asian Markets”,
iSuppli, available at: http://www.isuppli.com/Teardowns/Pages/Motorola-WX395-MediaTek-
Based-Handset-for-Asian-Markets.aspx
Raymond Allan G. Vergara (September 2012), “Samsung Electronics and Apple, Inc.: A
Study in Contrast in Vertical Integration in the 21st Century”, available at:
http://www.aijcrnet.com/journals/Vol_2_No_9_September_2012/9.pdf
Reuters (April 2012), “Flat TV battle: Why Samsung, LG are dominating Sony, Panasonic”,
available at: http://profit.ndtv.com/news/corporates/article-flat-tv-battle-why-samsung-lg-are-
dominating-sony-panasonic-302744
Roush, Matt (January, 2012), “Element Electronics: America Matters”, CBS News, available
at: http://detroit.cbslocal.com/2012/01/11/element-electronics-america-matters/
Samsung (2012), ”Global Harmony with people, society & environment”, available at:
http://www.samsung.com/us/aboutsamsung/sustainability/sustainabilityreports/download/201
2/2012_sustainability_rpt.pdf
Satō, Yukihito (December 2012), “What the Sharp-Foxconn Tie-up Suggests”, Nippon.com. ,
available at: http://www.nippon.com/en/currents/d00057/
Seth, Radhika (October 2012), “Murata as an Apple supplier is doing nifty in the smartphone
business”, Japan Daily Press, available at: http://japandailypress.com/murata-as-an-apple-
supplier-is-doing-nifty-in-the-smartphone-business-0314339
Shen, Steve (March 2013), “MediaTek to slash handset solution prices in April, says paper.”
DigiTimes, available at: http://www.digitimes.com/news/a20130322PB200.html

References 89
Shintaku, Junjiro (February 2012), “Supply Chain Network of IT Industry in East Asia: From
the Viewpoint of Japan’s Core Competence”, University of Tokyo, available at:
http://merc.e.u-tokyo.ac.jp/mmrc/dp/pdf/MMRC382_2012.pdf
Shinoda, Kunihiko (December 2010), “Mekong-Japan Industry and Government Dialogue.”
Ministry of Economy, Trade and Industry of Japan, available at:
http://www.mofa.go.jp/region/asia-paci/mekong/fppp1012/pdfs/shinoda.pdf
Shipp, Stephanie (March 2012), “Emerging Global Trends in Advanced Manufacturing”,
Institute for Defense Analysis, available at: https://www.ida.org/upload/stpi/pdfs/p-
4603_final2a.pdf pg. 68
Singapore Economic Development Bureau “Electronics Facts” , available at:
http://www.sedb.com.cn/etc/medialib/downloads/industries.Par.43687.File.tmp/Electronics%
20Factsheet.pdf.tmp/.pdf
Strategy Analytics (March 2011), “2010 Smartphone Applications Processor Market
Review” , available at: http://blogs.strategyanalytics.com/HCT/post/2011/03/21/2010-
Smartphone-Applications-Processor-Market-Review.aspx
Strategy Analytics (2012), “Samsung Galaxy S3 Becomes World's Best-Selling Smartphone
Model in Q3 2012” , available at:
http://www.strategyanalytics.com/default.aspx?mod=pressreleaseviewer&a0=5301
Supply Chain Movement (April 2010), “Sony sells Slovakian LCD factory to Foxconn”,
available at: http://www.supplychainmovement.com/sony-sells-slovakian-lcd-factory-to-
foxconn/
Sweta, Dash (June 2012) “Chinese Suppliers Shine in Large-Sized LCD Panel Market in
Q1” , available at: http://www.isuppli.com/Display-Materials-and-
Systems/News/pages/Chinese-Suppliers-Shine-in-Large-Sized-LCD-Pane-lMarket-in-
Q1.aspx
TalentCorp (Malaysia) (2012), “Talent – The Key to Vision 2020.” , available at:
http://www.talentcorp.com.my/wp-content/themes/agenda/TC_Chapter1.pdf
Thorbecke, Willem (April 2012), “East Asian Supply Chains and Relative Prices: A survey of
the evidence”, Research Institute of Economy, Trade and Industry Policy Discussion Paper
Series 12-P-006, available at: http://www.rieti.go.jp/jp/publications/pdp/12p006.pdf
Tsan Wen-Nan; Chang, Chi; Lin, Bo-Chi; Han, Wen-Yao; and Chu, Nan-Shiun. (August
2012), “The Industrial Specialization and Economic Contribution of the Smartphone Supply
Chain: The Case of Apple and HTC”, Market Intelligence & Consulting Institute, Institute for
Information Industry, Chinese Taipei. Pg. 179
United States Central Intelligence Agency, The World Fact Book: South Korea (last updated
on April 29, 2013), Accessed on May 2, 2013, available at:
https://www.cia.gov/library/publications/the-world-factbook/geos/ks.html
United States Geological Survey “Commodity Statistics and Information”, accessed May 10,
2013, available at: http://minerals.usgs.gov/minerals/pubs/commodity/
United States Securities and Exchange Commission, “FORM 20-F REPORT – Nokia
Corporation”. Pg. 36
USA Today (June 2012), “Samsung, LG bet on new display to revive TV sales”, available at:
http://usatoday30.usatoday.com/tech/news/story/2012-06-20/samsung-LG-
displays/55708330/1
Vergara, Raymond Allan (September 2012), “Samsung Electronics and Apple, Inc.: A Study
in Contrast in Vertical Integration in the 21st Century.” De La Salle University, available at:
http://www.aijcrnet.com/journals/Vol_2_No_9_September_2012/9.pdf

References 90
Victoria Sun, (Octobre 2007), “Neutrality Makes Many Friends.” CommonWealth magazine,
available at: http://english.cw.com.tw/article.do?action=show&id=3384
Vingkam, Lai and Choon Heng, Leong. “Accelerating Innovations in Malaysian Industry
Supply Chains,” Institute of Supply Chain Management at Malaysia University of Science
and Technology, available at:
http://innovation.my/pdf/innovating_formulation_of_nis/Accelerating%20Innovations%20in
%20Malaysian%20Industry%20Supply%20Chains.pdf
Wall Street Journal (March 2012), “Japanese LCD Alliance Frays”, available at:
http://online.wsj.com/article/SB10001424052702303816504577308503993925284.html
Wall Street Journal (July 2012), “As Rivals Outsource, Lenovo Keeps Production In-House,” ,
available at:
http://online.wsj.com/article/SB10001424052702303302504577325522699291362.html
Wall Street Journal (January 2013), “Compal: Hefei Factory With Lenovo Has Started Mass
Production” , available at: http://online.wsj.com/article/BT-CO-20130118-
700945.htmlhttp://web.mit.edu/is08/pdf/Globalization%20of%20Innovation%20PC.PDF
Want China Times (September 2011), “Tablet demand fuels earnings at Taiwan's Simplo”,
available at: http://www.wantchinatimes.com/news-subclass-
cnt.aspx?id=20110901000056&cid=1206
Want China Times. (May 15, 2013) “Sony to cut ODM contract orders as yen depreciates”,
Available at: http://www.wantchinatimes.com/news-subclass-
cnt.aspx?id=20130515000004&cid=1102&MainCatID=11
Wharton School of Business, University of Pennsylvania (March 2012), “Vertical Integration
Works for Apple -- But It Won’t for Everyone”, available at:
http://knowledge.wharton.upenn.edu/article.cfm?articleid=2959
World Bank “Exports of Goods and Services”. Accessed on May 2, 2013, available at:
http://data.worldbank.org/indicator/NE.EXP.GNFS.ZS
World Trade Organization “International Trade Statistics 2012.”, available at:
http://www.wto.org/english/res_e/statis_e/its2012_e/its2012_e.pdf (2012): pg. 98
Wright, Jonathan. “Wage Increases in China: Should Multinationals Rethink their
Manufacturing and Sourcing Strategies?” Accenture. (2011) Available at
http://www.accenture.com/SiteCollectionDocuments/PDF/Accenture_Wage_Increases_in_Ch
ina.pdf
WTO statistics Database, available at:
http://stat.wto.org/Home/WSDBHome.aspx?Language=E
Wu, Michael (2013) “Samsung reportedly increasing purchases of memory products from
outside”, available at: http://www.digitimes.com/news/a20130411PD203.html
Xing, Yuqing (June, 2011), “China’s High-tech Exports: Myth and Reality”, National
Graduate Institute for Policy Studies, available at: http://r-center.grips.ac.jp/gallery/docs/11-
05.pdf
Zhan, James (2005), “A Case Study of the Electronics Industry in Thailand”, United Nations,
available at: http://unctad.org/fr/Docs/iteipc20056_en.pdf
Zapko, John (September 2012), “Inside Lenovo’s Hybrid Supply Chain Strategy”, Lenovo
GSC, available at: http://supply-chain.org/f/Zapko-
Inside_Lenovos_Hybrid_Supply_Chain_Strategy.pdf
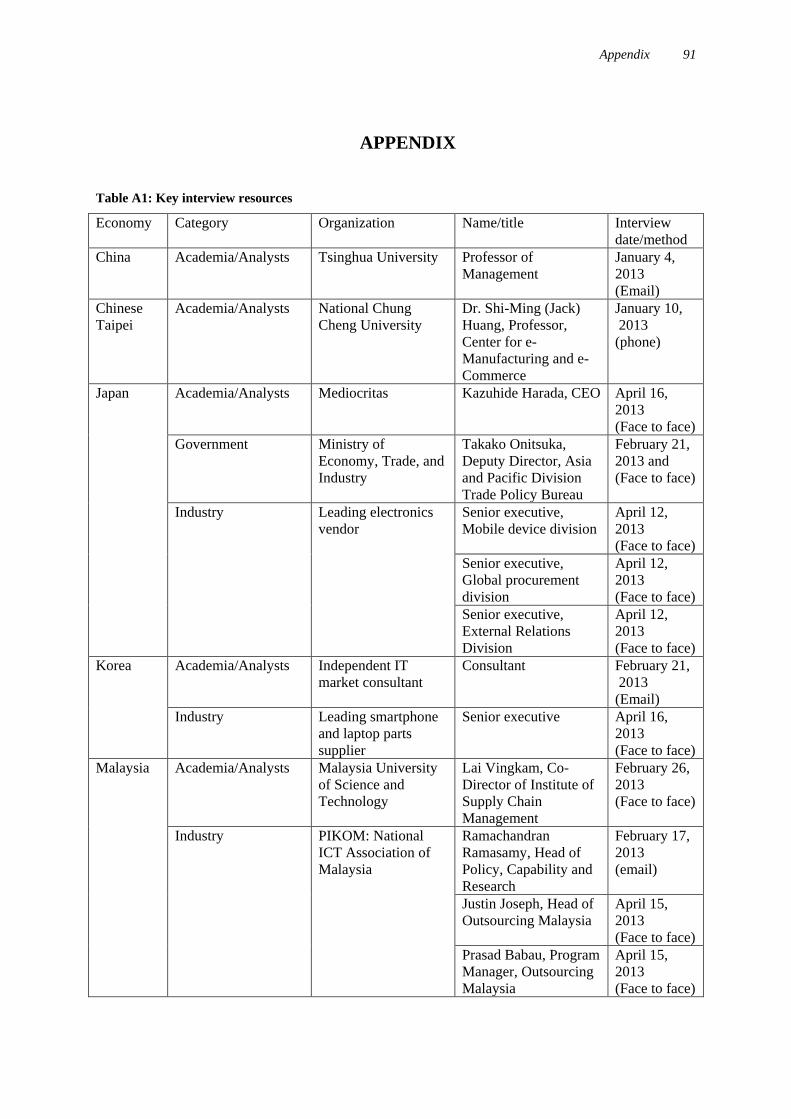
Appendix 91
APPENDIX
Table A1: Key interview resources
Economy Category Organization Name/title Interview
date/method
China Academia/Analysts Tsinghua University Professor of
Management
January 4,
2013
(Email)
Chinese
Taipei
Academia/Analysts National Chung
Cheng University
Dr. Shi-Ming (Jack)
Huang, Professor,
Center for e-
Manufacturing and e-
Commerce
January 10,
2013
(phone)
Japan Academia/Analysts Mediocritas Kazuhide Harada, CEO April 16,
2013
(Face to face)
Government Ministry of
Economy, Trade, and
Industry
Takako Onitsuka,
Deputy Director, Asia
and Pacific Division
Trade Policy Bureau
February 21,
2013 and
(Face to face)
Industry Leading electronics
vendor
Senior executive,
Mobile device division
April 12,
2013
(Face to face)
Senior executive,
Global procurement
division
April 12,
2013
(Face to face)
Senior executive,
External Relations
Division
April 12,
2013
(Face to face)
Korea Academia/Analysts Independent IT
market consultant
Consultant February 21,
2013
(Email)
Industry Leading smartphone
and laptop parts
supplier
Senior executive April 16,
2013
(Face to face)
Malaysia Academia/Analysts Malaysia University
of Science and
Technology
Lai Vingkam, Co-
Director of Institute of
Supply Chain
Management
February 26,
2013
(Face to face)
Industry PIKOM: National
ICT Association of
Malaysia
Ramachandran
Ramasamy, Head of
Policy, Capability and
Research
February 17,
2013
(email)
Justin Joseph, Head of
Outsourcing Malaysia
April 15,
2013
(Face to face)
Prasad Babau, Program
Manager, Outsourcing
Malaysia
April 15,
2013
(Face to face)

Appendix 92
Singapore Academia/Analysts Singapore
Management
University
Professor of Marketing January 18,
2013
(phone)
Thailand Academia/Analysts Electronics industry
association
Program Manager March 3,
2013
(Phone)
United
States
Industry Consumer
Electronics
Association
Brian Markwalter,
Senior Vice President
of Technology and
Standards
February 21,
2013
(Phone)
Shawn Dubravac,
Chief Economist and
Director of Research
February 21,
2013
(Phone)
Viet Nam Academia/Analysts Royal Melbourne
Institute of
Technology Viet
Nam
Professor of
Management
February 7,
2013
(Phone)
Table A2: OECD Top 250 Global ICT Firms by Economy
OECD. “OECD Internet Economy Outlook 2012.” (2012)