global soil resources base: degradation … · productivity increase between 1900 and 2000...
TRANSCRIPT

C-MASC 04-09
GLOBAL SOIL RESOURCES
BASE: DEGRADATION AND
LOSS TO OTHER USES
R. Lal
Carbon Management and Sequestration Center
The Ohio State University
Columbus, OH 43210 USA

WORLD POPULATION GROWTH
Year Population (Billions) Growth Rate (%/y)
1650 0.550 -
1750 0.725 0.276
1850 1.175 0.483
1900 1.60 0.617
1930 2.00 0.744
1950 2.56 1.23
195 4.00 1.78
1980 4.48 2.27
1986 5.00 1.83
1990 5.33 1.60
1995 5.68 1.27
2000 6.13 1.52
2025 8.18 1.15
(Bartlett, 2004)

PRODUCTIVITY INCREASE BETWEEN
1900 AND 2000 (PONTING, 2007)
Parameter
Increase Factor Between
1900-2000
Population 3.8
Urban Population 12.8
Industrial output 35
Energy Use 12.5
Oil Production 300
Water Use 9
Irrigated Area 6.8
Fertilizer Use 342
Fish Catch 65
Organic Chemicals 1000
Car Ownership 7750

EMISSION FROM FOSSIL FUEL COMBUSTIONYear Emissions (Tg C/y)
1750 3
1800 8
1850 54
1860 91
1880 236
1900 534
1920 932
1940 1299
1960 2535
1980 5155
1990 5931
1995 6190
2000 6299
2005 7000
2008 8000
(Kondratyev et al., 2003; Marland
et al., 2001; IPCC, 2007)

C-MASC 04-09
HUMANS AND LAND
RESOURCES
Humans have converted a third of the land area
- almost 3.8 billion hectares - to agriculture and
urban or build up areas. Most of the remainder
land is unsuitable for agriculture.

GLOBAL TRENDS IN
AGRICULTURAL LAND
C-MASC 04-09
Year
Area (106 ha)
Cropland Grazing Land Pasture
1700 265 6860 -
1850 537 6837 -
1920 913 6748 -
1950 1117 6780 -
1980 1346 6788 3244
1990 1396 - 3368
2000 1398 - 3442
(Richards, 1900; FAO, 2008)

WORLD IRRIGATED LAND AREA(Brown, 2000; FAO, 2005)
Year Area Irrigated (106 ha) %
1950 97 8.6
1960 135 11.3
1972 176 13.1
1980 210 14.5
1990 244 16.1
2000 275 17.9
2003 277 18.0
~ 20% of irrigated land is salinized
C-MASC 04-09

THE HABER-BOSCH PROCESS
3 CH4 + 6H2O 3 CO2 + 12 H2
12 H2 + 4 N2 8 NH3
C-MASC 04-09

GLOBAL FERTILIZER USE(IFDC, 2004; Tilman et al., 2001)
Year
Area (106 Mg/yr)
N P K Total
1950 <10 - - <10
1960 11.6 10.9 8.7 31.2
1970 31.8 21.1 16.4 73.3
1980 60.8 31.7 24.2 116.7
1990 77.2 36.3 4.5 138.0
2000 80.9 32.5 21.8 135.2
2020 135.0 47.6 -
2050 236.0 83.7 -
C-MASC 04-09


C-MASC 11-08
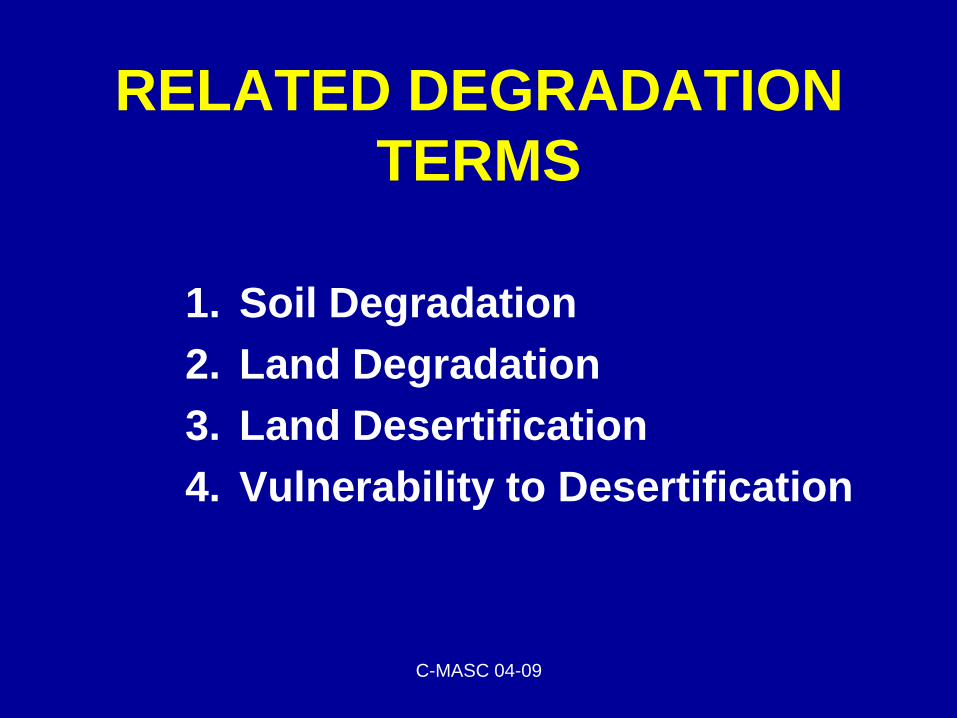
RELATED DEGRADATION
TERMS
1. Soil Degradation
2. Land Degradation
3. Land Desertification
4. Vulnerability to Desertification
C-MASC 04-09

C-MASC 04-09
SOIL DEGRADATION
It reduced agricultural productivity by ~15%
between 1950 and 2000. For three centuries
ending in 2000, topsoil has been lost at the rate of
300 million tons/yr. Between 1950 and 2000,
topsoil was lost at the rate of 760 millions tons per
year.

Biological Processes of Soil Degradation

Processes, Causes, and Factors of Soil Degradation

Interactive effects of biophysical factors and human dimensions
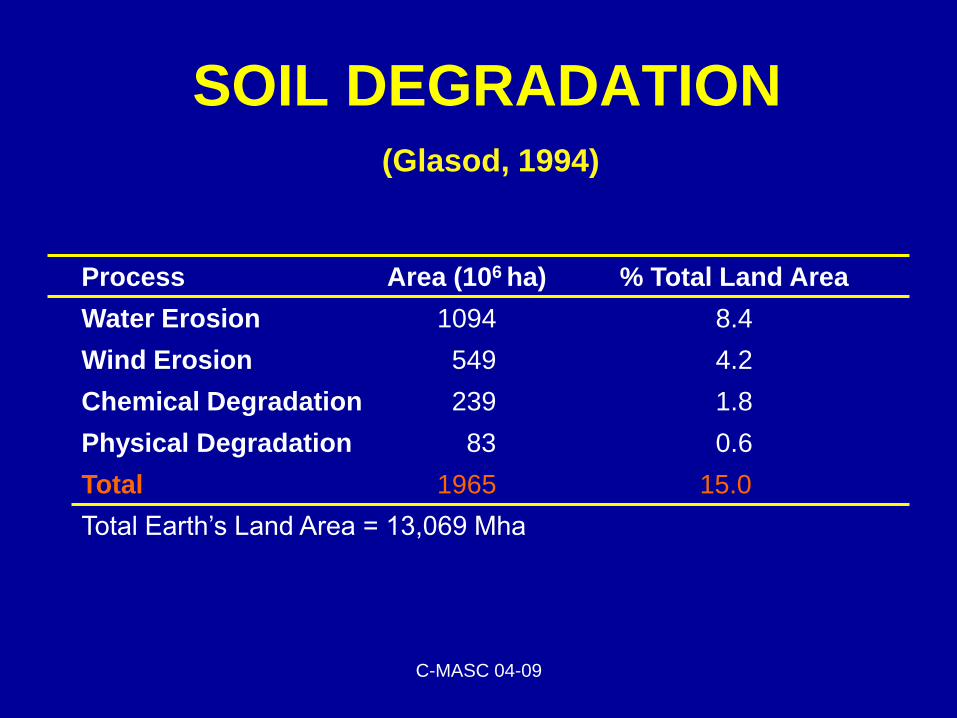
SOIL DEGRADATION
Process Area (106 ha) % Total Land Area
Water Erosion 1094 8.4
Wind Erosion 549 4.2
Chemical Degradation 239 1.8
Physical Degradation 83 0.6
Total 1965 15.0
Total Earth’s Land Area = 13,069 Mha
C-MASC 04-09
(Glasod, 1994)

CONTINENTAL DISTRIBUTION OF SOIL
DEGRADATION
Continental Area (106 ha)
% Total Degraded
Land Area
Asia 749 28.1
Africa 494 25.1
South America 243 12.4
Europe 218 11.1
Oceania 102 5.2
North America 96 4.9
Central America 63 3.2
Total 1965 100
C-MASC 04-09
(Glasod, 1994)

ESTIMATES OF DESERTIFICATION
IN ARID LANDS
Desertified Land Area Desertification (106ha)
Irrigated 43
Rainfed Cropland 216
Rangeland (Soil & Veg.) 757
Rangeland (Veg.) 2576
Total 3592
Total Arid Land Area 5172
% Desertified 69.5
C-MASC 04-09
(UNEP, 1991)

ESTIMATES OF DESERTIFICATION
IN ARID LANDS
Process Area Desertified (106ha)
Water Erosion 478
Wind Erosion 513
Chemical Degradation* 111
Physical Degradation 35
Total 1137
% Degraded 22.0
* ~ 54 M ha of chemically degraded land is salinized
C-MASC 04-09
(Glasod, 1998)

VULNERABILITY TO DESERTIFICATION(Eswaran et al., 2001)
Class Area Affected (106ha) % of Global Land Area
Low 1460 11.2
Moderate 1361 10.5
High 712 5.5
Very High 791 6.1
Total 4324 33.3
C-MASC 04-09

LAND DEGRADATION BY NDVI(Bai et al., 2008)
Parameter Value
Area degraded (106 ha) 3506
% of land area 23.5
Total NPP loss (Tg C/y) 955
Total Population affected (billion) 1.54
% Total Population 23.9
C-MASC 04-09

C-MASC 04-09
Conversion of Soil to
Non-Agricultural Uses
�UrbanizationIndustrialization Military Uses
Residential Infrastructure RecreationWaste
Disposal
ManufacturingFoodProcessing
• Contamination
• Pollution
• Testing
• Firing ranges
• Training
• Security Buffers
• Accommodation
• Health Services
• Roads
• Airports
• Shopping Malls
• Shipyards
• Golf Courses
• Parks
• Sport Arenas
Reduction in soil resources base through conversion to non-agricultural uses

C-MASC 04-09

OTHER LAND USES
Land Use Area (106 ha)
Urbanization 351
Plantations 142
Pollution 22
C-MASC 04-09

SOIL DEGRADATION
QUESTIONS TO BE ADDRESSED
1. Credible estimates of soil degradation.
2. Interaction between processes, factors and causes.
3. Impact of soil degradation on ecosystem services.
4. How to restore degraded soils.
5. Land use and management to minimize degradation risks.
6. Impact in food security and human nutrition.
7. Policy interventions to reverse degradation.
8. How to enhance soil resilience.
9. How to improve communication among stake holders.
10
.
Creating a central data bank.
C-MASC 04-09

C-MASC 04-09
LAW #1
CAUSES OF SOIL DEGRADATION
The biophysical process of soil
degradation is driven by economic,
social and political forces.

C-MASC 04-09
LAW #2
SOIL STEWARDSHIP AND
HUMAN SUFFERING
When people are poverty stricken,
desperate and starving, they pass on their
sufferings to the land.

C-MASC 04-09
Law #3
NUTRIENT, CARBON AND WATER
BANK
It is not possible to take more out of a soil
than what is put in it without degrading its
quality.
C-MASC 04-09

C-MASC 04-09
LAW #4
MARGINALITY PRINCIPLE
Marginal soils cultivated with marginal
inputs produce marginal yields and
support marginal living.

THE ULTIMATE RECYCLING
AN IMPOSSIBLE ECOSYSTEM

C-MASC 04-09
LAW #5
ORGANIC VERSUS INORGANIC
SOURCE OF NUTRIENTS
Plants cannot differentiate the nutrients
supplied through inorganic fertilizers or
organic amendments.

C-MASC 04-09
LAW #6
SOIL CARBON AND GREENHOUSE
EFFECT
Mining C has the same effect on global warming whether it is through mineralization of soil organic matter and extractive farming or burning fossil fuels or draining peat soils.

CARBON BALANCE
Gains
Losses
Residues
Compost
Root biomass
Erosion
Decomposition
Leaching
Soil Carbon DepletionC-MASC 04-09
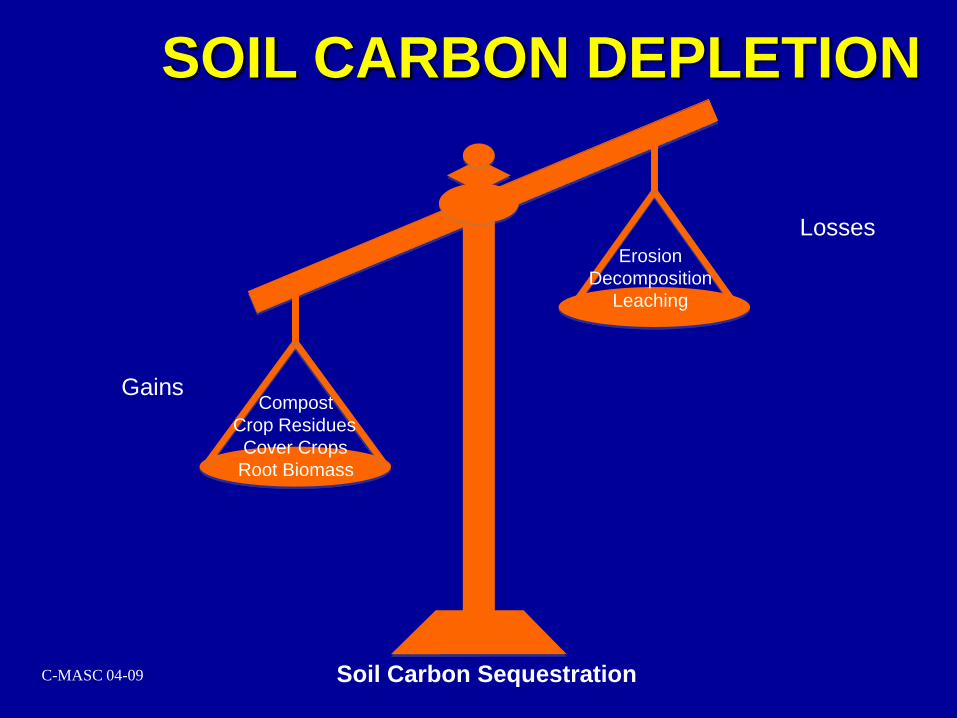
Soil Carbon Sequestration
SOIL CARBON DEPLETION
Gains
LossesErosion
Decomposition
Leaching
Compost
Crop Residues
Cover Crops
Root Biomass
C-MASC 04-09

C-MASC 04-09
LAW #7
SOIL VERSUS GERMPLASM
Even the elite varieties cannot extract
water and nutrients from any soil where
they do not exist.

C-MASC 04-09
Law #8
Soil As Sink For Atmospheric CO2
Soil are integral to any strategy of
mitigating global warming and
improving the environment

C-MASC 03-09
LAW #9
ENGINE OF ECONOMIC
DEVELOPMENT
Sustainable management of soils is the
engine of economic development, political
stability and transformation of rural
communities in developing countries.

C-MASC 04-09
Law #10
TRADITIONAL KNOWLEDGE AND
MODERN INNOVATIONS
• Sustainable management of soil implies
the use of modern innovations built
upon the traditional knowledge.
• Those who refuse to use modern
science to address urgent global issues
must be prepared to endure more
suffering.

C-MASC 04-09
NOT TAKING SOILS FOR
GRANTEDIf soils are not restored, crops will fail even if rains do
not; hunger will perpetuate even with emphasis on
biotechnology and genetically modified crops; civil
strife and political instability will plague the developing
world even with sermons on human rights and
democratic ideals; and humanity will suffer even with
great scientific strides. Political stability and global
peace are threatened because of soil degradation, food
insecurity, and desperateness. The time to act is now.
Lal (Science, 2008)

DESTINY
“By the law of Karma, you are in control
of your own destiny. It is, therefore,
important to care for hills and
cows…and protect the forests than
worship Indra”.
Srimad Bhagavatam
10.35C-MASC 04-09