global shipping benchmarking survey 2009 - unipi · pdf filethis benchmarking study looks at...
TRANSCRIPT
Shipping Industry Group
Global Shipping Benchmarking Survey 2009

1. Impact of the economic crisis on the shipping industry1.1 Sharp decline in hire rates
1.2 Shortage of trade finance
1.3 Significant orderbook
1.4 Breaches in loan covenants
1.5 Recognised impairment losses
1.6 Going concern considerations 1.7 Concluding remarks
2. Financial Performance Benchmarks2.1 Background
2.2 Benchmark model
2.3 Results summary by sub-sector
2.4 Results by key performance indicator
Analysis of companies participating in the survey
Appendices1. Ratio Definitions2. List of participating shipping companies
Contacts
p.4
p.5
p.6
p.7
p.8
p.9
p.10
p.11
p.12
p.14
p.17
Contents

Over the last few years, the global shipping industry has experienced a period of exceptional growth and prosperity. This was followed by an abrupt and dramatic decline in world trade in the second half of 2008, which has led to a decrease in freight rates and vessel values, and has diminished returns.
In the current economic environment of exceptional volatility and significant uncer-tainty, shipping companies face many challenges, particularly with regard to manag-ing their cash flows, raising appropriate finance to meet long term commitments and maximising returns for shareholders.
This benchmarking study looks at some of the key performance indicators (KPIs) of publicly listed and private global shipping companies for the year ended 31 Decem-ber 2008 and how these have evolved over the last 5 years for each major shipping industry sub-sector. It also seeks to identify what impact the economic crisis has had on the industry up to 31 December 2008 by analysing some of the data from the 2008 annual reports in more detail.
We trust you will find the study interesting and a means to look deeper into how your own company has fared against other companies in the industry and your sub-sector.
PricewaterhouseCoopers Shipping Industry professionals are available to discuss the results with you in more detail, perform a detailed comparison of your company to the companies in the survey and analyse the results in order to obtain an understanding of the key drivers and derive meaningful conclusions that facilitate decision making.
We continue to monitor developments in the shipping industry and are committed to providing timely and relevant advice to assist you in meeting the challenges you face or exploiting the opportunities that will set you apart.
Wishing you every success in your endeavours,
Socrates Leptos-BourgiGlobal Shipping & Ports Leader
Foreword

1.1 Sharp decline in hire rates
It is often said that the shipping industry is highly cyclical with significant fluctuations in hire and freight rates between cycles. However, never before have the volatility and fluctuations in the shipping industry been as significant as they have been in 2008.
Furthermore, when comparing the LL-Bloomberg top 50 shipping index to the DJ World 1 index for the period from May 28th 2004 to September 1st 2009, the shipping industry appears to have been harder hit by the crisis than other industries.
DJ World 1 index versus LL-Bloomberg top 50 shipping index since May 2004
According to broker reports, in the dry bulk sub-sector a capesize vessel could be fixed for USD 304,000/day in June 2008 and for just USD 2,000/day by November 2008. In the container sub-sector, the time charter rate for a 2,750 teu container has dropped downwards from USD 20,500/day in September to USD 9,000/day in December 2008. In the Tanker sector, despite the onset of a deep economic
4.000
3.500
3.000
2.500
2.000
1.500
1.000
500
350
300
250
200
150
100
50
028
-5-0
422
-7-0
413
-8-0
48-
11-0
47-
1-05
1-3-
0528
-4-0
520
-5-0
512
-8-0
54-
10-0
523
-11-
0520
-1-0
619
-3-0
65-
5-06
27-6
-06
18-8
-06
6-10
-06
27-1
1-06
24-1
-07
13-3
-07
8-5-
0720
-8-0
721
-8-0
711
-10-
073-
12-0
730
-1-0
83-
2-08
12-5
-08
21-8
-08
10-1
0-08
3-12
-08
29-1
-09
23-3
-09
14-5
-09
8-7-
0925
-8-0
9
Top 50 shipping index DJ World 1 index
Impact of the economic crisis on the shipping industry
recession and falling oil demand, the market remained relatively healthy in 2008. Earnings for a Suezmax tanker remained at above USD 60,000/day for the final four months of 2008 before receding to average USD 34,279/day in February 2009.
Such fluctuations alone can cause a significant strain on companies’ ability to manage cash flows and returns. However, in the current environment, further challenges abound.
1.2 Shortage of trade finance
The collapse of financial institutions such as Lehman Brothers has shaken the foundations of the financial system. As the impact of the collapse of Lehman Brothers and others became apparent, virtually all forms of trade finance had frozen. With a significant proportion of world trade being financed through letters of credit, this has meant that no cargoes could be lifted or ordered. Coupled with the fall in world demand for consumer products, the recovery of trade to pre-crisis levels is now expected to be slow.
Banks continue to be extremely cautious in their lending activities. Even banks that are dedicated to shipping finance are very selective on which deals or owners to finance. This has put further extreme pressure on those companies that continue to have unfinanced commitments, particularly for new vessels being constructed at shipyards.
Combined with falling vessel values, such companies are asked to put more and more equity into their businesses and unless such programs are restructured, postponed or cancelled altogether, defaults are likely. Companies that realised significant cash returns during the period of high returns and have kept such funds in the business, may be shielded from this situation.
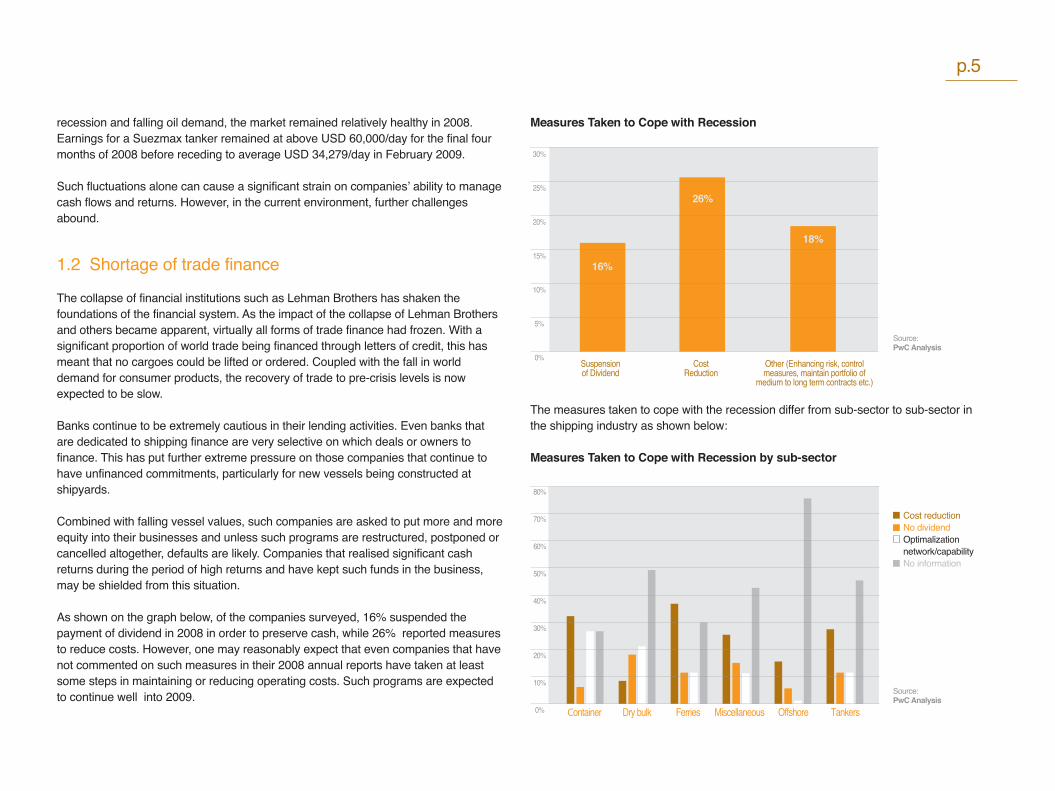
As shown on the graph below, of the companies surveyed, 16% suspended the payment of dividend in 2008 in order to preserve cash, while 26% reported measures to reduce costs. However, one may reasonably expect that even companies that have not commented on such measures in their 2008 annual reports have taken at least some steps in maintaining or reducing operating costs. Such programs are expected to continue well into 2009.
Measures Taken to Cope with Recession
The measures taken to cope with the recession differ from sub-sector to sub-sector in the shipping industry as shown below:
Measures Taken to Cope with Recession by sub-sector
p.5
30%
25%
20%
15%
10%
5%
0% Suspensionof Dividend
CostReduction
Other (Enhancing risk, controlmeasures, maintain portfolio of
medium to long term contracts etc.)
16%
26%
18%
Source:PwC Analysis
80%
70%
60%
50%
40%
30%
20%
10%
0%
Cost reductionNo dividendOptimalization network/capabilityNo information
Source:PwC Analysis
Container Dry bulk Ferries Miscellaneous Offshore Tankers
1.3 Significant order-book
This rapid decline in demand for tonnage has, unfortunately, been incurred at a time that the order book for almost all vessel types stood at record high levels. As it can be seen from the results of the benchmarking analysis, the attractive return on investment in most shipping sub-sectors in the years 2004 – 2007 has encouraged investors and ship owners to invest in new vessels by placing orders with shipyards.
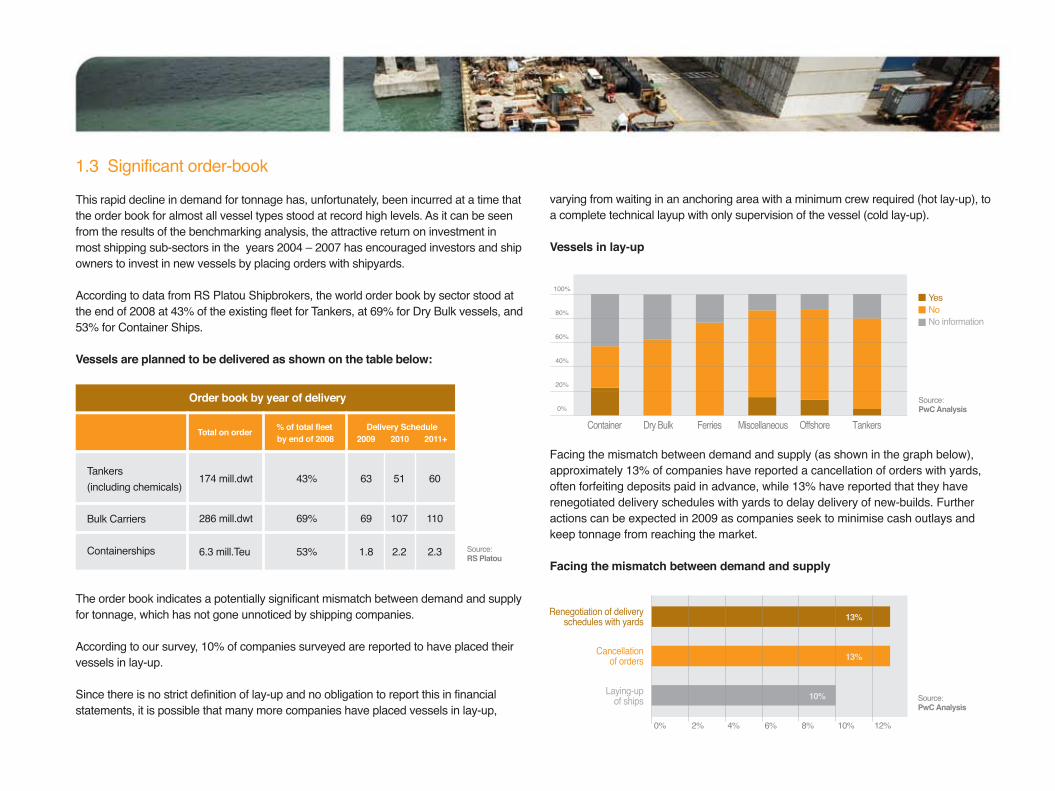
According to data from RS Platou Shipbrokers, the world order book by sector stood at the end of 2008 at 43% of the existing fleet for Tankers, at 69% for Dry Bulk vessels, and 53% for Container Ships.
Vessels are planned to be delivered as shown on the table below:
The order book indicates a potentially significant mismatch between demand and supply for tonnage, which has not gone unnoticed by shipping companies.
According to our survey, 10% of companies surveyed are reported to have placed their vessels in lay-up.
Since there is no strict definition of lay-up and no obligation to report this in financial statements, it is possible that many more companies have placed vessels in lay-up,
varying from waiting in an anchoring area with a minimum crew required (hot lay-up), to a complete technical layup with only supervision of the vessel (cold lay-up).
Vessels in lay-up
Facing the mismatch between demand and supply (as shown in the graph below), approximately 13% of companies have reported a cancellation of orders with yards, often forfeiting deposits paid in advance, while 13% have reported that they have renegotiated delivery schedules with yards to delay delivery of new-builds. Further actions can be expected in 2009 as companies seek to minimise cash outlays and keep tonnage from reaching the market.
Facing the mismatch between demand and supply
0% 2% 4% 6% 8% 10% 12%
13%
13%
10%
Renegotiation of deliveryschedules with yards
Cancellationof orders
Laying-upof ships Source:
PwC Analysis
Order book by year of delivery
Total on order Delivery Schedule2009 2010 2011+
% of total fleet by end of 2008
Tankers (including chemicals)
Bulk Carriers
Containerships
174 mill.dwt
286 mill.dwt
6.3 mill.Teu
43%
69%
53%
63
69
1.8
51
107
2.2
60
110
2.3 Source:RS Platou
Yes NoNo information
Source:PwC Analysis
100%
80%
60%
40%
20%
0%
Container Dry Bulk Ferries Miscellaneous Offshore Tankers
1. Impact of the economic crisis on the shipping industry
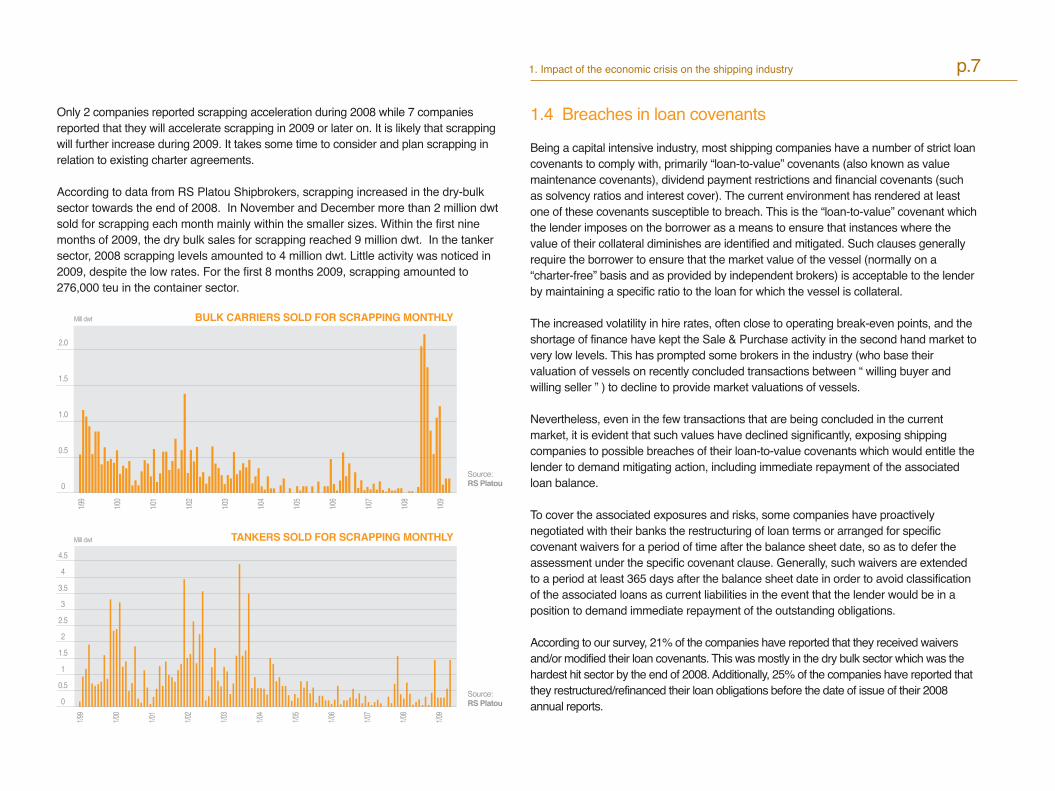
Only 2 companies reported scrapping acceleration during 2008 while 7 companies reported that they will accelerate scrapping in 2009 or later on. It is likely that scrapping will further increase during 2009. It takes some time to consider and plan scrapping in relation to existing charter agreements.
According to data from RS Platou Shipbrokers, scrapping increased in the dry-bulk sector towards the end of 2008. In November and December more than 2 million dwt sold for scrapping each month mainly within the smaller sizes. Within the first nine months of 2009, the dry bulk sales for scrapping reached 9 million dwt. In the tanker sector, 2008 scrapping levels amounted to 4 million dwt. Little activity was noticed in 2009, despite the low rates. For the first 8 months 2009, scrapping amounted to 276,000 teu in the container sector.
1.4 Breaches in loan covenants
Being a capital intensive industry, most shipping companies have a number of strict loan covenants to comply with, primarily “loan-to-value” covenants (also known as value maintenance covenants), dividend payment restrictions and financial covenants (such as solvency ratios and interest cover). The current environment has rendered at least one of these covenants susceptible to breach. This is the “loan-to-value” covenant which the lender imposes on the borrower as a means to ensure that instances where the value of their collateral diminishes are identified and mitigated. Such clauses generally require the borrower to ensure that the market value of the vessel (normally on a “charter-free” basis and as provided by independent brokers) is acceptable to the lender by maintaining a specific ratio to the loan for which the vessel is collateral.
The increased volatility in hire rates, often close to operating break-even points, and the shortage of finance have kept the Sale & Purchase activity in the second hand market to very low levels. This has prompted some brokers in the industry (who base their valuation of vessels on recently concluded transactions between “ willing buyer and willing seller ” ) to decline to provide market valuations of vessels.
Nevertheless, even in the few transactions that are being concluded in the current market, it is evident that such values have declined significantly, exposing shipping companies to possible breaches of their loan-to-value covenants which would entitle the lender to demand mitigating action, including immediate repayment of the associated loan balance.
To cover the associated exposures and risks, some companies have proactively negotiated with their banks the restructuring of loan terms or arranged for specific covenant waivers for a period of time after the balance sheet date, so as to defer the assessment under the specific covenant clause. Generally, such waivers are extended to a period at least 365 days after the balance sheet date in order to avoid classification of the associated loans as current liabilities in the event that the lender would be in a position to demand immediate repayment of the outstanding obligations.
According to our survey, 21% of the companies have reported that they received waivers and/or modified their loan covenants. This was mostly in the dry bulk sector which was the hardest hit sector by the end of 2008. Additionally, 25% of the companies have reported that they restructured/refinanced their loan obligations before the date of issue of their 2008 annual reports.
p.7
BULK CARRIERS SOLD FOR SCRAPPING MONTHLY
2.0
1.5
1.0
0.5
0
1/99
1/00
1/01
1/02
1/03
1/04
1/05
1/06
1/07
1/08
1/09
Mill dwt
Source: RS Platou
Source: RS Platou
4.5
4
3.5
3
2.5
2
1.5
1
0.5
0
1/99
1/00
1/01
1/02
1/03
1/04
1/05
1/06
1/07
1/08
1/09
Mill dwt TANKERS SOLD FOR SCRAPPING MONTHLY
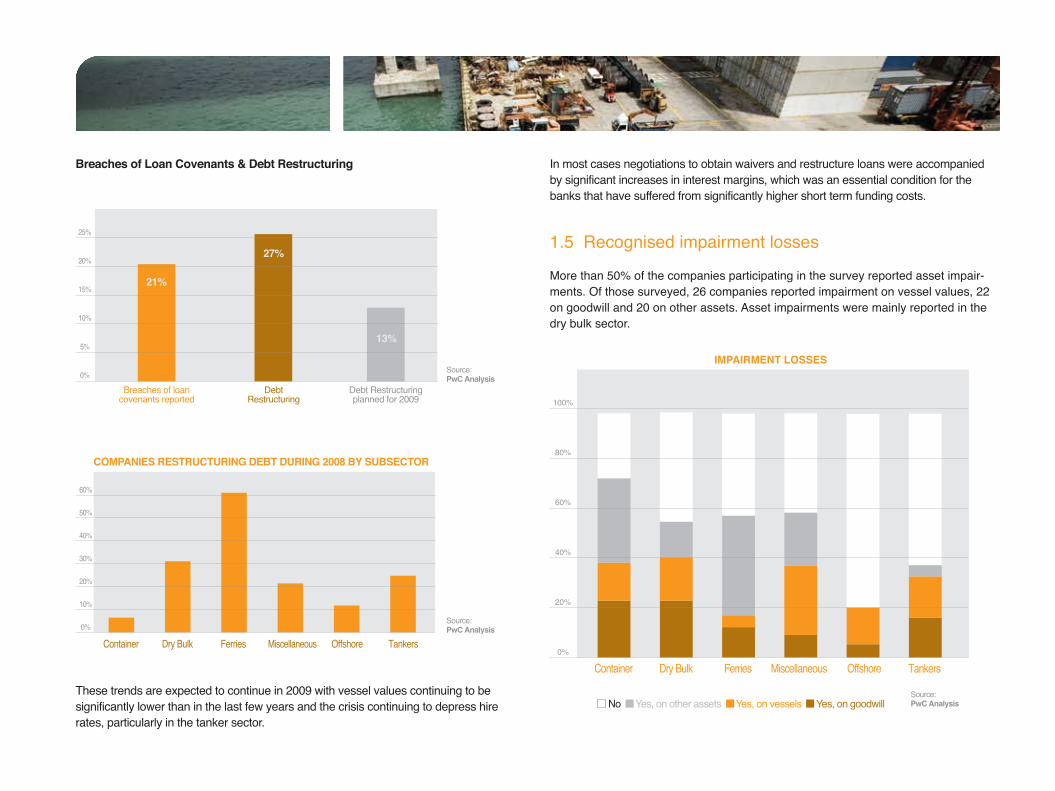
Breaches of Loan Covenants & Debt Restructuring
These trends are expected to continue in 2009 with vessel values continuing to be significantly lower than in the last few years and the crisis continuing to depress hire rates, particularly in the tanker sector.
In most cases negotiations to obtain waivers and restructure loans were accompanied by significant increases in interest margins, which was an essential condition for the banks that have suffered from significantly higher short term funding costs.
1.5 Recognised impairment losses
More than 50% of the companies participating in the survey reported asset impair-ments. Of those surveyed, 26 companies reported impairment on vessel values, 22 on goodwill and 20 on other assets. Asset impairments were mainly reported in the dry bulk sector.
Source:PwC AnalysisNo Yes, on other assets Yes, on vessels Yes, on goodwill
21%
27%
13%
25%
20%
15%
10%
5%
0%
Breaches of loancovenants reported
DebtRestructuring
Debt Restructuringplanned for 2009
Source:PwC Analysis
100%
80%
60%
40%
20%
0%
Container Dry Bulk Ferries Miscellaneous Offshore Tankers
IMPAIRMENT LOSSES
Source:PwC Analysis
60%
50%
40%
30%
20%
10%
0%
COMPANIES RESTRUCTURING DEBT DURING 2008 BY SUBSECTOR
Container Dry Bulk Ferries Miscellaneous Offshore Tankers

1. Impact of the economic crisis on the shipping industry
Recent valuations by independent brokers in a distressed market show extremely low values compared to new build prices. This has led some market participants to seek alternative valuation methods. An example of such a model is the one devel-oped by VHSS (Vereinigung Hamburger Schiffsmakler und Schiffsagenten e.V.), which was tested by PricewaterhouseCoopers as a workable alternative. It is described as a conservative unbiased and statistically proven approach and is based on a discounted cash flow method (which is similar to the “value-in-use” calculation described in International Financial Reporting Standards under IAS 36). It works on the basis of a vessel’s long term earnings (both historical and projected forward), operating costs, life expectancy and scrap values.
1.6 Going concern considerations
As a direct result of the aforementioned issues, some companies are expected to fall into financial difficulty as revenues decline, capital commitments fall due and cash reserves dry up. In such cases, lenders may be more reluctant to restructure debt or provide covenant waivers, keeping more legal options open to pursue such compa-nies. If, as a result, loan balances are classified as current liabilities, this may cause breach of other financial covenants and have potential repercussions on other creditors.
Of the audit reports on the annual reports of the companies surveyed, only 7% had either a going concern qualification or a going concern emphasis of matter. Specifically, 1 company had a going concern qualification, while 6 had an emphasis of matter.
From results to date (Q3 FY09), it is expected that 2009 will be a more difficult year for shipping companies, particularly as cash reserves are depleted.
1.7 Concluding remarks
The impact of the economic crisis on the shipping industry is significant and while this was felt in the second half of 2008, our survey shows that this has generally not had a significant impact on the companies’ reported performance for that year.As it will become evident in the following section, a reason for this is that the first half of the year has been particularly robust for most sub-sectors in the industry and has provided companies with the momentum and liquidity to overcome some of the challenges faced when the crisis struck.
Based on existing trends and developments, it is expected that companies will continue to renegotiate with their lenders and creditors better terms on existing contracts in order to manage cash flow more effectively. Shipping companies will also need to fend off charterers who seek renegotiations of time charter agreements or contracts of affreightment when such contracts were entered into at now unprofitable levels. This will involve time consuming and difficult discussions with yards, banks and suppliers. Some companies will succeed in these efforts, but some will not.
p.9
2.1 Background
We have performed a benchmark survey regarding the financial performance of companies in different sub-sectors in the shipping industry: containers, tankers, dry bulk, off shore, ferries and miscellaneous (companies active in several sectors of the shipping industry). More than 100 companies have been included in the financial performance benchmark survey. Financial data have been derived from the financial statements from 2004 up to and including 2008.
The purpose of this survey has been to measure the financial performance of individual companies in sub-sectors, to compare the performance between sub-sectors and the overall shipping industry and to identify trends and developments.
This publication presents the average financial performance in each sub-sector. Individual companies can obtain tailor made benchmark presentations upon request. An individual report enables a shipping company to benchmark its own financial performance with other companies in its sub-sector on the basis of key performance indicators. Individual reports can be commissioned by contacting any of our shipping industry group contacts at your local PricewaterhouseCoopers office (as presented at the end of this publication).
Financial Performance Benchmarks
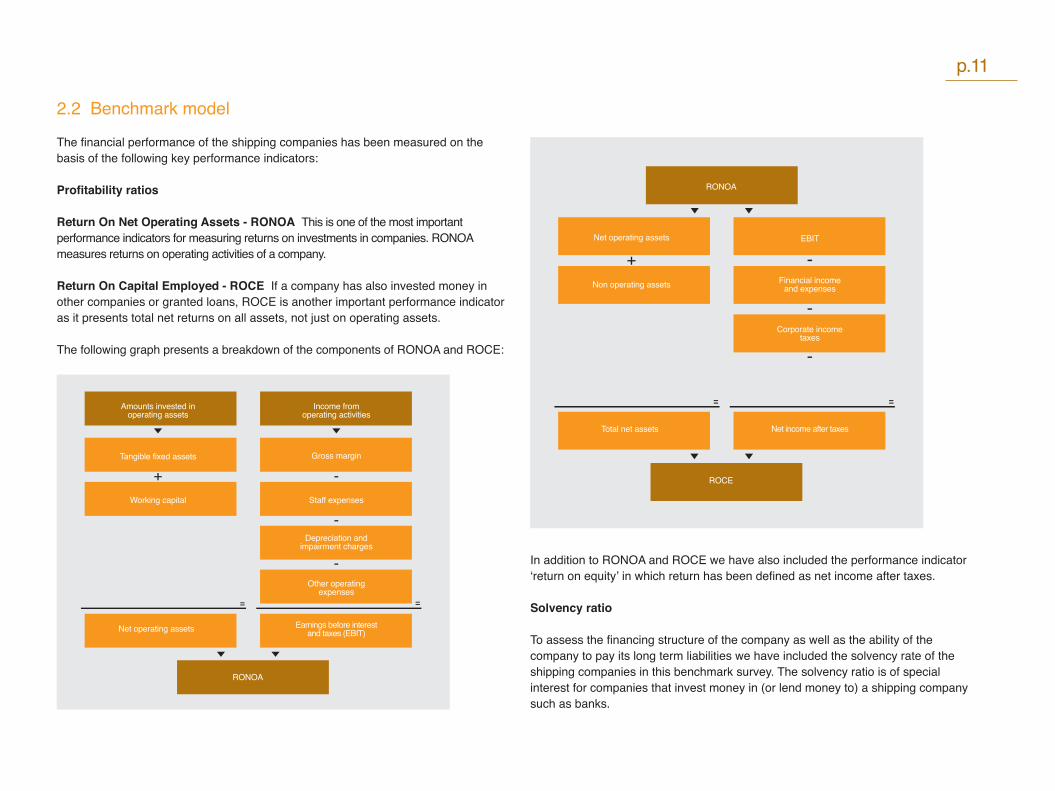
2.2 Benchmark model
The financial performance of the shipping companies has been measured on the basis of the following key performance indicators:
Profitability ratios
Return On Net Operating Assets - RONOA This is one of the most important performance indicators for measuring returns on investments in companies. RONOA measures returns on operating activities of a company.
Return On Capital Employed - ROCE If a company has also invested money in other companies or granted loans, ROCE is another important performance indicator as it presents total net returns on all assets, not just on operating assets. The following graph presents a breakdown of the components of RONOA and ROCE:
In addition to RONOA and ROCE we have also included the performance indicator ‘return on equity’ in which return has been defined as net income after taxes.
Solvency ratio
To assess the financing structure of the company as well as the ability of the company to pay its long term liabilities we have included the solvency rate of the shipping companies in this benchmark survey. The solvency ratio is of special interest for companies that invest money in (or lend money to) a shipping company such as banks.
p.11
RONOA
Amounts invested inoperating assets
Tangible fixed assets
Working capital
Net operating assets
Income fromoperating activities
Depreciation andimpairment charges
Other operatingexpenses
Gross margin
Staff expenses
Earnings before interestand taxes (EBIT)
ROCE
Net operating assets
Non operating assets
Total net assets
RONOA
Corporate incometaxes
EBIT
Financial incomeand expenses
Net income after taxes

1086420
A
B
C
D
E
F
G
H
A
B
C
D
E
F
G
H2008 ContainerA. Return on net operating assetsB. Working capital / net salesC. Net fixed assets / net salesD. EBIT / net salesE. Return on capital employedF. Income after taxation / average shareholders’ equityG. SolvencyH. Current ratio
Average Shipping Best in Class Container Average Container
2008 TankerA. Return on net operating assetsB. Working capital / net salesC. Net fixed assets / net salesD. EBIT / net salesE. Return on capital employedF. Income after taxation / average shareholders’ equityG. SolvencyH. Current ratio
Average Shipping Best in Class Tanker Average Tanker
Liquidity ratio
Meeting long term liabilities is only relevant when a company is able to pay its short term liabilities in the short run. To obtain an understanding of the liquidity of the shipping sector including the developments in the last 5 years we have included the current ratio in this benchmark survey. The current ratio is calculated by dividing the amount of current assets by the amount of current liabilities.
For a complete list of definitions and calculations of the ratios in this chapter, please refer to Appendices.
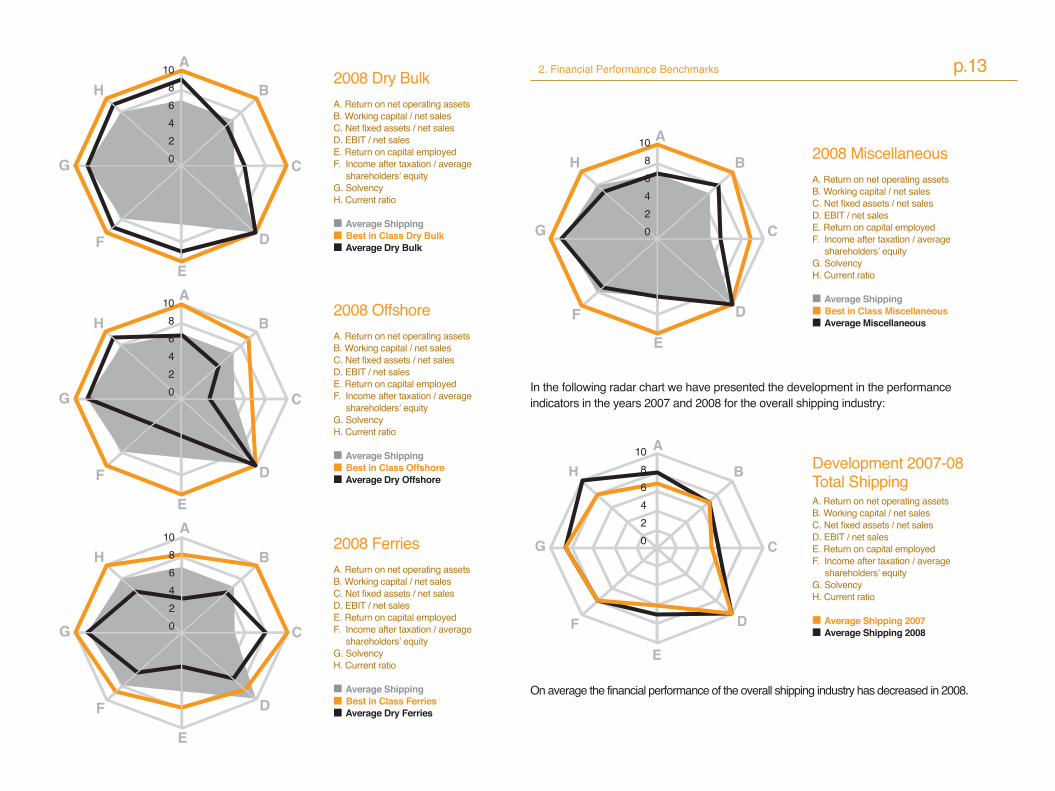
2.3 Results summary by sub-sector
The radar charts on the following pages show the outcomes of the key performance indicators for each sub-sector in 2008. The outcomes of the ratios have been ranked on a scale from zero to ten. A score of 10 (the outside line of the chart) means a favourable outcome on that ratio and a score of zero (centre of the graph) an unfavourable outcome of the ratio.
The radar charts we have presented include the following scores:
Average score overall shipping industry 2008 Average score sub-sector 2008 Best in class in sub-sector 2008
The radar chart provides a very quick overview of the financial performance of each sub-sector and overall shipping industry.
As demonstrated by this summary, the dry bulk shipping sector has been the most attractive sub-sector in 2008 and the ferry business the least attractive.
1086420
2. Financial Performance Benchmarks
In the following radar chart we have presented the development in the performance indicators in the years 2007 and 2008 for the overall shipping industry:
On average the financial performance of the overall shipping industry has decreased in 2008.
1086420
A
B
C
D
E
F
G
H
p.132008 Dry BulkA. Return on net operating assetsB. Working capital / net salesC. Net fixed assets / net salesD. EBIT / net salesE. Return on capital employedF. Income after taxation / average shareholders’ equityG. SolvencyH. Current ratio
Average Shipping Best in Class Dry Bulk Average Dry Bulk
2008 MiscellaneousA. Return on net operating assetsB. Working capital / net salesC. Net fixed assets / net salesD. EBIT / net salesE. Return on capital employedF. Income after taxation / average shareholders’ equityG. SolvencyH. Current ratio
Average Shipping Best in Class Miscellaneous Average Miscellaneous
Development 2007-08Total ShippingA. Return on net operating assetsB. Working capital / net salesC. Net fixed assets / net salesD. EBIT / net salesE. Return on capital employedF. Income after taxation / average shareholders’ equityG. SolvencyH. Current ratio
Average Shipping 2007 Average Shipping 2008
2008 OffshoreA. Return on net operating assetsB. Working capital / net salesC. Net fixed assets / net salesD. EBIT / net salesE. Return on capital employedF. Income after taxation / average shareholders’ equityG. SolvencyH. Current ratio
Average Shipping Best in Class Offshore Average Dry Offshore
2008 FerriesA. Return on net operating assetsB. Working capital / net salesC. Net fixed assets / net salesD. EBIT / net salesE. Return on capital employedF. Income after taxation / average shareholders’ equityG. SolvencyH. Current ratio
Average Shipping Best in Class Ferries Average Dry Ferries
A
B
C
D
E
F
G
H
A
B
C
D
E
F
G
H
A
B
C
D
E
F
G
H
1086420
A
B
C
D
E
F
G
H1086420
1086420
1086420

2.4 Results by Key Performance Indicator
Return on net operating assets (RONOA)
The following charts show the developments in RONOA in the last 5 years including the developments in elements that affect RONOA: EBIT, working capital and fixed assets.
WORKING CAPITAL / NET SALES
2004 2005 2006 2007 2008
10%
5%
0%
-5%
-10%
-15%
CONTAINER3%5%9%4%
-16%
TANKERS-5%-12%-10%-7%2%
DRY BULK-2%-4%-5%-3%5%
OFFSHORE13%9%6%6%5%
FERRIES-8%-7%-3%0%-1%
Avg TOTAL-4%-5%-4%-2%-2%
MISCELLANEOUS-14%-11%-8%-6%-9%
EBIT / NET SALES
2004 2005 2006 2007 2008
35%
30%
25%
20%
15%
10%
5%
0%CONTAINER
18%21%14%17%6%
TANKERS36%30%27%27%27%
DRY BULK37%34%29%38%26%
OFFSHORE14%33%35%37%25%
FERRIES9%8%4%9%5%
Avg TOTAL24%26%23%26%20%
MISCELLANEOUS19%23%20%21%16%
40%
35%
30%
25%
20%
15%
10%
5%
0%CONTAINER
27%29%11%19%9%
TANKERS23%19%14%12%12%
DRY BULK41%32%22%33%27%
OFFSHORE6%18%18%16%10%
FERRIES10%8%8%9%4%
Avg TOTAL21%21%15%18%15%
MISCELLANEOUS18%19%14%16%13%
2004 2005 2006 2007 2008
RETURN ON NET OPERATING ASSETS (RONOA)
2. Financial Performance Benchmarks
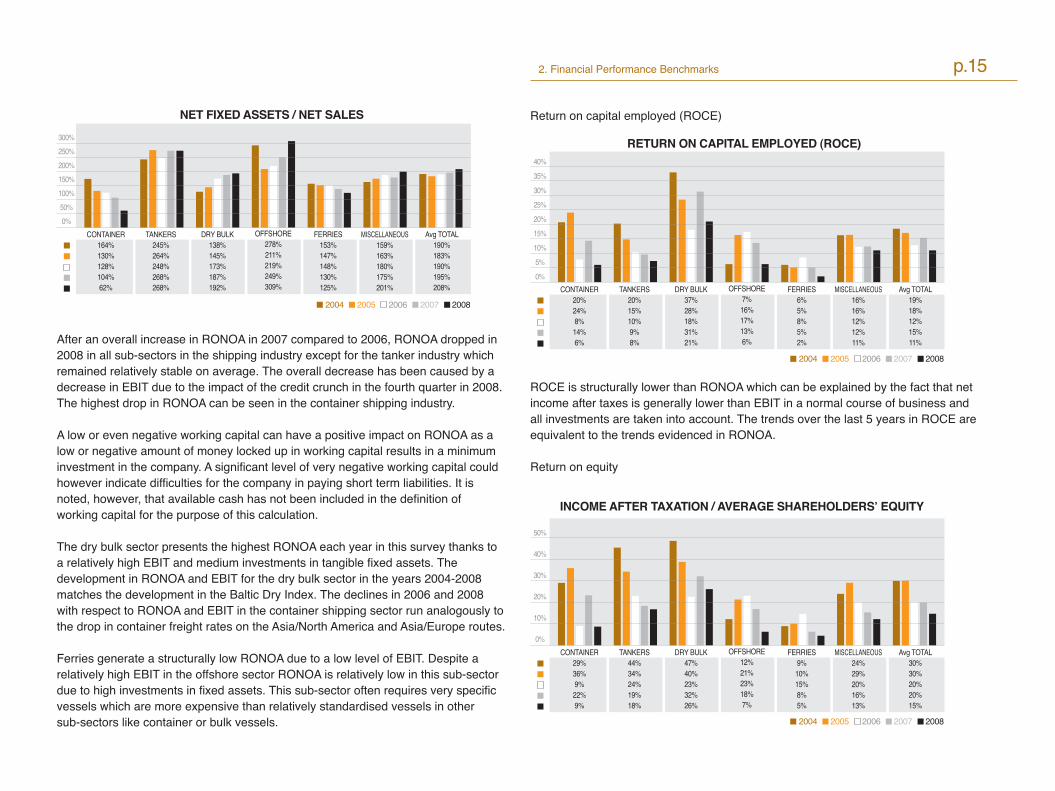
After an overall increase in RONOA in 2007 compared to 2006, RONOA dropped in 2008 in all sub-sectors in the shipping industry except for the tanker industry which remained relatively stable on average. The overall decrease has been caused by a decrease in EBIT due to the impact of the credit crunch in the fourth quarter in 2008. The highest drop in RONOA can be seen in the container shipping industry.
A low or even negative working capital can have a positive impact on RONOA as a low or negative amount of money locked up in working capital results in a minimum investment in the company. A significant level of very negative working capital could however indicate difficulties for the company in paying short term liabilities. It is noted, however, that available cash has not been included in the definition of working capital for the purpose of this calculation.
The dry bulk sector presents the highest RONOA each year in this survey thanks to a relatively high EBIT and medium investments in tangible fixed assets. The development in RONOA and EBIT for the dry bulk sector in the years 2004-2008 matches the development in the Baltic Dry Index. The declines in 2006 and 2008 with respect to RONOA and EBIT in the container shipping sector run analogously to the drop in container freight rates on the Asia/North America and Asia/Europe routes.
Ferries generate a structurally low RONOA due to a low level of EBIT. Despite a relatively high EBIT in the offshore sector RONOA is relatively low in this sub-sector due to high investments in fixed assets. This sub-sector often requires very specific vessels which are more expensive than relatively standardised vessels in other sub-sectors like container or bulk vessels.
Return on capital employed (ROCE)
ROCE is structurally lower than RONOA which can be explained by the fact that net income after taxes is generally lower than EBIT in a normal course of business and all investments are taken into account. The trends over the last 5 years in ROCE are equivalent to the trends evidenced in RONOA.
Return on equity
p.15
NET FIXED ASSETS / NET SALES300%250%200%150%100%50%0%
2004 2005 2006 2007 2008
CONTAINER164%130%128%104%62%
TANKERS245%264%248%268%268%
DRY BULK138%145%173%187%192%
OFFSHORE278%211%219%249%309%
FERRIES153%147%148%130%125%
Avg TOTAL190%183%190%195%208%
MISCELLANEOUS159%163%180%175%201%
RETURN ON CAPITAL EMPLOYED (ROCE)40%
35%
30%
25%
20%
15%
10%
5%
0%
2004 2005 2006 2007 2008
CONTAINER20%24%8%14%6%
TANKERS20%15%10%9%8%
DRY BULK37%28%18%31%21%
OFFSHORE7%16%17%13%6%
FERRIES6%5%8%5%2%
Avg TOTAL19%18%12%15%11%
MISCELLANEOUS16%16%12%12%11%
INCOME AFTER TAXATION / AVERAGE SHAREHOLDERS’ EQUITY
50%
40%
30%
20%
10%
0%
2004 2005 2006 2007 2008
CONTAINER29%36%9%22%9%
TANKERS44%34%24%19%18%
DRY BULK47%40%23%32%26%
OFFSHORE12%21%23%18%7%
FERRIES9%10%15%8%5%
Avg TOTAL30%30%20%20%15%
MISCELLANEOUS24%29%20%16%13%

Developments in return on equity in the years 2004 – 2007 are very different in each sub-sector. Return on equity decreases in 2008, in all sub-sectors. Like RONOA the container shipping industry shows the highest decline. Over 80% of the container shipping companies had a lower net income in 2008 compared to 2007. In addition over 80% of the ferry companies realised a lower net income in 2008 compared to 2007. With the exception of the container and ferry businesses the majority of the shipping companies showed increased amounts of owner equity which has a further negative impact on return on equity ratios.
Solvency
Solvency rates are relatively high in all shipping sectors and do not show significant changes during the last 5 years. The dry bulk sector is on average the most solvent sub-sector during the last 5 years, but declined in 2008. The last 3 years show reduced solvency on average.
Liquidity
The current ratio indicates the ability of the company to pay its short term liabilities in the short run and is calculated by dividing the amount of current assets by the amount of current liabilities. A healthy current ratio amounts to approximately 1.5. Current ratios less than 1 are critical in this industry.
In 2008 current ratios have decreased in all sub-sectors except for the tanker industry. The container and ferry industry developed towards the critical border in 2008. Considering the negative market situation for the shipping industry (due to the economic recession) liquidity of several companies will become very critical in 2009. Approximately 20% of the shipping companies in this benchmark survey had a current ratio below 1 at the end of 2008.
CURRENT RATIO4.03.53.02.52.01.51.00.50
2004 2005 2006 2007 2008
CONTAINER1.51.91.81.61.1
TANKERS3.02.12.12.02.2
DRY BULK2.22.42.12.62.0
OFFSHORE2.63.53.43.31.8
FERRIES1.21.51.61.31.1
Avg TOTAL2.12.22.12.11.7
MISCELLANEOUS1.81.81.81.91.5
SOLVENCY
60%
50%
40%
30%
20%
10%
0%
2004 2005 2006 2007 2008
CONTAINER46%48%45%43%41%
TANKERS43%43%42%37%39%
DRY BULK47%52%52%55%50%
OFFSHORE46%52%52%48%42%
FERRIES38%39%41%40%39%
Avg TOTAL44%45%45%44%43%
MISCELLANEOUS43%41%41%42%42%
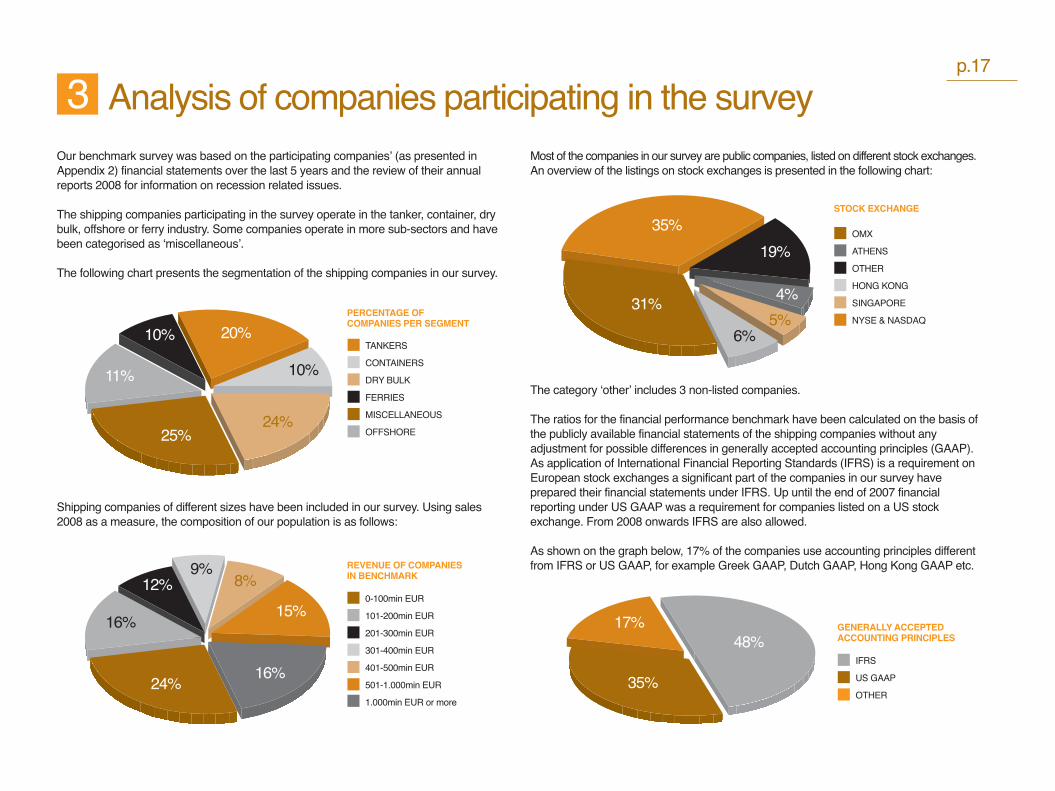
Our benchmark survey was based on the participating companies’ (as presented in Appendix 2) financial statements over the last 5 years and the review of their annual reports 2008 for information on recession related issues.
The shipping companies participating in the survey operate in the tanker, container, dry bulk, offshore or ferry industry. Some companies operate in more sub-sectors and have been categorised as ‘miscellaneous’.
The following chart presents the segmentation of the shipping companies in our survey.
Shipping companies of different sizes have been included in our survey. Using sales 2008 as a measure, the composition of our population is as follows:
Most of the companies in our survey are public companies, listed on different stock exchanges. An overview of the listings on stock exchanges is presented in the following chart:
The category ‘other’ includes 3 non-listed companies.
The ratios for the financial performance benchmark have been calculated on the basis of the publicly available financial statements of the shipping companies without any adjustment for possible differences in generally accepted accounting principles (GAAP). As application of International Financial Reporting Standards (IFRS) is a requirement on European stock exchanges a significant part of the companies in our survey have prepared their financial statements under IFRS. Up until the end of 2007 financial reporting under US GAAP was a requirement for companies listed on a US stock exchange. From 2008 onwards IFRS are also allowed.
As shown on the graph below, 17% of the companies use accounting principles different from IFRS or US GAAP, for example Greek GAAP, Dutch GAAP, Hong Kong GAAP etc.
p.17
Analysis of companies participating in the survey
20%
10%
10%
11%
24%25%
TANKERS
CONTAINERS
DRY BULK
FERRIES
MISCELLANEOUS
OFFSHORE
PERCENTAGE OF COMPANIES PER SEGMENT
8%9%
15%
16%
12%
16%
24%
0-100min EUR
101-200min EUR
201-300min EUR
301-400min EUR
401-500min EUR
501-1.000min EUR
1.000min EUR or more
REVENUE OF COMPANIES IN BENCHMARK
35%OMX
ATHENS
OTHER
HONG KONG
SINGAPORE
NYSE & NASDAQ
STOCK EXCHANGE
31%
19%
4%5%
6%
GENERALLY ACCEPTEDACCOUNTING PRINCIPLES
IFRS
US GAAP
OTHER
17%
35%
48%
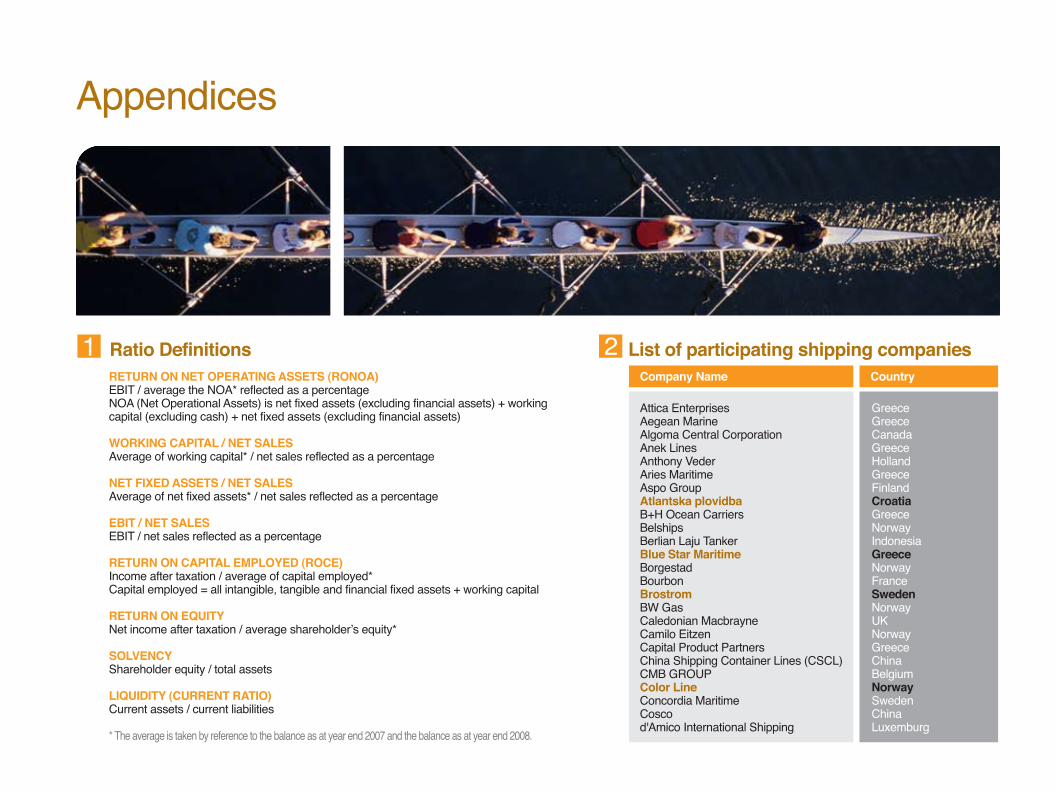
RETURN ON NET OPERATING ASSETS (RONOA)EBIT / average the NOA* reflected as a percentageNOA (Net Operational Assets) is net fixed assets (excluding financial assets) + working capital (excluding cash) + net fixed assets (excluding financial assets)
WORKING CAPITAL / NET SALESAverage of working capital* / net sales reflected as a percentage
NET FIXED ASSETS / NET SALESAverage of net fixed assets* / net sales reflected as a percentage
EBIT / NET SALESEBIT / net sales reflected as a percentage
RETURN ON CAPITAL EMPLOYED (ROCE)Income after taxation / average of capital employed*Capital employed = all intangible, tangible and financial fixed assets + working capital
RETURN ON EQUITYNet income after taxation / average shareholder’s equity*
SOLVENCYShareholder equity / total assets
LIQUIDITY (CURRENT RATIO)Current assets / current liabilities
* The average is taken by reference to the balance as at year end 2007 and the balance as at year end 2008.
Appendices
Ratio Definitions List of participating shipping companiesCompany Name Country
Attica EnterprisesAegean MarineAlgoma Central CorporationAnek LinesAnthony VederAries MaritimeAspo GroupAtlantska plovidbaB+H Ocean CarriersBelshipsBerlian Laju TankerBlue Star MaritimeBorgestadBourbonBrostromBW Gas Caledonian MacbrayneCamilo EitzenCapital Product PartnersChina Shipping Container Lines (CSCL)CMB GROUPColor LineConcordia MaritimeCoscod'Amico International Shipping
GreeceGreeceCanadaGreeceHollandGreeceFinlandCroatiaGreeceNorwayIndonesiaGreeceNorwayFranceSwedenNorwayUKNorwayGreeceChinaBelgiumNorwaySwedenChinaLuxemburg
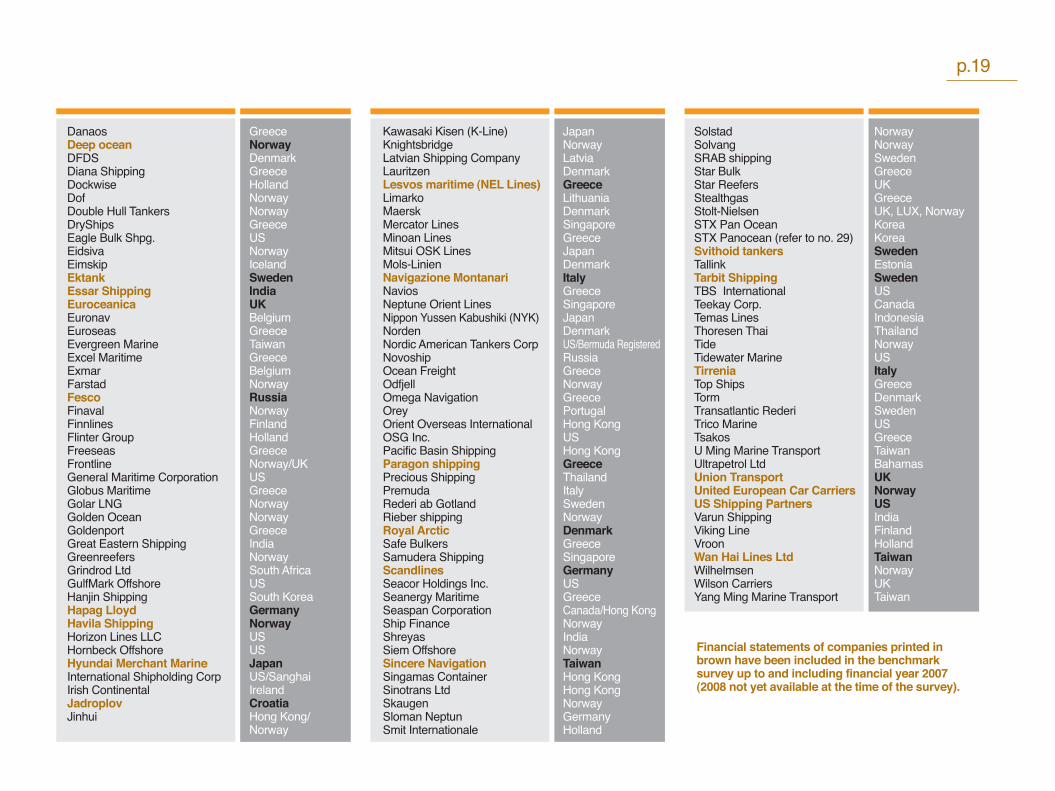
Financial statements of companies printed in brown have been included in the benchmark survey up to and including financial year 2007 (2008 not yet available at the time of the survey).
p.19
DanaosDeep oceanDFDSDiana ShippingDockwiseDofDouble Hull TankersDryShipsEagle Bulk Shpg.EidsivaEimskipEktankEssar ShippingEuroceanicaEuronavEuroseasEvergreen MarineExcel MaritimeExmarFarstadFescoFinavalFinnlinesFlinter GroupFreeseasFrontlineGeneral Maritime CorporationGlobus MaritimeGolar LNGGolden OceanGoldenportGreat Eastern ShippingGreenreefersGrindrod LtdGulfMark OffshoreHanjin ShippingHapag LloydHavila ShippingHorizon Lines LLCHornbeck OffshoreHyundai Merchant MarineInternational Shipholding CorpIrish ContinentalJadroplovJinhui
GreeceNorwayDenmarkGreeceHollandNorwayNorwayGreeceUSNorwayIcelandSwedenIndiaUKBelgiumGreeceTaiwanGreeceBelgiumNorwayRussiaNorwayFinlandHollandGreeceNorway/UKUS GreeceNorwayNorwayGreeceIndiaNorwaySouth AfricaUSSouth KoreaGermanyNorwayUSUSJapanUS/SanghaiIrelandCroatiaHong Kong/ Norway
Kawasaki Kisen (K-Line)KnightsbridgeLatvian Shipping CompanyLauritzenLesvos maritime (NEL Lines)LimarkoMaerskMercator LinesMinoan LinesMitsui OSK LinesMols-LinienNavigazione MontanariNaviosNeptune Orient LinesNippon Yussen Kabushiki (NYK)NordenNordic American Tankers CorpNovoshipOcean FreightOdfjell Omega NavigationOreyOrient Overseas InternationalOSG Inc.Pacific Basin ShippingParagon shippingPrecious ShippingPremudaRederi ab GotlandRieber shippingRoyal ArcticSafe BulkersSamudera ShippingScandlinesSeacor Holdings Inc.Seanergy MaritimeSeaspan CorporationShip FinanceShreyasSiem OffshoreSincere NavigationSingamas ContainerSinotrans LtdSkaugenSloman NeptunSmit Internationale
JapanNorwayLatviaDenmarkGreeceLithuaniaDenmarkSingaporeGreeceJapanDenmarkItalyGreeceSingaporeJapanDenmarkUS/Bermuda RegisteredRussiaGreeceNorwayGreecePortugalHong KongUSHong KongGreeceThailandItalySwedenNorwayDenmarkGreeceSingaporeGermanyUSGreeceCanada/Hong KongNorwayIndiaNorwayTaiwanHong KongHong KongNorwayGermanyHolland
SolstadSolvangSRAB shippingStar BulkStar ReefersStealthgasStolt-NielsenSTX Pan OceanSTX Panocean (refer to no. 29)Svithoid tankersTallink Tarbit ShippingTBS InternationalTeekay Corp.Temas LinesThoresen ThaiTide Tidewater MarineTirreniaTop ShipsTormTransatlantic RederiTrico MarineTsakosU Ming Marine TransportUltrapetrol LtdUnion TransportUnited European Car CarriersUS Shipping PartnersVarun ShippingViking LineVroonWan Hai Lines LtdWilhelmsenWilson CarriersYang Ming Marine Transport
NorwayNorwaySwedenGreeceUKGreeceUK, LUX, NorwayKoreaKoreaSwedenEstoniaSwedenUSCanadaIndonesiaThailandNorwayUSItalyGreeceDenmarkSwedenUSGreeceTaiwanBahamasUKNorwayUSIndiaFinlandHollandTaiwanNorwayUKTaiwan
Key contacts for the global shipping benchmark
Socrates Leptos-Bourgi Global Shipping & Ports Leader +30 210 428 [email protected]
Isis Bindels+31 10 407 [email protected]
Johan Wagelaar+31 50 520 8075 [email protected]
PricewaterhouseCoopers' transportation & logistics practice provides industry-focused assurance, tax and advisory services to public and private T&L companies throughout the world. For more information, please contact the transportation & logistics leader in your country.
Global Transportation & Logistics LeaderKlaus-Dieter Ruske+49 211 981 [email protected]
Global Transportation & LogisticsBusiness DevelopmentPeter Kauschke+49 211 981 [email protected]
Global Transportation & LogisticsKnowledge ManagementUsha Bahl-Schneider+49 69 9585 [email protected]
Contacts

Africa CentralVishal Agarwal+254 20 [email protected]
AustraliaDon Munro+61 2 8266 [email protected]
BelgiumPeter Van den Eynde+32 3 259 33 [email protected]
CanadaTodd Thornton+1 905 949 [email protected]
Central and Eastern EuropeNick C. [email protected]
ChinaThomas Leung+86 10 6533 [email protected]
CyprusLiakos Theodorou+357 25 555 [email protected]
DenmarkBo Schou-Jacobsen+45 39 45 36 [email protected]
FinlandJyri Heikkinen+358 92 280 [email protected]
FranceJean-Francois Chatel+33 1 56 57 [email protected]
Vincent Gaide+33 1 56 57 [email protected]
GermanyKlaus-Dieter Ruske+49 211 981 [email protected]
GreeceSocrates Leptos-Bourgi+30 [email protected]
Hong KongAlan Ng+852 2289 [email protected]
IndiaAmrit Pandurangi+91 11 5135 [email protected]
IndonesiaThomson Batubara+62 21 5289 [email protected]
ItalyLuciano Festa+39 6 57025 [email protected]
JapanYasuhisa Furusawa+813 [email protected]
LuxemburgAnne Murrath+352 4948 [email protected] MalaysiaAzizan Zakaria+60 (3) 2173 [email protected]
MexicoMartha Elena Gonzalez+52 55 5263 [email protected]
New ZealandKaren Shires+64 4 462 [email protected]
NorwayRita Granlund+47 95 26 02 [email protected]
PhilippinesAnjji M. Gabriel+63 2 459 [email protected]
p.21

PortugalAntonio Rodrigues+351 213 [email protected]
RussiaAlexander Sinyavsky+7 495 [email protected]
South East EuropeMomchil Vasilev+359 2 93 55 [email protected]
SingaporeKok.Leong.Soh+65 6236 [email protected]
South AfricaAkhter Moosa+27 12 429 [email protected]
South and Central AmericaHenrique Luz+55 11 3674 [email protected]
South KoreaMoon-Sub [email protected]
SpainIgnacio Fernandez+34 915 684 [email protected]
SwedenFredrik Goransson+46 31 [email protected]
SwitzerlandThomas Bruederlin+41 58 792 [email protected]
TaiwanCharles Lai+886 (0) 2 27296666 [email protected]
The NetherlandsJeroen Boonacker+31 10 4075 [email protected]
TurkeyCenk Ulu+90 212 [email protected]
United Arab EmiratesNathan Weatherstone+971 [email protected]
United KingdomClive Hinds+44 1727 [email protected]
United States of AmericaKenneth Evans+1 305 375 [email protected]


pwc.com
LetU
sPla
y ad
& c
reat
ive
© 2009-10 PricewaterhouseCoopers. All rights reserved. "PricewaterhouseCoopers" and "PwC" refer to the network of member firms of PricewaterhouseCoopers International Limited (PwCIL). Each member firm is a separate legal entity and does not act as agent of PwCIL or any other member firm. PwCIL does not provide any services to clients. PwCIL is not responsible or liable for the acts or omissions of any of its member firms nor can it control the exercise of their professional judgment or bind them in any way. No member firm is responsible or liable for the acts or omissions of any other member firm nor can it control the exercise of another member firm's professional judgment or bind another member firm or PwCIL in any way.