global oleoresins market (by product, by application...
TRANSCRIPT

(c) AZOTH Analytics
Global Oleoresins Market (By Product, By Application):
Trends, Opportunities and Forecasts (2018-2023)
• Global Oleoresins Industry – Sizing, Growth and Forecast
• Global Oleoresins Share By Product – Paprika, Black Pepper,
Capsicum, Turmeric, Ginger, Onion and Others
• Global Oleoresins Share By Application – Food & Beverage,
Flavours, Pharmaceuticals and Others
• By Region – North America, Europe, APAC, ROW
• By Country – U.S, Canada, Mexico, U.K, Germany, Spain,
India, China, Japan, Brazil
• Prominent Companies operating Global Oleoresins
1

(c) AZOTH Analytics
Scope of the Report –Global Oleoresins Market
2013 2014 2015 2016 2017 2018 2019 2020 2021 2022 2023
Glo
bal&
Regio
nal&
Countr
y
Market, By Value Others
By Product ,By Value
Paprika
Black Pepper
Capsicum
Turmeric
Ginger
Onion
Others
By Application,By Value
Food & Beverage
Flavours
Pharmaceutical
Others
Company AnalysisSynthite Ingredients Ltd, Kancor Ingredients ltd, Universal Oleoresins, Adani Pharmachem Pvt Ltd, Plant Lipids, Ozone Naturals,
Paprika Oleo’s India Ltd, Bhoomi Natural Products and Exports Pvt Ltd, AVT Naturals Products Ltd
Regional Analysis North America, Europe, APAC, ROW
Country Analysis USA, Canada, Mexico, U.K, Germany, Spain, India, China, Japan, Brazil
Historical Forecast
2

(c) AZOTH Analytics
Table of Content
S.No Particulars Page No.
1. Research Methodology 28
2. Executive Summary 29
3. Strategic Recommendation 30
3.1 APAC Region to witness highest growth in forecast period 31
4. Oleoresins Product Outlook 33
4.1 Oleoresins 34
4.2 Types of Oleoresins 35
4.3 Advantages of Oleoresins 36
4.4 Applications of Oleoresins 37
3

(c) AZOTH Analytics
Table of Content
S.No Particulars Page No.
5. Global Oleoresins Market : Growth and Forecast 38
5.1 By Value (2013-2017) 39
5.2 By Value (2018-2023) 40
6 Global Oleoresins Market : Segment Analysis 53
6.1 Global Oleoresins Market, By Product : Breakdown (%) 55
6.1.1 Global Oleoresins Market, By Paprika 56
By Value (2013-2017) 56
By Value (2018-2023) 56
6.1.2 Global Oleoresins Market, By Black Pepper 57
By Value (2013-2017) 57
By Value (2018-2023) 57
6.1.3 Global Oleoresins Market, By Capsicum 58
4

(c) AZOTH Analytics
Table of Content
S.No Particulars Page No.
By Value (2013-2017) 58
By Value (2018-2023) 58
6.1.4 Global Oleoresins Market, By Turmeric 59
By Value (2013-2017) 59
By Value (2018-2023) 59
6.1.5 Global Oleoresins Market, By Ginger 60
By Value (2013-2017) 60
By Value (2018-2023) 60
6.1.6 Global Oleoresins Market, By Onion 61
By Value (2013-2017) 61
By Value (2018-2023) 61
6.1.7 Global Oleoresins Market, By Others 62
5
(c) AZOTH Analytics
Table of Content
S.No Particulars Page No.
By Value (2013-2017) 62
By Value (2018-2023) 62
6.2 Global Oleoresins Market, By Application : Breakdown (%) 64
6.1.1 Global Oleoresins Market, By Food & Beverage 65
By Value (2013-2017) 65
By Value (2018-2023) 65
6.1.2 Global Oleoresins Market, By Flavours 66
By Value (2013-2017) 66
By Value (2018-2023) 66
6.1.3 Global Oleoresins Market, By Pharmaceuticals 67
By Value (2013-2017) 67
By Value (2018-2023) 67
6
(c) AZOTH Analytics
Table of Content
S.No Particulars Page No.
6.1.4 Global Oleoresins Market, By Others 68
By Value (2013-2017) 68
By Value (2018-2023) 68
7 Global Oleoresins Market : Regional Analysis 69
7.1 Global Oleoresins Market, By Region : Breakdown (%) 70
8 North America Oleoresins Market : Growth and Forecast 72
8.1 By Value (2013-2017) 73
8.2 By Value (2018-2023) 74
8.3 North America Oleoresins Market : Segment Analysis 78
8.3.1 North America Oleoresins Market : By Product 79
By Value (2013-2017) 80
By Value (2018-2023) 81
7

(c) AZOTH Analytics
Table of Content
S.No Particulars Page No.
8.3.2 North America Oleoresins Market : By Application 82
By Value (2013-2017) 83
By Value (2018-2023) 84
8.4 North America Oleoresins Market : Country Analysis 85
8.4.1 North America Oleoresins Market, By Country : Breakdown (%)86
8.4.2 U.S Oleoresins Market 87
By Value (2013-2023) 88
By Product, By Value (2013-2023) 93
By Application, By Value (2013-2023) 96
8.4.3 Canada Oleoresins Market 99
By Value (2013-2023) 100
By Product, By Value (2013-2023) 104
8

(c) AZOTH Analytics
Table of Content
S.No Particulars Page No.
By Application, By Value (2013-2023) 107
8.4.4 Mexico Oleoresins Market 110
By Value (2013-2023) 111
By Product, By Value (2013-2023) 114
By Application, By Value (2013-2023)117
9 Europe Oleoresins Market : Growth and Forecast 120
9.1 By Value (2013-2017) 121
9.2 By Value (2018-2023)122
9.3 Europe Oleoresins Market : Segment Analysis129
9.3.1 Europe Oleoresins Market : By Product 130
By Value (2013-2017) 131
By Value (2018-2023) 132
9

(c) AZOTH Analytics
Table of Content
S.No Particulars Page No.
9.3.2 Europe Oleoresins Market : By Application 133
By Value (2013-2017) 134
By Value (2018-2023) 135
9.4 Europe Oleoresins Market : Country Analysis 136
9.4.1 Europe Oleoresins Market, By Country : Breakdown (%)137
9.4.2 U.K Oleoresins Market 138
By Value (2013-2023) 139
By Product, By Value (2013-2023) 143
By Application, By Value (2013-2023) 146
9.4.3 Germany Oleoresins Market 149
By Value (2013-2023) 150
By Product, By Value (2013-2023) 154
10

(c) AZOTH Analytics
Table of Content
S.No Particulars Page No.
By Application, By Value (2013-2023) 157
9.4.4 Spain Oleoresins Market 160
By Value (2013-2023) 161
By Product, By Value (2013-2023) 164
By Application, By Value (2013-2023) 167
9.4.5 Rest of Europe Oleoresins Market 170
By Value (2013-2023) 171
10 APAC Oleoresins Market : Growth and Forecast172
10.1 By Value (2013-2017) 173
10.2 By Value (2018-2023) 174
10.3 APAC Oleoresins Market : Segment Analysis 181
10.3.1 APAC Oleoresins Market : By Product 182
11

(c) AZOTH Analytics
Table of Content
S.No Particulars Page No.
By Value (2013-2017) 183
By Value (2018-2023)184
10.3.2 APAC Oleoresins Market : By Application 185
By Value (2013-2017) 186
By Value (2018-2023) 187
10.4 APAC Oleoresins Market : Country Analysis 188
10.4.1 APAC Oleoresins Market, By Country : Breakdown (%)189
10.4.2 India Oleoresins Market 190
By Value (2013-2023) 191
By Product, By Value (2013-2023) 195
By Application, By Value (2013-2023) 198
10.4.3 China Oleoresins Market 201
12

(c) AZOTH Analytics
Table of Content
S.No Particulars Page No.
By Value (2013-2023)202
By Product, By Value (2013-2023)206
By Application, By Value (2013-2023) 209
10.4.4 Japan Oleoresins Market 212
By Value (2013-2023) 213
By Product, By Value (2013-2023) 216
By Application, By Value (2013-2023) 219
10.4.5 Rest of APAC Oleoresins Market 222
By Value (2013-2023) 223
11 ROW Oleoresins Market : Growth and Forecast224
11.1 By Value (2013-2017) 225
11.2 By Value (2018-2023) 226
13

(c) AZOTH Analytics
Table of Content
S.No Particulars Page No.
11.3 ROW Oleoresins Market : Segment Analysis228
11.3.1 ROW Oleoresins Market : By Product229
By Value (2013-2017) 230
By Value (2018-2023) 231
11.3.2 ROW Oleoresins Market : By Application232
By Value (2013-2017) 233
By Value (2018-2023) 234
11.4 ROW Oleoresins Market : Country Analysis 235
11.4.1 ROW Oleoresins Market, By Country : Breakdown (%)236
11.4.2 Brazil Oleoresins Market 237
By Value (2013-2023) 238
By Product, By Value (2013-2023) 241
14
(c) AZOTH Analytics
Table of Content
S.No Particulars Page No.
By Application, By Value (2013-2023) 244
11.4.3 Rest of ROW Oleoresins Market 247
By Value (2013-2023) 248
12 Global Oleoresins Market Dynamics249
12.1 Global Oleoresins Market Drivers 250
13.2 Global Oleoresins Market Restraints 254
14 Global Oleoresins Market Trends 258
15 Porter Five Force Analysis261
16 SWOT Analysis 263
17 Company Profiling 265
17.1 Synthite Ingredients Ltd 266
17.2 Kancor Ingredients ltd 267
15

(c) AZOTH Analytics
Table of Content
S.No Particulars Page No.
17.3 Universal Oleoresins 269
17.4 Adani Pharmachem Pvt Ltd 270
17.5 Plant Lipids 271
17.6 Ozone Naturals 273
17.7 Paprika Oleo’s India Ltd 274
17.8 Bhoomi Natural Products and Exports Pvt Ltd 275
17.9 AVT Naturals Products Ltd 276
18 About Us 277
16
(c) AZOTH Analytics
List of Figures
Figure No. Figure Title Page No.
Figure 1: Global Oleoresins Market Size, By value , 2013-2017 (USD Million) 39
Figure 2: Global Oleoresins Market Size, By value , 2018-2023 (USD Million) 40
Figure 3: Global consumption of Flavours and Fragrances, By Value, (in billion USD) 42
Figure 4: Regional Breakdown of Flavours and Fragrances market in 2018 42
Figure 5: World Population Growth, 2010 & 2050 (in Billion) 44
Figure 6: Global Population growth, 2013-2017 (in Billion ) 44
Figure 7: Global labor force, 2013-2017(Billion) 45
Figure 8: Global labor force, 2013-2017(Billion) 45
Figure 9: Worldwide internet user penetration, 2014-2017(%) 46
Figure 10: Worldwide smartphone users, 2017 (In Billions) 46
Figure 11: Global Annual Meat Consumption Per Capita (in Kg ) 47
Figure 12: Global Annual Meat Consumption Per Capita, By Selected Country (in Kg ) 47
Figure 13: Global Savory Snacks Sales Volume, By Selected Country (in Kg m) 48
Figure 14: Global Seasonings, Dressings and Sauces Sales Volume, By Selected Country (in Kg m) 48
Figure 15: Global Confectionary Sales Volume, By Selected Country (in Kg m) 49
Figure 16: Global Dairy and Bakery Sales Volume, By Selected Country (in Kg m) 49
Figure 17: Global Average Annual Growth of Sales in the F&B Sector (By Region) 50
Figure 18: Top Largest Markets - Consumer Spending on Eating Out in 2016 (USD PPP) 50
Figure 19: Regional Breakdown of Consumer Spending on Eating Out in 2016 50
Figure 20: Outlook of Gross Domestic Production ,2018 (%) 52
17

(c) AZOTH Analytics
List of FiguresFigure No. Figure Title Page No.
Figure 21: Trend in Gross Domestic Production ,2018-2020 (%) 52
Figure 22: World Real GDP Growth , 2013-2023, in Trillion USD 52
Figure 23: Global Oleoresins Market Share, By Product, 2017 (%) 55
Figure 24: Global Oleoresins Market Share, By Product, 2023 (%) 55
Figure 25: Global Oleoresins Market, By Paprika, By Value, 2013-2017 (USD Million) 56
Figure 26: Global Oleoresins Market, By Paprika , By Value, 2018-2023 (USD Million) 56
Figure 27: Global Oleoresins Market, By Black Pepper, By Value, 2013-2017 (USD Million) 57
Figure 28: Global Oleoresins Market, By Black Pepper , By Value, 2018-2023 (USD Million) 57
Figure 29: Global Oleoresins Market, By Capsicum, By Value, 2013-2017 (USD Million) 58
Figure 30: Global Oleoresins Market, By Capsicum , By Value, 2018-2023 (USD Million) 58
Figure 31: Global Oleoresins Market, By Turmeric, By Value, 2013-2017 (USD Million) 59
Figure 32: Global Oleoresins Market, By Turmeric , By Value, 2018-2023 (USD Million) 59
Figure 33: Global Oleoresins Market, By Ginger, By Value, 2013-2017 (USD Million) 60
Figure 34: Global Oleoresins Market, By Ginger , By Value, 2018-2023 (USD Million) 60
Figure 35: Global Oleoresins Market, By Onion, By Value, 2013-2017 (USD Million) 61
Figure 36: Global Oleoresins Market, By Onion, By Value, 2018-2023 (USD Million) 61
Figure 37: Global Oleoresins Market, By Others, By Value, 2013-2017 (USD Million) 62
Figure 38: Global Oleoresins Market, By Others, By Value, 2018-2023 (USD Million) 62
Figure 39: Global Oleoresins Market Share, By Application, 2017 (%) 64
Figure 40: Global Oleoresins Market Share, By Application, 2023 (%) 64
18

(c) AZOTH Analytics
List of Figures
Figure No. Figure Title Page No.
Figure 41: Global Oleoresins Market, By Food & Beverage, By Value, 2013-2017 (USD Million) 65
Figure 42: Global Oleoresins Market, By Food & Beverage , By Value, 2018-2023 (USD Million) 65
Figure 43: Global Oleoresins Market, By Flavours, By Value, 2013-2017 (USD Million) 66
Figure 44: Global Oleoresins Market, By Flavours, By Value, 2018-2023 (USD Million) 66
Figure 45: Global Oleoresins Market, By Pharmaceuticals, By Value, 2013-2017 (USD Million) 67
Figure 46: Global Oleoresins Market, By Pharmaceuticals,By Value, 2018-2023 (USD Million) 67
Figure 47: Global Oleoresins Market, By Others, By Value, 2013-2017 (USD Million) 68
Figure 48: Global Oleoresins Market, By Others,By Value, 2018-2023 (USD Million) 68
Figure 49: Global Oleoresins Market Share, By Region, 2017 (%) 70
Figure 50: Global Oleoresins Market Share, By Region, 2023 (%) 71
Figure 51: North America Oleoresins Market Size, By value , 2013-2017 (USD Million) 73
Figure 52: North America Oleoresins Market Size, By value , 2018-2023 (USD Million) 74
Figure 53: Per Capita Annual Meat consumption in North America, By country, 2017 (in Kg ) 75
Figure 54: North America GDP, Current Price, 2013-2020 (in trillion USD) 76
Figure 55: North America GDP per capita, current prices, 2013-2023F (In USD)0 76
Figure 56: North America urban population, 2013-2016 (Millions) 77
Figure 57: North America number of internet users, by 2015-2017 (Millions)` 77
Figure 58: North America Oleoresins Market: By Product, By Value, 2013-2017 (USD Million) 80
Figure 59: North America Oleoresins Market: By Product, By Value, 2018-2023 (USD Million) 81
Figure 60: North America Oleoresins Market: By Application, By Value, 2013-2017 (USD Million) 83
19

(c) AZOTH Analytics
List of Figures
Figure No. Figure Title Page No.
Figure 61: North America Oleoresins Market: By Application, By Value, 2018-2023 (USD Million) 84
Figure 62: North America Oleoresins Market Share, By Country, 2017 (%) 86
Figure 63: North America Oleoresins Market Share, By Country, 2023 (%) 86
Figure 64: U.S Oleoresins Market, By Value, 2013-2017 (USD Million) 88
Figure 65: U.S Oleoresins Market, By Value, 2018-2023 (USD Million) 88
Figure 66: Retail Sales of Spices in United States (in million USD) 89
Figure 67: Revenue of the quick service restaurant industry (in billion USD) 89
Figure 68: Revenue of the quick service restaurant industry (in billion USD) 89
Figure 69: U.S Total retail and food services sales (in trillion USD) 90
Figure 70: United States. GDP, Current Price, 2013-2020 (in trillion USD) 90
Figure 71: U.S Population Growth 2013-2017 (in Million ) 91
Figure 72: U.S Household Disposable Income (annual growth rate in %), 2013-2016 91
Figure 73: U.S Oleoresins Market: By Product, By Value, 2013-2017 (USD Million) 94
Figure 74: U.S Oleoresins Market: By Product, By Value, 2018-2023 (USD Million) 95
Figure 75: U.S Oleoresins Market: By Application, By Value, 2013-2017 (USD Million) 97
Figure 76: U.S Oleoresins Market: By Application, By Value, 2018-2023 (USD Million) 98
Figure 77: Canada Oleoresins Market, By Value, 2013-2017 (USD Million) 100
Figure 78: Canada Oleoresins Market, By Value, 2018-2023 (USD Million) 100
Figure 79: Canada GDP, Current Price, 2013-2023 (in trillion USD) 101
Figure 80: Canada Population Growth 2013-2017 (in Million ) 101
20

(c) AZOTH Analytics
List of Figures
Figure No. Figure Title Page No.
Figure 81: Canada Household Disposable Income (annual growth rate in %), 2013-2016 102
Figure 82: Annual Per Capita Meat Consumption, 2013-2017, (in Kg) 102
Figure 83: Canada Oleoresins Market: By Product, By Value, 2013-2017 (USD Million) 105
Figure 84: Canada Oleoresins Market: By Product, By Value, 2018-2023 (USD Million) 106
Figure 85: Canada Oleoresins Market: By Application, By Value, 2013-2017 (USD Million) 108
Figure 86: Canada Oleoresins Market: By Application, By Value, 2018-2023 (USD Million) 109
Figure 87: Mexico Oleoresins Market, By Value, 2013-2017 (USD Million) 111
Figure 88: Mexico Oleoresins Market, By Value, 2018-2023 (USD Million) 111
Figure 89: Mexico Population Growth 2013-2017 (in Million ) 112
Figure 90: Mexico Household Spending's (in Billion USD), 2013-2017 112
Figure 91: GDP, Current Price, 2013-2018 (in Trillion USD) 112
Figure 92: Mexico Oleoresins Market: By Product, By Value, 2013-2017 (USD Million) 115
Figure 93: Mexico Oleoresins Market: By Product, By Value, 2018-2023 (USD Million) 116
Figure 94: Mexico Oleoresins Market: By Application, By Value, 2013-2017 (USD Million) 118
Figure 95: Mexico Oleoresins Market: By Application, By Value, 2018-2023 (USD Million) 119
Figure 96: Europe Oleoresins Market Size, By value , 2013-2017 (USD Million) 121
Figure 97: Europe Oleoresins Market Size, By value , 2018-2023 (USD Million) 122
Figure 98: Suppliers of Oleoresins to Europe (in tonnes) 123
Figure 99: Oleoresin Channels to European market 124
Figure 100: Imports of Oleoresins by Europe (in 1000 tonnes) 125
21

(c) AZOTH Analytics
List of Figures
Figure No. Figure Title Page No.
Figure 101: Europe Population Growth 2013-2017 (in Million ) 126
Figure 102: Europe Household Disposable Income (annual growth rate in %), 2013-2017 126
Figure 103: Europe GDP, 2013-2018 (in Trillion USD) 126
Figure 104: Europe urban population, 2013-2016 (Millions) 127
Figure 105: Europe number of internet users, by leading countries,2017(Millions) 127
Figure 106: Europe labor force, 2013-2016(Billion) 128
Figure 107: Europe gross disposable income of households per capita ,2013-2016 (PPS) 128
Figure 108: Europe Oleoresins Market: By Product, By Value, 2013-2017 (USD Million) 131
Figure 109: Europe Oleoresins Market: By Product, By Value, 2018-2023 (USD Million) 132
Figure 110: Europe Oleoresins Market: By Application, By Value, 2013-2017 (USD Million) 134
Figure 111: Europe Oleoresins Market: By Application, By Value, 2018-2023 (USD Million) 135
Figure 112: Europe Oleoresins Market Share, By Country, 2017 (%) 137
Figure 113: Europe Oleoresins Market Share, By Country, 2023 (%) 137
Figure 114: U.K Oleoresins Market, By Value, 2013-2017 (USD Million) 139
Figure 115: U.K Oleoresins Market, By Value, 2018-2023 (USD Million) 139
Figure 116: U.K. GDP, Current Prices, 2013-2023 (in trillion USD) 140
Figure 117: U.K. Consumer Expenditure on food, and drink, 2013-2023 (in billion pounds) 140
Figure 118: U.K Household Spending's (in Billion USD), 2013-2017 141
Figure 119: U.K Population Growth 2013-2017 (in Million ) 141
Figure 120: U.K Oleoresins Market: By Product, By Value, 2013-2017 (USD Million) 144
22

(c) AZOTH Analytics
List of Figures
Figure No. Figure Title Page No.
Figure 121: U.K Oleoresins Market: By Product, By Value, 2018-2023 (USD Million) 145
Figure 122: U.K Oleoresins Market: By Application, By Value, 2013-2017 (USD Million) 147
Figure 123: U.K Oleoresins Market: By Application, By Value, 2018-2023 (USD Million) 148
Figure 124: Germany Oleoresins Market, By Value, 2013-2017 (USD Million) 150
Figure 125: Germany Oleoresins Market, By Value, 2018-2023 (USD Million) 150
Figure 126: Germany GDP, Current Prices (2013-2020) (in trillion USD) 151
Figure 127: Germany Population Growth 2013-2017 (in Million ) 151
Figure 128: Germany Household Spending's (in Billion USD), 2013-2017 151
Figure 129: Germany annual per capita expenditure on food and beverage (in USD) 152
Figure 130: Production Structure of German/ Pharmaceutical Industry(%), 2017 152
Figure 131: Germany Pharmaceutical Production, 2013-2016 (€ Billion) 152
Figure 132: Germany Oleoresins Market: By Product, By Value, 2013-2017 (USD Million) 155
Figure 133: Germany Oleoresins Market: By Product, By Value, 2018-2023 (USD Million) 156
Figure 134: Germany Oleoresins Market: By Application, By Value, 2013-2017 (USD Million) 158
Figure 135: Germany Oleoresins Market: By Application, By Value, 2018-2023 (USD Million) 159
Figure 136: Spain Oleoresins Market, By Value, 2013-2017 (USD Million) 161
Figure 137: Spain Oleoresins Market, By Value, 2018-2023 (USD Million) 161
Figure 138: Spain GDP, Current Prices (2013-2018) (in trillion USD) 162
Figure 139: Spain Population Growth 2013-2017 (in Million ) 162
Figure 140: Spain Oleoresins Market: By Product, By Value, 2013-2017 (USD Million) 165
23
(c) AZOTH Analytics
List of Figures
Figure No. Figure Title Page No.
Figure 141: Spain Oleoresins Market: By Product, By Value, 2018-2023 (USD Million) 166
Figure 142: Spain Oleoresins Market: By Application, By Value, 2013-2017 (USD Million) 168
Figure 143: Spain Oleoresins Market: By Application, By Value, 2018-2023 (USD Million) 169
Figure 144: Rest of Europe Oleoresins Market, By Value, 2013-2017 (USD Million) 171
Figure 145: Rest of Europe Oleoresins Market, By Value, 2018-2023 (USD Million) 171
Figure 146: APAC Oleoresins Market Size, By value , 2013-2017 (USD Million) 173
Figure 147: APAC Oleoresins Market Size, By value , 2018-2023 (USD Million) 174
Figure 148: Per Capita Annual Meat consumption in APAC, By country, 2017 (in Kg ) 175
Figure 149: Average annual growth of sales in the F&B sector of APAC (major countries) 176
Figure 150: Evolution of Consumer Spending's on Eating Out in APAC (in billion USD) 176
Figure 151: Top Markets based on Consumer Spending on Eating Out in 2016 176
Figure 152: Export of Pepper of the genus Piper, By Value, in 2017 (in 1000 USD) 178
Figure 153: Export of Nutmeg, Mace & Cardamoms , By Value, in 2017 (in 1000 USD) 178
Figure 154: APAC GDP, Current Price (in Trillion USD) 179
Figure 155: APAC Population Growth 2013-2017 (in Million ) 179
Figure 156: Asia Pacific urban population, 2013-2016 (Millions) 180
Figure 157: Asia Pacific number of internet users, by leading countries,2017(Millions) 180
Figure 158: APAC Oleoresins Market: By Product, By Value, 2013-2017 (USD Million) 183
Figure 159: APAC Oleoresins Market: By Product, By Value, 2018-2023 (USD Million) 184
Figure 160: APAC Oleoresins Market: By Application, By Value, 2013-2017 (USD Million) 186
24
(c) AZOTH Analytics
List of Figures
Figure No. Figure Title Page No.
Figure 161: APAC Oleoresins Market: By Application, By Value, 2018-2023 (USD Million) 187
Figure 162: APAC Oleoresins Market Share, By Country, 2017 (%) 189
Figure 163: APAC Oleoresins Market Share, By Country, 2023 (%) 189
Figure 164: India Oleoresins Market, By Value, 2013-2017 (USD Million) 191
Figure 165: India Oleoresins Market, By Value, 2018-2023 (USD Million) 191
Figure 166: India GDP, Current Prices, 2013-2018 (In trillion USD) 192
Figure 167: India Population Growth 2013-2017 (in Million ) 192
Figure 168: India Seasonings, Dressings and Sauces Sales Revenue (in billion INR) 193
Figure 169: Annual Per Capita Meat Consumption, 2013-2017, (in Kg) 193
Figure 170: India Oleoresins Market: By Product, By Value, 2013-2017 (USD Million) 196
Figure 171: India Oleoresins Market: By Product, By Value, 2018-2023 (USD Million) 197
Figure 172: India Oleoresins Market: By Application, By Value, 2013-2017 (USD Million) 199
Figure 173: India Oleoresins Market: By Application, By Value, 2018-2023 (USD Million) 200
Figure 174: China Oleoresins Market, By Value, 2013-2017 (USD Million) 202
Figure 175: China Oleoresins Market, By Value, 2018-2023 (USD Million) 202
Figure 176: China Population Growth 2013-2017 (in Billion ) 203
Figure 177: China GDP, Current Prices (In trillion USD) 203
Figure 178: Annual Per Capita Meat Consumption, 2013-2017, (in Kg) 204
Figure 179: China Household Spending's (in Billion USD), 2013-2017 204
Figure 180: China Oleoresins Market: By Product, By Value, 2013-2017 (USD Million) 207
25

(c) AZOTH Analytics
List of Figures
Figure No. Figure Title Page No.
Figure 181: China Oleoresins Market: By Product, By Value, 2018-2023 (USD Million) 208
Figure 182: China Oleoresins Market: By Application, By Value, 2013-2017 (USD Million) 210
Figure 183: China Oleoresins Market: By Application, By Value, 2018-2023 (USD Million) 211
Figure 184: Japan Oleoresins Market, By Value, 2013-2017 (USD Million) 213
Figure 185: Japan Oleoresins Market, By Value, 2018-2023 (USD Million) 213
Figure 186: Japan GDP, Current Prices (In trillion USD) 214
Figure 187: Annual Per Capita Meat Consumption, 2013-2017, (in Kg) 214
Figure 188: Japan Household Spending's (in Billion USD), 2013-2017 214
Figure 189: Japan Oleoresins Market: By Product, By Value, 2013-2017 (USD Million) 217
Figure 190: Japan Oleoresins Market: By Product, By Value, 2018-2023 (USD Million) 218
Figure 191: Japan Oleoresins Market: By Application, By Value, 2013-2017 (USD Million) 220
Figure 192: Japan Oleoresins Market: By Application, By Value, 2018-2023 (USD Million) 221
Figure 193: Rest of APAC Oleoresins Market, By Value, 2013-2017 (USD Million) 223
Figure 194: Rest of APAC Oleoresins Market, By Value, 2018-2023 (USD Million) 223
Figure 195: ROW Oleoresins Market Size, By value , 2013-2017 (USD Million) 225
Figure 196: ROW Oleoresins Market Size, By value , 2018-2023 (USD Million) 226
Figure 197: GDP, Current Prices (in billion USD) 227
Figure 198: Middle East and Africa GDP, Current Price,2013-2017 (in Trillion USD)
227
Figure 199: Latin America & Caribbean Population Growth 2013-2017 (in Million ) 227
Figure 200: ROW Oleoresins Market: By Product, By Value, 2013-2017 (USD Million) 230
26
(c) AZOTH Analytics
List of FiguresFigure No. Figure Title Page No.
Figure 201: ROW Oleoresins Market: By Product, By Value, 2018-2023 (USD Million) 231
Figure 202: ROW Oleoresins Market: By Application, By Value, 2013-2017 (USD Million) 233
Figure 203: ROW Oleoresins Market: By Application, By Value, 2018-2023 (USD Million) 234
Figure 204: ROW Oleoresins Market Share, By Country, 2017 (%) 236
Figure 205: ROW Oleoresins Market Share, By Country, 2023 (%) 236
Figure 206: Brazil Oleoresins Market, By Value, 2013-2017 (USD Million) 238
Figure 207: Brazil Oleoresins Market, By Value, 2018-2023 (USD Million) 238
Figure 208: Brazil Population Growth 2013-2017 (in Million ) 239
Figure 209: Brazil GDP, Current Prices (in trillion USD) 239
Figure 210: Brazil Oleoresins Market: By Product, By Value, 2013-2017 (USD Million) 242
Figure 211: Brazil Oleoresins Market: By Product, By Value, 2018-2023 (USD Million) 243
Figure 212: Brazil Oleoresins Market: By Application, By Value, 2013-2017 (USD Million) 245
Figure 213: Brazil Oleoresins Market: By Application, By Value, 2018-2023 (USD Million) 246
Figure 214: Rest of ROW Oleoresins Market, By Value, 2013-2017 (USD Million) 248
Figure 215: Rest of ROW Oleoresins Market, By Value, 2018-2023 (USD Million) 248
Figure 216: Kancor Range of Oleoresins 268
Figure 217: Plant Lipids Range of Oleoresins 272
27

(c) AZOTH Analytics
For our study on Global Oleoresins Market, we have conducted comprehensive secondary research
followed by an extensive primary research. In the process of secondary research, we have scrutinized
industry documents, accessed from open sources, premium paid databases (Bloomberg, Thomson
Reuters, Factiva) and our internal knowledge base. In the process of primary research, we have
interviewed various industry experts across the value chain of Chemical industry.
Market size of the actual period (2013-2017) has been evaluated on the basis of growth trends of
the industry in the last five years, and confirming the findings through primary research. Annual
reports of the companies were scanned to further validate the market size and to estimate the size
of various other end-user sectors. Market sizing and growth in the forecast period (2018-2023) is
estimated through product mapping, application in end-user industries, growth of allied sectors and
historical growth pattern of the industry. All the relevant data points/ statistics in the forecast
period are validated through relevant and reliable primary sources.
Report Focus: Global Oleoresins Market
- By Product (Paprika, Black Pepper, Capsicum, Turmeric, Ginger, Onion and Others)
- By Application (Food & Beverage, Flavours, Pharmaceuticals and Others)
- By Region (North America, Europe, Asia Pacific, ROW)
- By Country ( U.S, Canada, Mexico, U.K, Germany, Spain, India, China, Japan, Brazil)
Research Methodology
28

(c) AZOTH Analytics
Source: Azoth Analytics Estimates
Xx
Xx
Xx
Xx
Xx
Growing consumption by flavours and food & beverage industries coupled with increasing demand for
food and flavours from naturally healthy ingredients has been driving the global oleoresins market
2013 2014 2015 2016 2017
Figure 1: Global Oleoresins Market Size, By value , 2013-2017 (USD Million)
CAGR 2013-2017
X.XX%
Global Oleoresins Market
29

(c) AZOTH Analytics
Source: Azoth Analytics Estimates
Xx
Xx
Xx
Xx
Xx
Xx
Changing lifestyle, growing economy, rising net disposable income coupled with changing food eating
habits and increasing food expenditures are some of the factors that will drive the market
2018 2019 2020 2021 2022 2023
Figure 2: Global Oleoresins Market Size, By value , 2018-2023 (USD Million)
CAGR 2018-2023
X.XX%
Global Oleoresins Market
30

(c) AZOTH Analytics
Source: Azoth Analytics Estimates
Xx
Xx
Xx
Xx
Xx
Xx
Increased penetration and awareness regarding oleoresins and their applications in industries such as
flavour, food and beverage and pharmaceuticals has been backing North America Oleoresins market
2013 2014 2015 2016 2017
Figure 51: North America Oleoresins Market Size, By value , 2013-2017 (USD Million)
CAGR 2013-2017
X.XX%
North America Oleoresins Market
31

(c) AZOTH Analytics
Source: Azoth Analytics Estimates
Xx
Xx
Xx
Xx
Xx
Xx
Growing economy, increasing per capita income coupled with rising food expenditure are expected
to boost the market of oleoresins in forecasted period
2018 2019 2020 2021 2022 2023
Figure 52: North America Oleoresins Market Size, By value , 2018-2023 (USD Million)
CAGR 2018-2023
X.XX%
North America Oleoresins Market
32

(c) AZOTH Analytics
North America Oleoresins Market, By Product
Figure 58: North America Oleoresins Market: By Product, By Value, 2013-2017 (USD Million)
Source: Azoth Analytics Estimates
2013 2014 2015 2016 2017
Paprika Black Pepper Capsicum Turmeric Ginger Onion Others
CAGR 2013-2017
Paprika : X.XX%, Black Pepper : X.XX%, Capsicum : X.XX%
Turmeric : X.XX%, Ginger : X.XX%, Onion : X.XX%
Others : X.XX%
2013 2014 2015 2016 2017
Paprika xx xx xx xx xx
Black Pepper xx xx xx xx xx
Capsicum xx xx xx xx xx
Turmeric xx xx xx xx xx
Ginger xx xx xx xx xx
Onion xx xx xx xx xx
Others xx xx xx xx xx
33
(c) AZOTH Analytics
North America Oleoresins Market, By Product
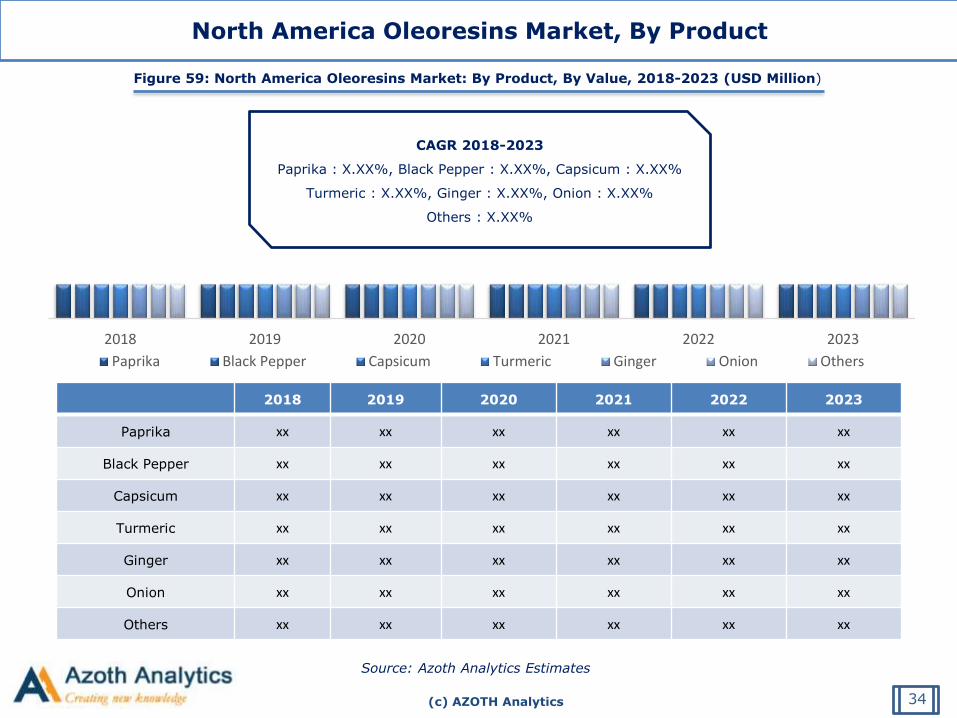
Figure 59: North America Oleoresins Market: By Product, By Value, 2018-2023 (USD Million)
Source: Azoth Analytics Estimates
2018 2019 2020 2021 2022 2023
Paprika Black Pepper Capsicum Turmeric Ginger Onion Others
CAGR 2018-2023
Paprika : X.XX%, Black Pepper : X.XX%, Capsicum : X.XX%
Turmeric : X.XX%, Ginger : X.XX%, Onion : X.XX%
Others : X.XX%
2018 2019 2020 2021 2022 2023
Paprika xx xx xx xx xx xx
Black Pepper xx xx xx xx xx xx
Capsicum xx xx xx xx xx xx
Turmeric xx xx xx xx xx xx
Ginger xx xx xx xx xx xx
Onion xx xx xx xx xx xx
Others xx xx xx xx xx xx
34

(c) AZOTH Analytics
North America Oleoresins Market, By Application
Figure 60: North America Oleoresins Market: By Application, By Value, 2013-2017 (USD Million)
Source: Azoth Analytics Estimates
2013 2014 2015 2016 2017
Food & Beverage Flavours Pharmaceuticals Others
CAGR 2013-2017
Food & Beverage : X.XX%
Flavours : X.XX%
Pharmaceuticals : X.XX%
Others : X.X%
2013 2014 2015 2016 2017
Food & Beverage xx xx xx xx xx
Flavours xx xx xx xx xx
Pharmaceuticals xx xx xx xx xx
Others xx xx xx xx xx
35

(c) AZOTH Analytics
North America Oleoresins Market, By Application
Figure 61: North America Oleoresins Market: By Application, By Value, 2018-2023 (USD Million)
Source: Azoth Analytics Estimates
2018 2019 2020 2021 2022 2023
Food & Beverage Flavours Pharmaceuticals Others
CAGR 2018-2023
Food & Beverage : X.XX%
Flavours : X.XX%
Pharmaceuticals : X.XX%
Others : X.X%
2018 2019 2020 2021 2022 2023
Food & Beverage xx xx xx xx xx xx
Flavours xx xx xx xx xx xx
Pharmaceuticals xx xx xx xx xx xx
Others xx xx xx xx xx xx
36

(c) AZOTH Analytics
North America Oleoresins Market- By Country
Figure 62: North America Oleoresins Market
Share, By Country, 2017 (%)
Source: Azoth Analytics Estimates
U.S Canada
Figure 63: North America Oleoresins Market
Share, By Country, 2023 (%)
U.S Canada
37

(c) AZOTH Analytics
U.S Oleoresins Market, By Product
Figure 73: U.S Oleoresins Market: By Product, By Value, 2013-2017 (USD Million)
Source: Azoth Analytics Estimates
2013 2014 2015 2016 2017
Paprika Black Pepper Capsicum Turmeric Ginger Onion Others
CAGR 2013-2017
Paprika : X.XX%, Black Pepper : X.XX%, Capsicum : X.XX%
Turmeric : X.XX%, Ginger : X.XX%, Onion : X.XX%
Others : X.XX%
2013 2014 2015 2016 2017
Paprika xx xx xx xx xx
Black Pepper xx xx xx xx xx
Capsicum xx xx xx xx xx
Turmeric xx xx xx xx xx
Ginger xx xx xx xx xx
Onion xx xx xx xx xx
Others xx xx xx xx xx
38

(c) AZOTH Analytics
U.S Oleoresins Market, By Product
Figure 74: U.S Oleoresins Market: By Product, By Value, 2018-2023 (USD Million)
Source: Azoth Analytics Estimates
2018 2019 2020 2021 2022 2023
Paprika Black Pepper Capsicum Turmeric Ginger Onion Others
CAGR 2018-2023
Paprika : X.XX%, Black Pepper : X.XX%, Capsicum : X.XX%
Turmeric : X.XX%, Ginger : X.XX%, Onion : X.XX%
Others : X.XX%
2018 2019 2020 2021 2022 2023
Paprika xx xx xx xx xx xx
Black Pepper xx xx xx xx xx xx
Capsicum xx xx xx xx xx xx
Turmeric xx xx xx xx xx xx
Ginger xx xx xx xx xx xx
Onion xx xx xx xx xx xx
Others xx xx xx xx xx xx
39

(c) AZOTH Analytics
U.S Oleoresins Market, By Application
Figure 75: U.S Oleoresins Market: By Application, By Value, 2013-2017 (USD Million)
Source: Azoth Analytics Estimates
2013 2014 2015 2016 2017
Food & Beverage Flavours Pharmaceuticals Others
CAGR 2013-2017
Food & Beverage : X.XX%
Flavours : X.XX%
Pharmaceuticals : X.XX%
Others : X.X%
2013 2014 2015 2016 2017
Food & Beverage xx xx xx xx xx
Flavours xx xx xx xx xx
Pharmaceuticals xx xx xx xx xx
Others xx xx xx xx xx
40

(c) AZOTH Analytics
U.S Oleoresins Market, By Application
Figure 76: U.S Oleoresins Market: By Application, By Value, 2018-2023 (USD Million)
Source: Azoth Analytics Estimates
2018 2019 2020 2021 2022 2023
Food & Beverage Flavours Pharmaceuticals Others
CAGR 2018-2023
Food & Beverage : X.XX%
Flavours : X.XX%
Pharmaceuticals : X.XX%
Others : X.X%
2018 2019 2020 2021 2022 2023
Food & Beverage xx xx xx xx xx xx
Flavours xx xx xx xx xx xx
Pharmaceuticals xx xx xx xx xx xx
Others xx xx xx xx xx xx
41

(c) AZOTH Analytics
Plant Lipids
COMPANY AT A GLANCE
Company Type: Private
Headquarter : Kerala, India
Year of Incorporation: 1979
Product Categories: Essential oils, Oleoresins, Natural
Food Colours, Specialty Extracts, Spray Dried Products,
Spices and Supersol
Industry: Manufacturing Industry
Website: www.plantlipids.com
BUSINESS OVERVIEW
• Headquartered in Kerala, Plants Lipids is one of the leading producer
of spice extracts, essential oils and natural food colours in the world.
Plant Lipids has the largest pepper producing facility in the world that
is located in Srilanka.
• The product portfolio of the company ranges from oleoresins,
essential oils, natural food colours, specialty extracts to micro –
encapsulated products etc. The country supplies over 500 products to
more than 80 countries worldwide.
• Across 3 Indian states and Srilanka, the company has 16 processing
units. Also the company each day processes 200 tons of raw material
Presence in Oleoresins Market
• Plant Lipids is the world’s largest producer and exporter of oleoresin capsicum. The company manufactures both oil and water
soluble oleoresins for their application as flavouring agent in food processing industry. The company also provides customized
oleoresins within a range by adjusting active principles and volatile oil levels.
42

(c) AZOTH Analytics
Source: Plant Lipids
Figure 217: Plant Lipids Range of Oleoresins
Plant Lipids
Oleoresins
Black Pepper Fenugreek Juniper Berry Clove Bud Onion
Cardamom GingerRosemary
ExtractCumin Seed Mace
Celery Seed Lemon Grass White Pepper Fennel SeedOlibanum
Resino
Coriander Seed Nutmeg Capsicum Galangal Parsley Seed
Curry Garlic Cassia Bark Nutmeg Oil Vanilla Extract
43

(c) AZOTH Analytics
About Azoth Analytics Pvt Ltd.
Azoth Analytics is a business research and analytics firm that creates in-depth research res and provides customized research solutionsand consultancy services. Verticals in which Azoth Analytics specializes include healthcare and Pharmaceutical, oil and gas, retail,chemicals, automotive, FMCG, food & beverages and technology. Azoth creates comprehensive and in-depth research res by recording,interpreting and analyzing information. Strategic market sizing and data dredging End Users include secondary research, and primaryresearch (interviews with management personnel and industry experts).
Related Reports:
Disclaimer: Azoth Analytics report information is based mainly on interviews and therefore, is subject to fluctuation. Azoth Analytics
therefore, takes no responsibility for any incorrect information supplied to us by industry experts, manufacturers or User. Azoth does not
warranty the completeness of the information and data. Also, analysis provided in the re are meant for customers’ internal use only and
not for general publication or disclosure to third parties.
44