global imbalances and the revised bretton woods hypothesis ... · nal bretton woods system is...
TRANSCRIPT

Working PaperInstitut für Makroökonomie
und KonjunkturforschungMacroeconomic Policy Institute
Thomas I. Palley1
Global imbalances and the Revised Bretton Woods hypothesis: Wrong before the crisis and wrong afterJanuary 2013
Abstract
This paper explores and contrasts the revised Bretton Woods hy-pothesis (BW II) with the structural Keynesian hypothesis. Whereas the former sees the growing global imbalances of the three decades prior to the financial crisis of 2008 as beneficial, the latter sees them as problematic and destructive of shared prosperity in the United States. Moreover, the U.S. economic relationship with China is view-ed as especially problematic as it involves the largest bi-lateral trade deficit, and because it has also been a major source of investment diversion and manufacturing job loss. The paper’s conclusion is the BW II analogy between today’s global financial system and the origi-nal Bretton Woods system is without foundation, but it survives be-cause the hypothesis helps rationalize and justify large trade deficits and the process of corporate globalization.
Keywords: Revised Bretton Woods hypothesis, Structural Keynesian hypothesis, global imbalances, U.S. trade deficit
JEL Classication: F02, F32, F33
1 Thomas I. Palley, New America Foundation, Washington DC,E-mail: [email protected]
108January 2013

1
Global imbalances and the Revised Bretton Woods hypothesis: Wrong before the crisis and wrong after
Abstract
This paper explores and contrasts the revised Bretton Woods hypothesis (BW II) with the structural Keynesian hypothesis. Whereas the former sees the growing global imbalances of the three decades prior to the financial crisis of 2008 as beneficial, the latter sees them as problematic and destructive of shared prosperity in the United States. Moreover, the U.S. economic relationship with China is viewed as especially problematic as it involves the largest bi-lateral trade deficit, and because it has also been a major source of investment diversion and manufacturing job loss. The paper’s conclusion is the BW II analogy between today’s global financial system and the original Bretton Woods system is without foundation, but it survives because the hypothesis helps rationalize and justify large trade deficits and the process of corporate globalization. Keywords: Revised Bretton Woods hypothesis, Structural Keynesian hypothesis, global imbalances, U.S. trade deficit. JEL ref.: F02, F32, F33.
Thomas I. Palley Senior Economic Policy Adviser
AFL-CIO Washington, D.C.
January 2013

2
1. The political economy of the Bretton Woods II hypothesis
The revised Bretton Woods hypothesis (BW II) advanced by economists Michael
Dooley, David Folkerts-Landau, and Peter Garber (2003, 2004) is one of a family of
hypotheses developed in the 2000s to explain the U.S. trade deficit as a beneficial
phenomenon for both the U.S. and global economies. By rationalizing the trade deficit as
beneficial, the hypothesis has given support to mainstream economics’ claim regarding
the benefits of free trade and globalization. In doing so, the hypothesis has served to
counter opposition to free trade and globalization which pointed to massive trade
imbalances as prima facie evidence of economic damage. Because it was early in the
game of trade deficit rationalization, the BW II hypothesis was quickly popularized by
economists.
This paper explores and contrasts the BW II hypothesis with the structural
Keynesian hypothesis (Palley, 2007/8, 2011, 2012a, 2012b). Whereas the former sees
U.S. trade and globalization policy of the last three decades as beneficial, the latter sees it
as problematic and destructive of shared prosperity in the United States. Moreover, the
U.S. economic relationship with China is viewed as especially problematic as it involves
the largest bi-lateral trade deficit, and because it has also been a major source of
investment diversion and manufacturing job loss.
The paper’s conclusion is the analogy between today’s global financial system
and the original Bretton Woods system is without foundation; the BW II hypothesis was
wrong before the economic crisis of 2008; and it is wrong after the crisis. That it survives
is testament to the forces of ideology guiding international economics and the political
usefulness of the hypothesis.
3
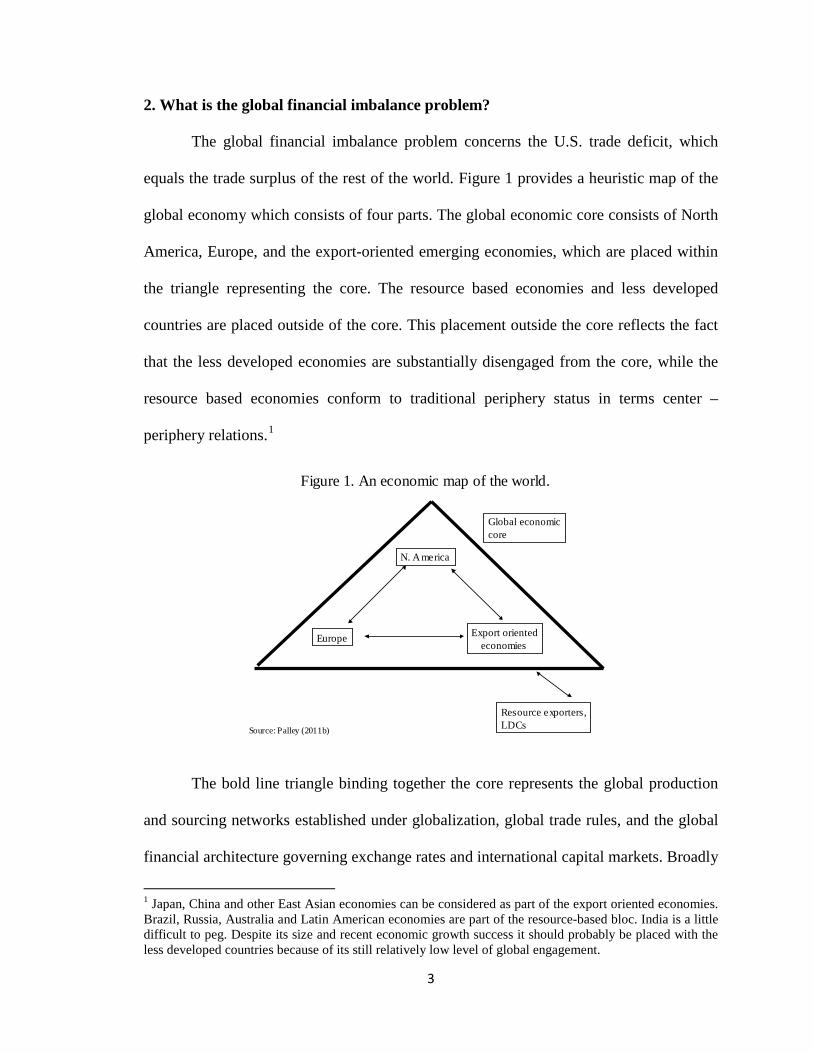
2. What is the global financial imbalance problem?
The global financial imbalance problem concerns the U.S. trade deficit, which
equals the trade surplus of the rest of the world. Figure 1 provides a heuristic map of the
global economy which consists of four parts. The global economic core consists of North
America, Europe, and the export-oriented emerging economies, which are placed within
the triangle representing the core. The resource based economies and less developed
countries are placed outside of the core. This placement outside the core reflects the fact
that the less developed economies are substantially disengaged from the core, while the
resource based economies conform to traditional periphery status in terms center –
periphery relations.1
Figure 1. An economic map of the world.
N. America
Europe Export orientedeconomies
Resource exporters,LDCs
Global economiccore
Source: Palley (2011b)
The bold line triangle binding together the core represents the global production
and sourcing networks established under globalization, global trade rules, and the global
financial architecture governing exchange rates and international capital markets. Broadly
1 Japan, China and other East Asian economies can be considered as part of the export oriented economies. Brazil, Russia, Australia and Latin American economies are part of the resource-based bloc. India is a little difficult to peg. Despite its size and recent economic growth success it should probably be placed with the less developed countries because of its still relatively low level of global engagement.
4
speaking, North America has run trade deficits with all regions. Europe has run a surplus
with North America and a deficit with the export-oriented economies. The export-
oriented economies have run surpluses with both North America and Europe. Within the
North America region, the U.S. has run large trade deficits with its NAFTA trade
partners, Canada and Mexico. In recent years, the resource exporting economies have
also run an aggregate trade surplus on the back of higher commodity prices.
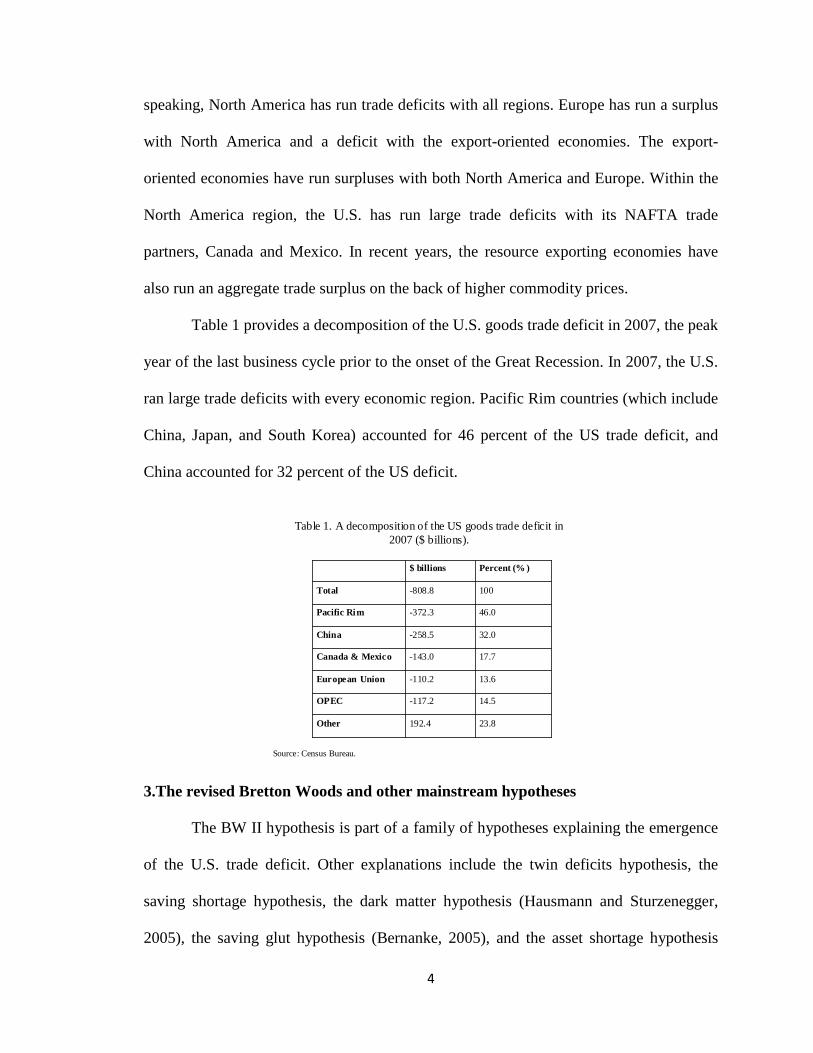
Table 1 provides a decomposition of the U.S. goods trade deficit in 2007, the peak
year of the last business cycle prior to the onset of the Great Recession. In 2007, the U.S.
ran large trade deficits with every economic region. Pacific Rim countries (which include
China, Japan, and South Korea) accounted for 46 percent of the US trade deficit, and
China accounted for 32 percent of the US deficit.
Table 1. A decomposition of the US goods trade deficit in 2007 ($ billions).
Percent (% )$ billions
23.8192.4Other
14.5-117.2OPEC
13.6-110.2European Union
17.7-143.0Canada & Mexico
32.0-258.5China
46.0-372.3Pacific Rim
100-808.8Total
Source: Census Bureau.
3.The revised Bretton Woods and other mainstream hypotheses
The BW II hypothesis is part of a family of hypotheses explaining the emergence
of the U.S. trade deficit. Other explanations include the twin deficits hypothesis, the
saving shortage hypothesis, the dark matter hypothesis (Hausmann and Sturzenegger,
2005), the saving glut hypothesis (Bernanke, 2005), and the asset shortage hypothesis

5
(Caballero, 2006, 2007). These various hypotheses are illustrated in Figure 2, which
groups them in terms of different stages of thinking about the trade deficit. Stage 1
thinking produced the twin deficits and saving shortage hypotheses. Stage 2 thinking
produced the BWII hypothesis, dark matter hypothesis, saving glut hypothesis, and asset
shortage hypothesis.
Figure 2. Mainstream explanations of the U.S. trade deficit and global financial imbalances.
Hypotheses about the U.S. trade deficit & global imbalances
BW II Darkmatter
Savingshortage
Twindeficits
Savingglut
Assetshortage
Stage 1:1980 - 2000
Stage 2:2000 - 2007
The twin deficits hypothesis was developed in the 1980s and maintained the U.S.
trade deficit was caused by its purported twin, the U.S. budget deficit. It reflects the
concern of mainstream economists with the Reagan budget deficits of the 1980s.
However, it fell out of favor with the Clinton budget surpluses of the 1990s that
accompanied record trade deficits. Japan and Germany also consistently generated trade
surpluses at the same time that they were generating increasing budget deficits.
The saving shortage hypothesis was popular in the 1990s and maintained that the
U.S. trade deficit was the result of a low U.S. household saving rate (i.e. excessive

6
consumption). It reflects the U.S. economic boom of the 1990s that saw a further fall in
U.S. household saving rates. However, it fell out of fashion in the 2000s as the U.S.
languished with record trade deficits, combined with demand shortage and jobless
recovery that necessitated the Federal Reserve push interest rates to record lows to spur
recovery.
The dark matter hypothesis (Hausmann and Sturzenegger, 2005) was developed
in the 2000s, around the same time as the BWII hypothesis. It maintains the U.S. trade
deficit reflects the ability of the U.S. to run a persistent trade deficit because of superior
U.S. investment returns on foreign direct investment which funds the deficit. These
super-normal returns mean the U.S. has nothing to worry about from incurring large
debts to the rest of the world via the trade deficit.
The saving glut hypothesis (Bernanke, 2005) was also developed in the 2000s and
it maintains the U.S. trade deficit is the result of excessive saving by East Asian
economies, particularly China. Finally, the asset shortage hypothesis (Caballero, 2006,
2007) maintains that the world economy is suffering from a shortage of high quality
financial assets owing to increased asset demand caused by rising global income, which
the hypothesis attributes to globalization. It then asserts that the U.S. has a comparative
advantage in producing high quality financial assets and the U.S. uses this advantage to
run a trade deficit. In effect, the U.S. trades financial liabilities for goods.
The BWII hypothesis (Dooley et al., 2003, 2004) constitutes part of stage 2
thinking. In many regards, it is a pioneer in its emphasis on the role of financial assets – a
role that has been taken up in the asset shortage hypothesis. According to the BW II
hypothesis, globalization had created a brave new world of opportunity in which

7
emerging markets (EM) are industrializing. As part of this process, EM countries need to
acquire hard assets which supposedly provide collateral for foreign direct investment
(FDI) in those economies.
The hypothesis claims that this situation creates a parallel with the original
Bretton Woods arrangement that ruled from 1945 – 1971. Back then the U.S. was the
world’s dominant economy and in the late 1950s its current account started to deteriorate
as Europe and Japan recovered from World War II damage, while they also borrowed
from the U.S. in order acquire dollar balances needed to finance growing global trade.
The BW II claim is the U.S. is now running large systematic trade deficits, this time to
provide EM economies with collateral that can assist their industrialization. In this
fashion, the hypothesis explains why the U.S. is running trade deficits, and it also
explains why EM economies are running trade surpluses
A claimed strength of the hypothesis is that it explains the pattern of capital flows
between the U.S. and EM economies, which is contrary to the predictions of conventional
theory that predict the reverse. According to conventional neoclassical trade theory,
capital should flow from capital-abundant rich countries (i.e. the U.S.) to capital-scarce
poor countries (i.e. EM economies) because rates of return are higher in capital-scarce
economies. That is not happening according to the picture provided by the global
imbalances. The BW II hypothesis explains why it is not happening; argues it is a good
thing; and asserts it can go on for a long while.
As for implications and predictions, the BW II hypothesis maintains the U.S.
trade deficit is unproblematic and stands to continue for a considerable while longer.
From a historical vantage, the comparison is with 1958 rather than 1971, the year of

8
demise of the original Bretton Woods system. The argument is developing countries still
have a long way to go with their development projects and still need to accumulate
considerably more collateral to support their development plans. Consequently, they will
continue to run trade surpluses and the U.S. will continue to run trade deficits long into
the future. At some future date that process will eventually end once EM economies have
fully emerged and have no further need for additional collateral. At that time, the dollar
should start to weaken, the U.S. trade deficit should start to correct, and the global
imbalance problem should self-correct.
The variety of explanations of the U.S. trade deficit, with their different
reasoning, reflects the political economy that has driven mainstream economic analysis of
the U.S. trade deficit and global imbalances. The BW II hypothesis, dark matter
hypothesis, saving glut hypothesis, and asset shortage hypothesis all attempt to introduce
both financial factors and the effects of globalization into discussion of the U.S. trade
deficit. A striking feature is that all except the saving glut hypothesis view the trade
deficit as benign and even benevolent. The U.S. is taking advantage of its comparative
advantage in investment and production of financial assets and engaging in welfare
enhancing trade.
Moreover, all four hypotheses, including the saving glut hypothesis, assert
globalization has been good for the U.S. economy and existing trade and globalization
policy should be continued. The BW II hypothesis says trade deficits are the way to
promote global economic development, including U.S. economic growth. The dark
matter hypothesis says the deficit is unproblematic and fully paid for by super-normal
returns on U.S. FDI. The asset shortage hypothesis claims the trade deficit and asset price
9
bubbles are the way to solve the asset shortage problem. The saving glut hypothesis urges
China to reduce its saving, but it is not critical of globalization and the trading regime.
According to its reasoning, China is in fact providing the U.S. with a “free lunch” by
dumping goods below marginal cost and by lending at ultra-low real interest rates. The
only damage from the trade deficit is the result of financial market failure, which may
have resulted in misallocation of resources borrowed from China.2
In sum, all four hypotheses cheerlead for free trade and globalization. Three of the
four present the trade deficit as benign, thereby rationalizing policymaker indifference to
the deficit. Only the saving glut hypothesis seeks to acknowledge public concern about
the trade deficit, and it does so with a pseudo-Keynesian discourse about saving glut.
However, analytically it is un-Keynesian, and any problems for the U.S. economy are the
result of financial market misallocation of resources and not demand shortage.
4. The structural Keynesian explanation of global financial imbalances
The structural Keynesian hypothesis (Palley, 2006, 2011a, 2012a, 2012b)
provides an alternative view of global financial imbalances and explains them as part of
the process of neoliberal corporate globalization which took off in the 1980s. From a
historical perspective, the completion of the 1979 Tokyo GATT round can be seen to
mark the end of the era of free trade and the beginning of the era of corporate
globalization that has produced the global imbalances. Table 2 shows the U.S. trade
balance by business cycle peak year for the period 1960 – 2007. From 1960 to 1980 U.S.
trade was roughly balanced, but after 1980 the U.S. started running steadily increasing
trade deficits that reached 5.9 percent of GDP in 2007.
2 All of the hypotheses adopt a loanable funds approach to trade deficits and surpluses, the macroeconomic effects of which are manifested via interest rates.

10
Table 2. The U.S. goods & services trade deficit by business cycle peaks, 1960 – 2007.
Sources: Economic Report of the President, 2009 and author's calculations.
-5.913,807.5-819,3732007-4.210,128.0-429,5192001-1.95,803.1-111,0371990-0.93,128.4-28,0231981-0.92,789.5-25,50019800.11,382.71,90019730.0984.69119690.7526.43,5081960
Trade deficit/GDP (% )
GDP($ billions)
Trade deficit($ millions)
Peak year
The critical feature of Table 2 is it shows that the U.S. trade deficit has been a
long-evolving matter. The profound change in the trade deficit profile occurred around
1980, reflecting the structural changes associated with the advent of the neoliberal era.
Pre-1980 the U.S. trade account was roughly balanced. After 1980, the trade account
began a long steady descent into significant deficit.
This development was supported by economists, policymakers, and big business.
Among economists, free trade continued to be justified and rationalized on the traditional
grounds of comparative advantage. However, the addition of inter-temporal consumption
choice provided an explanation of and justification for free trade that produces persistent
deficits, a feature not present in the standard model of comparative advantage.
Among policymakers, pre-1980 economic thinking was dominated by Keynesian
logic and policymakers viewed trade deficits with concern as they represented a leakage
of aggregate demand (AD). After 1980, with the turn to neoliberal thinking, policymakers

11
have viewed trade deficits as semi-virtuous because trade helps constrain inflation.
Moreover, according to the logic of the new inter-temporal models of trade, deficits are
not a bad thing as they reflect market choices that are supposedly good for the economy.
For big business, in the 1980s trade opening was viewed favorably as a means of
disciplining industrial labor unions and reversing the profit-squeeze of the late 1960s and
1970s. Subsequently, in the 1990s trade opening became part of the logic of creating a
“global production zone” in which American firms could either produce for export back
to the U.S. or from which they could source cheaper inputs.
Both policymakers and business have therefore seen trade through the lens of
costs and wages. For policymakers, trade openness has been a means of constraining
inflation. For business, trade openness was initially a means of disciplining workers, and
subsequently it has been at the center of a strategy aimed at creating a global production
zone in which business could access lowest cost labor.
This congruence of policymaker and big business interests, justified by
economists’ theories, explains why the era of neoliberal globalization has systematically
produced unbalanced trade that culminated in the global financial imbalances problem.
The Keynesian free trade era (1945 – 1980) produced roughly balanced trade because
policymakers were averse to large deficits for macroeconomic reasons. In the neoliberal
era, policymakers have had little interest in constraining trade deficits, and big business
has actively benefitted from deficits.
The critical new development driving the global production zone model has been
the increased international mobility of means of production (capital and technology),
resulting from improved transportation, communication, and ability to manage globally

12
diversified production networks. This created the possibility of global production
configured on the principle of global cost arbitrage.
The new reality was captured in late 1990s by ago Jack Welch, who was then
CEO of General Electric, talked of ideally having “every plant you own on a barge”. The
economic logic was that factories should float between countries to take advantage of
lowest costs, be they due to under-valued exchange rates, low taxes, subsidies, or a surfeit
of cheap labor.
Trade remains central to the global production zone model as goods must cross
borders, and hence the need for trade agreements. However, the logic of barge economics
(Palley, 2007) is fundamentally different from comparative advantage, though
comparative advantage and the theory of free trade are still invoked to provide cover for
the new order.
The global production zone model took off in the 1990s and there were three
critical stages to its implementation. Stage 1 was the passage of the North American Free
Trade Agreement (NAFTA); stage 2 was the strong dollar policy put in place after East
Asia financial crisis of 1997; and stage 3 was the granting of permanent normal trading
relations (PNTR) by the U.S. to China
Stage 1: NAFTA
NAFTA fused together the U.S., Canada, and Mexico into a unified production
zone. Its historical significance is that it joined developed and developing economies
together for the first time, thereby establishing the template corporations wanted. It also
changed the significance and political economy of exchange rates. Previously exchange
rates mattered principally for trade: after NAFTA, they mattered significantly for location

13
of production. NAFTA also changed corporations’ attitude to exchange rates. Before,
corporations opposed a strong dollar because it undermined domestic manufacturing
competitiveness: after, they increasingly supported a strong dollar because it lowers the
price of imported products and raises profit margins. Finally, NAFTA created a critical
precedent for strong dollar policy because the U.S, accepted peso devaluation after the
Mexican financial crisis of 1994 that accompanied NAFTA’s launch.
Table 3 shows the effects of NAFTA on the U.S. – Mexican trade balance, which
quickly turned from surplus to deficit, and the deficit continued rising thereafter. Within
the U.S. economy, manufacturing plants were closed and production and investment
diverted to Mexico (Scott, 2001). The threat of shifting jobs to Mexico was also used to
suppress wages and batter unions ( Bronfenbrenner, 2000; Bronfenbrenner and Luce,
2004).
Table 3. US goods trade balance with Mexico before and after NAFTA ($ billions)
Source: Census Bureau.
-74.6-49.7-24.5-17.5-15.81.31.75.42.1
200720052000199619951994199319921991
Stage 2: the strong dollar policy after the East Asia financial crisis of 1997
The second stage in the 1990s creation of a global production zone was the strong
dollar policy implemented after the East Asian financial crisis of 1997. Following the
policy precedent of the 1994 Mexican peso crisis, the U.S. helped provide large dollar
14
loans to crisis countries, which also let their currencies depreciate. This policy of
depreciation was labeled “strong dollar” policy, and it was supported by U.S.
corporations which were looking to offshore and outsource production. That in turn
created a permanent incentive for U.S. corporations to downsize their U.S. manufacturing
operations and increase their foreign manufacturing operations, particularly those in East
Asia. It was also supported by developing countries because their depreciated exchange
rates spurred export-led growth and attracted FDI.
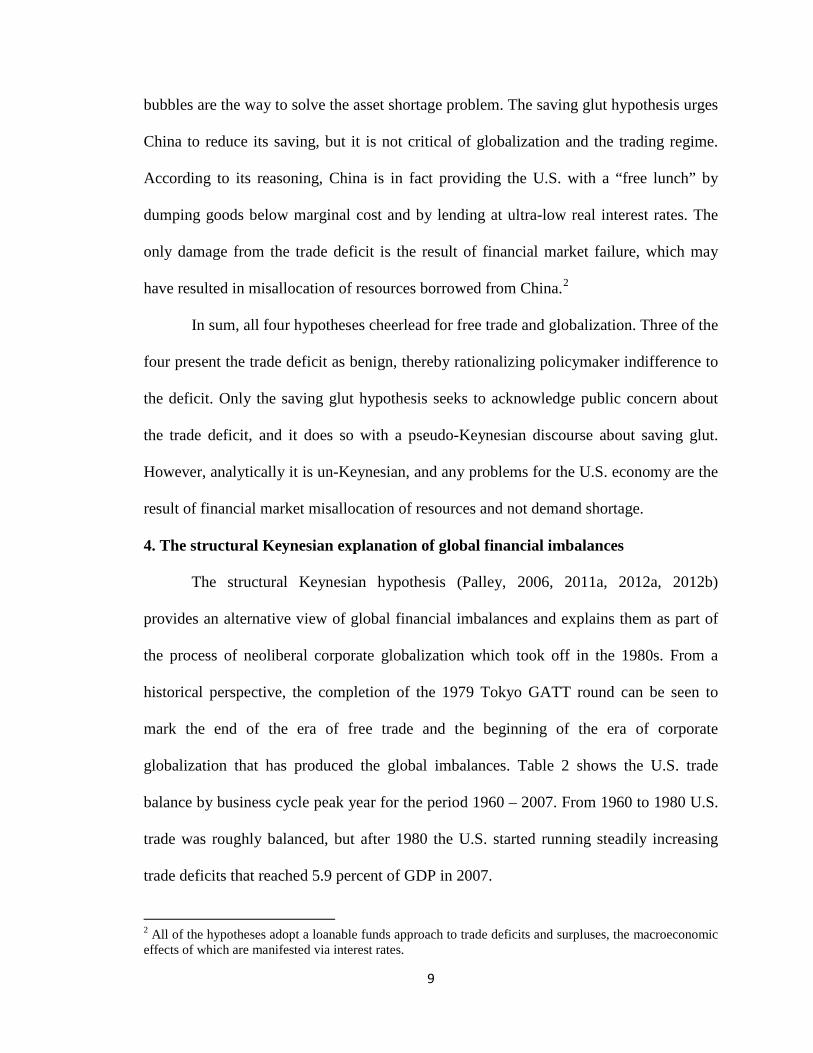
The results are shown in Table 4. There was a massive increase in U.S. trade
deficit with Pacific Rim countries, while U.S. manufacturing was put into recession in
1998, two years before the overall economy went into recession. The new arrangement
made the U.S. consumer the global buyer of first and last resort, making the global
economy significantly dependent on the U.S. consumer. That dependence helps explain
the global nature of the Great Recession that followed the financial crash of 2008.
Table 4. US goods trade balance with Pacific rim countries ($ billions).
Source: Census Bureau.
-215.4-186.0-160.4-121.6-101.8-108.1
200019991998199719961995
Stage 3: Permanent normal trading relations (PNTR) with China
15
NAFTA and the strong dollar policy were disastrous for the economy in terms of
their effects on manufacturing, unions and income distribution, and increased dependence
on imports. Despite this, big business was still able to push through the establishment of
permanent normal trading relations (PNTR) with China as the full deleterious effects of
globalization policy took time to filter through and these effects were also obscured by
the asset price bubble of the late 1990s.
PNTR gave China permanent access to U.S. markets with no effective safeguards
against China’s exchange rate policies and only weak safeguards against unfair trade
practices. However, its real significance is that it cemented the structure of globalization
that corporations wanted and made China part of global production zone.
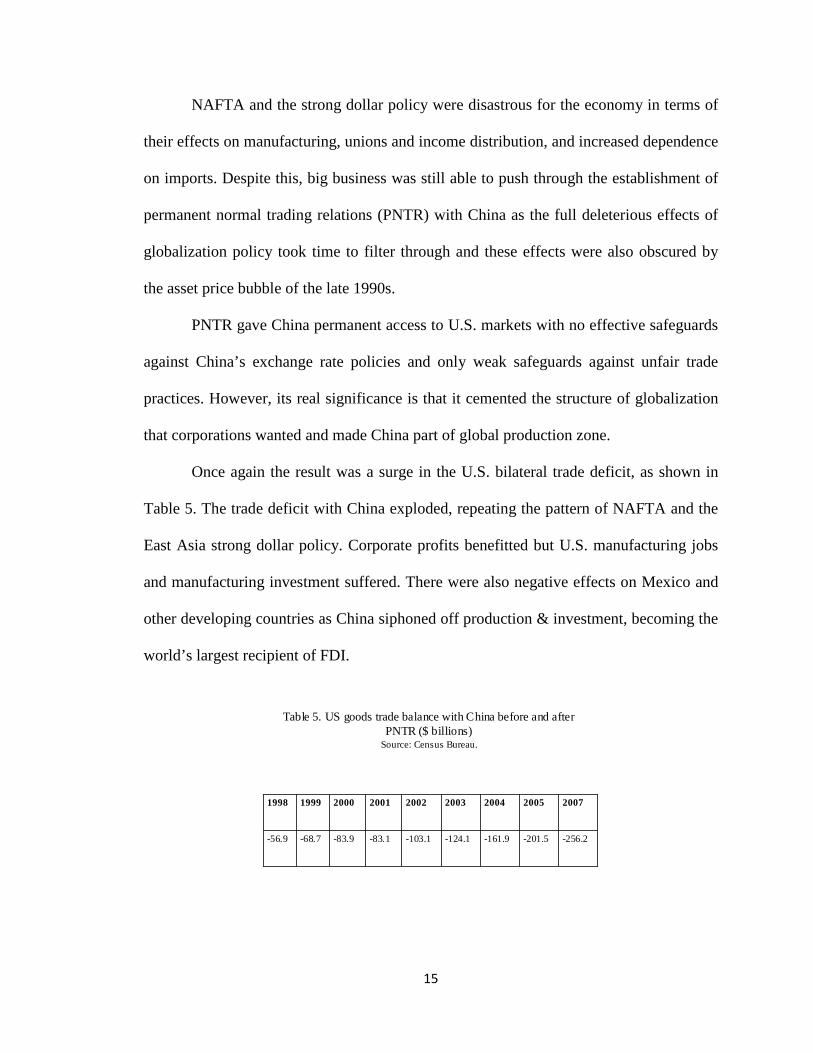
Once again the result was a surge in the U.S. bilateral trade deficit, as shown in
Table 5. The trade deficit with China exploded, repeating the pattern of NAFTA and the
East Asia strong dollar policy. Corporate profits benefitted but U.S. manufacturing jobs
and manufacturing investment suffered. There were also negative effects on Mexico and
other developing countries as China siphoned off production & investment, becoming the
world’s largest recipient of FDI.
Table 5. US goods trade balance with China before and after PNTR ($ billions)
Source: Census Bureau.
-256.2-201.5-161.9-124.1-103.1-83.1-83.9-68.7-56.9
200720052004200320022001200019991998

16
Despite the negative impact from China, EM economies were receptive overall to
the new arrangements as they offered access to the U.S. market and the promise of FDI
which provides technology, productive capacity, and managerial expertise. This
receptiveness is epitomized by Mexico’s debate over NAFTA which was sold to the
Mexican people as a pathway to development.
EM economy receptiveness of U.S.-led corporate globalization also reflects the
global triumph of neoliberal economic policy. In the 1980s and early 1990s the IMF and
World Bank used the financial leverage provided by the 1980s debt crisis to force
neoliberal policy reforms. The price of financial assistance from the IMF and World
Bank was adoption of so-called “structural adjustment” reforms, which included
abandonment of strategic state-led development policies that used strategic import
protection.
Structural adjustment policies were justified by a new consensus in the economics
profession about the benefits of trade-openness and export-led growth (Palley, 2012).
This new consensus claimed the economic success of the four East Asian tigers (South
Korea, Hong Kong, Singapore, and Taiwan) proved what was possible – even though
none of those economies had actually followed the neoliberal development recipe
(Chang, 2003).
In sum, the structural Keynesian hypothesis argues the U.S. trade deficit and
global financial imbalances were created by neoliberal corporate globalization that has
shaped international economic policy since 1980. Corporate globalization created a
structure that inevitably produced large deficits. It also created a political economy that
justified deficits and discouraged policy action to rein in deficits. For U.S. policy makers

17
the strong dollar lowered inflation; for U.S. business it kept the pressure on union labor
and increased profits from foreign sourcing. Consequently, both U.S. policymakers and
big business saw benefits from the trade deficit and had no interest in reining it in. In the
1990s, chatter about the “New economy” was then used to argue the U.S. could support
the trade deficits because of the faster growth corporate globalization and the “New
economy” supposedly generated. In the 2000s, the deficit was justified by new arguments
such as the BW II hypothesis, the dark matter hypothesis, and the asset shortage
hypothesis which argued the imbalances were beneficial to the U.S. and the global
economy.
EM economies supported the new arrangements because they produced trade
surpluses that helped relieve financial constraints on growth. They also encouraged
massive FDI flows and relocation of manufacturing from developed economies to EM
economies, which transferred technology and productive capacity. All of these benefits
were super-charged by U.S. exchange rate policy. When U.S. policymakers (but not U.S.
big business) eventually began to have modest second thoughts about the benefits of
large trade deficits, EM economies frustrated attempts at re-balancing because they still
benefit from the system. Consequently, EM economies have recycled their trade
surpluses into dollar reserves to maintain their undervalued exchange rate, and thereby
maintain export competitiveness and attractiveness as an FDI destination. Thus, the
accumulation of dollar reserves has been to maintain international price competitiveness,
and not to accumulate collateral for FDI as claimed by the BW II hypothesis.
Whereas the BW II hypothesis attributes little direct role to the global financial
imbalances in precipitating the financial crisis of 2008, the structural Keynesian

18
hypothesis gives them a significant role (Palley, 2011a, 2012a). In the BW II story the
global imbalances served to lower U.S. interest rates, which would have been a boon
absent financial sector resource misallocation. In the structural Keynesian story the global
imbalances sucked consumer demand out of the economy, diverted investment spending
offshore, and undermined manufacturing employment and wages. These negative effects
contributed to jobless recovery and persistent weakness in the expansion after the
recession of 2001. That in turn prompted the Federal Reserve to lower interest rates to
record lows to support the expansion, and it also contributed to the U.S. house price
bubble. Moreover, by contributing to the hollowing out of the U.S. income and demand
generation process, the global financial imbalances have contributed to creating the
stagnation that has followed the Great Recession of 2007 – 09. The stagnation is due to
structural demand shortage, which is in part the product of increased wage inequality
produced by corporate globalization and deindustrialization.
In addition to explaining the emergence of U.S. trade deficit and global financial
imbalances, the structural Keynesian corporate globalization narrative explains why
capital has flowed north (i.e why developing countries have run trade surpluses), contrary
to conventional growth theory which argues resources should flow to developing
economies where capital is scarce and rates of return higher (Palley, 2007/8). The reason
is corporate globalization creates a division of labor where consumers are in the north and
producers are in the south. Investment flows south through FDI, though the fruits of that
investment (i.e production) flows north. The sustainability of such an arrangement is
doubtful, but from the perspective of each firm, and even each country, that is not an
issue. For the time being, each supports the system as each is doing well.

19
Finally, the structural Keynesian hypothesis provides a clear explanation of why
the large U.S. trade deficit has persisted after the financial crisis of 2008. This
explanation is illustrated heuristically in Figure 3 which shows U.S. per worker demand
for tradeable goods in 2012, U.S. per worker supply of tradeable goods in 1980 and 2012,
and foreign supply of tradeable goods to the U.S. in 1980 and 2012 measured in U.S. per
worker terms. All supply schedules are standardized to reflect 2012 levels of
productivity.3 The essence of the structural Keynesian hypothesis concerns changes on
the supply-side caused by corporate globalization and EM country development policies,
including under-valuation of their currencies.4 Between 1980 and 2012 the productivity
adjusted U.S. per worker supply of tradeable goods fell sharply due to deindustrialization,
while the productivity adjusted per U.S. worker foreign supply of tradeable goods
available to the U.S. expanded due to corporate globalization. Consequently, what would
have been a relatively small trade deficit in 1980 at 2012 prices (P2012), has mushroomed
into a massive per worker deficit in 2012. Absent deep U.S. recession that lowers U.S.
income and the demand for imports, the trade deficit inevitably persists because of
structural change on the supply-side caused by thirty years of corporate globalization
policy.
3 Supply and demand schedules are constructed in per worker terms and with constant productivity to capture the pure effects of structural change. Abstracting from productivity and labor force growth enables rough inter-temporal comparison. 4 Abstracting from income effects that affect demand, the impact of under-valued exchange rates can be thought of as analogous to an excise tax. A strong dollar provides a subsidy to foreign suppliers and shifts the foreign supply down. The reverse holds for a weak dollar.

20
Figure 3. The effect of corporate globalization on the global supply of tradeable goods to the U.S. and on U.S. demand for
and supply of tradeable goods.
Price, $
DUS,2012
SForeign 2012
SForeign, 1980
SUS,1980
SUS,2012
P2012
Tradeable goods
U.S. trade deficit2012
SForeign, 2012+ SUS, 2012
5. The fallacy of the BW II hypothesis
The BW II hypothesis claims to establish a parallel between current global
financial arrangements and the pattern of international financial arrangements that ruled
from 1945 to 1971. However, it is difficult to understand that claim.
With regard to economic outcomes, from 1946 to 1971 the U.S. ran a surplus in
goods trade in every year except 1971, and the same is true for the balance on goods and
services trade. From 1980 to 2011 the U.S. ran a deficit on trade every year, and the same
is true for the balance on goods and services trade. Moreover, the absolute size of
surpluses in the BW I period was an order of magnitude smaller than the deficits in the
putative BW II period. These differences can be seen by comparing Tables 6 and 7. Table
6 shows the goods and services trade balance as a percentage of GDP in peak business
cycle year in the BW I period, while Table 7 provides the same data in the BW II period.

21
Table 6. U.S. trade surplus by peak business cycle years in the BW I era.
0.73.5526.41960
0.00.1984.41969
1.36.1461.11957
0.93.3379.31953
2.25.9269.11948
Trade balance as percent of GDP (% )
Goods & services trade balance($ billions)
GDP($ billions)
Source: Commerce Depart ment and Economic Report of the Presdent, table B-103.
Table 7. U.S. trade surplus by peak business cycle years in the BW II era.
-4.97--696.714,028.72007
-3.5-361.810,286.22001
-1.4-80.95,800.51990
-0.5-16.23,126.81981
Trade balance as percent of GDP (% )
Goods & services trade balance($ billions)
GDP($ billions)
Source: Commerce Depart ment and Economic Report of the Presdent, table B-103.
Not only were there massive differences on the U.S. international account across
the two periods, so too there were massive differences regarding the growth and
development of the real economy. Tables 8 and 9 show U.S. manufacturing employment
levels and growth by business cycle under the BW I and BW II regimes. Under the BW I
regime, manufacturing employment grew significantly, though the 1950s is a complicated
decade because the Korean War artificially ratcheted up employment at the beginning of
the decade. Under the BW II regime there has persistent and accelerating contraction of
manufacturing employment, reflecting the de-industrialization of the American economy.

22
As documented in Mishel et al. (2009), the BW I era was also a period of rapidly
rising real hourly wages and slightly falling income inequality, whereas the BW II era has
been a period of real hourly wage stagnation and significantly increased income
inequality.
Table 8. U.S. manufacturing employment by business cycle peak year under BW I.
N/A14.261945
20.2718.571969
-2.2715.441960
-2.0515.801957
12.616.131953
0.414.321948
% change peak-to-peak
ManufacturingEmployment(millions)
Peak year
Table 9. U.S. manufacturing employment by business cycle peak year under BW II.
-15.5713.882007
-7.1216.442001
-5.0017.701990
N/A18.631981
% change peak-to-peak
ManufacturingEmployment(millions)
Peak year
These fundamental structural differences between the two epochs speak to the
inappropriateness of the analogy with BW I, and they also point to several other

23
analytical flaws in the hypothesis. First, the deteriorating U.S. trade position of the 1960s
was driven by full employment with growing wages, accompanied by a growing
manufacturing sector and increasing manufacturing employment. This contrasts with the
U.S. trade deficit of the past twenty years which has been driven by debt-financed
consumption spending supported by a house price bubble. Whereas the U.S. trade
position in the 1960s was consistent with a robust and stable aggregate demand
generation process, the current system has hollowed out the income and aggregate
demand generation process. This hollowing process helps explain the stagnation that has
taken hold in the wake of the Great Recession (Palley, 2012), and it is completely absent
in the BW II hypothesis.
Second, the period of the so-called BW II system has seen U.S. multi-national
corporations shifting production to China to establish state of the art export platforms
whose production is intended for export back to the center (the U.S.). This contrasts with
the 1950s and 1960s when U.S. multi-nationals established European production facilities
for purposes of supplying the European market. Companies such as Ford, General Motors
and IBM produced in Europe for Europe, not for export back to the United States.
This role of multi-nationals in driving China’s exports and trade surplus is
captured in Table 10. The data show that over fifty percent of Chinese exports are
produced by 100 percent foreign-owned companies, and over 76 percent of China’s
exports are produced by foreign-owned companies or joint-venture companies. Thus,
both the scale and structure of China’s export production are different from Europe’s
exports in the BW I epoch.

24
Table 10. Decomposition by firm ownership of the structure of Chinese exports in 2005.
Source:Manova and Zhang, 2008
10.313.126.350.4100%Exports
State-owned
Private domestic
Joint ventures
Foreign-owned
All firms
A third criticism of the BW II hypothesis concerns its characterization of the
global economic system as being structurally similar in the BW I and BW II periods.
Dooley at al. (2003) argue that the global economy has been characterized in both periods
by a shared center – periphery structure, with the U.S. the center country in both periods.
However, under BW I Europe was the periphery, while under BW II East Asia (and
particularly China) has been the periphery. This treatment of Europe and East Asia as
structural equivalents is outlandish. After World War II, the European challenge was re-
building their shattered economies. However, Europe had a highly educated work force
and was a global technological leader in science and engineering. This contrasts with the
East Asian challenge in the period 1980 – 2012 which has been economic development.
A fourth criticism of the BW II hypothesis is lack of evidence for its fundamental
claim. The core hypothesis is that China and other East Asian economies have run
massive persistent trade surpluses with the U.S. in order to accumulate collateral needed
to provide security for FDI. However, there is no evidence of East Asian country foreign
exchange reserves being pledged as collateral for private investment.

25
A fifth and final criticism concerns the BW II representation of the
microeconomic transactions structure of U.S. – China trade. According to the BW II
construction, U.S. consumers engage in an exchange of goods for bonds with Chinese
producers so that China finances the U.S. trade deficit. This characterization of China
financing the U.S. trade deficit is shared by all mainstream accounts of the trade deficit. It
reflects their loanable funds approach to saving and investment, according to which
China gives over goods in return for loan notes.
That representation of the economics of the trade deficit has misled policymakers
and analysts. Thus, before the financial crisis of 2008 the fear was China would stop
accepting U.S. loan notes, causing the dollar to plunge and U.S. interest rates to sky-
rocket, thereby triggering a financial and economic crisis (Bergsten, 2005; Eichengreen,
2004; Obstfeld and Rogoff, 2007). Indeed, this was the argument used by Nouriel
Roubini (2005), who has now become world famous for his astute call of a crash:
“The basic outlines of a hard landing are easy to envision: a sharp fall in the value of the US dollar, a rapid increase in US long-term interest rates and a sharp fall in the price of a range of risk assets including equities and housing (p.5).” However, though Roubini’s call was timely, his reasoning was entirely wrong and the
dollar in fact strengthened with the crisis and interest rates fell dramatically.
Focusing on a potential exchange rate crash is the natural outcome of the
economic analysis underlying both the BW II and other mainstream accounts of financing
of the trade deficit. Figure 4 describes the monetary reality of the trade deficit,
particularly as it applied during the credit bubble period. The key insight is that the
financing of China’s export-led growth and the U.S. trade deficit is a two-step
intermediated transaction, beginning in the U.S. economy. It is the U.S. financial sector

26
that creates the dollars and liabilities which China eventually comes to hold as foreign
exchange reserves. The first step in the process is a transaction between U.S. borrowers
(call them consumers) and U.S. banks. This provides households with money (money 1).
Households then buy goods from China and in exchange transfer their money balances to
China (money 2). China then uses those money balances to purchase loan notes in U.S
financial markets (money 3), which can include purchasing U.S. government debt.
Figure 4. The structure of transactions governing U.S. –China/East Asia trade.
U.S. consumers U.S. banks & shadow banks
China &East Asia
Money 1
Loan note
Money 2
Goods
Money 3
Loan note
The domestic financial transaction (money 1) can be loosely identified with the
provision and demand for credit within the U.S. economy. The last international
transaction between China and U.S. financial markets (money 3) is what economists
mistakenly describe as China supplying credit and financing the U.S. trade deficit.
However, in fact, China supplied the credit when it accepted dollars (money 2). The
important feature about Figure 4 is that the system can break down in either the domestic
credit market or the market for financial assets. The BW II hypothesis and mainstream
economists like Nouriel Roubini focused on asset markets and a sudden-stop of financial
asset purchases by China. In fact, as predicted by the structural Keynesian hypothesis, the

27
sudden stop occurred in the domestic credit market with the bursting of the house price
bubble and a sudden-stop to consumer borrowing (Palley, 2007/8).
The BW II hypothesis’ misunderstanding of the pattern of transactions meant it
was of no help in anticipating the crisis or understanding it once it was underway. Now,
going forward, it promises to mislead policymakers again. That is because its focus is a
weakening dollar which is supposed to result as China accumulates reserves and
accomplishes it economic development. BW II proponents who believe the process is
stable think the depreciation will be slow and gradual. Those who think China’s foreign
reserve portfolio will become saturated think the depreciation will be sudden and may
precipitate another financial crash.
The BW II hypothesis has adopted an attitude of indifference to China’s exchange
rate policies and rejected the notion of an over-valued dollar. Indeed, from its perspective
a strong dollar is desirable as China and other EM economies must give over more goods
to accumulate U.S. financial assets. From a structural Keynesian perspective, that policy
advice has been disastrous for the U.S. economy. Now, there is a danger the BW II
perspective risks inflicting a second episode of policy damage on the U.S. economy. That
is because it advocates China should loosen its capital controls and adopt a flexible
exchange rate as part of the process of development and economic maturation. 5 The
prediction is that the renminbi will slowly appreciate and the dollar will fall as China
5 China has taken a number of small steps to increase renminbi convertibility. These include issuing renminbi denominated government debt in Hong Kong; shortening the duration of “lock-up” periods on certain types of foreign direct investment; increasing the quota for the qualified foreign institutional investor program; increasing the proportion of trade transactions settled in renminbi; and allowing Chinese corporations to retain external foreign currency denominated profits. All of these developments have been met with approval by the U.S. Treasury and the International Monetary Fund. This approval is captured in a speech at the U.S. Export-Import Bank’s annual conference in March 2011 when President Obama declared: “As I’ve said before, China moving to a more market-oriented exchange rate would make an essential effort to that global rebalancing effort.”

28
accumulates adequate reserves, leading to an eventual smooth resolution of global
financial imbalances. This thinking now guides U.S. policymaking, and both Federal
Reserve Chairman Bernanke and Treasury Secretary Geithner have endorsed this new
policy direction, while only criticizing it for being too slow.
Contrary to BW II predictions, having China shift from the current regime of
“quasi-fixed exchange rates plus strict capital controls” to a regime of “flexible exchange
rates plus capital mobility” risks compounding the damage already inflicted on the U.S.
economy by past misguided trade and exchange rate policy. The precedent is Japan in the
early 1980s. At that time Japan was running large trade surpluses, had an under-valued
exchange rate, and had significant capital account restrictions. Under pressure from the
U.S. Treasury, Japan lifted its capital account controls in December 1980 (The Foreign
Exchange and capital Control Law, 1980), yet over the next two years the yen
depreciated by twenty percent. The reason is Japanese portfolios were internationally
undiversified so that removal of capital controls contributed to depreciation of the yen.
Outflows from portfolio diversification by residents dominated non-resident inflows.
There is a grave risk this pattern could repeat with China. Chinese citizens have
accumulated significant financial wealth which is internationally undiversified. That
portfolio structure alone would give Chinese citizens reason to sell renminbi. However,
on top of that there are strong political reasons to hold wealth outside China to insure
against political dangers. Together, that could cause significant renminbi depreciation in
the event of implementation of a flexible exchange rate - free capital flow regime, which
would expose the U.S. to further economic damage. It would also place the U.S. in a
politically difficult position to complain having received what it asked for.
29
In addition to this portfolio diversification risk, there is the possibility that China
could have its own internal economic bust. Many commentators have speculated about
such an outcome and their reasons include a possible land and house price bubble that
may have developed because of excessively easy credit and fears of future inflation in
China; excessive fixed investment that has seen China devote fifty percent of its GDP to
fixed asset accumulation; and a banking crisis due to accumulated bad loans made to state
owned enterprises and local government. In the event of a Chinese economic crash, the
dollar would almost certainly appreciate against the renminbi if exchange rates are
flexible and Chinese financial flows are unrestricted.
These structural Keynesian arguments offer a counter to the BW II prediction of
future dollar weakness and EM currency strength. They also suggest a different policy
course. Neither flexible exchange rates nor free capital mobility is desirable. Instead,
China should maintain its system of a pegged exchange rate with capital controls, but the
peg should be set to ensure approximately balanced trade.
6. Conclusion
The BW II hypothesis seeks to draw an analogy between current international
financial arrangements and those that ruled in the original Bretton Woods period from
1945 to 1971. Such an analogy is fundamentally misplaced as there is neither similarity
of macroeconomic outcomes nor microeconomic structures. The BW II hypothesis also
denies any role of global financial imbalances and the U.S. trade deficit in causing either
the crisis or the economic stagnation that has ensued.
Proponents of the BW II hypothesis claim it remains relevant after the financial
crisis of 2008 because the large U.S. trade deficit has continued, supposedly proving their

30
point. However, the continuation of large trade deficits is consistent with every other
hypothesis and proves little. Dark matter proponents argue dark matter is still in place;
asset shortage proponents argue the global economy still has an asset shortage; saving
glut proponents argue China still has a saving glut; and structural Keynesian proponents
argue the globalization production networks that inevitably produced large trade deficits
are unchanged.
Since all of the hypotheses can explain why the U.S. is still running large trade
deficits, that cannot be the basis for identifying which hypothesis is right. Instead, the
competing hypotheses need to be assessed on the plausibility of their explanation and
their fit with the totality of the data. The BW II analogy clearly does not fit the data; it
implausibly attributes no role to global imbalances in the making of the U.S. economic
crisis and ensuing stagnation; it provides no understanding of the microeconomic
transaction structures governing globalization; and it offers little to nothing in the way of
testable propositions. All of this argues for its rejection.
The structural Keynesian argument is that the global imbalances are a predictable
outcome of policies associated with corporate globalization. That process has been driven
and led by U.S. policymakers at the behest of large U.S. trans-national corporations, with
the intellectual support of mainstream economics. That means U.S. policy has been the
ultimate cause of the global imbalances, though not in the way that is claimed in the twin
deficits or saving shortage hypotheses. Policymakers did not intend such an outcome, and
the policy might not have been adopted had they foreseen it. However, it is still the
predictable outcome.

31
Remedying the problem is difficult as economies are subject to hysteresis. First,
whereas China could not have created the imbalances without U.S. support and
assistance, it can now obstruct their reduction. Second, the costs to the U.S. may now be
quite large as corporations have made significant capital investments in China and East
Asia, and U.S. manufacturing has shrunk so that there are now significant domestic
supply constraints that would impose further costs.
Whether or not the global imbalances have been good for the U.S. economy
depends on one’s economic perspective. Those who believe corporate globalization has
conferred large benefits, which includes proponents of the BW II hypothesis, think the
global imbalances have benefitted the U.S. economy. Those who think corporate
globalization has inflicted large costs, which includes proponents of the structural
Keynesian hypothesis, would argue the imbalances have injured the U.S. economy and
society. The structural Keynesian position is that corporate globalization was intended to
shift income from wages to profit by putting labor in international competition via
creation of a global production zone.
Because the global imbalances raise such profound matters, it is necessary to
sanitize them. That is the political economy function of the many mainstream
explanations for the U.S. trade deficit, which include the BW II hypothesis. Hypotheses
that sanitize the global imbalances are promoted within the mainstream economic
profession, while those that paint the imbalances as the product of a toxic form of
globalization are ignored. That political economy explains the lop-sided discussion of the
global imbalances problem within mainstream academic circles.

32
References
Bernanke, B.S. [2005]: The global saving glut and the U.S. current account deficit, The Sandridge Lecture, Virginia Association of Economics, Richmond, VA., March 10. Bergsten, C.F. [2005]: “A New Foreign Economic Policy for the United States,” in The United States and the World Economy: Foreign Economic Policy for the Next Decade, Institute for International economics, Washington DC. Bronfenbrenner, K. [2000]: Uneasy Terrain: The Impact of Capital Mobility on Workers, Wages, and Union Organizing, Report prepared for the United States Trade Deficit Review Commission, Washington, DC, September.
Bronfenbrenner, K., and Luce, S. [2004]: The Changing Nature of Corporate Global Restructuring: The Impact of Production Shifts on Jobs in the U.S., China, and Around the Globe, Report prepared for the U.S.-China Economic and Security Review Commission, Washington, DC October.
Caballero, R.J. [2006]: “On the Macroeconomics of Asset Shortages,” NBER Working Paper No.12753, December. Caballero, R.J. [2007]: “Understanding Global Imbalances,” Economics at MIT: Research Highlights No. 1. Chang, H.-J. [2003]: Kicking Away the Ladder: Development Strategy in Historical Perspective, London: Anthem Press. Dooley, M.P., Folkerts-Landau, D., and Garber, P. [2003]: An essay on the revised Bretton Woods system, Working Paper 9971, Cambridge, MA: National Bureau of Economic Research, September.
Dooley, M.P., Folkerts-Landau, D., and Garber, P. [2004]: The US current account deficit and economic development: Collateral for a total return swap, Working Paper 10727, Cambridge, MA: National Bureau of Economic Research, August 2004.
Eichengreen, B. [2004], “The Dollar and the New Bretton Woods System.” Manuscript, University of California at Berkeley, December. Hausmann, R., and Sturzenegger, F. [2005]: Dark matter makes the US deficit disappear, Financial Times, December 7.
Manova, K., and Zhang, Z. [2008]: China’s exporters and importers: Firms, products, and trade partners, unpublished manuscript, Department of Economics, Stanford University, CA, June. Mishel, L., J. Bernstein, and S. Allegreto [2009], The State of Working America 2008/2009, Ithaca, NY Cornell University Press.

33
Obstfeld, M. and K. Rogoff [2007], “The Unsustainable U.S. Current Account Position Revisited,” in Richard Clarida (ed.) G7 Current Account Imbalances: Sustainability and Adjustment, Chicago: University of Chicago Press. Palley, T.I. [2007], “Jack Welch’s barge: The new economics of trade,” Alternet.com, October 1. Palley, T.I. [2007/8], The fallacy of the revised Bretton Woods hypothesis: Why today’s system is unsustainable and suggestions for a replacement, International Journal of Political Economy, 36 (Winter), p. 36 – 52. Originally published as Public Policy Brief No. 85, The Levy Economics Institute of Bard College, 2006. Palley, TI. [2011a]: “America’s Flawed Paradigm: Macroeconomic Causes of the Financial Crisis and Great Recession,” Empirica, 38 (1), p. 3 - 17. Originally published as “America’s exhausted paradigm: Macroeconomic causes of the financial crisis and Great Recession,” New American Contract Policy Paper, New America Foundation, Washington, D.C., July 22, 2009. Palley, T.I. [2011b]: “A new approach to growth” in David Coats (ed), Exiting from the Crisis: Towards a model of more equitable and sustainable growth, European Trade Union Institute, Brussels, p.55 – 60, 2011. Palley, T.I. [2012a]: From Financial Crisis to Stagnation: The Destruction of Shared Prosperity and the Role of Economics, Cambridge University Press. Palley, T.I. [2012b]: “Explaining global financial imbalances: A critique of the saving glut and reserve currency hypotheses,” From Crisis to Growth: The Challenge of Debt and Imbalances, Metropolis - Verlag, Marburg: Germany, p. 145-168. Palley, T.I. [2012c]: “The Rise and Fall of Export-led Growth,” Investigacion Economica, LXX, 280 (Abril – Junio), 15 – 35. Originally published as “The contradictions of export-led growth, Public Policy Brief No. 119, The Levy Economics Institute of Bard College, 2011. Roubini, N., and B. Setser [2005], “Will the Bretton Woods 2 Regime Unravel Soon? The Risk of a Hard Landing in 2005-2006,” paper prepared for a conference organized by the Federal Reserve Bank of San Francisco, February, p. 5, available at http://www.frbsf.org/economics/conferences/0502/Roubini.pdf. Scott, R.E. [2001]: “NAFTA at seven: Its impact on workers in all three nations,” Briefing Paper, Economic Policy Institute, Washington D.C., April

Publisher: Hans-Böckler-Stiftung, Hans-Böckler-Str. 39, 40476 Düsseldorf, Germany Phone: +49-211-7778-331, [email protected], http://www.imk-boeckler.de
IMK Working Paper is an online publication series available at: http://www.boeckler.de/imk_5016.htm
ISSN: 1861-2199 The views expressed in this paper do not necessarily reflect those of the IMK or the Hans-Böckler-Foundation. All rights reserved. Reproduction for educational and non-commercial purposes is permitted provided that the source is acknowledged.