global energy strategies to control future carbon … · from prof. j. marecki ... poland), prof....
TRANSCRIPT

Global Energy Strategies to Control Future Carbon Dioxide Emissions
Sinyak, Y. and Nagano, K.
IIASA Status ReportOctober 1992

Sinyak, Y. and Nagano, K. (1992) Global Energy Strategies to Control Future Carbon Dioxide Emissions. IIASA
Status Report. Copyright © October 1992 by the author(s). http://pure.iiasa.ac.at/3603/ All rights reserved.
Permission to make digital or hard copies of all or part of this work for personal or classroom use is granted
without fee provided that copies are not made or distributed for profit or commercial advantage. All copies
must bear this notice and the full citation on the first page. For other purposes, to republish, to post on servers or
to redistribute to lists, permission must be sought by contacting [email protected]

Status Report Global Energy Strategies to Control Future Carbon Dioxide Emissions
Yuri Sinyak, Principal Investigator (Russia) Koji Nagano, Research Scholar (Japan)
SR-92-04 October 1992
BIIASA International Institute for Applied Systems Analysis A-2361 Laxenburg Austria
Telephone: +43 2236 715210 Telex: 079 137 iiasa a Telefax: +43 2236 71313

Global Energy Strategies to Control Future Carbon Dioxide Emissions
Yuri Sinyak, Principal Investigator (Russia) Koji Nagano, Research Scholar (Japan)
SR-92-04 October 1992
A Study on Global Energy and Climate Change Contract No. 90-17
International Institute for Applied Systems Analysis (IIASA) A-2361 Laxenburg, Austria
and Central Research Institute of Electric Power Industry
(CRIEPI) Otemachi Building, 1-6-1 Otemachi, Chiyoda-Ku,
Tokyo 100, Japan
Status Reports, which summarize IIAS A research activities and results, do not necessarily express the views and opinions of the Institute, its National Member Organizations, or other organizations supporting the work.
EilIIASA International Institute for Applied Systems Analysis A-2361 Laxenburg Austria
Telephone: +43 2236 715210 o Telex: 079 137 iiasa a o Telefax: +43 2236 71313

Contents
1 In t roduct ion 1
2 Approaches. Background. a n d Tools 5 . . . . . . . . . . . . . . . . . . . . . 2.1 Long-Term Energy Projections: Background 5 . . . . . . . . . . . . . . . . . . . . . 2.2 Approaches and Methodological Framework 5
. . . . . . . . . . . . . . . . . . . . . . . . . . . . . 2.2.1 Analytical Framework 5 . . . . . . . . . . . . . . . . . . . . . . . . . 2.2.2 Definition of Global Scenarios 7
Long-Term Global Energy /C02 Scenarios 11 . . . . . . . . . . . . . . . . . . . . . . . . . . . . . . . . . 3.1 Final Energy Demand 11
3.1.1 North America. Australia and New Zealand (NAANZ) . . . . . . . . . . . 12 . . . . . . . . . . . . . . . . . . . . . . . . . . . . . . . . 3.1.2 Western Europe 15
. . . . . . . . . . . . . . . . . . . . . . . . . . . . . . . . . 3.1.3 Eastern Europe 16 . . . . . . . . . . . . . . . . . . . . . . . . . . . . . . . . . . . . . . 3.1.4 Japan 18
. . . . . . . . . . . . . . . . . . . . . . . . . . . 3.1.5 The Former Soviet Union 19 . . . . . . . . . . . . . . . . . . . . . . . . . . . . . . . . . 3.1.6 Latin America 22 . . . . . . . . . . . . . . . . . . . . . . . . . . . . . . . . . 3.1.7 Pacific Region 24
. . . . . . . . . . . . . . . . . . . . . . 3.1.8 North Africa and the Middle East 24 . . . . . . . . . . . . . . . . . . . . . . . . . 3.1.9 China and Other Asian CPCs 25
. . . . . . . . . . . . . . . . . . . . . . . 3.1.10 Other Less Developed Countries 26 . . . . . . . . . . . . . . . . 3.1.11 Summary of Regional Final Energy Demand 27
. . . . . . . . . . . . . . . . . . . . . . . . . . . . . . . 3.2 Energy Conversion Sectors 29 . . . . . . . . . . . . . . . . . . . . . . . . . . . . . 3.2.1 Electricity Generation 29
. . . . . . . . . . . . . . . . . . . . . . . . . . . . . . 3.2.2 Crude Oil Refineries 35 . . . . . . . . . . . . . . . . . . . . . . . . . . . . . . . . 3.3 Primary Energy Supply 35
. . . . . . . . . . . . . . . . . . . . . . . . . . . . . . . . . . . . 3.3.1 Crude Oil 35 . . . . . . . . . . . . . . . . . . . . . . . . . . . . . . . . . . . 3.3.2 Natural Gas 40
. . . . . . . . . . . . . . . . . . . . . . . . . . . . . . . . . . . . . . . 3.3.3 Coal 43 . . . . . . . . . . . . . . . . . . . . . . . . . . . . . . . . . 3.3.4 Nuclear Energy 44
. . . . . . . . . . . . . . . . . . . . . . . . . . 3.3.5 Renewable Energy Sources 47 . . . . . . . . . . . . . . . . . . . . . . 3.3.6 Global/Regional Energy Balances 51
. . . . . . . . . . . . . . . . . . . . . . . . . . . . . . . . . . . . . . 3.4 C 0 2 Emission 58 . . . . . . . . . . . . . . . . . . . . 3.5 Summary of Global Energy/C02 Projections 62
4 Implications of t h e Ene rgy /C02 Scenarios ' 6 5 4.1 Long-term Evolution of Global Energy Demand
. . . . . . . . . . . . . . . . . . . . . . . . . . . . . . . . . . . . . . . and Supply 65 . . . . . . . . . . . . . . . . . . . . 4.2 Long-term Evolution of Global C 0 2 Emission 68 . . . . . . . . . . . . . . . . . . . . 4.3 Factorial Analysis of C02 Emission Reduction 68
. . . . . . . . . . . . . . . . . . . . . . . . . . . . . . . . 4.4 Consideration on Equity 72 . . . . . . . . . . . . . . . . . . . . . . . . . . . . . . . . . . 4.5 Concluding Remark 74
iii

5 Economic and Institutional Considerations of a Global Energy/COz Policy 75 5.1 Energy-Savings and C02 Reduction Potentials . . . . . . . . . . . . . . . . . . . 75 5.2 Cost-Benefit Analysis of C02 Abatement Measures . . . . . . . . . . . . . . . . . 76 5.3 Attempts at Identifying an Optimal COz Reduction
Strategy . . . . . . . . . . . . . . . . . . . . . . . . . . . . . . . . . . . . . . . . . 83 5.4 Costs for the Implementation of a C02 Reduction Policy . . . . . . . . . . . . . 88 5.5 What to Do First? . . . . . . . . . . . . . . . . . . . . . . . . . . . . . . . . . . . 91
6 Conclusions 95
Appendix 1: Energy Models Used in the Study
Appendix 2: Initial Assumptions, Input Data, and Final Energy Demand Pro- jections for all Regions
Appendix 3: Expected Energy-Savings Potential at End-Use by 2010, Regional Results of Model Runs
Appendix 4: International Workshop on Energy/Ecology/Climate Modeling and Projections: Summary and Agenda

List of Tables
. . . . . . . . . . . . . . . . . . . . . . . . . . . . . . . 2.1 Summary of the scenarios 8
. . . . . . . . . . . . . . . . . . . . . . . . . . . . 3.1 General population projections 12
. . . . . . . . . . . . . . . . . . . . . . . . . . . . 3.2 Economic activity assumptions 13 . . . . . . . . . . . . . . . . . . . . . 3.3 Final energy-demand projections by regions 28
. . . . . . . . . . . . . . . . . . . . . . . . . . . . 3.4 Electricity generation in Japan 30 3.5 Electricity generation in the developed countries . . . . . . . . . . . . . . . . . . 31 3.6 Electricity generation in the developing countries . . . . . . . . . . . . . . . . . . 33 3.7 Electricity generation projections for the world . . . . . . . . . . . . . . . . . . . 34 3.8 Crude oil refinery products and losses by region . . . . . . . . . . . . . . . . . . . 36 3.9 World crude oil reserves and resources by cost category . . . . . . . . . . . . . . 37
. . . . . . . . . . . . . . . . . . . . . . . . . 3.10 World crude oil resources by regions 38 . . . . . . . . . . . . . . . . . . . . . . . . 3.1 1 World crude oil production and trade 39
3.12 World natural gas reserves and resources by cost category . . . . . . . . . . . . . 40 3.13 World conventional natural gas resources by region . . . . . . . . . . . . . . . . . 40 3.14 Unconventional methane estimates for the USA . . . . . . . . . . . . . . . . . . . 41
. . . . . . . . . . . . . . . . . . . . . . . 3.15 World natural gas production and trade 42 3.16 World coal reserves and resources by cost category . . . . . . . . . . . . . . . . . 43
. . . . . . . . . . . . . . . . . . . . . 3.17 World coal reserves by region at end of 1987 43 . . . . . . . . . . . . . . . . . . . . . . . . . . . 3.18 World coal production and trade 45
3.19 Extraction of fossil fuel resources between 1990 and 2050 . . . . . . . . . . . . . . 46 . . . . . . . . . . . . . . . . . . . . . . . . . . . . . . . . 3.20 World uranium resources 46
. . . . . . . . . . . . . . . . . . . . . . . . . . . 3.21 Nuclear installation requirements 46
. . . . . . . . . . . . . . . . . . . . . . . . . . . 3.22 World renewable energy potential 48 3.23 Requirements for 1 TWhe produced by different types of electric power plants . . 50
. . . . . . . . . 3.24 Cost of electricity generation from different types of power plants 51 . . . . . . . . . . . 3.25 Cost of low-temperature heat supply from different generators 52
. . . . . . . . . . . . . . . . . . . . . . . . . . 3.26 Primary energy scenarios for Japan 53 3.27 Primary energy scenarios for developed countries . . . . . . . . . . . . . . . . . . 55 3.28 Primary energy scenarios for developing countries . . . . . . . . . . . . . . . . . . 57
. . . . . . . . . . . . . . . . . . . . . . . 3.29 Summary of primary energy projections 58 . . . . . . . . . . . . . . . . . . . . . . 3.30 Primary energy consumption by fuel type 59
. . . . . . . . . . . . . . . . . . . . . . . 3.31 C 0 2 emissions by global energy systems 61 . . . . . . . . . . . . . . . . . . . . . . . . . . . 3.32 C 0 2 emission coefficients by fuels 61
. . . . . . . . . . . . . . . . . . . . . . 3.33 Atmospheric accumulation of COz in 2050 62
4.1 Final energy demand (commercial energy including feedstocks). Dynamics-as- . . . . . . . . . . . . . . . . . . . . . . . . . . . . . . . . . . . Usual Scenario (A) 65
4.2 Final energy demand (commercial energy including feedstocks). Enhanced Effi- . . . . . . . . . . . . . . . . . . . . . . . . ciency and Conservation Scenario (B) 66
. . . . . . . . . . . . . . . . . . . 4.3 Global primary energy consumption projections 67 . . . . . . . . . . . . . . . . . . . . . 4.4 Dynamics of structural changes. Base Case 70
. . . . . . . . . . . 4.5 Dynamics of structural changes. Accelerated Abatement Case 72

Equity obstacles for global cooperation. Base Case . . . . . . . . . . . . . . . . . Equity obstacles for global cooperation. Accelerated Abatement Case . . . . . . .
Energy price assumptions for 2010 . . . . . . . . . . . . . . . . . . . . . . . . . . Application of new energy-savings technologies at end.use . . . . . . . . . . . . . Energy-savings and C02 reduction potentials in developed countries in 2010 . . . Energy-savings and C 0 2 reduction potentials in developing countries in 2010 . .
. . . . . . . Major measures to be implemented in the Base Case (Al) until 2010 . . . . . . . . . . COz abatement strategies relative to the Base Case (Al). 2010
Additional technology measures required for the Accelerated COz Abatement . . . . . . . Case (B3) until 2010 (as compared with the Base Case in Table 5.5).
Investments required for the energy scenarios and cases. 1980-2050. in billion US dollars in 1980 . . . . . . . . . . . . . . . . . . . . . . . . . . . . . . . . . . . . . . Institutional "environment" for effective implementation of climate-addressed en-
. . . . . . . . . . . . . . . . . . . . . . . . . . . . . . . . . . . . . . ergy strategies

List of Figures
. . . . . . . . . . . . . . . . . . . . . . . . . 2.1 MEDEE-LEAP-MARS interactions 6
. . . . . . . . . . . . . . . . . . . . . . . . . . . . . . . 3.1 Crude oil price projections 12 . . . . . . . . . . . . . . . . . . . . . . . 3.2 C 0 2 emissions by global energy systems 60
. . . . . . . . . . . . . . . . . . . . . . . . . . 4.1 Global energy-related COz emissions 69 . . . . . . . . . . . . . . . . . . . . . . . . . . . . 4.2 Dynamics in structural changes 71
5.1 Cost-effectiveness of COz reduction measures in 2010 for developed countries . . 84 5.2 Cost-effectiveness of COz reduction measures in 2010 for developing countries . . 84
. . . . . . . . . . . . . . . . . . . . . . . 5.3 Annual COz emission reduction in 2010 85 5.4 Public perception of environmental degradation as a function of the national
. . . . . . . . . . . . . . . . . . . . . . . . . . . welfare in industrialized countries 92
vii

Foreword
The objective of the collaborative IIASA-CRIEPI study was to develop an analytical framework and formulate scenarios for evaluating the effectiveness of policy options in global/regional energy systems directed at delaying or mitigating the global-warming effect over the first half of the 21st century. The study is therefore aimed at the development of analytical tools for evaluating long-term energylclimate countermeasure options, taking into account the influence on energy demand and supply of changes in social needs, economic and population growth, governmental policies, and technological progress.
The approach is based on scenario simulations to describe those techno-economic and socio- cultural changes which determine future energy-use patterns and their environmental impacts. For this purpose, two scenarios have been formulated: one with changes in society, economic systems, and the energy sector that follow the dynamics-as-usual pattern, and the other with en- hanced energy efficiency improvements and conservation efforts. For each scenario three different cases have been analyzed reflecting the possible situations on the energy supply side.
Addressing policy makers and specialists in energy demand and supply, the authors evaluate the consequences of various policy options and explore more efficient and effective measures for reducing environmental impacts, for example, through regional interactions such as technology transfer and technological progress.
This report describes the relationship between the directions of policy orientations and the global energy situations in the future. The issues that require further investigation include the process of international cooperation on implementing the measures proposed, the evaluation of the costs associated with the construction of future energy systems as well as the introduction of advanced technologies, and formulation of a global strategy to control not only carbon dioxide as examined in this study but also all the greenhouse gases.
Peter E. de Ja'nosi Director IIAS A
Akira Yajima Vice President
CRIEPI
Acknowledgments
Valuable comments and suggestions on energy demand and supply projections were received from Prof. J. Marecki (Technical University of Gdansk, Poland), Prof. W. Riesner (Technische Hochschule Zittau, Germany), and Dr. Lee Schipper (Lawrence Berkeley Laboratory, USA). We are grateful to Dr. J.A. Edmonds (Battelle Pacific Northwest Laboratory, USA), Dr. L. Hamilton (Brookhaven National Laboratories, USA), and Dr. J.-R. Frisch (Electricitd de France) for their constructive and critical remarks on the study. The discussions of some aspects with Prof. B. Doos, Dr. N. Nakidenovid, Dr. A. Griibler, Dr. L. Schrattenholzer, and other colleagues at IIASA were very productive. We extend our appreciation to Dr. K. Yamaji (CRIEPI and University of Tokyo) for his initiative in launching this study and his careful supervision over the past two years.

Chapter 1
Introduction
The evolution of natural systems that feed and sustain human populations, and indeed the evolution of modern society, has occurred in the context of a moderate and stable climate. A stable climate system has always been taken for granted in the prospects for human progress. But the atmospheric concentration of carbon dioxide (COz) has been increasing since the industrial revolution and is now considered one of the major causes of possible global warming. Carbon emissions from energy consumption in social and economic activities of mankind are expected to increase further beyond the turn of the century, if no countermeasures are undertaken to mitigate or reduce them. The increase of emissions, if looked at by region or by sector, may occur in quite different ways. In developed countries, for example, the increase of the emissions will not be of great magnitude, due to the transition of their industrial structures to lighter directions, i.e., from manufacturing toward services industries. Developing nations, however, will face a much greater increase in emissions caused by their industrial development of mainly heavy, energy-intensive manufacturing.
Therefore, recent trends in climate changes, most likely caused by increasing COz concentra- tions and other radiative active trace gases in the atmosphere, and the expected global warming are now a major concern to mankind. Today, many studies and proposals are concentrating on the principal anthropogenic sources of greenhouse gas emissions related to the supply and use of fossil fuels, particularly, commercial fuels. Some nations have already realized the danger of global warming (e.g., Germany, the Netherlands) and have adopted ambitious programs for greenhouse gas reductions within their national boundaries over the next decade and beyond. However, the measures proposed by these programs are costly (hundreds or even thousands of dollars per ton of sequestered carbon). In developing countries measures and opportunities may be found which are less expensive and more effective.
However, developing countries are not really interested in greenhouse gas abatement policies today: the consequences of global warming are still remote and uncertain. The Third World does not have the resources, the means, or the political intentions to provide effective climate change abatement policies on a wide scale, because of the existing endless tensions between developed and developing nations on past and future responsibilities for climate changes. It is hard to believe that the situation will radically change in the near future if steps are not taken by both sides.
Carbon dioxide was a major contributor to the total increase in climate changes during the 1980s, amounting to 55% or about 8.2 billion tons of carbon (Gt-C) of which 67% are from fossil fuel combustion.' Many other greenhouse gases (e.g., CH4, NzO) are also released in large quantities by energy systems. Therefore, it is important to deal with energy systems when planning strategies for preventing climate change and environmental degradation.
'IPcc (1990), Policymakero Summary of the Scientific Assessment of Climate Change; Report to IPCC Working Group 1. R. Beaver (1990), Summary of Major Sources of Anthropogenic Greenhouse Gas Emissions, EMF 12, Stanford University, CA.
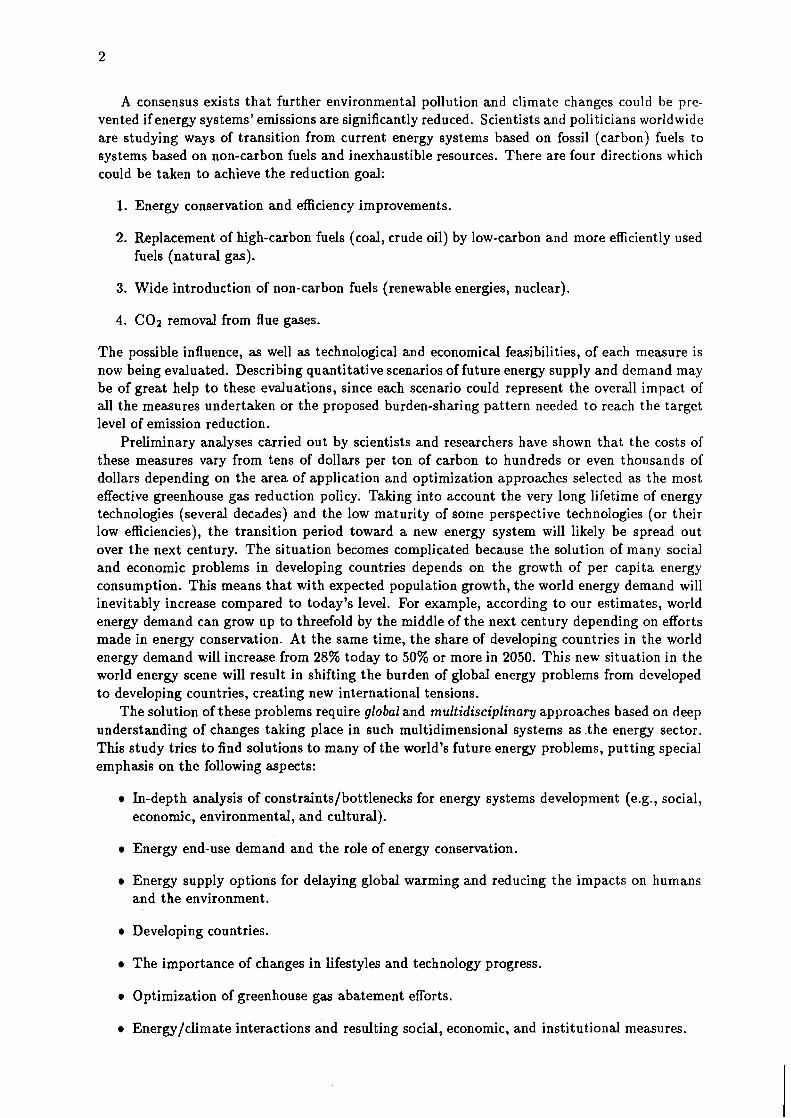
A consensus exists that further environmental pollution and climate changes could be pre- vented if energy systems' emissions are significantly reduced. Scientists and politicians worldwide are studying ways of transition from current energy systems based on fossil (carbon) fuels to systems based on non-carbon fuels and inexhaustible resources. There are four directions which could be taken to achieve the reduction goal:
1. Energy conservation and efficiency improvements.
2. Replacement of high-carbon fuels (coal, crude oil) by low-carbon and more efficiently used fuels (natural gas).
3. Wide introduction of non-carbon fuels (renewable energies, nuclear).
4. C 0 2 removal from flue gases.
The possible influence, as well as technological and economical feasibilities, of each measure is now being evaluated. Describing quantitative scenarios of future energy supply and demand may be of great help to these evaluations, since each scenario could represent the overall impact of all the measures undertaken or the proposed burden-sharing pattern needed to reach the target level of emission reduction.
Preliminary analyses carried out by scientists and researchers have shown that the costs of these measures vary from tens of dollars per ton of carbon to hundreds or even thousands of dollars depending on the area of application and optimization approaches selected as the most effective greenhouse gas reduction policy. Taking into account the very long lifetime of energy technologies (several decades) and the low maturity of some perspective technologies (or their low efficiencies), the transition period toward a new energy system will likely be spread out over the next century. The situation becomes complicated because the solution of many social and economic problems in developing countries depends on the growth of per capita energy consumption. This means that with expected population growth, the world energy demand will inevitably increase compared to today's level. For example, according to our estimates, world energy demand can grow up to threefold by the middle of the next century depending on efforts made in energy conservation. At the same time, the share of developing countries in the world energy demand will increase from 28% today to 50% or more in 2050. This new situation in the world energy scene will result in shifting the burden of global energy problems from developed to developing countries, creating new international tensions.
The solution of these problems require global and multidisciplinary approaches based on deep understanding of changes taking place in such multidimensional systems as t h e energy sector. This study tries to find solutions to many of the world's future energy problems, putting special emphasis on the following aspects:
In-depth analysis of constraints/bottlenecks for energy systems development (e.g., social, economic, environmental, and cultural).
Energy end-use demand and the role of energy conservation.
Energy supply options for delaying global warming and reducing the impacts on humans and the environment.
Developing countries.
The importance of changes in lifestyles and technology progress.
Optimization of greenhouse gas abatement efforts.
Energy/climate interactions and resulting social, economic, and institutional measures.

This study, Global Energy and Climate Change (GEC), was undertaken from April 1990 to March 1992, and utilizes some of the results of an earlier study, Collection and Evaluation of Energy/C02 Data for the World with Major Emphasis on CMEA Countries. The GEC study has the following objectives:
1. Methodology formulation to analyze global energy systems and related carbon emission by subregions up to the middle of the next century.
2. Scenario formulation and simulation.
3. Examination of possible measures and technologies to control future carbon emissions.
Two long-term reference scenarios are considered.
(A) Dynamics-as-Usual Scenario: (Al) Base Case; (A2) Nuclear Moratorium Case; (A3) Supply-side Measures Case.
(B) Enhanced Efficiency and Conservation Scenario: (Bl) Demand-side Measures Case; (B2) Nuclear Moratorium plus Demand-side Measures Case; (B3) Accelerated Abatement Case.
The reference scenario (A) in this analysis is based on the assumption that the social/economic/ technological progresses in each region will continue at the same average rate of change as ob- served in the past. For example, the primary energy intensity per unit of GNP is assumed to improve at slightly less than 1% per year until the beginning of the next century, due to the increase of energy demand in these years. For the overall time horizon of the study, i.e., up to the year 2050, its improvement is estimated at only slightly more than 1% per year. The change of the primary energy mix is assumed to be quite modest, reflecting the future prices of fossil fuels. On the other hand, in scenario (B) it is assumed that all the available efficiency improvements in the energy end-users are undertaken.
For each of the two final energy-demand scenarios, three sets of conditions for energy supply are considered. The Base Case (Al) and the Demand-side Measures Case (Bl) are constrained by the fossil resources reservoir and modest introduction of new energy technologies. The two Nuclear Moratorium Cases (A2, B2) are based on the conditions considered in the Base Cases (Al, Bl), in addition to the assumption that nuclear generation capacity will be unchanged after the year 2010. In the Supply-side Measures Case (A3), it is assumed that all the available measures are undertaken in the energy supply, i.e., fuel switching, introduction of new energy technologies, and enhancement of electrification due to expanded utilization of new energy and nuclear energy. Consequently, the Accelerated Abatememt Case (B3) assumes that all the possible measures in both energy end-use and supply are exploited. In this case we test the assumption that the global carbon emission from energy systems in the year 2050 will be reduced by roughly 60% from the current level. This reduction targetis taken from the Intergovernmental Panel for Climate Change (IPCC) Interim Report, Policymakers Summary of the Scientific Assessment of Climate Change (Report to IPCC from Working Group 1, June 1990), as the reduction level required for stabilizing the atmospheric carbon concentration. Needless to say, it is well beyond the scope of this study to discuss if humanity should really pursue this target or the feasibility of putting this emission reduction into practice or the speed at which this target may be reached. We have chosen this IPCC target of carbon emission reduction as a mere boundary condition of the model simulation.
The study was discussed a t the International Workshop on Energy/Ecology/Climate Mod- eling and Projections, organized jointly by IIASA and CRIEPI and held at IIASA in January 1992 (Appendix 4 contains the agenda and summary i f the workshop).
We do not intend to give the impression that this study contains the solutions to all problems. But we hope that with this report we can take one step toward understanding the problem and toward showing possible actions to prevent global warming. We vigorously believe that mankind

must start immediately to address the problem seriously, first with non-regret actions for the next couple decades that make sense even if the greenhouse effect did not exist. The advice "look before you leapn2 could prevent us from adapting bad solutions, but skeptical views on the phenomena today can result in large implications for humanity in the future, especially for those of us who still live in less-favorable conditions.
Although the study was a painstaking experience for both authors, Yuri Sinyak takes sole responsibility for Chapters 1, 2,3, 5, and 6 and Koji Nagano for Chapter 4.
2 ~ e e , for example, the article by S.F. Singer, R. Revelle, and Ch. Starr (1991), What to Do About Greenhouse Warming: Look Before You Leap, Cosmos, pp. 28-33. The authors warn about taking premature actions to prevent climate change. They claim that the scientific base for a greenhouse warming is too uncertain to justify drastic actions at this time. A good argument against this position is given by W. Kellogg (1991), In Response to Skeptics of Global Warming, Bulletin of the American Meteorological Society 72(4):499-511.

Chapter 2
Approaches, Background, and Tools
2.1 Long-Term Energy Projections: Background
Global energy systems over the next several decades (at least, until the middle of the next century) are expected to progress in the following ways:
Energy demand will grow, primarily in developing countries, caused by population in- creases, economic and social development, and shifts of energy-intensive industries from developed to developing countries.
The importance of energy savings and conservation will steadily increase at all stages of the energy chain from primary energy production to end-use.
Strong constraints will be placed on nuclear energy, especially in the near future (at least until new generations of nuclear reactors that are safer and more economical than today's are developed, demonstrated, and publicly accepted).
Contributions from renewable energies to the energy supply will be limited because of their low reliability and poor profitability.
Fossil fuels will keep their important role in the global energy supply for a long time from the viewpoint of a resource availability and economics; however, ecological and climate factors may force humanity to restrict the use of fossil fuels, starting with those that are most dangerous to the ecology.
Since the mid-1980s, ecological and climate factors have been playing a more active role in shaping energy policies in many developed countries, slowly replacing economic or po- litical factors as the most important factors. This tendency will continue in the future and will result in changing the methodologies of energy technology selections and energy policy compilations, followed by new concepts for long-term energy development, primarily oriented toward environmentally benign and less risky concepts and options.
All these (an many other) aspects were used as background for long-term energy/COz projections described in this study.
2.2 Approaches and Methodological Framework
2.2.1 Analytical Framework
Initially, it was decided to use simple simulation-type models instead of complicated optimization or econometric models for this long-term study. In addition, existing, verified, and widely used models were to be employed. The models should be computer simulations.
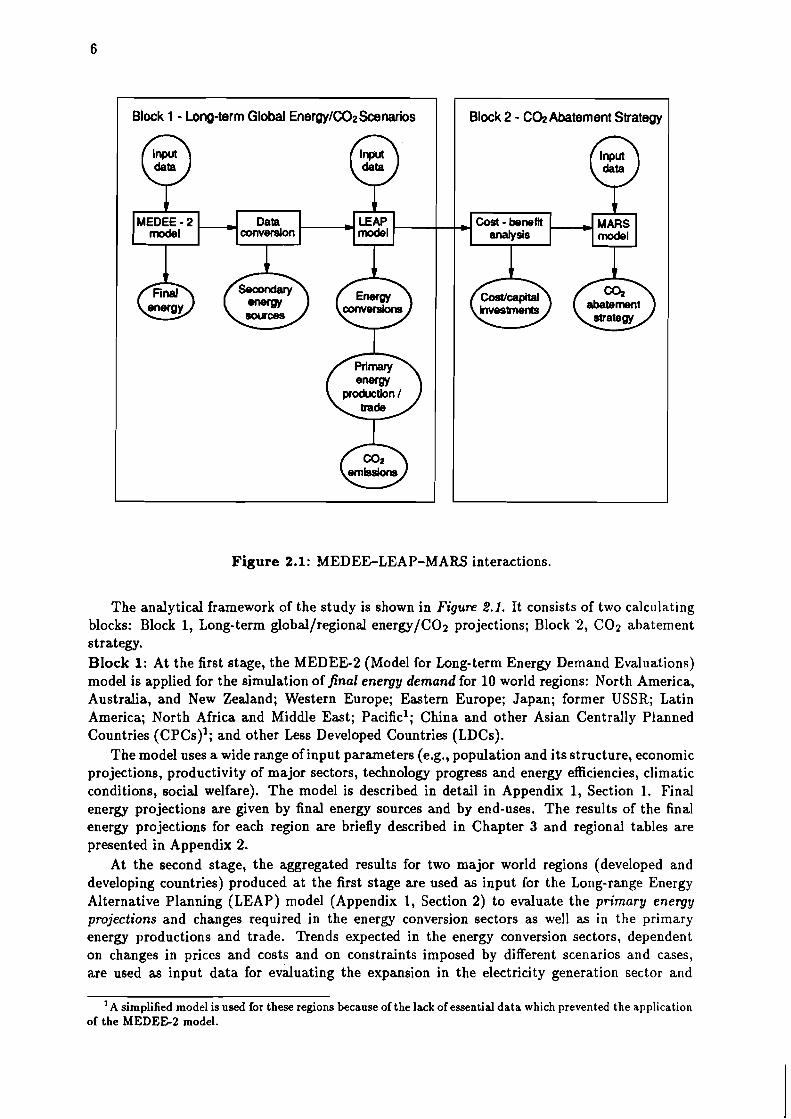
Figure 2.1: MEDEGLEAP-MARS interactions.
6
The analytical framework of the study is shown in Figure 2.1. It consists of two calculating blocks: Block 1, Long-term global/regional energy/C02 projections; Block 2, COz abatement strategy. Block 1: At the first stage, the MEDEE2 (Model for Long-term Energy Demand Evaluations) model is applied for the simulation of final energy demand for 10 world regions: North America, Australia, and New Zealand; Western Europe; Eastern Europe; Japan; former USSR; Latin America; North Africa and Middle East; Pacific1; China and other Asian Centrally Planned Countries (CPCS)'; and other Less Developed Countries (LDCs).
The model uses a wide range of input parameters (e.g., population and its structure, economic projections, productivity of major sectors, technology progress and energy efficiencies, climatic conditions, social welfare). The model is described in detail in Appendix 1, Section 1. Final energy projections are given by final energy sources and by end-uses. The results of the final energy projections for each region are briefly described in Chapter 3 and regional tables are presented in Appendix 2.
At the second stage, the aggregated results for two major world regions (developed and developing countries) produced at the first stage are used as input for the Long-range Energy Alternative Planning (LEAP) model (Appendix 1, Section 2) to evaluate the primary energy projections and changes required in the energy conversion sectors as well as i n the primary energy productions and trade. Trends expected in the energy conversion sectors, dependent on changes in prices and costs and on constraints imposed by different scenarios and cases, are used as input data for evaluating the expansion in the electricity generation sector and
Block 1 - Long-term Global EnergylCO2Scenarios
'A simplified model is used for these regions because of the lack of essential data which prevented the application of the MEDEE-2 model.
Block 2 - C@ Abatement Strategy
MEDEE - 2 Data LEAP , Cost - benefit merslon )model , MARS model analysis model

crude oil refinery. Calculation of primary energy production is done by taking into account the availability of natural resources, the expected interregional energy exchanges, and the losses of energy resources in transportation and distribution. C02 emissions were calculated from these results. The assessments of this stage are summarized in Chapter 3. The analysis of output indicators (e.g., primary energy or electricity per capita or GNP, elasticities, GNP per capita) in time dynamics and by region helped in verifying the results and in making them more practicable and compatible. This process also required several iterations to produce meaningful and reasonable energy projections. An auxiliary spreadsheet model was used for calculating cost/investments required by a scenario/option.
The models analyze the impacts of economic, technology, or lifestyle changes on energy demand and supply. However, both models are not directly cost-sensitive (such as econometric models usually used in such studies) because the costs and energy prices are incorporated into scenario assumptions implicitly as technology selection guidelines or background. Block 2: Results of the energy projections obtained in Block 1 are used to evaluate energy- saving potentials by region and cost-effectiveness of its implementation until 2010. The MARS model helps in identifying least-cost global C02 abatement strategies under given constraints for energy systems and C 0 2 reduction goals (Appendix 1, Section 3). The model belongs to the class of discrete programming problems (the most well-known examples of this family are the problems of "optimal personnel assignments" or of the "traveling salesman"). Results of the modeling runs are presented in Chapter 5. This step finishes the modeling process, although sometimes several iteration loops may be required to reach reasonable and practical solutions.
2.2.2 Definition of Global Scenarios
The scenario simulation used in this study was selected because of the existence of clear re- lationships between inputs and outputs. Such an approach helps in the evaluation of systems responses with different combinations of initial thoughts and data. However, the scenario ap- proach has at least one, but essential, drawback: the subjective view of the expert or group of experts involved in the study. This study, along with other similar studies (if not all), is scientific research but not a prophecy and, no doubt, also suffers from this drawback.
After some discussions, two major scenarios with different energy conservation policies were selected for the detailed analysis of final energy demand:
Dynamics-as- Usual Scenario, where the rate of social, economic, and technological changes worldwide stays the same over the time horizon of the study and the competition between fuel and energy forms is based primarily on market mechanisms.
Enhanced Eficiency and Conservation Scenario, where special measures in addition to the conditions specified in the Dynamics-as-Usual Scenario are applied to promote and improve energy efficiency in all regions and economic sectors.
Table 2.1 summarizes the two scenarios. Several options within each energy scenario, reflecting structural changes in primary energy supply, were chosen for further analysis. Three options were available for the Dynamics-as-Usual Scenario (A):
Base Case (Al), no special constraints on energy systems development, modest introduc- tion of nuclear energy and renewables are assumed.
Nuclear Moratorium (A2), practically freezing nuclear energy at the level projected for the period 2005-2010, i .e., assuming that all nuclear power plants under construction will be finished and no new constructions will be allowed except the replacement of old and obsolete plant^.^
21n fact, two options were originally considered: nuclear moratorium and nuclear elimination until the middle of the next century. However, the second option was dropped from the analysis because the results for both were very similar and were considered projection noise.

Table 2.1: Summary of t h e scenarios.
Scenario Demography Economy Lifestyle Environment Technology Dynamics-as-Usual Large population growth Prevailing market forces Evolutionary changes in Environmental Dy namics--usual
in the LDCs lifestyle indifference penetration rate Slow growth or Declining GNP growth No improvements in No internalization of Supply-sideoriented stabilization in developed rate (especially for settlement planning environmental losses strategy countries developed countries,
while high growth in developing countries)
Large growth in urban Profits vs. risk Individual vs. public No environmentally Centralization vs. population minimization oriented educational decentralization
Aging program
Direct costs in technology Nationalism and racism No institutional Limited technology selection vs. global cooperation abatement measures (e.g., transfer to the poor
energyICO2 taxes) Reduction in household Protectionism and import size barriers
E n h a n c e d Efficiency Same as in Market forces with policy Revolutionary changes in Environmental concern Enhanced penetration of and Conservat ion Dynamics-as-Usual incentives lifestyle and consensus new and clean
GNP growth rate (same Remarkable progress in Internalized technologies Demand-sideoriented
as above) settlement planning environmental losses strategy Reliability and risk Public vs. individual Strong emphasis on Decentralization vs. - -
management vs. costs educational program centralization Social costs as criterion Global cooperation vs. Institutional abatement Eliminating barriers to for technology selection racism measures (e.g., technology transfer
energy/C02 taxes) mading and mutual

Supply-side Measures Case (AS), efforts in energy conservation applied primarily to the supply side.
Three options were also available for the Enhanced Efficiency and Conservation Scenario (B):
Demand-side Measures Case (Bl), efficiency improvements applied primarily to energy end-users.
Nuclear Momtorium (B2), as in the Dynamics-as-Usual Scenario.
Accelerated C02 Abatement (BS), with enhanced energy systems restructuring. The margi- nal case (enhanced energy conservation and a whole range of C 0 2 abatement measures) assumes C 0 2 emission reductions until 2050 of about 60% below the current manufactured carbon dioxide emissions level, which are required to stabilize concentration^.^ This case supposes anthropogenic releases of C 0 2 at levels close to the sustainability state and no further increases in C 0 2 concentration after the middle of the next ~ e n t u r y . ~
The time horizon of the study is divided into three periods: first, 1980-1990 for model calibrations and verifications; second, 1990-2010 with two 10-year subperiods to provide more detailed mid-term projections; and third, 2010-2050 with two 20-year subperiods to understand better the long-term trends and policy measure responses.
3 ~ ~ ~ ~ . OD. cit. . - 'The earlier this state is achieved, the lower the projected global temperature increases. This means that
postponing policy actions to prevent global warming for some time in the future will result in higher temperature levels at which a concentration stabilization will be attained at last.

Chapter 3
Long-Term Global Energy/C02 Scenarios
3.1 Final Energy Demand
Final energy-demand assessments are the focal point of our long-term energy projections based on the simulation approach with the MEDEE-2 and LEAP models. In this study, final en- ergy demand includes feedstock and noncommercial fuels which in official statistics are often treated separately. Only centralized heat supply options are specified in the MEDEE-2 model. This means that decentralized heat suppliers are included in direct fuel use with corresponding efficiencies. For this reason possible discrepancies between official statistics and numbers are presented in the study.
The final energy projections are based on the analysis of different factors. The main factors include population, GNP (in constant 1980 prices), industrial activities, transportation require- ments, household and service sector expansions, energy efficiency improvements, energy prices1, and changes in social behavior. Population projections and GNP growth rates are the same for both scenarios, but other factors vary between the scenarios. UN population projections are used until the year 2030; thereafter (until 2050) the authors' assessments are used (Table 3.1). The trends in population issues are mainly based on the views summarized in the Briefing Kit 1992, prepared by the UN Population Fund for the UN Conference on Environment and Development (UNCED) held in Rio de Janeiro in June 1992. Economic activity outlooks are based on the input assumptions agreed on by the Energy Modeling Forum (EMF-12 Working Group, 1990- 1991) for its joint study on energy and climate change with some corrections by the authors, mainly related to former socialist countries (the former USSR and Eastern Europe) (Table 3.2). Energy prices over the next decades are assumed to remain under the strong influence of crude oil market projections, for which we took the median of the poll responses until the year 2020 provided by the International Energy Workshop, jointly organized by Stanford University and IIASA (Figure XI), and with a later stabilization of the productive cost of back-stop technolo- gies for the production of synthetic liquid fuels (presumably at the level of about $50 (dollars in 1990) per barrel). All regional tables with initial assumptions and input data as well as final energy demand are shown in Appendix 2.
' ~ l t h o u ~ h the MEDEE2 and LEAP models do not include any explicit considerations on energy market features, the price movements will implicitly govern rat- for new technology penetrations which are in line with energy-price dynamics. Crude oil prices will keep their leading position for many years in shaping both the energy market and the energy system.
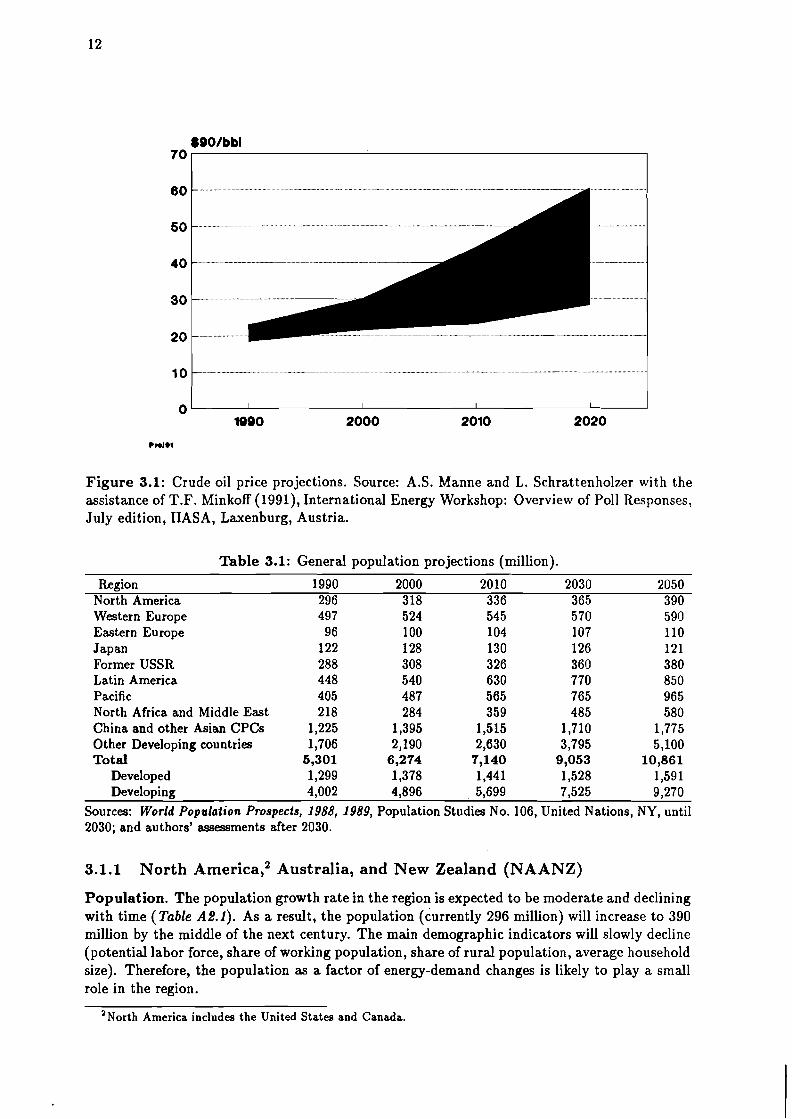
Figure 3.1: Crude oil price projections. Source: A.S. Manne and L. Schrattenholzer with the assistance of T.F. Minkoff (1991), International Energy Workshop: Overview of Poll Responses, July edition, IIASA, Laxenburg, Austria.
Table 3.1: General population projections (million).
Region 1990 2000 2010 2030 2050 North America 296 318 336 365 390 Western Europe 497 524 545 570 590 Eastern Europe 96 100 104 107 110 Japan 122 128 130 126 121 Former USSR 288 308 326 360 380 Latin America 448 540 630 770 850 Pacific 405 487 565 765 965 North Africa and Middle East 218 284 359 485 580 China and other Asian CPCs 1,225 1,395 1,515 1,710 1,775 Other Developing countries 1,706 2,190 2,630 3,795 5,100 Tot a1 5,301 6,274 7,140 9,053 10,861
Developed 1,299 1,378 1,441 1,528 1,59 1 Developing 4,002 4,896 5,699 7,525 9,270
Sources: World Population Prospects, 1988, 1989, Population Studies No. 106, United Nations, NY, until 2030; and authors' assessments after 2030.
3.1.1 North America,* Australia, and New Zealand (NAANZ)
Population. The population growth rate in the region is expected to be moderate and declining with time (Table A2.l). As a result, the population (currently 296 million) will increase to 390 million by the middle of the next century. The main demographic indicators will slowly decline (potential labor force, share of working population, share of rural population, average household size). Therefore, the population as a factor of energy-demand changes is likely to play a small role in the region.
'North America includes the United States and Canada.

Table 3.2: Economic activity assumptions (GNP, billion $ in 1980).
Region 1990 2000 2010 2030 2050 North America, Australia, and New Zealand
aagr, %a
Western Europe aagr, %"
Eastern Europe aagr, %a
Japan aagr, %a
Former USSR aagr, %a
Latin America aagr, %"
Pacific aagr, %a
North Africa and Middle East aagr, %a
China and other Asian CPCs aagr, %"
Other Developing countries aagr, %a
Total aaagr = average annual growth rate. Source: National Accounts Statistics: Main Aggregates and Detailed Tables (1989), U N , NY; Energy Modeling Forum, EMF-12 Working Group (1990-1991), Stanford University, CA; and authors' assess- ments.
Economic projections. In both scenarios the declining GNP growth rates are assumed at 2.5% per year during the 1990s, 2% per year during 2000-2030, and 1.5% per year in 2030-2050. Such an assumption leads to a GNP estimated at $4,725 billion (dollars in 1980) in 2000 and more than $11 trillion by the middle of the next century (Table A2.2). GNP per capita will practically double until 2030 (in constant prices) and will grow slowly thereafter. It is expected that the proportion of the service sector will reach about 70% manifesting possibilities for a strong reduction in final energy demand.
The NAANZ economy (especially, North America, the main part of the region) has very large reserves for energy conservation which, if implemented, could substantially reduce current final energy demand. Therefore, two different approaches are reflected in the projections given below: moderate efforts in energy efficiency improvements, which follow as a rule with further increases in energy demand; and enhanced efforts, which can drastically reduce final energy demand for all sectors in this region.
Prod~ct ion .~ The existing trend in the growing role of the service sectors will continue (Table A2.2). With time, the share of basic material production will decline remarkably with progress made in material use and with the transfer of some industries to regions with more favorable productive conditions and economies. The less energy-intensive sectors of industrial production will predominate (e.g., electronics, instrumentation, precise machinery). Final energy demand for productive activities will increase from 627 Mtoe (million tons of oil equivalent) in 1990 to 690 Mtoe in 2000. In the next century, moderate efforts in energy efficiency improvements and economic restructuring will result in the increase of final energy demand up to 815 Mtoe in
'The MEDEE-2 model operates with the following productive sectors: agriculture, construction, mining, manufacturing (basic materials, machinery and equipment, nondurable goods, miscellaneous industries), and energy.
2050 (increasing the share of this sector in final energy from 37% today to 42% in the future). Enhanced efforts could result in a strong decline of this component after 2010. Transportation. Over the time horizon of the study, freight transportation activity will more than double with slight decreases in the role of automotive modes and waterways in favor of new transportation modes based on pipeline transport (Table A2.4). It is expected that about one-third of the national freight overhaul will be met by new transportation modes. The share of trains remains practically the same over the time horizon of the study. However, the electrification of freight transportation will substantially reduce the demand for liquid fuels in this sector.
Intercity passenger transportation will further increase if no special measures are introduced into improving communication systems. Thus, total intercity passenger-kilometers traveled will rise from 3.8 trillion pass-km today to 4.4 trillion pass-km in 2000. In the Dynamics-as-Usual Scenario this growth will continue, reaching almost 5.9 trillion pass-km in 2050. However, in the Enhanced Efficiency and Conservation Scenario this growth will change somewhere after 2010-2020 and a decline is anticipated to practically the current level, primarily because of the higher introduction rate of information technologies, directly reducing some types of trips. It is assumed that average intercity distance traveled per year will increase in both cases until 2010-2015 reaching 14,500-11,500 km per person. However, later the scenarios assume different trends: in the Dynamics-as-Usual Scenario a further growth is expected and in the Enhanced Efficiency and Conservation Scenario a decline is assumed to levels below present values. No major changes are expected in the transportation modes. However, the share of private cars in the future will be slightly lower than today's share because of the growth in air travel and train transportation. Large electricity penetration in the train passenger mode is expected. The same tendencies will control urban transportation, however, with more pronounced results in the reduction of cars and in the expansion of electricity use.
Total requirements for the transportation sector will be 200-580 Mtoe in 2050 (the projec- tions strongly depend on conservation measures) compared with 518 Mtoe in 1990. Household and service sector. Population growth and higher living standard will result in the growth of dwellings (by 20% until 2010 compared with current levels and by about 60% until the middle of the next century) and the area of service sector buildings (from about 7.3 billion m2 in 1990 to 9-10 billion m2 in 2010 and 10-11 billion m2 in 2050) (Table A2.5). Therefore, moderate efforts in energy conservation in residential and commercial buildings will be followed by a steady growth in energy demand for space heating, but an enhanced energy-savings policy with more stringent building codes will result in a strong reduction of this requirement (even compared with today's level) ( Table A2.3).
Energy required for water heating also follows two different trends: in the case with mod- erate efforts in energy efficiency improvements it will continue to rise reaching 55 Mtoe in 2050 compared with 35 Mtoe today, and in the conservation case growth is expected only until the beginning of the next century and then will steadily decline, reaching in 2050 almost the same level as today's level.
Specific electricity requirements in the residential sector is projected to increase to 3,000 kwh per dwelling in 2000; later either a further growth to 5,000 k w h is expected or, after several decades of stabilization, a decrease to practically the current level of 2,500 kwh is assumed. Wide application of new, more energy efficient domestic appliances makes these projections reliable and realistic.
To summarize, final energy demand for households and the service sector will inevitably slowly continue to rise during the current decade, reaching 630 Mtoe in 2000 (557 Mtoe in 1990). However, later this growth will be replaced by a decline. The rate of decline will depend on the policy applied. Therefore, at the end of the time horizon of the study final energy demand for these sectors will be hardly higher than today's level, or i t may be half of that level if wide efficiency improvements are implemented. The share of this sector might slightly decrease from one-third today to about one-half in the future.

Total final energy demand. In the Dynamics-as-Usual Scenario, where moderate efforts in efficiency improvements and conservation are made, a further growth in final energy demand is projected (from 1,700 Mtoe in 1990 to 1,950 Mtoe in 2050). However, the second scenario shows an increase only until 2000 after which a steady decline of the demand is projected reaching in 2050 a level almost half of today's level.
Major changes are expected in the final energy structure. Electricity's share will increase from 16% today to 28%-38% in the long term. Motor fuel will either keep its position at the same level of 34% (Dynamics-as-Usual Scenario) or slowly decline to 27% (Enhanced Efficiency and Conservation Scenario). Strong reductions in fossil fuels consumption (excluding feedstock) is projected: from 43% in 1990 to 7%-19% in 2050. Final energy intensity will decline from 0.47 toe/$1,000 to 0.1-0.2 toe/$1,000 by the middle of the next century. The NAANZ's proportion in global final energy will shrink from the current 27% to 11%-15% by the middle of the next century.
3.1.2 Western Europe4
Populat ion. The population of the region will continue to increase, mainly in Southern Europe and conditionally attached countries (see note 4), reaching 524 million in 2000 and 590 million in 2050 compared to 497 million in 1990 (Table A2.7). Economic projections. It is expected that the GNP in Western Europe will grow a bit faster in the 1990s than the GNP in North America. However, thereafter the growth rates will be comparable in both regions and slightly decline with time (Table A2.8). The GNP per capita will at least triple over the time horizon of the study. The trends projected for North America are also characteristic for this region. Product ion. Further reductions in energy-intensive activities are expected over the time hori- zon of the study with parallel efficiency and technology improvements and will result in declining final energy growth rates. Final energy demand for productive purposes will increase over the first quarter of the next century reaching 560 Mtoe in 2000 and 575-595 Mtoe in 2010 compared with 493 Mtoe today (Table A2.12). However, by 2050 large changes are expected: moderate efforts in energy conservation will result in further increases of final energy demand to 625 Mtoe in 2050; however, an enhanced conservation policy in the 1990s and especially after 2000 will be evident in final energy demand reductions, reaching current levels until the middle of the next century. The share of this sector in final energy is projected to increase from 43% today to 47%-65% in 2050. Transportat ion. Freight transportation activity will constantly increase, and its mix will change with the same tendencies as for North America: decline in truck and increase of pipeline and train transportations (Table A2.10).
Further growth is expected for passenger transportation both intercity and urban. However, in the case of moderate efforts in energy efficiency improvements this growth will be remarkable: 75% and almost fivefold for intercity and urban transportation, respectively, with continued trends in motorization and growth of urban population, especially in the southern part of Europe. Efficiency improvements and changes in living standards can substantially offset this growth: intercity passenger overhaul after some growth over several decades will start to decline in 2050 to levels slightly above the current level, and urban passenger requirement will double.
As a result, final energy demand for transportation over the time horizon of the study will remain either constant (Dynamics-as-Usual Scenario) or strongly decline (Enhanced Efficiency and Conservation Scenario) (Table A2.12). The share of this sector remains the same, 2276, for the first case and decreases down to 12% for the second case.
'In this study Western Europe includes the former GDR, Yugoslavia, and Turkey as well Israel and South Africa. The latter two are conditionally included in the region to avoid confusion that may result if they were included in the subsequent regions to which they belong geographically.

Household a n d service sector. A rather strong growth in the number of dwellings and service sector buildings is expected in the region: more than 50% and 65%-70%, respectively (Table A2.11). However, final energy demand for space heating will show smaller growth rates (only 20% in the Dynamics-as-Usual Scenario) or even a decrease (by 20% in Enhanced Efficiency and Conservation Scenario).
Energy demand for water heating will steadily increase in both cases reaching 45-70 Mtoe in 2050 compared with 33 Mtoe today. The reason for such growth is the improvements in the living standard of the population in the region, especially in the South.
A strong increase in the electricity demand is anticipated over the time horizon of the study: from about 92 Mtoe in 1990 to 120-200 Mtoe in 2050. As a result, the electricity share will reach about 50% in the sectorial final energy demand compared with 22% today.
To summarize, final energy demand for the residential and service sectors will increase during the next few decades to 440-450 Mtoe from 421 Mtoe currently, and then will begin to decline, however, at different rates, depending on the scenario considered: reaching present levels if moderate efforts in efficiency improvements are implemented or half of today's level. The share of this sector will decrease from 35% in 1990 to 28%-32% in 2050. Total final energy demand. As in the previous case with NAANZ, total final energy demand for this region will either slightly increase (by 14% until 2050 in the Dynamics-as-Usual Scenario) or decrease (by 33% in the Enhanced Efficiency and Conservation Scenario) (Table A2.12).
Electricity will be the most dynamic component of final energy: its share will rise from 12% today to 30%-37% in the future. Motor fuel's share remains practically constant at 22% over the whole period if moderate efforts in energy savings are applied or declines to 12% if strong conservation measures are supported by changes in social behavior. The proportion of fossil fuels for direct uses will decline from today's level of 48% to 17%-23% by the middle of the next century.
The region's share in global final energy demand is expected to decline from 19% in 1990 to 11%-13% in 2050.
3.1.3 Eastern Europe5
Population. The population of the region will have slow growth with declining rates after 2010 (Table A2.13). The trends which are characteristic for other developed countries will control the demographic situation in Eastern Europe (e.g., potential labor force, share of urban population, average household size). Economic projections. There are some known difficulties with the economic achievements in
- -
East European countries as compared with other developed countries. In general, the transition period from centrally planned to market economies will take at least several decades. The 1990s will be especially difficult with economic recession, increased unemployment, political instability, and national tensions. All these factors will inevitably influence economic development in the short and medium term. Although the final energy projections considered here are highly dependent on economic activity trends, the projections for economic growth are assumed uniform for both scenarios. In this study we used the assessments provided by PlanEcon Corporation with some corrections to the mid-1980 bask6 It is assumed that the average annual growth rate over the 1990s will be about 1% on average, with some decreases in the GNP at the beginning of the decade and improving in the second half of the period. For the next decades, the growth rate is projected at 2.5% per year. Until the middle of the next century, the GNP per capita will more than triple (in constant prices), totaling to an increase in GNP of almost fourfold (see Table A2.14). The per capita GNP in Eastern Europe will be higher than the per capita GNP in the former Soviet Union, although still significantly lower than the per capita GNP in
'Eastern Europe includes Poland, Czechoslovakia, Hungary, Romania, Bulgaria, and Albania. The former GDR is considered part of the FRG within Western Europe.
6E. Unterwurzacher (1990), The Energy Economy in Eastern and Centml European Countries: Status and Outlook, Institut fiir Energiewirtschaft, Technische Universitit Wien, Austria.

Western Europe. The current economic system of Eastern Europe (and the former USSR) is characterized by low efficiency and backwardness. This is especially true for the energy sector, with large potentials for energy conservation and efficiency improvements. Therefore, an energy- savings policy must receive highest priority within the region as the essential step toward real social and economic progress. Product ion. The changes expected in the production sector are presented in Table A2.14. They are in line with changes taking place in Western Europe but with a delay of several decades. As a result of these changes and the low economic activity in the 1990s, the final energy demand in production will likely decline as compared with the demand at the beginning of the 1990s. However, thereafter two paths are considered: one with fast economic recovery, but with moderate efforts in energy efficiency improvements and conservation resulting in further growth of final energy in this sector until 2050 (the demand in 2050 is expected to be one-third higher than today's demand); and the other with emphasis on energy conservation and economic restructuring, providing a slow but steady decline in final energy demand over the time horizon of the study and reaching a level of about one-quarter less than the current level ( Table A2.15). In general, the share of productive activity in final energy demand remains high over the time horizon of the study. Transportat ion. Both scenarios anticipate further growth in freight transportation in the region (Table A2.16). Total freight overhaul will increase from about 850 Gt-km (billion tons per kilometer) to 1,970-2,025 Gt-km in 2050. A development of truck and pipeline transportation is expected. The share for trucks will increase from 5.5% today to 8% in 2000 and to 15%-25% in 2050. The share of pipelines will hopefully grow 1.5-2 times (11% in 1990 and 18%-20% in 2050). At the same time, the share of trains will decrease from more than 80% today to 55%-65% by the middle of the next century, with the share of electric modes in this type of freight transportation reaching 85%-100% at the end of the time horizon of the study (48% in 1990).
' Strong increases in passenger transportation are projected as a result of improvements in living standards. Intercity passenger transportation will increase from 241 billion pass-km in 1990 to about 280 billion pass-km in 2000 and 330-605 billion pass-km in 2050. Three factors are crucial for these changes: the average intercity distance traveled per person per year will increase from 2,500 km currently to 3,000-5,500 km in the future; the number of cars per 1,000 population will reach 250 compared with 80 today and the annual average intercity distance driven per car will reach 4,500-9,000 km. The intercity composition will also change. However, the changes are more dramatic for the Base Case than for the enhanced efficiency efforts (for the former the car's share in intercity transportation will reach almost 50% compared to 28.5% today but for the latter, after some growth in this share until 2010-2020, in 2050 a decline is anticipated with a slightly higher proportion of cars than today, 30%). Subsequently, buses and trains will play different roles.
A growing role of cars in urban passenger transportation is also expected (from 22% today to 30%-40% in 2050). A slight decline in the importance of mass transportation is projected, although in both cases mass transit will transport 60%-70% of the urban population by the middle of the next century with a highly increased electricity share (from 25% to 80% in 2050).
In general, final energy demand for transportation will slowly grow reaching 25-45 Mtoe in 2050 compared with 20 Mtoe in 1990. The share of this sector will increase from 7% currently to 13% in the long term. Household a n d service sector. Improvements in the living standard of Eastern Europe will strongly depend on the dwelling availability and services rendered. Therefore, an increase in the number of dwellings and the service sector area is required. In our study we assume that the number of dwellings will increase from about 30 million currently to 46 million in 2050. The service sector will more than double, from 411 million m2 in 1990 to 945-990 million m2 by the middle of the next century (Table A2.17). As a result, thermal useful energy demand for space heating will increase from 35 Mtoe in the residential sector and about 5 Mtoe in the

commercial sector in 1990 to 37-43 Mtoe and 8 Mtoe, respectively, in 2010. Thereafter, the trends will depend on the scenario applied: with moderate efforts in energy savings further growths are projected to 55 Mtoe in the residential sector and 10 Mtoe in the commercial sector in 2050. However, efforts in energy conservation can practically stabilize energy demand at the level achieved in 2010 ( Table A2. 15).
As a result of the assumptions used in both scenarios, final energy demand in the residential and commercial sectors will increase from 76 Mtoe today to 83 Mtoe in 2000. However, in the next century this growth will stay almost the same in the Dynamics-as-Usual Scenario and decline to 45 Mtoe in 2050 in the Enhanced Efficiency and Conservation Scenario. Large increases in the share of electricity in final energy demand for both scenarios are projected. Finally, the share of this sector will decline from 30% to 22%-23% in the future. Total final energy demand. The economic difficulties in Eastern Europe and the efforts applied to their economic restructuring will inevitably result in declining final energy demand in the region until 2000 as compared with present levels. However, after 2000 the results are less certain: the revitalization of the economic activity with moderate efforts in energy savings will require further growth of final energy, reaching 350 Mtoe in 2050 as compared to 270 Mtoe today. Enhanced economic restructuring together with enhanced energy conservation could result in a steady decline in final energy to 200 Mtoe by the middle of the next century (Table A2.18).
Strong changes in the final energy mix are anticipated: the share of substitutable fossil fuels will reduce from 45% currently to 11%-17% in the future, and the share of electricity will rise from 12% to 28%-35% in 2050.
3.1.4 Japan
Population. Japan's population has practically stabilized at 120-130 million people. In this study i t is assumed that the population will slightly increase within the next couple decades; however, thereafter i t will start to decline slowly to the current level (Table A2.19). Economic projections. Japan seems to keep its leading role in GNP growth among the developed countries during the present decade (3.4% per year). However, later growth rates will decline reaching a level below that for developed countries at the end of the time horizon of the study. As a consequences of such growth, the GNP of Japan will more than double over the time horizon of the study (from $1,510 billion in 1990 to $3,650 billion in 2050) (Table A2.20). Even with low GNP growth, Japan's per capita GNP will remain the highest in the world. No large changes in the GNP composition are expected, although the share in the service sector will increase with a slight decrease of the productive sector's shares in forming the GNP. Production. The trend of declining basic materials production will continue, resulting in further declines in the energy intensity in production as compared with today. Simultaneously, the role of machinery (especially those sectors with a low energy intensity such as for control and instrumentation devices production) will substantially increase (Table A2.20).
Meanwhile, the growth of final energy demand for productive purposes will continue until 2020 reaching 245 Mtoe in 2000 and 250-260 Mtoe in 2010 compared with 189 Mtoe in 1990. However, thereafter a decline in final energy demand is projected for both scenarios (Table A2.y). Transportation. Freight transportation will continue to grow although at a much slower rate than that for GNP. However, it is expected that by the middle of the next century freight trans- portation will increase its activity almost by 50% ( Table A2.22). Large changes are anticipated: increases in the use of trains (from 10% now to 16%-22% in 2050) and new transportation modes such as pipeline (from a negligible value today to 15% in the future). The share of marine transportation will decrease from over 50% today to around one-third in 2050.
The prospects for passenger transportation (both intercity and urban) will strongly depend on efforts applied to energy conservation and efficiency improvements. It is expected that in the Dynamics-as-Usual Scenario the average intercity distance traveled per person per year will
increase from less than 400 km to 10,000 km by 2050; and the average intracity distance traveled per person per day will increase by a factor of three (from about 12 km to 35 km). However, in the Enhanced Efficiency and Conservation Scenario it is assumed that progress in communication technologies will result in a decrease of the distances traveled. The intercity distance traveled per person per year will grow, reaching 4,200 km after 2010, and will then start to decrease reaching today's level in 2050 (the same tendency is assumed for intracity distance traveled per day). The pass-km can more than double if no, or not enough, improvements are introduced to raise efficiency or to reduce demand. However, an effective policy in urban planning could result in declining pass-km rates after 2010-2020, practically reaching current levels.
Of course, the results are different for each scenario. In the Dynamics-as-Usual Scenario, we can expect an increase in final energy demand for this purpose from 50 Mtoe today to 60 Mtoe in 2050, passing the maximum of 65-70 Mtoe sometime in 2010-2015. However, in the Enhanced Efficiency and Conservation Scenario, find energy demand after slightly increasing by 2000 will steadily decline, reaching a level 40% lower than the level in 1990. The share of this sector in total final energy will remain practically unchanged: 16% in 1990 and 14%- 20% in 2050. In general, the future of the transportation systems in Japan will highly depend on two major points: (1) advanced railway transportation technology such as linear motor- driven high-speed trains, and (2) settlement policies and their effectiveness. The former may appear to be a technological problem which may be solved in a matter of time. But its actual realization will be highly affected by already high prices of land and high construction costs, partly because of severe environmental regulations for noise and electro-magnetic fields. Today's urban policy must take into account the high land prices, resulting from overconcentration in major cities. To change the situation at present seems quite difficult, unless drastic measures are undertaken, such as transfer of the capital to other systems. High-speed trains might solve the present urban problems, but in such a case the demand for urban and possibly intercity passenger transportation will increase further if improvements in the information system are not introduced to support this increase. Household and service sector. A further slight growth in housing construction is projected over the time horizon of the study. However, the service sector area will grow by 40% because of its increasing share in GNP formation (Table A2.20). Final energy demand for the residential and commercial sectors will increase from 66 Mtoe currently to 75 Mtoe in 2000 (Table A2.24). Thereafter, at first this growth rate and then demand will decline because of two factors: satura- tion of service needs and efficiency improvements. As a result, final energy demand is projected to be 30-55 Mtoe in 2050, depending on the scenario applied. The share of these sectors in final demand will reduce from today's level of 22% to 14%-18% in the future. A very strong increase in the share of electricity is anticipated (from almost 28% today to more than 50% by the middle of the next century). Total anal energy demand. Total final energy demand for Japan is expected to increase at least until 2015, thereafter it will start to decline. The rate of decline will be determined by the efforts undertaken t o improve energy efficiencies: final energy in 2050 might be either the same as current levels or even less than today's level (by 30% in the Enhanced Efficiency and Conservation Scenario, Table Ah.24).
The share of electricity in final energy demand will increase to 25%-37% compared with 20% in 1990. The share of fossil fuels will sharply decline from 32% today to less than 10% in 2050.
3.1.5 The Former Soviet Union7
Population. The former Soviet Union is among the countries with a moderate and ever- declining population growth over the time horizon of the study (Table A2.25). Its population, amounting to 288 million today, will reach 308 million in 2000 and 326 million in 2010 (the
'We consider the Soviet Union within the borders which existed until 1991, before the Republics proclaimed their sovereignty and independence.

corresponding average annual growth rates are equal to 0.7% and 0.6% over 10-year periods). It is expected that the population will increase by one-third over the next several decades, reaching 380 million in 2050.
An aging population is anticipated, resulting in both a declining labor-force potential and a declining share of the working population which need to be compensated by an substantial increase of labor productivity to achieve long-term economic and social goals, i.e., to reduce the gap in the living standard between the former Soviet Union and other industrialized countries.
The process of urbanization will continue and, as a result, the share of the rural population will shrink from more than one-third today to about one-fifth by the middle of the next century.
With time, economic and social progress will result in the decline of the average household size from about four people per family in the 1980s to only three. The household size in the former Soviet Union, however, will remain higher than in other Western-type developed countries over the time horizon of the study because of the higher growth rate of the population, primarily in Asian Republics with strong Muslim traditions. Economic projections. Until recently, statistical information was not available on the GNP produced. Recent editions of national statistics contain this data. However, for many reasons, there are still great difficulties with the transformation of the data, expressed in the national currency, into comparable numbers of other developed countries. Several attempts were made at evaluating the former Soviet GNP in dollar terms which resulted in differences from less than $2,000 per person in 1988 to almost $9,000 per p e r s ~ n . ~ In this study, the averages of several studies carried out in the USA and the former Soviet Union are used (about $4600 in 1980 per person and $5700 in 1990 in 1980 prices).
The next aspect is also very uncertain: the effects of economic reforms on the recovery of the country's economy. In many national studies, GNP growth rates for the 1990s have been assumed to be 3%-5% per year. But an analysis of the current economic situation shows that such growth rates on average are illusionary for the whole decade. Therefore, we apply conservative estimates: only 0.5% per year in the 1990s (with a strong decline in the GNP at the beginning of the decade) and thereafter 2.5% per year over the time horizon of the study.
As a result of this assumption, GNP will increase from $1,640 billion today to $1,730 billion in 2000 and further to almost $6 trillion by the middle of the next century ( Table A2.26). The total GNP in the former USSR will likely be lower than in China or Latin America in a couple of decades. Production. Economic reforms will result in major changes in the Soviet production system: first of al l in a declining share of the manufacturing sector in the GNP formation as well as a decline in the basic materials sector (Table A2.26). This might be achieved by the reduction of military production and the conversion of these industries toward the production of civil goods and commodities, in spite of large conversion difficulties which exist in the former USSR. This seems to be the only way to achieve fast economic success. These changes in industrial structure will be enhanced by the existence of large energy-savings potentials in industry. Low energy- intensive sectors (such as food and textiles, civil machinery, service sectors) will predominate in the future contributing to the decrease of the Soviet energy intensity. For example, this can be seen from results of simulating thermal energy demand for the manufacturing sector shown in Table A2.27.
Energy projections for the productive sector will strongly depend on the scenarios applied: in case of the Dynamics-as-Usual Scenario we can expect some decline in final energy demand by 2000 and then a further slow increase in line with economic recovery, by 2050 reaching a level that is one-third higher than today's level (from 633 Mtoe in 1990 to 850 Mtoe in 2050). However, in the Enhanced Efficiency and Conservation Scenario with strong economic restructuring and demilitarization of the economy, we can expect a steady decline in final energy demand - by one-third toward 2050 compared with the current level. The total productive sector's share in final energy demand will decrease from 64% today to 52%-58% until 2050.
'See The Economist, April 28, 1990.

Transportat ion. Transportation requirements will increase with GNP growth (Table A2.28). A strong increase of trucks in freight transportation is expected, reaching 15%-20% until 2050 compared with only 7% today. The share of train transportation will decline with a steady increase in the electric mode which in both scenarios is assumed to be 100% by the end of the time horizon of the study. New types of freight transportation are anticipated (e.g., pipeline transportation for solid materials and goods).
Improvements in the living standard will result in a growth in passenger transportation. Intercity distances traveled per person each year will increase from currently over 6,000 km to 13,000 km (Dynamics-as-Usual Scenario) and to 8,000 km (Enhanced Efficiency and Conserva- tion Scenario). The difference in distance is explained by further improvements in communica- tion systems and expanding local recreation facilities, resulting in a strong reduction of passenger travel. The structure of intercity transportation will change drastically. First of all, the share of cars in intercity passenger transportation will grow from only 2% today to 30%-40% by the middle of the next century (the ratio of the number of population to the number of cars will steadily decline from 35 in 1980 to 25 today and to 4 in 2050). It is also assumed that with time the proportion of air travel will increase, doubling over the time horizon of the study. As a result, the share of trains will be reduced from 69% at the beginning of the 1990s to around one-third by 2050 (with practically an all electric fleet). However, the split of the former USSR into many independent states will result in decreasing passenger flows between former republics and, in the summer season, causing some decline in the rate of intercity transportation.
A further increase in urban transportation is also anticipated. Urban transportation will depend on the share of population living in urbanized areas (which will increase from 67% today to 80% in 2050) and the distances traveled by urban population inside the cities (which also will increase with growing cities from 15 km per person on the average to 25 km, as extrapolated in the Dynamics-as-Usual Scenario, and after some growth will practically decrease to the initial level of 15 km per person as a result of changes in the urban-planning policy). Again we expect a growth of private cars in urban transportation (from 16% today to 40% in the future) and a corresponding decline of the mass transit system's share. In both cases we expect increases in the electric modes: in private transportation to 35%-40% and in mass transit to 85%-95% from 22% today for the latter. Moreover, former Soviet cities have been planned with emphasis on mass transit urban systems. It is hoped that this trend will continue, limiting the growth of private cars in cities.
As a result of these assumptions, final energy requirements for transportation will increase from 162 Mtoe today to 180-185 Mtoe in 2000 and further to 215-380 Mtoe in 2050. Somewhere between 2010 and 2030, final energy demand in the Enhanced Efficiency and Conservation Scenario might reach its maximum level of 240-250 Mtoe and will then begin to decline. Over the time horizon of the study, about 95% of the energy demand will be met by liquid fuels. The share of transportation in final energy demand will increase from 16% today to 26%-28% in 2050, as i t is observed now in many industrialized countries. Household a n d service sector. Required improvements in the living standard of the Soviet population will be manifested by increasing housing construction and the expansion of the service sector areas. We expect that in spite of difficulties, the number of dwellings will grow from 74 million today to 81 million in 2000 and further to 126 million in 2050 with parallel increases in the area of dwellings (Table A2.29). The growing share of the service sector in the GNP formation is reflected by increases in service sector buildings which will double over the next several decades. At the same time, the progress in building construction will result in declining thermal and heat losses in existing stock due to retrofitting and use of improved control devices, with new constructions compensating the inevitable increase in energy demand for space heating and air conditioning. However, the effectiveness of these and many other changes will depend on the availability of financial resources. A large proportion of financial resources, needed for the reconstruction of the energy system, may be found inside the country by encouraging (1) reasonable cooperation between former republics; (2) more active demilitarization of the
national economy and its conversion; and (3) redistribution of investments to energy savings and conservation instead of energy production extension. Energy demands for thermal uses in both sectors are given in Table A2.27.
Specific electricity demand (for uses other than space and water heating, cooking, and air conditioning) will increase from 1,300 k w h annually per dwelling t o 1,500 k w h in 2000 and 2,000-3,500 k w h in 2050. On the other hand, the specific electricity consumption in service sector buildings is assumed t o decline with time due t o steady improvements in technologies used for lighting, lifts, water supply, etc.
As a result of these assumptions, final energy demand from households and the service sector will increase from 215 Mtoe today (including noncommercial fuel) t o 240 Mtoe in the Dynamics-as-Usual Scenario and decrease t o 155 Mtoe in the Enhanced Efficiency and Conser- vation Scenario. The share of fossil fuels which is over 60% today will practically disappear (only 5% in the Dynamics-as-Usual Scenario). A strong growth in electricity use in this sector is anticipated (from 10% today t o 42%-45% in 2050). The share of centralized heat supply systems will also increase from 28% today t o over 50% in the future. Total final energy demand. Table A2.90 contains the results of final energy prospects for the former Soviet Union. For the Dynamics-as-Usual Scenario, final energy demand, after practically stabilizing in the 1990s, will again start t o increase reaching 1,470 Mtoe in 2050. However, The Dynamics-as-Usual Scenario cannot be the optimal direction because there exists an immense energy-savings potential which is not fully exploited in the scenario. Therefore, the Enhanced Efficiency and Conservation Scenario shows more favorable results: energy-savings measures and economic restructuring will substantially reduce final energy demand by 25% until 2050 compared with current levels. Remarkable changes are expected in direct fossil fuel use which decreases from almost 390 Mtoe today t o 80-270 Mtoe in 2050 (its share will decline from 38% today to 10%-18% by the middle of the next century). The electricity share will increase from almost 14% today t o 22%-25% by 2050. The share of motor fuel will also grow, from 19% today to 28%-30% in the future. But shifting t o the Enhanced Efficiency and Conservation Scenario for the time horizon of the study might look unrealistic because of many difficulties and institutional barriers which should be overcome before realizing this strategy. Here, we assume that all efforts t o resolve such prerequisites will be implemented successfully which, we admit, is rather optimistic.
As a result, the final energy/GNP intensity will steadily decline from 0.62 toe/$1,000 to 0.13 toe/$1,000 for the Enhanced Efficiency and Conservation Scenario in 2050 and 0.25 toe/$1,000 for the Base Case. The region's share in global final energy demand will decline from 17% in 1990 t o 11%-14% in 2050.
3.1.6 Latin America
Population. By the middle of the next century the population of the region will practically double (448 million in 1990, 540 million in 2000, and 850 million in 2050, Table A2.31). It is assumed that the potential labor force will slowly increase before i t stabilizes a t the end of the first quarter of the next century. Economic progress and improvements in education will result in an increasing share of the actual working population, a declining share of rural population, and a decrease in the average household size. All these factors will have manifold impacts on the energy demand in Latin America. Economic projections. It is hoped that Latin America will remain over the time horizon of the study among the countries with a relatively steady and high economic growth. This study assumes a GNP average growth rate of 3% per year until 2050. As a result, GNP will increase from $1,460 billion in the year 2000 t o $6,400 billion by the middle of the next century (Table A2.32). Per capita GNP will rise from about $2,400 today t o $7,500 (the present average level of many industrialized countries). The usual trends for the industrialization stage of economic

development predominate: increases in the share of the manufacturing and service sectors and a decline in the role of agriculture. Production. The share of the manufacturing sector in the GNP formation will slightly increase from 21% today to 25% in 2050. Taking into account the high total GNP growth rate, this means that the value-added share in the manufacturing sector will increase sevenfold from $228 billion in 1990 to over $1,600 billion in 2050 (Table A2.32). The structure of the manufacturing sector is also assumed to change: first of all, the shares of energy-intensive basic materials and machinery will increase with a subsequent reduction of less energy-intensive traditional sectors such as food processing and textiles. The observed trend today of shifting heavy industries from developed to developing countries will continue, resulting in declining energy intensities in developed countries and in increasing demand in developing regions with parallel shifts in capital investments, new employment, and economic progress. These trends will result in a strong growth of final energy demand in the productive sector (from 215 Mtoe in 1990 to 460-695 Mtoe in 2050); in spite of that, strong improvements in energy efficiency are anticipated (2.5-3.5 times above the current level). The share of electricity in final energy demand for these sectors will rise from less than 10% today to 27%-32% in the long term. Large reductions in direct fossil fuels use is projected: its share will decline from 75% in 1990 to 20%-40% in the future depending on the scenario. In total, the share of the productive sector in final energy demand will continue to increase, reaching 55%-60% by the middle of the next century, compared with 51% today. Transportation. The future evolution of this sector will follow a path similar to the path the USA follows today, especially in the Dynamics-as-Usual Scenario. High economic growth will result in large expansions of freight transportation; total overhaul will increase from almost 1,300 Gt-km today to about 5,000 Gt-km in the future (Table A2.84). Although a reduction of truck transportation in favor of trains and pipelines is projected, its share will remain high until 2050 (40%-50% by the middle of the next century compared with 65% today).
Passenger transportation (both intercity and urban) will increase also severalfold. Within intercity transportation an increase in cars is projected (from 38% today to 60%-70% in the future) with a parallel reduction in buses (from 50% to about 20%). The growth rates for other modes will be less pronounced. Urban transportation will increase twofold to threefold. However, here some progress is expected for mass transit, its share increasing from 65% today to 75% in 2050. The use of private cars in urban transportation remains practically at the same level over the time horizon of the study.
In general, final energy demand for this sector will increase from 116 Mtoe today to 139 Mtoe in 2000 and 145-170 Mtoe in 2010 (Table A2.36). Further projections vary depending on the scenario adopted: in case of moderate efforts in energy conservation, we can expect that the growth will continue reaching 275 Mtoe in 2050 but with an enhanced efficiency improvements policy, this trend will break and the demand will slowly decline. The share of transportation in total final energy demand will decline from 28% currently to 17%-22% in the future. Household and service sector. Over the time horizon of the study, the number of dwellings will increase almost 2.5 times (Table A2.35). Progress in water-heating and electricity-use tech- nologies is anticipated. As a result, the useful demand for space heating will rise from 9 Mtoe in 1990 to 14-26 Mtoe in 2050. Demand for water heating will increase even more (from 6 Mtoe to about 50 Mtoe by the middle of the next century). Specific electricity consumption per dwelling will grow by a factor of two or three as compared with the current level.
High growth rates are also projected for the service sector which will result in a fivefold increase of the sector's building area, increasing thermal uses from 7 Mtoe today to 30-50 Mtoe in the future.
In total, final energy demand for the residential and commercial sectors will increase from 88 Mtoe in 1990 to 116 Mtoe in 2000 and further to 160-280 Mtoe in 2050. Over the whole time horizon of the study, the share of this sector will keep its present value of about 22%. Total final energy demand. Final energy demand in Latin America will increase 1.75-3 times until the middle of the next century (from 419 Mtoe in 1990 to 1,250 Mtoe in 2050 in
the Dynamics-as-Usual Scenario and 745 Mtoe in the Enhanced Efficiency and Conservation Scenario, Table A2.36). The share of substitutable fossil fuels will decrease from 50% today to 15%-30% in the long term, and the share of electricity will grow from 10% to 25%-30%. A slight decline in the share of motor fuel is projected: from 33% today to 24%-27% in 2050. The final energy/GNP intensity will decrease from 0.38 toe/$1,000 in 1990 to 0.11-0.18 toe/$l,000 by the middle of the next century.
3.1.7 Pacific Regiong
Population. The population of the region will more than double over the time horizon of the study, from 405 million in 1990 to about 965 million in 2050 (Table A2.37). This is the first reason for increases in final energy demand. Economic projections. The second reason for increases in final energy demand lies in the high GNP growth rate (about 3% per year over most of the time horizon of the study). As a result, GNP will increase more than five times. However, per capita GNP will still remain much lower than current levels for developed countries (even in the most Ubackward" of them). Total f inal energy demand. No sectoral analysis has been done for this region. A simple spreadsheet model was used for the evaluation of final energy demand.1° It is assumed that the energy/GNP elasticities will decrease from about 1.0 today to 0.93-0.95 in 2000 and further to 0.5-0.7 in 2050. Increase of the electricity share in final energy will bring a decline in the share of final energy in primary energy consumption (from 0.71 in 1990 to 0.65 in 2050). As concerns fuel types in final energy demand, we expect that the shares of solid and liquid fuels will steadily decline with a strong growth in shares of gaseous fuel, electricity, and direct use of renewables, primarily solar energy. As a result, it is expected that final energy demand will rise from 185 Mtoe in 1990 to 560-660 Mtoe in 2050. The share of electricity will grow to 37% (14% in 1990) and the share of fossil fuels (including noncommercial) will decline from 84% today to 48% by the middle of the next century of which more than half will be met by natural gas. The final energy/GNP ratio will decrease by a factor of two during the whole time horizon of the study.
3.1.8 North Af r i ca and the M i d d l e East"
Population. The region will be characterized by a large population growth which will result in increases from currently 218 million to 485-580 million in 2050 (Table A2.38). Economic projections. Long-term regional economic development assumes a steady economic growth rate of 3% per year, caused mainly by high revenues from continuing crude oil export and industrial development based on these incomes. GNP will increase almost six times compared with the current level (from $630 billion to $3,700 billion in 2050, Table A2.99). The per capita GNP level will be comparable with today's GNP in Eastern Europe or in the former Soviet Union although it will still be several times lower than the GNP in other industrialized countries. Product ion. As in other developing countries, the productive activity will be characterized by strong increases in the share of basic materials production and machinery. Both will lead to increases in find energy demand for productive purposes. As a result, final energy demand in this area will increase from 92 Mtoe to 390-580 Mtoe in 2050 and its share in total final energy demand will reach 61%-65% compared with 51% today. Transportat ion. A high level of economic activity and population growth will be followed by large expansions in transportation activities (Table A2.41). Freight transportation overhaul will grow by a factor of more than five. Large increases in train transportation within this
'The Pacific region includes Brunei, Hong Kong, Indonesia, South Korea, Malaysia, the Philippines, Thailand, Taiwan, and Papua New Guinea.
''Final energy demand is projected as a fraction of primary energy which is calculated by assuming some trends in the energy/GNP elasticity. The same approach was used also for China and other Asian CPCs.
"The region includes Algeria, Bahrain, Egypt, Iraq, Iran, Jordan, Kuwait, Lebanon, Libya, Oman, Qatar, Saudi Arabia, Syria, UAE, and North and South Yemen.

region are projected with a slight decline in the share of trucks and pipelines. However, severe climate and bad soil conditions in the area create tremendous difficulties in constructing a mass transportation infrastructure like railways. For this reason the share of railways in this region will remain lower than in other regions.
Passenger intercity transportation will increase from 436 billion pass-km in 1990 to 1,625- 2,320 billion pass-km. A further slight growth in the share of private cars for this purpose is anticipated. But the main improvements will be achieved by switching over to trains. This solution will result in much slower increases of final energy used for these purposes than for total transportation overhaul. Even much higher growth rates are expected for urban passenger transportation. However, the ratio between private cars and mass transit will remain a t constant levels.
Final energy demand for transportation will grow 2-3.5 times (from 63 Mtoe in 1990 to 120-225 Mtoe in 2050). Household a n d serv ice sector. The number of dwellings is projected to increase more than fourfold and the area for service sector buildings about fivefold (Table A2.42). As a result, thermal useful energy demand for domestic heating will rise from about 5 Mtoe in 1990 to 40-60 Mtoe in 2050 (Table A2.40). Electricity consumption in households for purposes other than thermal energy will increase from 490 k w h today to 1,800 k w h in the future (with large consumption for air conditioning). Total final energy demand for the residential and commercial sectors will rise from 25 Mtoe currently to 85-140 Mtoe in 2050. Especially high growth rates are projected for electricity, its share in final energy demand for these sectors will increase from about 12% today to 40%-55% by the middle of the next century. Total f inal energy demand. In general, total final energy demand will rise from 181 Mtoe in 1990 to 600-945 Mtoe in 2050, depending on the scenario (Table A2.43). The share of substitutable fossil fuels will decline from 43% to 20%-30% in 2050. The share of electricity will steadily increase reaching 18%-22% by the middle of the next century (only 6% in 1990). The share of motor fuel will decline from 38% today to 24%-27% in 2050, but motor fuel consumption a t the end of the time horizon of the study is projected to be two to four times higher than today. The availability of the region's fossil fuels resources a t low costs will slow down efforts in energy conservation, resulting in low improvements in the final energy/GNP ratio over the time horizon of the study as compared with other countries and regions. Final energy intensity will decline from 0.28 toe/$1,000 in 1990 to 0.16-0.22 toe/$1,000 by the middle of the next century.
3.1.9 China and Other Asian CPCs12
Populat ion. The countries in this region will remain on the top of the list of countries with the highest population growth rates over the time horizon of the study, 1990-2050. I t is assumed that the average population growth rate for China (its share in the region's population exceeds 90% today and will remain about the same until the middle of the next century) will be 0.6% per year. However, the growth rate for other Asian CPCs will be higher. The population of the region will increase from 1,225 million today to 1,775 million in 2050 (Table A2.44). Economic project ions. Large difficulties exist when trying to express the GNP of socialist countries in a form comparable to that of the West. In this study, assessments adopted by the Energy Modeling Forum Study are used.13 Per capita GNP will grow by a factor of about seven; however, in absolute terms it will still be lower than the present levels in Eastern Europe and the former Soviet Union.
"This region includes China, Mongolia, North Korea, and Vietnam. '=First-~ound Study Design for EMF 12 on Global Climate Change: Energy Sector Impacts of Greenhouse
Gas Emission Control Strategies, Energy Modeling Forum, Terman Engineering Center, Stanford University, December 28, 1990. These assessments are based on comparative analyses made by the CIA and the RAND Corporation. The adjustment of $1,990 to $1,980 was introduced to reach GNP levels that are comparable with other regions in the study. As concerns GNP growth rate assumptions, the recommendations of the EMF-12 were used again giving a tenfold increase in the GNP during 1990-2050.

Total final energy demand. As for the Pacific region, a simple model for final energy-demand assessment is used here. The projections are based on the following major assumptions: (a) energy/GNP elasticity will decline from 0.8 in 2000 to 0.63 for the Dynamics-as-Usual Scenario in 2050 and to 0.25 for the Enhanced Efficiency and Conservation Scenario in 2050; (b) the ratio of final energy to primary energy will change from 0.83 today to about 0.70 in 2050; (c) final energy mix will gradually change from coal dominance today to a more balanced structure, but coal will keep its leading position. According to the projections, regional final energy demand will increase at least three to four times compared with today's level reaching 1,925-2,870 Mtoe in 2050, of which about 90%-95% will belong to China alone. The electricity share will rise to 20%-25% (only 9% in 1990). Some 90% of today's final energy is met by fossil fuels (including noncommercial fuel), however, this share will decrease to 55%-60% until 2050. For the final energy projections, emphasis is put on the expanded utilization of renewable energy forms (e.g., soft solar, biomass, and geothermal); their contribution might increase from a negligible share today to 15%-20% in the long term.
The final energy/GNP ratio will decline dramatically: from 0.91 toe/$1,000 in 1990 to a bit less than half in the case of the Dynamics-as-Usual Scenario and to one-third in the Enhanced Efficiency and Conservation Scenario in 2050. The reductions will be possible only if large and broad-scale efforts in energy efficiency improvements are applied in the region.
3.1.10 Other Less Developed Countries14
Population. The region is characterized by very high population growth rates which will be a serious problem for social and economic progress in the long term. The population is expected to grow from 1,706 million today to 5,100 million in 2050 (Table A2.45). Such a tremendous growth means that about 50% of the world population will live in this region by the middle of the next century. Economic projections. Economic growth assumptions are based on recommendations of the Energy Modeling Forum. Growth rates are projected to be lower in this region than in China and other Asian CPCs because the region is less endowed with natural resources and includes many small and economically backward countries, which require a cautious approach to economic prospects. Meanwhile, the GNP will increase severalfold, reaching over $3,000 billion in 2050 compared with $695 million in the year 2000 (Table A2.46). Per capita GNP remains at a minimum over the whole period, increasing only slightly by a factor of two. This means that a rather high growth of GNP in the region will be substantially offset by the population expansion, and the gap between the richest and poorest will even increase in the future.
No major changes in the GNP structure are expected over the time horizon of the study. The share of the agricultural sector will remain very high compared with other regions with a growing share of the energy and services sectors. Production. Final energy demand for productive needs is projected to increase from 95 Mtoe in 1990 to 410-525 Mtoe in 2050 (Table A2.50). As a result of the industrialization process, which will not be completed during the time horizon of the study, the share in final energy of this sector will increase from only 19% today to 30%-33% in the future. Transportation. A manifold growth in the transportation sector is anticipated. Freight trans- portation will increase from 403 Gt-km currently to 2,600 Gt-km in the long term ( Table A2.48). Transportation demand will be caused by significant increases in the transport of bulky and heavy goods with very low costs per unit of weight or value, such as raw materials. As a result, transportation requirements in developing countries are assumed to be above 1 t-km per dollar of GNP with a slight decline in the future. However, this indicator in developed countries is kept several times lower, indicating the difference in quality of goods. Trucks will keep their leading position in freight overhaul. Passenger transportation, even with modest assumptions
"This region comprises the countries of Africa, south of the Sahara, and those in South and Southeast Asia not included in the previous sections.
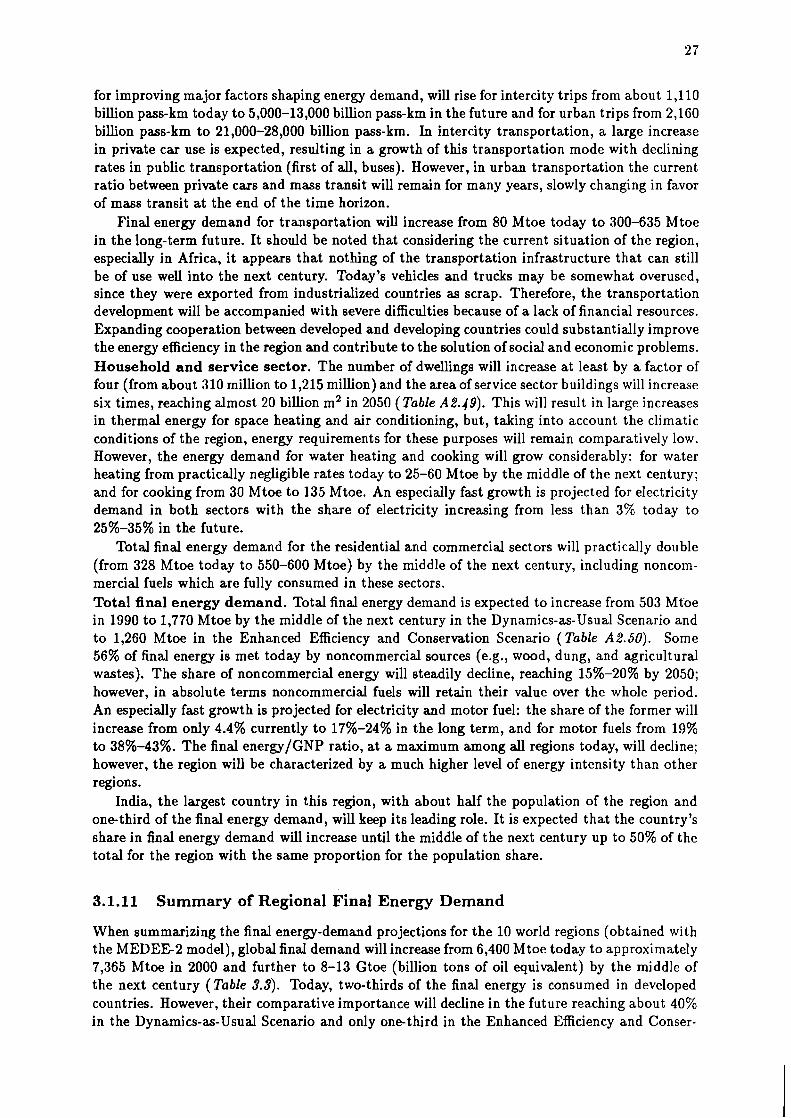
for improving major factors shaping energy demand, will rise for intercity trips from about 1,110 billion pass-km today to 5,000-13,000 billion pass-km in the future and for urban trips from 2,160 billion pass-km to 21,000-28,000 billion pass-km. In intercity transportation, a large increase in private car use is expected, resulting in a growth of this transportation mode with declining rates in public transportation (first of all, buses). However, in urban transportation the current ratio between private cars and mass transit will remain for many years, slowly changing in favor of mass transit a t the end of the time horizon.
Final energy demand for transportation will increase from 80 Mtoe today to 300-635 Mtoe in the long-term future. It should be noted that considering the current situation of the region, especially in Africa, it appears that nothing of the transportation infrastructure that can still be of use well into the next century. Today's vehicles and trucks may be somewhat overused, since they were exported from industrialized countries as scrap. Therefore, the transportation development will be accompanied with severe difficulties because of a lack of financial resources. Expanding cooperation between developed and developing countries could substantially improve the energy efficiency in the region and contribute to the solution of social and economic problems. Household a n d service sector. The number of dwellings will increase at least by a factor of four (from about 310 million to 1,215 million) and the area of service sector buildings will increase six times, reaching almost 20 billion m2 in 2050 ( Table A2.49). This will result in large increases in thermal energy for space heating and air conditioning, but, taking into account the climatic conditions of the region, energy requirements for these purposes will remain comparatively low. However, the energy demand for water heating and cooking will grow considerably: for water heating from practically negligible rates today to 25-60 Mtoe by the middle of the next century; and for cooking from 30 Mtoe to 135 Mtoe. An especially fast growth is projected for electricity demand in both sectors with the share of electricity increasing from less than 3% today to 25%-35% in the future.
Total final energy demand for the residential and commercial sectors will practically double (from 328 Mtoe today to 550-600 Mtoe) by the middle of the next century, including noncom- mercial fuels which are fully consumed in these sectors. Total f inal energy demand. Total final energy demand is expected to increase from 503 Mtoe in 1990 to 1,770 Mtoe by the middle of the next century in the Dynamics-as-Usual Scenario and to 1,260 Mtoe in the Enhanced Efficiency and Conservation Scenario ( Table A2.50). Some 56% of final energy is met today by noncommercial sources (e.g., wood, dung, and agricultural wastes). The share of noncommercial energy will steadily decline, reaching 15%-20% by 2050; however, in absolute terms noncommercial fuels will retain their value over the whole period. An especially fast growth is projected for electricity and motor fuel: the share of the former will increase from only 4.4% currently to 17%-24% in the long term, and for motor fuels from 19% to 38%-43%. The final energy/GNP ratio, at a maximum among all regions today, will decline; however, the region will be characterized by a much higher level of energy intensity than other regions.
India, the largest country in this region, with about half the population of the region and one-third of the final energy demand, will keep its leading role. It is expected that the country's share in final energy demand will increase until the middle of the next century up to 50% of the total for the region with the same proportion for the population share.
3.1.11 Summary of Regional Final Energy Demand
When summarizing the final energy-demand projections for the 10 world regions (obtained with the MEDEE2 model), global final demand will increase from 6,400 Mtoe today to approximately 7,365 Mtoe in 2000 and further to 8-13 Gtoe (billion tons of oil equivalent) by the middle of the next century ( Table 3.3). Today, two-thirds of the final energy is consumed in developed countries. However, their comparative importance will decline in the future reaching about 40% in the Dynamics-as-Usual Scenario and only one-third in the Enhanced Efficiency and Conser-

Table 3.3: F ind energy-demand projections by regions (Mtoe).
Enhanced Efficiency Enhanced Efficiency Dynamics- and Conservation Dynamics- and Conservation
as-Usual Accelerated Abate- as-Usual Accelerated Abate- Region 1980 1990 2000 Base Case (Al) ment Case (B3) Base Case (Al) ment Case (B3) North America, Ausrdia,
and New Zedand 1,567 1,702 Western Europe 1,045 1,165 Eastern Europe 264 2 74 Japan 257 305 Former USSR 812 1,010 Latin America 335 419 Pacific 140 185 North Africa and Middle East 124 181 China and other CPCs 423 660 Other LDCs 407 503
Total (rounded) 5,375 6,400 7,365 8,260 7,390 12,900 7,926

vation Scenario in 2050. Depending on the scenario applied, final energy demand in developed countries will either continue to rise by 25%, if moderate efforts in energy efficiency improve- ments are made, or decline by almost one-third compared with today's level if an enhanced conservation policy is implemented. A further growth in final energy for the developed countries is unlikely. In both scenarios the developing countries will occupy a major part of global final energy-demand growth and this will continue until the end of the next century.
The consequences of shifting the main stage of global energy problems from developed to developing countries should be evaluated well in advance to avoid new complications and tensions regarding energy resources and environmental degradations in the future.
3.2 Energy Conversion Sectors
3.2.1 Electricity Generation
The projections described below are based on results obtained by simulating energy conversion and primary energy production and trade with the LEAP model. The findings of MEDEE-2 for final energy demand and secondary energy forms are used as input data for the LEAP model, which are aggregated into three world regions: Japan, developed countries, and developing countries. For each scenario obtained with MEDEE model runs, three options within each scenario are evaluated with the LEAP model:
Dynamics-as-Usual Scenario, (A l ) Base Case, (A2) Nuclear Moratorium Case, and ( ~ 3 ) Supply-side Measure Case.
Enhanced Efficiency and Conservation Scenario, (B l ) Demand-side Measure Case, (B2) Nuclear Moratorium plus Demand-side Measure Case, and (B3) Accelerated Abatement Case.
In this section we concentrate on the two most illustrative of the six cases - the Base Case (A l ) and the Accelerated Abatement Case (B3) - for details on energy conversion and primary sources.
We start with a brief review of the projections for the electricity sector, then consider the situation expected of oil refineries, and finish with the evaluation of primary energy supply. The electricity sector will be one of the most dynamic in the future, and may serve as a bridge to solving many environmental and social problems of humanity. Japan. Electricity generation in Japan is projected to increase from about 800 TWh in 1990 to 1,000 TWh in 2000 and further to 1,020-1,115 TWh by the middle of the next century (Table 3.4). Per capita electricity consumption will rise from 6,575 k w h today to 8,500-9,200 k w h in the long term. The share of the electricity sector in primary energy demand will reach 50%-75% by 2050 compared with 41% currently. Large growth rates are anticipated for nuclear energy; its share in total electricity generation will increase from 23% in 1990 to 45%-50% in 2050 (and installed capacities from 16% to 25%-30%). Renewable sources in electricity generation will contribute about 20%-30% of electricity produced in the country by the middle of the next century as compared with 16% in 1990. In the long term only half of the electricity produced by renewable sources will be supplied from hydropower, the rest will have to be generated by new types of power plants and facilities (e.g., PV, geothermal, ocean). Therefore, the share of non-carbon sources of electricity will increase from less than 40% today to 70%-80% in the future. Developed countries (without Japan). Over the time horizon of the study, electricity generation in the region will practically double reaching 17,00&19,000 TWh in 2050 (8,300 TWh in 1990) (Table 3.5). This means that per capitaelectricity consumption will increase from 7,100 k w h to 11,000-13,000 kwh , which is still higher than the increase for Japan primarily because of differences in electricity consumption in households (e.g., larger houses and more lights). The share of nonfossil technologies in electricity generation will steadily increase, however, the rate of
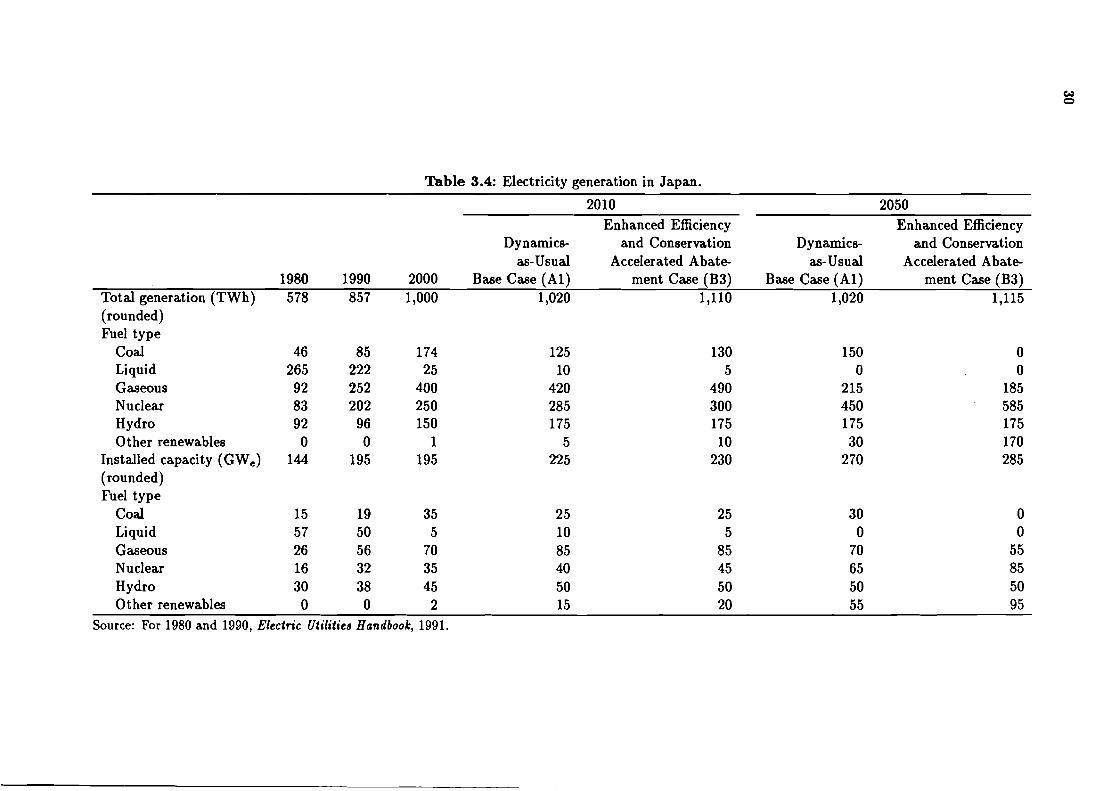
Table 3.4: Electricity generation in Japan.
2010 2050 Enhanced Efficiency Enhanced Efficiency
Dynamics- and Conservation Dynamics- and Conservation as-Usual Accelerated Abate- as-Usual Accelerated Abate-
1980 1990 2000 Base Case (Al) ment Case (B3) Base Case (Al) ment Case (B3) Total generation (TWh) 578 857 1,000 1,020 1,110 1,020 1,115 (rounded) Fuel type
Coal 46 85 174 125 130 150 0 Liquid 265 222 25 10 5 0 0 Gaseoue 92 252 400 420 490 215 185 Nuclear 83 202 250 285 300 450 585 Hydro 92 96 150 175 175 175 175 0 t her renewable6 0 0 1 5 10 30 170
Installed capacity (GW,) 144 195 195 225 230 2 70 285 (rounded) Fuel type
Coal 15 19 35 25 25 30 0 Liquid 5 7 50 5 10 5 0 0 Gaseous 26 56 70 85 85 70 55 Nuclear 16 32 35 40 45 65 85 Hydro 30 38 45 50 50 50 50 0 t her renewable6 0 0 2 15 20 55 95
Source: For 1980 and 1990, Electric Utilities Handbook, 1991.

'Ihble 3.5: Electricity generation in developed countries.
2010 2050 Enhanced Efficiency Enhanced Efficiency
Dynamics- and Conservation Dynamics- and Conservation as-Usual Accelerated Abate- as-Usual Accelerated Abate-
1980 1990 2000 Base Case (Al) ment Case (B3) Base Case (Al) ment Case (B3) Total generation (TWh) 6,380 8,300 10,215 11,930 11,340 18,800 16,785 (rounded) Fuel type
Coal Liquid Gaseous Nuclear Hydro Other renewables
Installed capacity (GW,) (rounded) Fuel type
Coal Liquid Gaseous Nuclear Hydro Other renewables

such a shift in electricity generation will strongly depend on the necessity to make these changes under the pressure of environmental and climatic constraints.
In the Accelerated Abatement Case, the share of nonfossil technologies will increase from 36% today to over 80% in the long term. An especially fast growth rate is expected for nuclear energy, which must contribute about 60% of all electricity generated in the region (today's level of nuclear energy is about 21%). A further growth is projected for gas-fired technologies (for base, intermediate, and peak load zones), of which the output will more than double until the end of the first quarter of the next century (and the share of this technology will increase from 20% today to about 30% over the time horizon of the study). Thereafter, however, in the Accelerated Abatement Case, fossil fuel modes of electricity production will decline to reach the goal of sustainable C 0 2 emissions in the middle of the next century. In this case the share of fossil fuel technologies will be about 20%, of which practically all will be met by natural gas- fired power plants (primarily combined-cycle and cogeneration). Strong reductions in coal-fired generating capacities will be required after 2010-2020, practically eliminating this technology by the middle of the next century because of its high carbon emissions.
In the Base Case, slow changes are expected with an increase in the share of nonfossil technologies of up to 45%, of which about 32% belongs to nuclear energy. In this case, the electricity produced by coal-fired power plants will double until 2050 and that by natural gas will even triple. Developing countries. In view of the total economic growth in less developed countries, where GNP will increase almost sevenfold over the next several decades, a strong growth in electricity demand is projected. It is expected that electricity demand will rise from 2,050 TWh in 1990 (only 18% of the current world electricity production) to about 20,000-30,000 TWh by the middle of the next century (50%-60% of the world total) (Table 8.6).
The share of fossil fuel power plants will steadily increase until 2010-2020 reaching 70%-75% (68% in 1990) in both scenarios. However, in the Dynamics-as-Usual Scenario with moderate efforts in energy conservation, it will then stabilize at this level until 2050. Especially strong growth is expected for coal-fired electricity; its share will rise from 16% today to 48% in 2050. The share of natural gas will also increase; however, its increase will be less than the increase for coal (from 15% to 24%), primarily because natural gas is not as available as coal in this region. In the Enhanced Efficiency and Conservation Scenario with accelerated abatement, the share of fossil fuels must be drastically reduced after 2020, reaching not more than 10% of which the main part is met by natural gas. In both the Base Case and the Accelerated Abatement Case we assume increases of the share of nonfossil energy sources, and especially in the latter case their contribution will reach approximately 90% in 2050. Obviously, pursuing this direction must be accompanied with tremendous efforts in not only implementing advanced technologies but also enlightening the people in the region on the global environmental peril. After all, this Accelerated Abatement Case may be seen as optimistic or even impossible; but it should be noted that this case was set as an extreme case to see what would be needed if an aggressive policy target of a 60% cut in global carbon emissions by the year 2050 is set and agreed on by nations. World. In total, world electricity generation will increase at an average growth rate of 2%-2.5% annually over the time horizon of the study, reaching 40,000-45,OOO TWh in 2050 (11,150 TWh in 1990) (Table 3.7). The structure of the generating technologies will strongly depend on the scenario applied. It is expected that in the Base Case, renewable energy technologies could contribute not more than one-third of the electricity required by the middle of the next century. On the other hand, C 0 2 emission constraints in the Accelerated Abatement Case will not allow for more than 10% of fossil fuel use, of which most will be based on natural gas. Therefore, the difference (about 55%) should .be met with non-carbon technologies (e.g., nuclear or renewable sources). Of course, the changes are much less for the Dynamics-=-Usual Scenario, in which the share of non-carbon technologies will increase only to one-third until 2050 (with only 15% coming from renewable sources).

Table 3.6: Electricity generation in developing countries.
2010 2050 Enhanced Efficiency Enhanced Efficiency
Dynamics- and Conservation Dynamics- and Conservation as-Usual Accelerated Abate- as-Usual Accelerated Abate-
1980 1990 2000 Base Case (Al) ment Case (B3) Base Case (Al) ment Case (B3) Total generation (TWh) 1,078 2,050 3,015 5,500 4,500 19,300 27,000 (rounded) Fuel type
Coal Liquid Gaseous Nuclear Hydro Other renewable8
Installed capacity (GW,) (rounded) Fuel type
Coal Liquid Gaseous Nuclear Hydro Other renewables

Table 3.7: Electricity generation projections for the world.
2010 2050 Enhanced Efficiency Enhanced Efficiency
Dynamics- and Conservation Dynamics- and Conservation as-Usual Accelerated Abate- as-Usual Accelerated Abate-
1980 1990 2000 Base Case (A l ) ment Case (B3) Base Case ( A l ) ment Case (B3) Total generation (TWh) 8,042 11,152 14,230 18,450 16,880 39,120 44,900 (rounded) Fuel type
Coal 2,601 3,303 4,504 6,760 5,390 14,605 1,160 Liquid 1,939 1,716 1,115 660 555 505 130 Gaseous 1,192 2,257 3,860 5,460 5,095 10,205 5,370 Nuclear 706 1,994 2,500 2,960 3,070 8,450 22,660 Hydro 1,604 1,842 2,105 2,300 2,360 3,215 4,150 0 ther renewable5 0 40 146 310 410 2,140 11,430

3.2.2 Crude Oil Refineries
Although the share of liquid fuels in the world energy balance is constantly declining, the supply and demand of this fossil fuel remains important for the world community, as a whole, and for individual regions or nations, in particular (Table 3.8). Japan. The requirements for liquid fuels in Japan in all scenarios will steadily decline, reaching 50%-60% of the current level by the middle of the next century. Efficiency improvements and substitutions will play a leading role in this process. The consumption of liquid fuels for non- energy needs (e.g., petrochemical products and lubricants) will dominate in the future, with a reduction in the share of motor fuel and fuel oil. Developed countries. Approximately the same trends are observed in all developed counties, although less pronounced. The share of motor fuel, which now dominates in the oil products, will rise from 54% currently to about 75%-80% in 2050. The fuel oil share will decrease to 5%-7% (33% in 1990). Petrochemicals will remain approximately at the same level. Developing countries. Until the end of the first quarter of the next century, the volumes of crude oil refined will steadily increase reaching 1,245-1,560 Mtoe in 2010 compared to 1,025 Mtoe at the beginning of the 1990s. However, the future trends will depend on the scenario applied. In the Dynamics-as-Usual Scenario, this growth will continue and refining will reach 2,560 Mtoe (practically two and a half times more than today's share). In the Enhanced Efficiency and Conservation Scenario with accelerated COz abatement, a decline in oil processing is projected after reaching its maximum during the period 2010-2020. With respect to the product mixture, motor fuel will steadily increase in importance (from 39% today to 70% in 2050). The share of petrochemicals will more than double by 2050. However, the share of fuel oil will decline from 53% currently to 7%-20% in 2050.
3.3 Primary Energy Supply
Until recently, fossil fuel resources and their availability were considered the main factor in long- term energy strategies at national and international levels. Today, however, when the decisive role for shaping energy development belongs to energy savings and conservation as well as to en- vironmental implications, resource availability no longer plays the same role. Energy-production costs are of much greater importance now than the absolute amount of energy resources because in the long term only relatively cheap deposits of fossil fuels or potential renewable energies will be of practical interest (i.e., only this part of the resources will be capable of competing with ever-expanding achievements in energy savings).15 For the time being, progress in energy pro- duction will result in higher extraction rates. Therefore, with some probability the resource base for some definite cost categories will even expand in the future. The other factor assumes that for the long term we must base our conclusions on resources instead of reserves. At the same time, i t is important to introduce a probability scale for the transformation process of resources into reserves. In the scenarios, these two factors (cost categories for fossil fuel production and probability of new discoveries) are the basic assumptions for primary energy production.16
3.3.1 Crude Oil
Crude oil recoverable resources are assessed to be more than 500 Gt (billion tons), with discovered reserves of 126 Gt (Table 3.9).17 About 50% of world conventional crude oil resources are
"Moreover, in reality there exists a clear reverse interdependence between the volume of the deposit and the cost of resource extraction with all other factors being equal.
"For simplicity, this study contains only average expected values for energy resources with a 50% probability of their discovery. However, in some places (e.g., deep shelves or Arctic seas) these estimates seem too optimistic.
"There are also much lower estimates of crude oil resources, for example, Masters, Root, and Attanasi give only 200 Gt for total crude oil resources without losses at recovery [C.D. Masters, D.H. Root, and E.D. Attanasi (1990), World Oil and Gas Resources: Future Production Realities, Annual Review of Energy 15:23-511. W.

I'able 3.8: Crude oil refinery products and losses by regions.
2010 2050 Enhanced Efficiency Enhanced Efficiency
Dynamics- and Conservation Dynamics- and Conservation as-Usual Accelerated Abate- as-Usual Accelerated Abate-
Region 1980 1990 2000 Base Case (Al) ment Case (B3) Base Case (Al) ment Case (B3) J a p a n Crude oil refined (Mtoe) 218 220 225 210 190 145 85 Refinery losses (%)O 6 6 6 6 6 8 8 Refinery products (%) 100 100 100 100 100 100 100
Motor fuel 3 1 36 43 42 41 38 20 Fuel oil 36 24 13 12 12 4 0 Petrochemicals 33 40 44 4 6 47 58 80
Developed countries Crude oil refined (Mtoe) 2,050 2,030 2,000 1,875 Refinery losses (%)O 6 6 7 7 Refinery products (%) 100 100 100 100
Motor fuel 51 54 57 63 Fuel oil 37 33 28 22 Petrochemicals 12 13 15 15
Developing countries Crude oil refined (Mtoe) 702 1,025 1,250 1,560 1,245 2,560 1,120 Refinery losses (%)O 10 10 10 10 10 10 10 Refinery products (%) 100 100 100 100 100 100 100
Motor fuel 3 7 39 43 51 47 69 68 Fuel oil 55 53 49 40 41 20 7 Petrochemicals 8 8 8 9 12 11 25
'Including own consumption.

Table 3.9: World crude oil reserves and resources by cost category (Gt).
Production costs Proven $/bbl ($/toe) reserves Less than $4/bbl ($30/toe) 70 $4-$12/bb1 ($30-$85/toe) 15 $12-$20/bbl ($85-$140/toe) 10 $20-$30/bb1 ($141-$22O/toe) Over $30/bbl ($220/toe)
Total 95
Undiscovered resources or new basins Conventional Service Deep shelf and Unconven-
oil production Arctic seas tional oil Total
resources
Source: P.-H. Bourrelier, X.B. de la Tour, and J.-J. Lacour, L'Energie a long terme: mobilization ou laissez-fair? Revue de I'Energie, 418:81-117, February 1990.
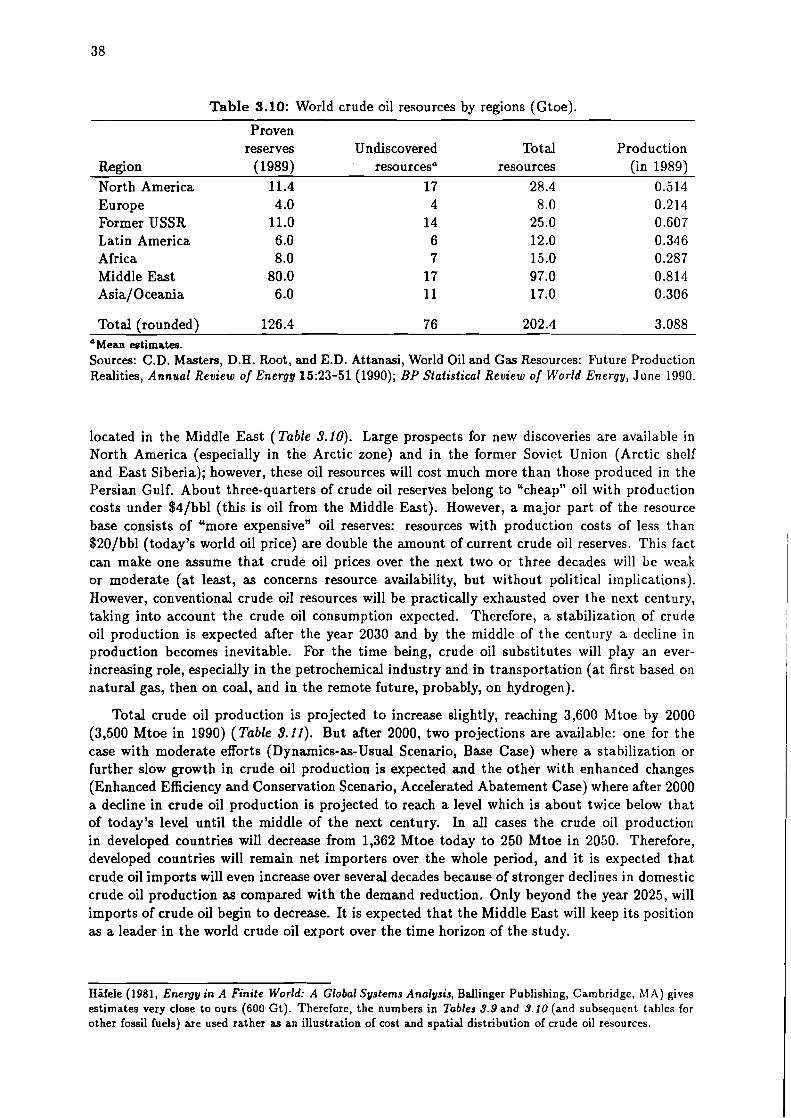
Table 3.10: World crude oil resources by regions (Gtoe).
Proven reserves Undiscovered Total Production
Region (1989) resourcesa resources (in 1989) North America 11.4 17 28.4 0.514 Europe 4.0 4 8.0 0.214 Former USSR 11.0 14 25.0 0.607 Latin America 6.0 6 12.0 0.346 Africa 8.0 7 15.0 0.287 Middle East 80.0 17 97.0 0.814 Asia/Oceania 6.0 11 17.0 0.306
Total (rounded) 126.4 76 202.4 3.088 OMean estimates. Sources: C.D. Masters, D.H. Root, and E.D. Attanasi, World Oil and Gas Resources: Future Production Realities, Annual Review of Energy 15:23-51 (1990); BP Statistical Review of World Energy, June 1990.
located in the Middle East (Table 3.10). Large prospects for new discoveries are availa.ble in North America (especially in the Arctic zone) and in the former Soviet Union (Arctic shelf and East Siberia); however, these oil resources will cost much more than those produced in the Persian Gulf. About three-quarters of crude oil reserves belong to LLcheap" oil with production costs under $4/bbl (this is oil from the Middle East). However, a major part of the resource base consists of "more expensive" oil reserves: resources with production costs of less than $20/bbl (today's world oil price) are double the amount of current crude oil reserves. This fact can make one assume that crude oil prices over the next two or three decades will be weak or moderate (at least, as concerns resource availability, but without political implications). However, conventional crude oil resources will be practically exhausted over the next century, taking into account the crude oil consumption expected. Therefore, a stabilization of crude oil production is expected after the year 2030 and by the middle of the century a decline in production becomes inevitable. For the time being, crude oil substitutes will play an ever- increasing role, especially in the petrochemical industry and in transportation (at first based on natural gas, then on coal, and in the remote future, probably, on hydrogen).
Total crude oil production is projected to increase slightly, reaching 3,600 Mtoe by 2000 (3,500 Mtoe in 1990) (Table 3.11). But after 2000, two projections are available: one for the case with moderate efforts (Dynamics-as-Usual Scenario, Base Case) where a stabilization or further slow growth in crude oil production is expected and the other with enhanced changes (Enhanced Efficiency and Conservation Scenario, Accelerated Abatement Case) where after 2000 a decline in crude oil production is projected to reach a level which is about twice below that of today's level until the middle of the next century. In all cases the crude oil production in developed countries will decrease from 1,362 Mtoe today to 250 Mtoe in 2050. Therefore, developed countries will remain net importers over the whole period, and it is expected that crude oil imports will even increase over several decades because of stronger declines in domestic crude oil production as compared with the demand reduction. Only beyond the year 2025, will imports of crude oil begin to decrease. It is expected that the Middle East will keep its position as a leader in the world crude oil export over the time horizon of the study.
Hifele (1981, Energy in A Finite World: A Global Systems Analysis, Ballinger Publishing, Cambridge, MA) gives estimates very close to ours (600 Gt). Therefore, the numbers in Tables 3.9 and 3.10 (and subsequent tables for other fossil fuels) are used rather as an illustration of cost and spatial distribution of crude oil resources.

Table 3.11: World crude oil production and trade (Mtoe).
2010 2050 Enhanced Efficiency Enhanced Efficiency
Dynamics- and Conservation Dynamics- and Conservation as-Usual Accelerated Abate- as-Usual Accelerated Abate-
Region 1980 1990 2000 Base Case (Al) ment Case (B3) Base Case (Al) ment Case (B3) Japan Domestic production 0 0 0 0 0 0 0 Import (+)/export (-) +239 +225 +215 +200 +I85 +I10 +75 Domestic demand 239 225 2 15 200 185 110 75
Developed countries Domestic production 1,332 1,362 1,000 800 Import (+)/export (-) +801 +795 +1,030 + 1,030 Domestic demand 2,133 2,157 2,030 1,830
Developing countries Domestic production 1,820 2,140 2,600 2,950 Import (+)/export (-) -1,040 -1,020 -1,245 -1,230 Domestic demand 780 1,120 1,355 1,720
World production 3,150 3,500 3,600 3,750 3,200 4,020 1,950 (rounded)

Table 3.12: World natural gas reserves and resources by cost category (1012 m3).
Undiscovered resources Production costs Proven Unconventional Deep shelf and Unconventional ($1 1,000 m3) reserves gas Arctic sea gas Total
Less than $25 50 25 75
Over $1 75 75 8 5 160 Total 100 200 110 8 5 495
Source: P.H. Bourrelier, X.B. de la Tour, and J.-J. Lacour, op. cit.
Table 3.13: World conventional natural gas resources by region (1012m3).
Proven reserves Undiscovered Total Production
Region (1989) resourcesa resources (in 1989) North America 10.4 22 32.4 0.664 Europe 6.8 Former USSR 41.0 Latin America 6.9 Africa 5.8 Middle East 35.3 AsiaIOceania 8.1
Total (rounded) 114.3 148 262.3 2.166 -
ahfeu estimates. Sources: C.D. Masters, D.H. Root, E.D. Attanasi, World Oil and Gas Resources, op. cit.; BP Statistical Review of World Energy, June 1990.
3.3.2 Natural Gas
Several years ago an intense discussion on global methane resources started in connection with the hypothesis of the abiogenic origin of natural resources.18 However, this hypothesis received strong criticism and remains unproven. Therefore, we do not consider "deep gas" a fossil fuel resource of the future. The conventional resources of natural gas are quite comparable with those of crude oil ( Tables 3.12 and 3.13).19 About one-third of the total natural gas resources are located in the former Soviet Union and slightly less in the Persian Gulf region (according to current estimates, both regions possess more than half of the global conventional natural gas resources). However, again as in the case of crude oil, natural gas resources will be exhausted over the next 100-150 years (or even earlier), taking into account the expected increases in natural gas production because of its superiority of environmental impacts to the other fuels. As a consequence of such a policy, a decline in conventional natural gas production is anticipated after 2030.
''According to T. Gold (1987, Power from the Earth, Dent, London), virtually limitless volumes of hydrocar- bons, mainly methane, are trapped in high-pressure geological zones deep in the earth.
"A strong growth of natural gas reserves has been observed in the past few decades. This was at a time when practically no explorations for this resources were undertaken: almost all new natural gas deposits have been discovered while exploring for crude oil. If in the 1950s the crude oil/natural gas ratio, measured in terms of reserves, were equal to 2:1, then today the reserves are practically equal. It is expected that natural gas reserves will surpass those for conventional crude oil in the near future.

Table 3.14: Unconventional methane estimates for the USA. Resources Less than 105 Less than 205 (1012 m3) ($/1,000 m3)" ($/1,000 m3)"
Eastern shales 1-17 0.3 1 .O Western bituminous sands 5-17 1.5 5.0 Coal mine methane 1.5-70 0.2 10.0 Geopressure zones 85-2800 4.5
OAt production costs with existing technology. Sources: G.J. MixDonald (1990), The Future of Methane as an Energy Resources. Annual Review of Energy 15:53-83; Energy Res. Dev. Admin. (1977), Market-Oriented Planning Study, Washington, DC; US DOE (1988), An Assessment of the Natuml Gas Resource Base of the United States, DOE/W/31109-HI, Government Printing Office, Washington, DC.
As concerns the production costs, 80% of natural gas reserves belong to the category of "cheap" gas which is produced today with costs of less than $65/1,000 m3 (current prices for natural gas on the international markets are $70-$90/1,000 m3). Large enough are also "cheap" natural gas resources which are comparable to those for reserves. However, two-thirds of the resources are concentrated in the more expensive categories with production costs of less than $175/1,000 m3 (or $30/bbl).
In the long term, the unconventional natural gas resources will be of real interest (coal seams, Devonian shales, tight sands, geopressurized aquifers, gas hydrates). There are no accurate estimates, but some claim that these resources are enormous. For example, the estimates for unconventional natural gas in the United States are given in Table 3.14. Much higher are the resources for methane hydrates. According to Chersky et al. (1985), the permafrost zone in the former Soviet Union alone contains about 750 trillion m3 of methane which is three times the total resources of conventional natural gas in this country.20 For the world as a whole, methane hydrates resources are concentrated in zones with a stable state and are approximately equal to 20,000-21,000 trillion m3 or several orders of magnitude higher than that for conventional natural gas resource^.^' The production of natural gas from methane hydrate resources is too expensive with present technologies. However, with time and the exhaustion of cheap natural gas resources, new methods for producing natural gas from these huge resources will be found.22
A further strong growth in natural gas production and international trade is anticipated (Table 3.15). The production will increase from about 2,000 billion m3 in 1990 to 2,700 billion m3 in the year 2000 and further to 3,000-3,600 billion m3 in 2010. If no stringent measures in energy conservation are implemented, then a further strong growth will be inevitable, practically more than doubling current levels by 2050. However, efficiency improvements in parallel with enhanced energy system restructuring might result in decreasing production growth rates and even a decline in production (however, this decline will be much lower than the decline for other fossil fuels because of much higher environmental benefits from using natural gas instead of solid or liquid fuels). Natural gas interregional trade is projected to increase 2.5-4.5 times, reaching 370-680 billion m3 per year compared with about 145 billion m3 today. It is expected that this expansion will be achieved by the further development of dry gas supply systems using pipeline technologies and by liquefied natural gas transportation in liquefied natural gas (LNG) tankers.
'ON. Chersky, V. Tsarev, and S. Nikitin (1985), Investigation and Prediction of Conditions of Accumulation of Gas Resources on Gas-Hydrate Pools, Petroleum Geology 21:65-89.
"See, for example, G.J. MacDonald (1990), The Future of Methane as an Energy Resource, Annual Review of Energy 21:53-83.
"On the technology for natural gas production from methane hydrate see, for example, P. McGuire (1981), Methane Hydmte Gas Production: An Assessment of Conventional Production Technology as Applied to Hydrate Gas Recovery, Los Alamos Sci. Lab. Rep. LA-91-MS, Los Alamos, NM; G. Holder, V. Kamath, and S. Godbole (1984), The Potential of Natural Gas Hydrate as an Energy Resource, Annual Review of Energy 9:427-45; J . Bockris (1980), Energy Options, Halsted , New York, NY.

Table 3.15: World natural gas production and trade (billion m3).
2010 2050 Enhanced Efficiency Enhanced Efficiency
Dynamics- and Conservation Dynamics- and Conservation as-Usual Accelerated Abate- as-Usual Accelerated Abate-
Region 1980 1990 2000 Base Case (A l ) ment Case (B3) Base Case (A l ) ment Case (B3) Japan Domestic production 2.5 2.5 2.5 1.5 1.5 0.5 0.5 Import (+)/export (-) +36.0 +83.0 +125.0 +130.0 +130.0 +105.0 +90.0 Domestic demand 38.5 85.5 127.5 131.5 131.5 105.5 90.5
Developed countries Domestic production 1,310 1,705 2,160 2,470 Import (+)/export (-) 0 +35 +60 + 130 Domestic demand 1,310 1,740 2,220 2,600
Developing countries Domestic production 120 280 515 1,155 Import (+)/export (-) -36 -118 -180 -260 Domestic demand 84 162 335 895
World production 1,430 1,985 2,675 3,625 (rounded)
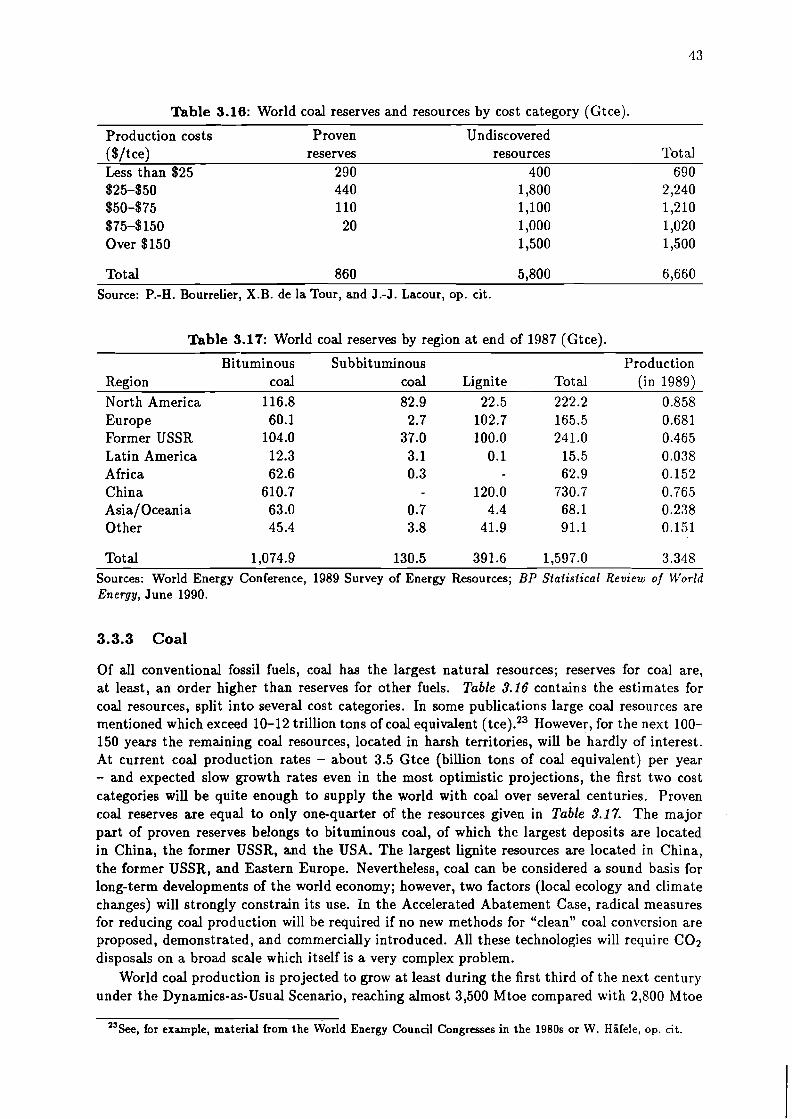
Table 3.16: World coal reserves and resources by cost category (Gtce).
Production costs Proven Undiscovered ($/tee) reserves resources Total Less than $25 290 400 690 $25-$50 $50-$75 $ 7 5 4 150 Over $150
Total 860 5,800 6,660 Source: P.-H. Bourrelier, X.B. de la Tour, and J.-J. Lacour, op. cit.
Table 3.17: World coal reserves by region at end of 1987 (Gtce).
Bituminous Subbituminous Production Region coal coal Lignite Tot a1 (in 1989) North America Europe Former USSR Latin America Africa China Asia/ Oceania 0 t her
Total 1,074.9 130.5 391.6 1,597.0 3.348 Sources: World Energy Conference, 1989 Survey of Energy Resources; BP Statistical Review of World Energy, June 1990.
3.3.3 Coal
Of all conventional fossil fuels, coal has the largest natural resources; reserves for coal are, at least, an order higher than reserves for other fuels. Table 3.16 contains the estimates for coal resources, split into several cost categories. In some publications large coal resources are mentioned which exceed 10-12 trillion tons of coal equivalent ( t ~ e ) . ~ ~ However, for the next 100- 150 years the remaining coal resources, located in harsh territories, will be hardly of interest. At current coal production rates - about 3.5 Gtce (billion tons of coal equivalent) per year - and expected slow growth rates even in the most optimistic projections, the first two cost categories will be quite enough to supply the world with coal over several centuries. Proven coal reserves are equal to only one-quarter of the resources given in Table 3.17. The major part of proven reserves belongs to bituminous coal, of which the largest deposits are located in China, the former USSR, and the USA. The largest lignite resources are located in China, the former USSR, and Eastern Europe. Nevertheless, coal can be considered a sound basis for long-term developments of the world economy; however, two factors (local ecology and climate changes) will strongly constrain its use. In the Accelerated Abatement Case, radical measures for reducing coal production will be required if no new methods for "clean" coal conversion are proposed, demonstrated, and commercially introduced. All these technologies will require C 0 2 disposals on a broad scale which itself is a very complex problem.
World coal production is projected to grow at least during the first third of the next century under the Dynamics-as-Usual Scenario, reaching almost 3,500 Mtoe compared with 2,800 Mtoe
23See, for example, material from the World Energy Council Congresses in the 1980s or W. Hifele, op. cit.
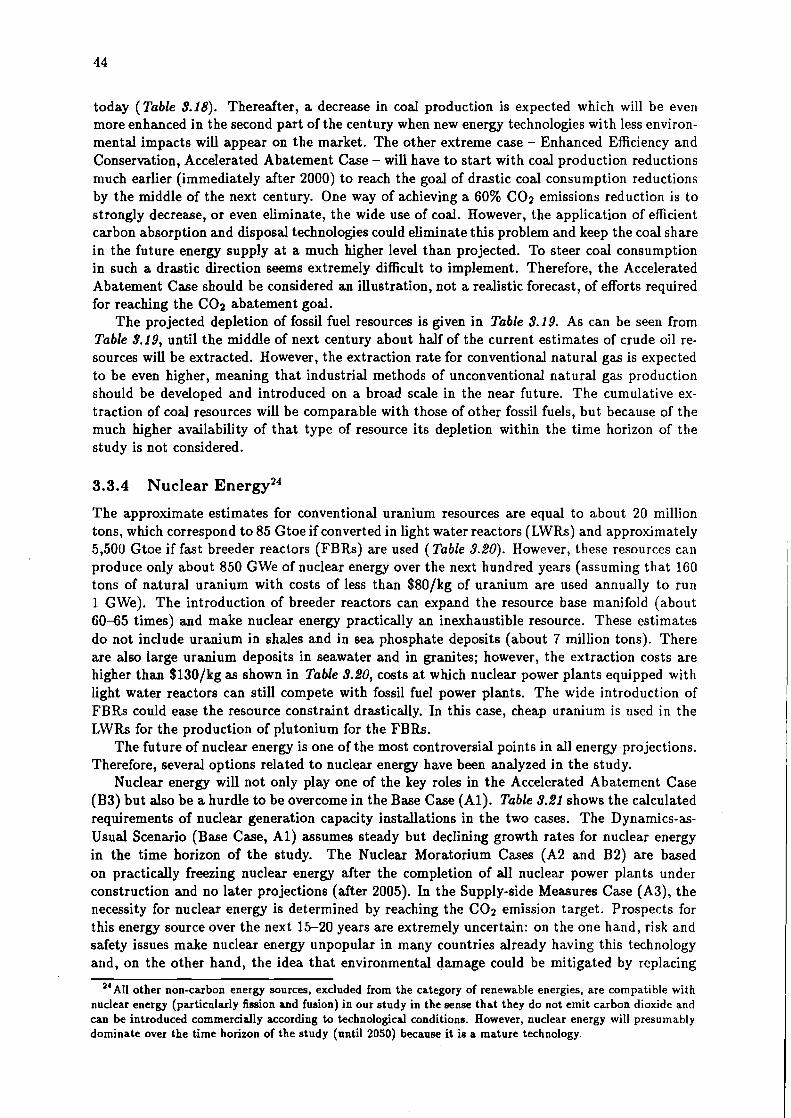
today (Table 8.18). Thereafter, a decrease in coal production is expected which will be even more enhanced in the second part of the century when new energy technologies with less environ- mental impacts will appear on the market. The other extreme case - Enhanced Efficiency and Conservation, Accelerated Abatement Case - will have to start with coal production reductions much earlier (immediately after 2000) to reach the goal of drastic coal consumption reductions by the middle of the next century. One way of achieving a 60% C 0 2 emissions reduction is to strongly decrease, or even eliminate, the wide use of coal. However, the application of efficient carbon absorption and disposal technologies could eliminate this problem and keep the coal share in the future energy supply at a much higher level than projected. To steer coal consumption in such a drastic direction seems extremely difficult to implement. Therefore, the Accelerated Abatement Case should be considered an illustration, not a realistic forecast, of efforts required for reaching the COz abatement goal.
The projected depletion of fossil fuel resources is given in Table 9.19. As can be seen from Table 8.19, until the middle of next century about half of the current estimates of crude oil re- sources will be extracted. However, the extraction rate for conventional natural gas is expected to be even higher, meaning that industrial methods of unconventional natural gas production should be developed and introduced on a broad scale in the near future. The cumulative ex- traction of coal resources will be comparable with those of other fossil fuels, but because of the much higher availability of that type of resource its depletion within the time horizon of the study is not considered.
3.3.4 Nuclear Energy24
The approximate estimates for conventional uranium resources are equal to about 20 million tons, which correspond to 85 Gtoe if converted in light water reactors (LWRs) and approximately 5,500 Gtoe if fast breeder reactors (FBRs) are used (Table 3.20). However, these resources can produce only about 850 GWe of nuclear energy over the next hundred years (assuming that 160 tons of natural uranium with costs of less than $80/kg of uranium are used annually to run 1 GWe). The introduction of breeder reactors can expand the resource base manifold (about 60-65 times) and make nuclear energy practically an inexhaustible resource. These estimates do not include uranium in shales and in sea phosphate deposits (about 7 million tons). There are also large uranium deposits in seawater and in granites; however, the extraction costs are higher than $130/kg as shown in Table 8.20, costs at which nuclear power plants equipped with light water reactors can still compete with fossil fuel power plants. The wide introduction of FBRs could ease the resource constraint drastically. In this case, cheap uranium is used in the LWRs for the production of plutonium for the FBRs.
The future of nuclear energy is one of the most controversial points in all energy projections. Therefore, several options related to nuclear energy have been analyzed in the study.
Nuclear energy will not only play one of the key roles in the Accelerated Abatement Case (B3) but also be a hurdle to be overcome in the Base Case (Al). Table 8.21 shows the calculated requirements of nuclear generation capacity installations in the two cases. The Dynamics-as- Usual Scenario (Base Case, A l ) assumes steady but declining growth rates for nuclear energy in the time horizon of the study. The Nuclear Moratorium Cases (A2 and B2) are based on practically freezing nuclear energy after the completion of all nuclear power plants under construction and no later projections (after 2005). In the Supply-side Measures Case (A3), the necessity for nuclear energy is determined by reaching the C 0 2 emission target. Prospects for this energy source over the next 15-20 years are extremely uncertain: on the one hand, risk and safety issues make nuclear energy unpopular in many countries already having this technology and, on the other hand, the idea that environmental damage could be mitigated by replacing
2 ' ~ 1 1 other non-carbon energy sources, excluded from the category of renewable energies, are compatible with nuclear energy (particularly fission and fusion) in our study in the sense that they do not emit carbon dioxide and can be introduced commercially according to technological conditions. However, nuclear energy will presumably dominate over the time horizon of the study (until 2050) because it is a mature technology.
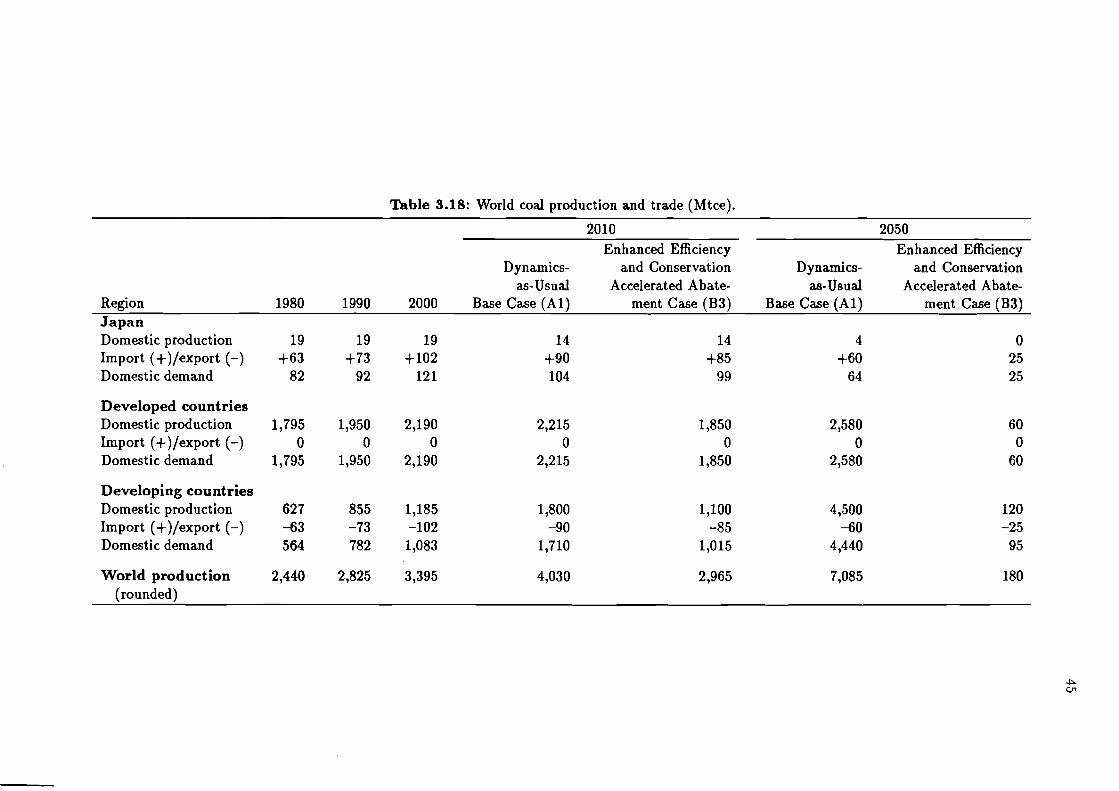
Table 3.18: World coal production and trade (Mtce).
2010 Enhanced Efficiency
Dynamics- and Conservation as-Usual Accelerated Abate-
Region 1980 1990 2000 Base Case (A l ) ment Case (B3) Japan Domestic production 19 19 19 Import (+)/export (-) +63 +73 +lo2 Domestic demand 82 92 121
Developed countries Domestic production 1,795 1,950 2,190 2,215 Import (+)/export (-) 0 0 0 0 Domestic demand 1,795 1,950 2,190 2,215
Developing countries Domestic production 62 7 855 1,185 1,800 Import (+)/export (-) -63 -73 -102 -90 Domestic demand 564 782 1,083 1,710
Enhanced Efficiency Dynamics- and Conservation
a-Usual Accelerated Abate- Base Case (Al) ment Case (B3)
World production 2,440 2,825 3,395 4,030 2,965 7,085 180 (rounded)

Table 3.19: Extraction of fossil fuel resources between 1990 and 2050. Coal Oil Natural gas
Scenario (Gtce) (Gt) (trillion m3) Dynamics-as-Usual Scenario
Base Case Nuclear Moratorium Supply-side Measures Case
Enhanced Efficiency a n d Conservation Scenario Base Case 215 180 205 Nuclear Moratorium plus Demand-side Measures Case 230 190 2 15 Accelerated Con abatement 150 150 160
Note: Fossil fuel recoverable resources are as follows: coal (<$75/t) 3,000 Gtce; oil (<$30/bbl) 380 Gt; and natural gas (<$30/bbl) 295 trillion m3. Source: P.-H. Bourrelier, X.B. de la Tour, and J .-J. Lacour, op. cit.
Table 3.20: World uranium resources (lo3 tons).
Production costs Proven Undiscovered
($/kg U) reserves resources $25-$40 8 5 355
Total (rounded) 2,465 18,885 Source: P.-H. Bourrelier, X.B. de la Tour, and J.-J. Lacour, op.
Table 3.21: Nuclear installation requirements (GWe).
Case 1980 1990 2000 2010 2050 World
A1 135 327 385 44 0 1,210 B3 - - - 460 3,235
Developed countries A1 133 310 355 400 B 3 - - - 415
Developing countries A1 2 17 30 40 305 B3 - - - 45 1,795
Average annual increment, 2010-2050 (including replacements), GWe/yr Base Case (Al) 30 Accelerated Abatement Case (B3) 8 0
Approximately 20 GWe/yr in the 1980s 31 GWe/yr only in 1985
fossil fuels, especially coal, with nuclear energy becomes more and more popular. In all scenarios without limits for nuclear energy, the share of this energy will increase from 5.4% in 1990 to 6.3% in 2000 and 6.3%-8% in 2010. However, the development of nuclear energy after 2010 will depend on improvements made in the technology and the recognition that nuclear energy is an alternative to reduce the risk of global warming: by 2050 the share of nuclear energy in total energy demand may rise slowly to 11% (Base Case, A l ) or even to more than one-third if constraints on C 0 2 emissions are imposed to achieve a 60% C 0 2 emission reduction (B3) by 2050. Total installed capacity of nuclear power plants will have to increase from 318 GWe today to almost 400 GWe in 2000 and 1,200-3,200 GWe in 2050.
In case A l , the required average annual increments of nuclear generation capacity is approx- imately 30 GWe worldwide, while it is roughly 80 GWe in case B3. In case B3 the generation capacity has to be larger in the developing regions than in the developed regions. The average nuclear generating growth in the 1980s was approximately 20 GWe per year globally, which had a peak year in 1985 when 31 GWe of nuclear power plants started their operations, for the first time and the last to exceed 30 GWe. To achieve the Base Case the maximum construction capability of current nuclear industries must be maintained for many years. However, for the Accelerated Abatement Case, the installation requirements of about 80 GWe per year ma,y be difficult to fulfill without a comprehensive revitalization of the world's nuclear industry, possi- bly with some sorts of advanced nuclear reactors which would allow, for example, continuous production in factories.
The extended utilization of projected nuclear installation requirements for the two cases (A1 and B3), as shown in Table 3.21, will result in a large contribution to the total energy supply in developing countries. The share of this region in today's nuclear-installed capacity is less than 6%; it will reach 7% in 2000, 25% in case A1 in 2050, and 60% in case B3 in 2050.
In addition to a revitalization of the nuclear plant construction industries, there will bc several prerequisites for nuclear power in creating environmentally sound energy systems:
Completion of the nuclear fuel cycle, in which reprocessing and waste disposal should be of crucial importance.
Issues related to plutonium utilization, especially nonproliferation and safeguards.
Advanced concepts and measures to improve safety and reliability of existing and planned reactors.
3.3.5 Renewable Energy Sources
There have been several discussions on the role renewable energy resources could play in solving global warming and environmental deterioration^.^^ Estimating the energy potential of these resources is not an easy task because only very rough assessments are available, requiring many initial assumptions on the pros and cons. Therefore, these estimates demand a cautious inter- pretation. Table 3.22 contains a summary of the global potential of renewable energy resources. According to these very speculative and conservative estimates, the global realizable potential is equal to a minimum of 11-15 Gtoe per year, i.e., about twice as much as current world primary energy consumption.26
Technical solutions using renewable energy resources known today could physically (or the- oretically) supply practically all energy consumers with the required quantities and qualities
" ~ e c e n t l ~ , criticism has arisen on the potentials and feasibilities of renewable energy sources. Low energy densities and large fluctuations of outputs over daily and seasonal operation for most of the renewables make their material intensities inevitably larger than that of conventional sources like fossil and nuclear resources. Moreover, many of them may require backup power sources and storage devices, which aggravate the situation. Although all these are important problems, the authors believe that these issues could be successfully overcome if a strong policy orientation toward an environmentally sound energy system is put into practice.
" ~ h e s e estimates are very close to those made by W. Hifele (1981), op. cit., where the technical potential was assumed to be equal to about 11 Gtoe and the realizable potential was equal to only 7 Gtoe.

Table 3.22: World renewable energy potential.
Energy potential Current Renewable energy In natural form Gtoe utilization (approx.) H y d r o (economic po ten t ia l )
Develo~ed countries 6 x 10¹² k w h 1.3 1.3 x 10¹² k w h Developing countries 6.5 x 10¹² k w h 1.3 0.6 x 10¹² k w h
G e o t h e r m a l ( w i t h o u t d r y rock ) Electricity
Developed countries 2 x 10" k w h 0.3-0.4 14 x 10' k w h Developing countries 5 x 10" k w h 1.3-1.7 1 lo9 k w h
Heat supply Developed countries 700 GW(t) 0.3-0.4 3 Mtoe Developing countries 700 GW(t) 0.3-0.5 0.3 Mtoe
Solar Electricity
Developed countriesa 300 x 10' k w h 0.1-0.15 2.2 x lo6 k w h Developing countries 1.1 x 10¹² kwha 0.15-0.25'
4.8 x 10¹² k w h b 0.7-1.0~ Heat supply
Developed countriesC 0.15-0.2 10-17 Mtoe Developing countriesd 0.8-1.2 1.5-3.5 Mtoe
Biomass Managed forests
Developed countries 0.8-1.0 Developing countries 1.7-2.0
Agricultural wastes (biogas production} Developed countries 0.15 Developing countries 0.2-0.3
Reforestation (at 10% o f desert terri tories) 0.15 Wind
Developed countriese 8 x 10" k w h 0.4-0.5 Developing countries1 12 x 1012 k w h 1.3-1.7
O c e a n (wave or tidal energy, O T E C , etc.)g Developed countries 600 x lo9 k w h 0.07-0.15 Developing countries 13 x 10" k w h 0.4-0.5
Total ( r o u n d e d ) 11-15 Developed countries 3.5-4.0 Developing countries 7-1 1
OPV decentralized systems. *PV centralized systems in desert areas (1% of desert territories). 'Assuming that only 35% of the population lives in areas suitable for solar applications and with approximately 5 square meters of solar collectors per person at annual fossil fuels savings equal to 50 kg of oil equivalent per square meter per year. d~ssuming that 50% of the population lives in areas suitable for solar applications with approximately 2 square meters of solar collectors per person at annual fossil fuels savings equal to 75 kg of oil equivalent per square meter per year. =25% of theoretical potential. 50% of theoretical potential.
g15% of theoretical potential. Sources: WEC, Survey of Energy Resources, 1989; M. Chatterji, ed. (1981), Energy and Environment in the Developing Countries, John Wiley and Sons, New York, NY; R. Leemans (1990), Possible Changes in Natural Vegetation Patterns Due to a Global Warming, WP-90-08, IIASA, Laxenburg, Austria; G. Marland (1983), Prospects of Solving the C02 Problem Through Global Reforest, DOEINBB-0082, U S Department of Energy, Washington, DC; E.X. Namibiar (1984), Plantation forests: Their Scope and Perspective on Plantation Nutrition, in G.D. Bowen and G. Namibiar (eds.), Nutrition of Plantation Forests, Academic Press, London; R. Houghton (1990), The Global Effects of Tropical Deforestation, Environ. Sci. Technol. 24(4); and authors' assessments.

of energy. However, as concerns energy economics, only certain areas may be considered most promising for the next several decades, especially in the production of low-temperature heat or electricity. From this point of view, large prospects have biomass, hydro, geothermal, and wind energy; they all have remarkable potentials; and the have been successfully developed in some regions with favorable economic conditions. However, energy costs for these technologies will remain higher than for conventional ones over the long term.
There are several concepts for electricity generation from renewable energy resources. Direct cost estimates for some renewable energy technologies in comparison with fossil fuel-fired power plants and nuclear plant are summarized in Tables 3.23 and 3.24.27 Table 3.24 shows the fuel prices, the most dynamic factor in the cost analysis for electricity g e n e r a t i ~ n . ~ ~ Within centralized electricity supply systems, only large hydro power plants can effectively compete today on a cost basis with coal or nuclear electricity. In some regions with a favorable geothermal situation (e.g., in areas with volcanic activity), the geothermal sources may also be able to compete. It is hoped that Udry rock" heat for electricity production can be used; however, this idea still requires further R&D on an industrial scale. As concerns decentralized systems, mini-hydro and wind plants are often more efficient than diesel or long-distance connection to centralized networks. In the case of large improvements in PV conversion (the cost should be reduced by at least an order of magnitude), solar can substantially contribute toward electricity generation.
Medium- and low-temperature heat usually plays a remarkable role in the final energy of developed regions (about 50%). Therefore, the technology choices of these regions are of great importance for total efficiency improvements and for the reduction of noxious pollutants. The prospects for renewable energy resources within centralized heat supply systems are not very bright if compared with cogeneration-type fossil fuel facilities. Meanwhile, in some cases the geothermal heat supply systems or large heat pump water-water stations could use, for example, the latent heat of natural reservoirs, cooling water discharged from industrial enterprises, clean water after sewage treatment as well as biogas burning. Solar collectors may become efficient within decentralized heat supply systems if fossil fuel prices double. Rough assessments of the cost of heat produced by different types of heat generators are given in Table 3.25.
The main strategy for the utilization of renewable energies for the next several decades consists primarily in phasing out decentralized and less-efficient conventional systems, especially those in remote and rural areas and using fuelwood and liquid fuel as a major fuel. This will save liquid fuel and improve the economic situation for nations with large and ever-growing foreign debts; reduce the use of wood as a fuel, resulting in declining deforestation; and provide access of the population in developing countries to effective energy forms (first of all, electricity) which is a major prerequisites for social progress.
In conclusion, it is necessary to confirm that today there is a niche for renewable energy technologies, especially in the framework of decentralized electricity supply concepts. Supplying electricity to certain areas will require large investments. But this seems to be the most effective way to solve many social, technical, and ecological problems. This is of even greater importance for the less developed areas, where energy remains a driving force for social, economic, and cultural transformations and changes. he progress of humanity in the near future will almost entirely depend on addressing the problems of developing countries. The use of renewable energy resources can effectively contribute to solving this problem. Renewable energy sources
27These costs do not include externalities which could in some cases substantially improve the competitiveness of renewable energy technologies. All these direct cost comparisons alone do not determine which source and how much are chosen, and therefore these calculations are mere illustrations. Sometimes small incentives will be sufficient to stimulate the introduction of renewable energy technologies.
28~ccording to many energy experts and analysts (see, for example, A.S. Manne and L. Schrattenholzer, 1992, International Energy Workshop: Overview of Poll Responses, IIASA, Laxenburg, Austria) fossil fuel prices will double by 2010, and will triple beyond 2050 (see Figurn 3.1). Therefore, these assumptions enhance the prospects for the introduction of renewable energy technologies in conservative scenarios, like the Dynamics-as-Usual, where no special constraints are applied to fossil fuels.

Table 3.23: Requirements for 1 TWhe produced by different types of electric power plants.
Utili- Required zation
Material consumption for construction (lo3 t) Capital
Non- Resins Life- invest- capacity factor Area ferrous and time ments
Power plant (MW) (%I (ha) Steel metals plastics Cement (years) (million $) Central ized electr ic i ty supply system Coala 210 55 23 Total material 1.7 25 210-275 Coal with fluidized bed boilerb 210 55 23 Total material 1.7 25 210 Natural gas combined cycleC 210 55 8 Total material 0.7 20 95-105 Nuclear (LWR) 160 70 5.4 12.5 0.45 - 85 30 320 Hydro 200 57 165 15.0 0.50 - 150 40 160 Solar (tower concept w/o accumulation) 340 33 920 140 10.5 9.5 480 20 510 Geothermal 140 80 75 - - - - 30 360
Decentral ized electr ic i ty supply sys tem Diesel 6.1O3xO.5 40 - - - - - 30 240-300 Mini-hydro 70 x 4 40 - - - - - 40 300-420 PV (three-day storage)* 145.103x 0.002 40 320-1,100 20-130 - 0.2 210-350 20 3,000-3,375 Winde 3O.1O3x 0.01 40 172.000 45 0.3 3.7 110 10 600
"Coal-fired power plant with flue-gas cleaning equipment; efficiency 35% (350gJkWh). b~oal- f i red power plant with fluidized-bed boiler; efficiency 37% (330 g/kWh). 'Natural gas combined cycle power plant with 48% efficiency (260 g/kWh). dPV module of 2 kW (20 m2 with 10% efficiency). The module includes electricity storage with three-day useful capacity of 12 kwh. The PV module costs are assumed $10,00O/kW (lifetime of 20 years) and for storage $100/kWh (lifetime of five years). 'Wind power plant with a conversion factor of 0.65. The storage capacity is assumed to be 16 kwh. Sources: Environmental Data for Energy Technology Policy Analysis, Vol. 1, Summary, the MITRE Corporation (1970); K.G. Durrow, D.M. Nesbitt, and R.A. Marshalla (1983), An Analysis of the Benefits of Gas Technology, Energy Systems and Policy 7(3); IIASA Data Base for the MESSAGE Model (1982-1984); H. Inhaber (1979), Risk with Energy from Conventional and Unconventional Sources, Science 203; M.A. Styrikovich and Yu.V. Sinyak (1981), Social and Economic Aspects of Long-Term Energy Development, paper presented at the International Symposium on New and Renewable Energy Sources in Solving Global Problems, Moscow, April 20-24.

Tab le 3.24: Cost of electricity generation from different types of power plants. Capital Fuel Electricity cost (mills/kWh)
costs price a t fuel price scaling factorsa Power plant (1985$/kW) ($1 1 2 3 Cent ra l ized electr ic i ty s u p p l y s y s t e m s Coal 1,000-1,300 40/tce 55-70 68-83 82-96 Natural gas combined cycle 450-500 120/tce 54-57 85-88 115-120 Nuclear (LWR) 2,000-2,500 130/kg 65-80 70-85 75-90 Hydro 800-1,500 30-52 30-52 30-52 Solar (tower) 1,500-3,000 110-220 110-220 110-220 Geothermal 1,800-2,600 50-75 50-75 50-75 OTEC 2,200-2,800 70-95 70-95 70-95 (Ocean Thermal Electric Converter)
Decent ra l ized electr ic i ty s u p p l y s y s t e m s Diesel 800-1,000 200/tce 210-240 310-340 410-470 Mini-hydro 1,000-1,400 50-70 50-70 50-70 PV 10,000- 15,000 570-850 570-850 579-850 Wind 1,500-2,000 110-180 110-180 110-180
a With a factor of fuel price increase equal to 1 , 2, or 3.
will hardly be dominant in the world energy balance over the first half of the next century; however, from a social point of view they are one of the most important development problems.
3.3.6 Global/Regional Energy Balances
J a p a n . Primary energy consumption in Japan will not increase remarkably in the future; in fact, the opposite trend is expected. However, its structure might be modified depending on a national policy for preventing global warming (Table 3.26). Total primary energy demand will grow from 460 Mtoe in 1990 t o 520 Mtoe in 2000; thereafter i t will start t o decline, reaching approximately the 1990 level in 2050. The share of Japan in the global energy balance will decline from 5.4% currently t o 2%-4% in the long run.
Because of the poor availability of indigenous energy resources and general requirements for reducing COs emissions, the role of non-carbon fuels (nuclear and renewable energies) will steadily increase: from 16.5% in 1990 t o 45%-65% by the middle of the next century. Nuclear energy use is projected t o almost double until 2010 and further increases are expected over the next 40 years until 2050. However, t o realize this considerable expansion of nuclear resources, public acceptance for the technology must be significantly improved. At present, like in many developed countries, almost any new advancement will receive strong opposition from the popu- lation, even those living in large cities distant from the actual places where facilities are planned. If this situation does not improve, severe difficulties with finding new installation sites might arise.
Crude oil has passed its peak in Japan and its consumption will slowly decline reaching 75- 115 Mtoe in 2050 as compared with 245 Mtoe in 1990. Liquid fuels will be replaced primarily by natural gas and electricity, and energy conservation (especially in the transportation sector) will reduce demand. The demand for natural gas will increase by almost 50% toward 2010. However, later some reduction in natural gas use is anticipated; however, total natural gas consumption will remain a t about today's level. Coal use will grow until 2000 reaching 85 Mtoe (65 Mtoe in 1990); thereafter i ts future will depend strongly on the scenario selected: demand will keep practically at the same level over the whole first half of the century in the Dynamics- as-Usual Scenario, Base Case, but i t will begin t o decline fast, practically reaching zero by the

Table 3.25: Cost of low-temperature heat supply for different generators. Capital O&M Heat cost ($/Gcal) at fuel price
cost (W/O fuel) scaling factors" Source (lo3 1985$/Gcal) (1985$/Gcal) Efficiency 1 2 3 Large installations (industry, centralized heat supply) Coal ($100/tce) 330-350 20-25 0.65 40-45 60-65 85-90 Fuel oil ($16O/tce) 140-150 Natural gas ($145/tce) 120-130 Electric boiler (8#/kWh) 80-90 Cogeneration with gas turbine 800-1,000
(gas - $145/tce, electricity - 5#/kWh)' ($/kW) Biogas (gas - $12.50/Gcal)' 130-140 Heat pumpsd
Electric 380-400 Natural gas 365-380
Solar collectore 1,160-1,200 Geothermal (hot water, self-discharger) 15-30 "Dryn rocksf 450-600 Small installations (decentralized space heating) Coal ($150/tce) 350-360 Heating oil ($250/tce) 370-380 Natural gas ($300/tce) 300-310 Electricity 115120 Heat pumpsd
Electric (10#/kWh) 760-800 Natural gas ($/300/tce) 640-660
Electric with heat storage (3#/kWh) 65-70
0.70 0.75
1 .o 0.45
(kg ce/kWh) 0.72
Solar collectore 900-1,000 130-140 - 130-140 130-140 130-140 "With a factor of fuel price increase equal to 1, 2. or 3. b ~ a s turbine cogeneration without additional supply of fuel for heating and with complete burning of oxygen in flue gases (on average, 6 Gcal/h per MWe). Sold electricity a t 5t/kWh. 'Cost of biogas installations included in the biogas costs. d ~ a t e r - w a t e r compressor type heat p u m p . 'Economics of solar collector corresponds to the winter insolation in middle latitudes (30-45OC) with collector efficiency of 30% and costs of $120/m2 (including heat storage (5-6m/m3) and back-up heat generator). 'cost assessments for 'dryn r o c b are rough estimates. They are similar to a geothermal power plant, where one well is capable of supplying enough heat to produce 5-10 MWe; the productivity of the geothermal heat supply system is assumed a t 6-8 Gcal/h. With two wells five km deep in operation, costs for each well are equal to 350-500 x 103$/Gcal/h. The cost of the heat exchanger is 100 x 10~$/Gcal/h. In fact, capital investments will be much higher because we did not take into account the installation of a circulatory system. In total, heat costs will hardly be less than twice that given in the table. Source: Yu. Sinyak and A. Nekrasov (1982), Renewable Energy Sources in a Prospective Energy Balance, paper presented a t the Soviet-Italian Symposium on Alternative Energy Sources, Moscow (in Russian).

Thble 3.26: Primary energy scenarios for Japan (Mtoe).
2010 2050 Enhanced Efficiency Enhanced Efficiency
Dynamics- and Conservation Dynamics- and Conservation as-Usual Accelerated Abate- as-Usual Accelerated Abate-
1980 1990 2000 Base Case (Al) ment Case (B3) Base Case (Al) ment Case (B3) Total primary energy demand 366 461 520 505 485 4 75 410
Coal Oil Natural gas Nuclear Renewables Noncommercial
Electricity generation Coal Liquid fuels Natural gas Nuclear Renewables Non-carbon fuels (Hz, etc.)
Final energy demand 257 305 375 400 f rounded)
middle of the century, in the Enhanced Efficiency and Conservation Scenario, Accelerated C 0 2 Abatement.
The share of the electricity sector in total energy demand will reach 50%-75% in 2050 as compared with 41% today. Nuclear contribution to electricity generation will expand from 23% today to 45%-55% in 2050. The share of renewable energies in the electricity sector will also rise, although not as much as nuclear energy: from 17% today to 20%-30% in the long-term future. Some progress is expected in the application of new non-carbon fuels (e.g., Hz) for electricity generation (especially for peak-load electricity); Japan will be a pioneer in this field. Non-carbon technologies will contribute about 65%-85% to electricity generation in 2050.
Per capita energy demand in Japan will reach 4-4.1 toe in 2000 (3.77 toe today); thereafter i t will practically stabilize a t 3.9 toe in 2050 (in case of "normaln changes in the system, the Dynamics-as-Usual Scenario) or will start t o decline slowly reaching about 3.4 toe in the long term (Enhanced Efficiency and Conservation Scenario). With respect to the energy/GNP ratio, it is hoped that Japan will keep its record position in energy efficiency: the energy/GNP ratio will decline from 0.3 toe/$ currently to 0.1-0.13 toe/$ by the middle of the next century (average annual decline of about 1.2%-2% per year). The reduction of energy intensity is expected to be fulfilled by economic shifts (e.g., the production of commodities or services with higher value added and less energy consumption) and by further energy technology improvements (e.g., wider use of cogeneration, enhanced electrification).
Developed countr ies (wi thout Japan) . Primary energy demand in this region will increase in the future with a steady declining growth rate (Table 3.27). As a result, energy demand is projected to increase by 10% until 2000 as compared with the 1990 level reaching 6,360 Mtoe. For the 21st century two paths are analyzed: a further growth in the Dynamics-as-Usual Scenario or a stabilization of energy demand over the whole first half of the century in the Enhanced Efficiency and Conservation Scenario. The results of these two approaches show that energy demand will reach about 6,200-6,900 Mtoe in 2010 and will further increase to 8,200 Mtoe i f the Dynamics-as-Usual path is selected. However, if enhanced efficiency measures and policies are applied and started immediately, then improvements will be seen already at the beginning of the next century: energy demand will be close to stabilization, almost at the level reached in 2000.
Large changes in the primary energy mix are expected. Crude oil demand will decline from 38% in total energy demand currently to 32% in 2000 and to 10%-13% by the middle of the 21st century. The role of natural gas will steadily increase: its share will rise from 25% today to 29% in 2000 and 30%-32% in 2010. Thereafter the demand will strongly depend on the policy chosen: with moderate efforts in energy conservation and C 0 2 abatements a further growth in absolute terms is expected (however, the percentage of natural gas in total energy demand will remain practically unchanged), but, if enhanced policy measures to cope with global warming are applied, then a decline in carbon-content fuels will be inevitable (of course, less for natural gas than for coal or crude oil) and the share of this fuel will be below 20% in 2050. Coal will remain at the same level, about 23%, until 2000, but thereafter either a small growth will be anticipated, reaching 28% by the middle of the next century (Dynamics-as-Usual Scenario, Base Case), or the coal demand will sharply decline because of the C 0 2 emission reduction goals to be achieved over the time horizon of the study (Enhanced Efficiency and Conservation Scenario, Accelerated C 0 2 Abatement).* The non-carbon contribution will increase in all cases, but at a much higher rate with the C 0 2 reduction strategy. The share of nuclear, which is now equal to only 7.1% in primary energy demand, will increase to 8.3% in 2000 and further to 15%-40%
" ~ t is crucial that efforts are made to dissolve the domestic coal industry smoothly when shaving off coal consumption. Protection of domestic coal production has been a substantial burden for energy policies in some countries (e.g., Ghrmany, the UK, and Japan). Although the dissolution of the industry should be a natural and reasonable process, and actually has already started, it still aeems efforts must be taken to provide workers with alternative jobs and so on.
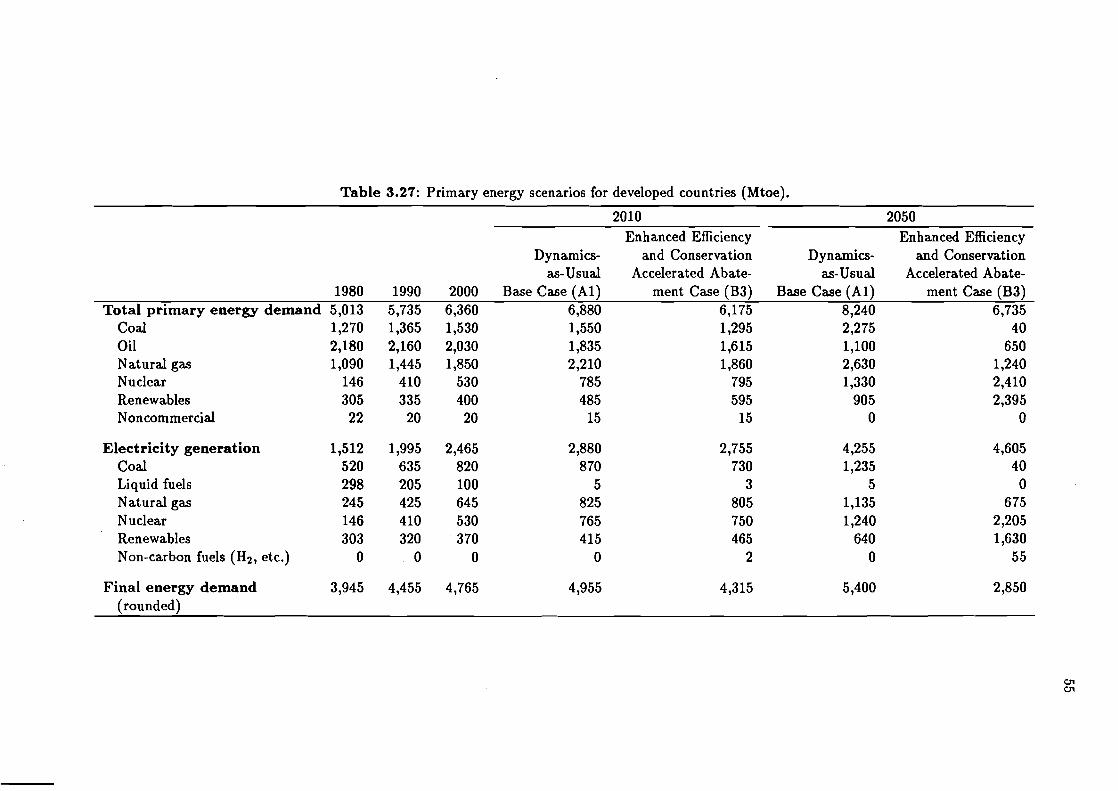
Table 3.27: Primary energy scenarios for developed countries (Mtoe).
1980 Total primary energy demand 5,013
Coal 1,2 70 Oil 2,180 Natural gas 1,090 Nuclear 146 Renewables 305 Noncommercial 22
2010 2050 Enhanced Efficiency Enhanced Efficiency
Dynamics- as-Usual
Base Case (Al) 6,880 1,550 1,835 2,210
785 485 15
Electricity generation 1,512 1,995 2,465 2,880 Coal 520 635 820 870 Liquid fuels 298 205 100 5 Natural gas 245 425 645 825 Nuclear 146 410 530 765 Renewables 303 320 370 415 Non-carbon fuels (Hz, etc.) 0 0 0 0
Final energy demand 3,945 4,455 4,765 4,955 (rounded)
and Conservation Accelerated Abate-
ment Case (B3) 6,175 1,295 1,615 1,860
795 595 15
Dynamics- as-Usual
Base Case (Al) 8,240 2,2 75 1,100 2,630 1,330
905 0
and Conservation Accelerated Abate-
ment Case (B3) 6,735
40 650
1,240 2,410 2,395
0

in 2050, depending on the policy for energy conservation and C02 abatement. Renewables' contribution will also increase from 5.8% today to 6.3% in 2000 and 10%-35% in the long term.
Changes in the electricity demand will result in increases of the share of primary energy resources used for electricity generation: from 35% today to 39% in 2000 and 50%-70% in 2050. The contribution expected from non-carbon technologies will steadily grow from 36% currently to 45%-85% by the middle of the 21st century. A lower level is projected for the Dynamics-as- Usual Scenario, and a higher one for the Enhanced Efficiency and Conservation Scenario with Accelerated COz Abatement.
Per capita energy consumption will increase during the 1990s reaching 5-5.15 toe per capita; however, thereafter this indicator will likely increase slowly or start to decline, of course at different rates for various scenarios. The per capita energy demand will reach about 8 toelcapita for the Dynamics-as-Usual Scenario (Al), if no special measures to stop C02 emissions are applied, or rocket to 11 toelcapita if accelerated growth of non-carbon technologies is required (A3). Under the pressure of enhanced efficiency improvements, a reduction is expected to about 4.6 toelcapita (Bl) or 5.6 toelcapita (B3). The energy/GNP ratio will continue to steadily improve reaching 0.15-0.25 toe/$1,000 in 2050 as compared with 0.52 toe/$1,000 today (avenge annual decline is 1.2%-2%). In spite of remarkable improvements in energy use, the efficiency in this region will remain lower than in Japan over the time horizon of the study.
Developing countries. Major changes are projected for the energy systems in developing countries (Table 3.28). Total primary energy demand will grow by a factor of 4-5 until 2050. In total, primary energy demand in the region of developing countries is expected to be equal to 7-12 Gtoe per year by the middle of the next century.
Crude oil is the most important energy carrier in this region with a contribution of 48% to total energy demand today. It will keep its leading position in the future, but by 2050 the role of crude oil will inevitably decline reaching 15%-30%. A large portion of this decline will be due to the increased use of natural gas; its utilization will double over the next decade (140 Mtoe in 1990) and will grow by a factor of 2.5 over the next 20 years reaching 650-700 Mtoe in 2010. In 2050 natural gas consumption is projected to reach 700-1,500 Mtoe. However, the share of natural gas, after reaching its maximum at about 15%-20%, will start to decline to about 10%-15% by the middle of the next century. Coal consumption is extremely sensitive to the scenarios applied, especially in the long term. In the Dynamics-as-Usual Scenario, coal consumption will steadily increase reaching 755 Mtoe in 2000, 1,100-1,200 Mtoe in 2010, and about 3,000 Mtoe in 2050 (540 Mtoe in 1990). The substantial drop in coal production and use after 2000 will result in a major decrease of C02 emissions, practically eliminating this fuel by the middle of the next century. The share of non-carbon fuels will expand: from less than 9% today to about 25%-80% in the long-term future, depending on the scenario selected.
The share of electricity generation in total primary energy consumption will rise from 25% in 1990 to 33% in 2000 and further to 45%-65% in 2050.
In spite of the large expansion of energy demand in this region, the change in the per capita energy demand will be less pronounced because of the much higher growth rate of the population (0.8-1.3 toe in 2050 compared to 0.6 toe today). This means a slow improvement in the living standard for the populations of many developing countries, although some of them will surpass the current level of well-being of many developed countries. Meanwhile, some improvements in energy use are expected, resulting in the energy/GNP ratio decline over the next 60 years from 0.7 toe/$1,000 in 1990 to 0.3-0.5 toe/$1,000 in 2050 (with a small growth until 2000). However, energy-use efficiency will remain at least twice below that of developed countries.
World as a whole. Table 3.29 contains the summary of world primary energy projections. World energy consumption will increase from 8.6 Gtoe currently to about 10 Gtoe in 2000 and 10-12 Gtoe in 2010. With smaller efforts in efficiency improvements, the projected consumption will amount to 18-24 Gtoe until the middle of the next century. But enhanced efforts in energy

Table 3.28: Primary energy scenarios for developing countries (Mtoe).
2010 2050 Enhanced Efficiency Enhanced Efficiency
Dynamics- and Conservation Dynamics- and Conservation as-Usual Accelerated Abate- =-Usual Accelerated Abate-
1980 1990 2000 Base Case (Al) ment Case (B3) Base Case (Al) ment Case (B3) Total primary energy demand 1,625 2,384 3,145 4,630 4,100 10,080 10,040
Coal 395 540 755 1,190 790 3,110 85 Oil 780 1,135 1,385 1,730 1,385 2,815 1,230 Natural gas 70 140 275 695 695 1,275 715 Nuclear 2 29 55 115 300 600 3,700 Renewables 82 185 265 505 605 1,950 4,310 Noncommercial 296 355 4 10 395 325 330 0
Electricity generation 311 594 910 1,750 Coal 97 125 225 565 Liquid fuels 110 215 230 245 Natural gas 20 60 170 530 Nuclear 2 29 55 100 Renewable8 82 165 230 310 Non-carbon fuels (Hz, etc.) 0 0 0 0
Final energy demand 1,430 1,850 2,595 3,305 3,075 7,500 5,085 (rounded)
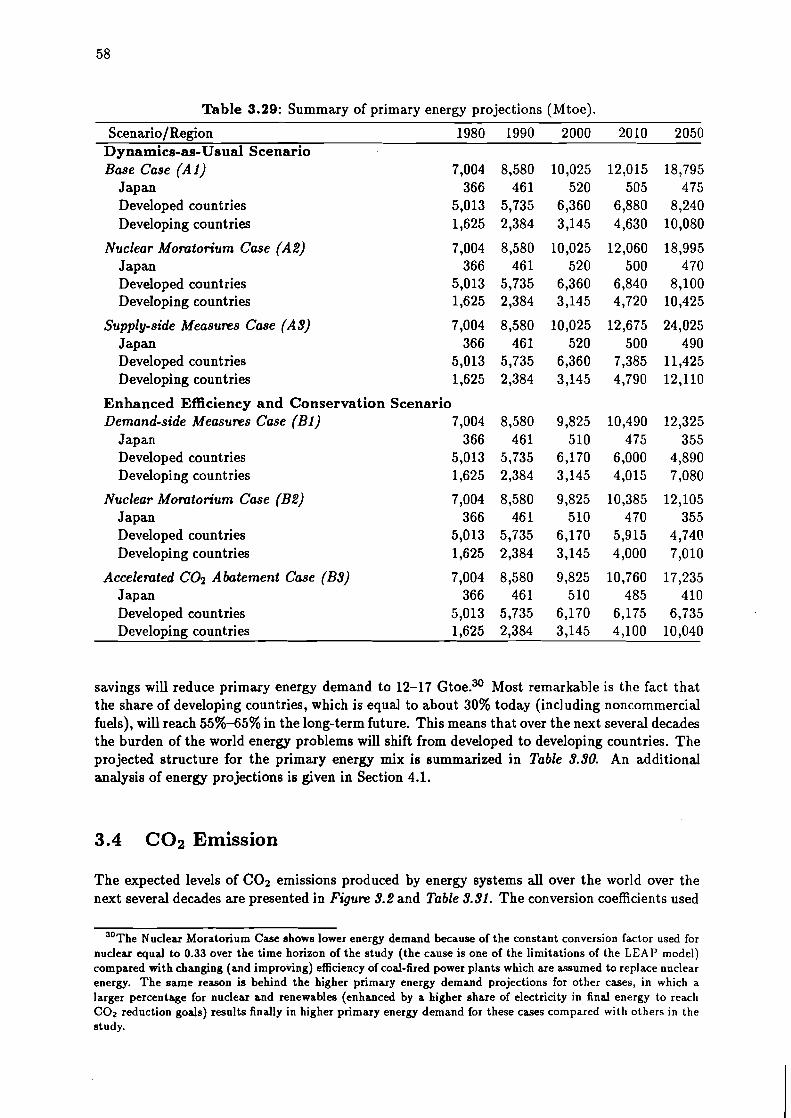
Table 3.29: Summary of primary energy projections (Mtoe).
Scenario/Region 1980 1990 2000 2010 2050 Dynamics-as-Usual Scenario Base Case ( A l )
Japan Developed countries Developing countries
Nuclear Momtorium Case (A21 Japan Developed countries Developing countries
Supply-side Measures Case (A9) Japan Developed countries Developing countries
Enhanced Efficiency and Conservation Scenario Demand-side Measures Case ( B l ) 7,004
Japan 366 Developed countries 5,013 Developing countries 1,625
Nuclear Momtorium Case (B2) Japan Developed countries Developing countries
Accelerated C 0 2 Abatement Case (B9) Japan Developed countries Developing countries
savings will reduce primary energy demand to 12-17 G t ~ e . ~ ~ Most remarkable is the fact that the share of developing countries, which is equal to about 30% today (including noncommercial fuels), will reach 55%-65% in the long-term future. This means that over the next several decades the burden of the world energy problems will shift from developed to developing countries. The projected structure for the primary energy mix is summarized in Table 9.90. An additional analysis of energy projections is given in Section 4.1.
3.4 C02 Emission
The expected levels of C 0 2 emissions produced by energy systems all over the world over the next several decades are presented in Figum 9.2 and Table 9.91. The conversion coefficients used
30The Nuclear Moratorium Case shows lower energy demand because of the constant conversion factor used for nuclear equal to 0.33 over the t ime horizon of the study (the cause is one of the limitations of the LEAP model) compared with changing (and improiring) efficiency of cod-fired power plants which are assumed to replace nuclear energy. The same reason is behind the higher primary energy demand projections for other cases, in which a larger percentage for nuclear and renewable8 (enhanced by a higher share of electricity in f ind energy to reach COz reduction gods) results finally in higher primary energy demand for these cases compared with others in the study.
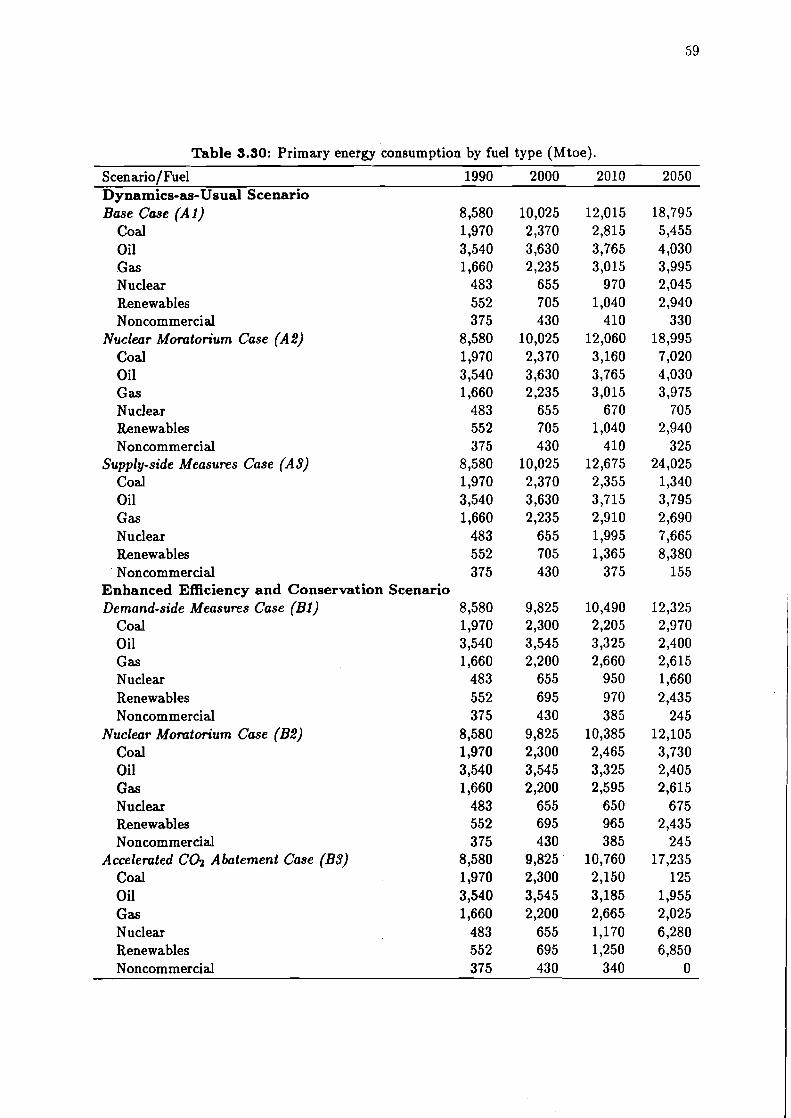
Table 3.30: Primary energy consumption by fuel type (Mtoe).
Scenario/F'uel 1990 2000 2010 2050 Dynamics-as-Usual Scenario Base Case (A 1) 8,580
Coal 1,970 Oil 3,540 Gas 1,660 Nuclear 483 Renewables 552 Noncommercial 375
Nuclear Momtorium Case (A2) 8,580 Coal 1,970 Oil 3,540 Gas 1,660 Nuclear 483 Renewables 552 Noncommercial 375
Supply-side Measures Case (A3) 8,580 Coal 1,970 Oil 3,540 Gas 1,660 Nuclear 483 Renewables 552 Noncommercial 375
Enhanced Efficiency and Conservat ion Scenario Demand-side Measures Case ( B l ) 8,580
Coal 1,970 Oil 3,540 Gas 1,660 Nuclear 483 Renewables 552 Noncommercial 375
Nuclear Momtorium Case (B2) 8,580 Coal 1,970 Oil 3,540 Gas 1,660 Nuclear 483 Renewables 552 Noncommercial 375
Accelemted C& Abatement Case (B9) 8,580 Coal 1,970 Oil 3,540 Gas 1,660 Nuclear 483 Renewables 552 Noncommercial 375

1080 1990 2000 2010 2020 2030 2040 2050
Veers
Dynamics - as - Usual E n d l m c s d ~ ~ ~ Nudear Moratorium - Base case w m m
Nudear Moratorium I-
Demand - slde Yo-- Aooekaw Abamnm -
Figure 3.2: C02 emissions by global energy systems.
for recalculating fossil fuels into carbon dioxide emissions are given in Table 3.3~.~' Details of these emission projections are given in Section 4.2.
C02 concentration assessments were made by calculating the C02 accumulation in the at- mosphere, taking into account the world energy balance described by the scenario applied. It was assumed that only 60% of carbon released from emissions remains in the atmosphere as airborne c~ncentrat ion.~~ The results of these rough calculations are summarized in Table 3.33. The results show that even in spite of large efforts in energy conservation and primary mix changes to transfer to C02 energy sustainable systems until the middle of the next century (60% C02 reduction compared with currently observed levels), a further increase in C02 at- mospheric concentration will take place over the time horizon of the study. Quite naturally, a nuclear moratorium will have maximum concentration increases; however, they will be in- significantly higher in this case than in the base cases because at the time of its introduction (somewhere around 2005-2010), nuclear energy's contribution to the total world energy balance
"other sources give slightly different numbers for emitwion coefficients (see, for example, OECD, 1990, Green- house Gas Emissions - The Energy Dimension). However, the final results differ very little.
32According t o C 0 2 concentration records from 1860 t o the early 1970s and estimates of the cumulative fossil fuel consumption over this t ime period, i t follows that approximately 40% of the carbon released has remained in the atmosphere. However, more precise instrument observations provided in the period 1959-1973 have shown tha t the airborne part was equal t o 56% (see, Energy and Climate, NAS, Washington, DC). Today, the majority of climate models estimate this share a t 60%. T h e last estimate is used in our approach for the evaluation of C 0 2 concentration changes in the long-term future. However, there are expectations that the value of CO2 sinks by nature will strongly depend on the temperature increases and biomass expansion followed by natural processes as well as man-made afforestation.

Table 3.31: C 0 2 emissions by global energy systems (Gt-C/yr).
Scenario/Region 1980 1990 2000 201 0 2050 D y narnics-as-Usual Scenario Base Case ( A l )
Japan Developed countries Developing countries
Nuclear Momtorium Case (A2) 5.45 6.30 7.28 8.77 14.48 Japan 0.23 0.25 0.28 0.26 0.28 Developed countries 3.79 4.07 4.45 4.81 6.31 Developing countries 1.43 1.98 2.55 3.70 7.89
Supply-side Measures Case (A3) 5.45 6.30 7.27 7.90 6.63 Japan 0.23 0.25 0.28 0.25 0.11 Developed countries 3.79 4.07 4.44 4.30 2.87 Developing countries 1.43 1.98 2.55 3.35 3.65
Enhanced Efflciency and Conservat ion Scenario Demand-side Measures Case ( B l ) 5.45 6.30 7.08 6.95 7.01
Japan 0.23 0.25 0.28 0.24 0.11 Developed countries 3.79 4.07 4.27 3.69 2.19 Developing countries 1.43 1.98 2.53 3.02 4.71
Nuclear Moratorium Case (B2) 5.45 6.30 7.08 7.23 7.97 Japan 0.23 0.25 0.28 0.24 0.19 Developed countries 3.79 4.07 4.27 3.93 2.88 Developing countries 1.43 1.98 2.53 3.06 4.90
Accelerated C02 Abatement Case (B3) 5.45 6.30 7.06 6.76 2.68 Japan 0.23 0.25 0.28 0.24 0.06 Developed countries 3.79 4.07 4.27 3.82 1.30 Developing countries 1.43 1.98 2.51 2.70 1.32
Table 3.32: C02 emission coefficients by fuels.
Type of Fuel C02 C02 tce toe
Solid 3.0 4.5 Liquid Gaseous
Source: Deutscher Bundestag, Schutz der ErdatmosphLe. Eine internationale Herausforderung. Bonn (1988).
will still be at the level of several percent. Meanwhile, concentrations are projected to increase 1.3-1.5 times until 2050 in the Dynamics-as-Usual Scenario and 1.25-1.35 times in the Enhanced Efficiency and Conservation Scenario. This means that concentrations will be at least 100 ppm higher than today's level, even when applying very severe measures in energy conservation and the primary mix change. If we assume that C 0 2 contributions to global warming remain only at 50% over the time horizon of the study as is observed today, then a doubling of the C 0 2 concentrations will be observed around 2050.

Table 3.33: Atmospheric accumulation of C 0 2 in 2050.
Gt-C PPm Dynamics-as-Usual Scenario
Base Case (Al) 345 530 Nuclear Moratorium Case (A2) 355 535 Supply-side Measures Case (A3) 225 4 70
Enhanced Efflciency a n d Conservation Scenario Demand-side Measures Case (Bl) 240 480 Nuclear Moratorium Case (B2) 275 495 Accelerated C 0 2 Abatement Case (B3)' 200 460
"60% annual COa reduction by 2050.
If, parallel to enhanced energy systems restructuring, a reforestation program will be de- ployed on a broad scale, then global warming could be substantially reduced. A simplified calculation shows that if reforestation in suitable areas were to occur until the middle of the next century, then the quantity of carbon accumulated in the atmosphere could be reduced by 25%-40%. This means that if an enhanced energy conservation and C 0 2 abatement policy were applied to energy systems and enhanced reforestation programs were started immediately, then both could help in achieving the current C02 concentration level sometime after 2 0 5 0 . ~ ~ Although the effect of reforestation is very much uncertain and the appraisals are based on a simplified approach, it is hoped that reforestation may compensate for the negative effects of C 0 2 accumulation in the atmosphere.
3.5 Summary of Global Energy/COz Projections
The world energy systems should set off for a transition period of gradually substituting fossil fuels for inexhaustible energy resources (e.g., nuclear fission and fusion and renew- able~); however, it is highly uncertain how long and how difficult this transition will take.
The following features are characteristic for future energy systems:
- Energy consumption will increase mainly in developing countries.
- Energy savings and conservations in all areas of energy demand and supply will become increasingly important.
- Strong constraints on nuclear energy will be implemented (especially over the next couple of decades, unless a new generation of nuclear reactors is developed and proves its safety and economic viability).
- Contributions of renewable energy technologies will be limited because of poor eco- nomics, unreliability, and large impacts on the environment because of high material consumption for their construction.
33Total estimated area available for reforestation is about 865 million ha (R. Houghton, 1990, The Future Role of Tkopical Forests in Affecting the Carbon Dioxide Concentration of the Atmosphere, Ambio 19(4):204-209). If we assume that the carbon fixation rate in growing trees is equal to 5 t-C/ha/year (managed and tropical forests) and the growing time is 20 years (see, e.g., P. Farnum, T. Tomans, and J. Kulp, 1983, Biotechnology of Forest Yield, Science 219:694-702), then growing biomass can absorb about 80 Gt-C (billion tons of carbon) over the next 50-75 years, which corresponds to about 40% of carbon accumulated in the atmosphere as in the case of the Accelerated COa Abatement Case or much lower values for the other cases. Of course, we must take into account the large difficulties in the reforestation process, including those areas in inferior condition. Even under favorable conditions, there is a kind of competition between reforestation and food production when considering that all favorable land may belong to developing countries where a large population expansion is expected. Therefore, this calculation is an illustration of a measure which requires further detailed research.

- Fossil fuel resources will continue to play a leading role in the world energy balance in the next century, although environmental and climate constraints will restrict the use of these fuels worldwide or in some regions.
- Environmental and climate issues and priorities will become increasingly important when selecting energy technologies.
In the light of these trends, world energy consumption will increase from 8.6 Gtoe today to 10-11 Gtoe in 2000 and further to 12-24 Gtoe in 2050. Energy demand in developed countries will remain approximately a t today's level over the whole time horizon of the study or even slightly reduce until the middle of the next century. Energy demand will primarily grow because of the needs of developing countries to solve their social and eco- nomic problems. The projected growth of energy demand in this region will exceed today's level 2-5 times. As a result, the share of developing countries in the world energy balance will increase from 30% in 1990 to 55%-60% in 2050. These changes mean that over the next several decades the focal point of global energy problems will shift from developed to developing countries, which could create new tensions in the world energy supply if no preventive measures are undertaken in time.
The primary energy mix will strongly depend on the strategy chosen for energy systems development. Under normal (Dynamics-as-Usual Scenario) conditions, coal production will increase to 4-5 Gtoe in 2050, crude oil to 4-4.2 Gtoe, and natural gas to 2-4 Gtoe. The share of non-carbon technologies (nuclear and renewable energies) will increase to 25%- 30%. However, if the C02 abatement strategy of achieving sustainability levels by the middle of the next century is selected (Enhanced Efficiency and Conservation Scenario, Accelerated COz Abatement Case), then the share of fossil fuels should be drastically reduced (according to our estimates, 15%-25% of total energy supply in 2050) and a most remarkable reduction will have to be achieved, first of all, in coal and liquid fuel uses. However, this does not mean that this strategy is the best. Under the present conditions, with large uncertainties about global warming, pursuing this line is absolutely impossible. The requirements are too rigid and, perhaps, demand too much from developed countries. If a nuclear moratorium is imposed at the beginning of the next century, then additional production of fossil fuels (primarily, coal) will be required with consequent C 0 2 emission increases. Priority for an energy/C02 strategy should be given to flexibility rather than to a directly anticipated outcome.
The most radical measures applied to the energy systems will not stop the process of carbon accumulation in the atmosphere (at least, the period of doubling C02 concentrations will be extended beyond 2050 for a couple of decades). Pa rde l efforts in other spheres of human activity are required (urgently stopping deforestation and starting enhanced restoration of forests, especially in tropical zones, and reducing other greenhouse gases emissions which contribute not less than 50% to global warming; these quantities are much lower compared with carbon dioxide emissions and seem to be much easier to handle). Research on the impacts of global warming on humans and the environment should start now to help in selecting the optimal (or at least most reasonable) path in global energy development.
There are still many uncertainties regarding global warming and energy system strate- gies over the long term; both require further study. Special attention should be given to climate/human activity models including all players contributing to global warming (nat- ural and anthropogenic), assessing social and economic consequences of global warming, and determining the costs of its reduction. Analysis of the energy supply and demand in developing countries should be the focal point of these studies. The increasing role of non-carbon energy-supply technologies requires more in-depth analysis of new approaches to the world energy supply, based on either centralized or decentralized concepts. New

criteria for energy technology selection are urgently needed to incorporate environmental, climate, and human externalities and risks associated with new and conventional technolo- gies.

Chapter 4
Implications of the Energy/C02 Scenarios
4.1 Long-term Evolution of Global Energy Demand and Supply
In the previous chapters, the details of the long-term global energy/CO2 scenarios were de- scribed. In this chapter, we take a closer look at the numerical results and derive policy im- plications from the viewpoint of long-term structural changes. Tables 4.1 and 4.2 show the summarized results of the final energy-demand scenarios evaluation.
In the Dynamics-as-Usual Scenario (A), the final energy demand is expected to increase until the year 2050, in both developed and developing countries. The average annual demand in the developing region will increase to 2.5% per year, which is far greater than the increase in the developed region of 0.3% per year. Looking at the sectorial structures, energy conservation is expected in the service and household sector in the developed region, which results in a reduction in its share in the final energy demand. In the developing region, the high share of the transport sector would not change very much during the simulation period.
The share of electricity in the final energy is currently 14% in the developed region and 10% in the developing region. In both regions this ratio is expected to increase steadily - up to 27%
Table 4.1: Final energy demand (commercial energy including feedstocks), Dynamics-as-Usual Scenario (A).
1990 2010 2050 (Mtoe) ( % I Y ~ ) (Mtoe) ( % / ~ r ) (Mtoe)
Developed countries 4,435 0.55 4,945 0.22 5,400 % of industry 47.7 0.00 47.7 0.12 50.1 % of transport 22.6 -0.08 22.2 0.29 24.9 % of service/household 29.7 0.06 30.1 -0.46 25.0 % of electricity 14.1 1.43 18.7 0.91 26.9 % of fossil & motor fuels 70.7 -0.54 63.4 -0.73 47.3
Developing countries 1,662 2.99 2,995 2.23 7,240 % of industry 49.2 0.06 49.8 -0.06 48.6 % of transport 31.7 0.03 31.9 -0.10 30.6 % of service/household 19.1 -0.22 18.3 0.32 20.8 % of electricity 9.6 1.73 13.6 1.29 22.6 % of fossil & motor fuels 80.6 -0.33 75.3 -0.57 60.0

Table 4.2: Final energy demand (commercial energy including feedstocks), Enhanced Efficiency and Conservation Scenario (B).
1990 2010 2050 (Mtoe) (%/yr) (Mtoe) ( % / ~ r ) (Mtoe)
Developed countries 4,435 -0.15 4,305 -1.03 2,840 % of industry 47.7 0.20 49.6 0.29 55.7 % of transport 22.6 -0.38 20.9 -0.14 19.8 % of service/household 29.7 -0.04 29.5 -0.46 24.5 % of electricity 14.1 1.80 20.1 1.24 32.9 % of fossil & motor fuels 70.7 -0.76 60.7 -1.52 32.9
Developing countries 1,662 2.58 2,765 1.40 4,825
% of industry 49.2 0.10 50.2 0.18 53.8 % of transport 31.7 -0.06 31.3 -0.76 23.1 % of service/household 19.1 -0.16 18.5 0.56 23.1 % of electricity 9.6 2.10 14.6 1.63 27.9 % of fossil & motor fuels 80.6 -0.47 73.3 -1.05 48.0
and 23%, respectively, reflecting their industrial developments to which electricity will be of crucial importance as the most flexible and clean energy source.
In the Enhanced Efficiency and Conservation Scenario (B), the find energy demand in the developed region will decline, especially after 2010 as fast as -1% per year. Energy conservation would be expected more in the transport and the service and household sectors than in industrial production. In the developing region, the find energy demand in Scenario (B) will still expand, but at lower rate than the demand in Scenario (A). It is noticeable that the share of the transport sector in the region will decline so substantially that the sectorial structure in the year 2050 will be quite similar to that in the developed region.
The degree of electrification in Scenario (B) can be seen as much greater than in Scenario (A); even in the developing region a rapid shift to electricity must be realized. The share of electricity will increase up to 28% in the year 2050 in the total final energy, which is larger than in the developed region in Scenario (A).
The Supply-side Measures Scenario (A3) would result in a substantial increase of primary energy supply (Table 1.3). In the Accelerated Abatement Case (B3), even though the final energy demand (seen as Scenario B) would decline, the primary supply would increase. This is due to the expanded utilization of nuclear and renewable energies, which should be converted to electricity a t a certain conversion efficiency possibly lower than the conventional generation technologies to date.
In 1990, the production of the fossil fuels (coal, oil, and natural gas) is evaluated as 7.2 Gtoe, which occupies 84% in the total primary consumption. In the Base Case (Al), this amount will increase in the year 2050 up to the level of 13.5 Gtoe (72%) in the t o td primary consumption of 18.8 Gtoe. In the Accelerated Abatement Case (B3), it is only at 4.1 Gtoe (25%) for the t o td 17.2 Gtoe; nuclear energy (6.3 Gtoe, 36%) and renewable (6.9 Btoe, 40%) will obtain an even larger share in the primary supply. Thus, the drastic restructuring to create an advanced energy supply system with those non-carbon sources as major sources will be indispensable in realizing a substantial emission abatement while fulfilling the increasing energy demand.
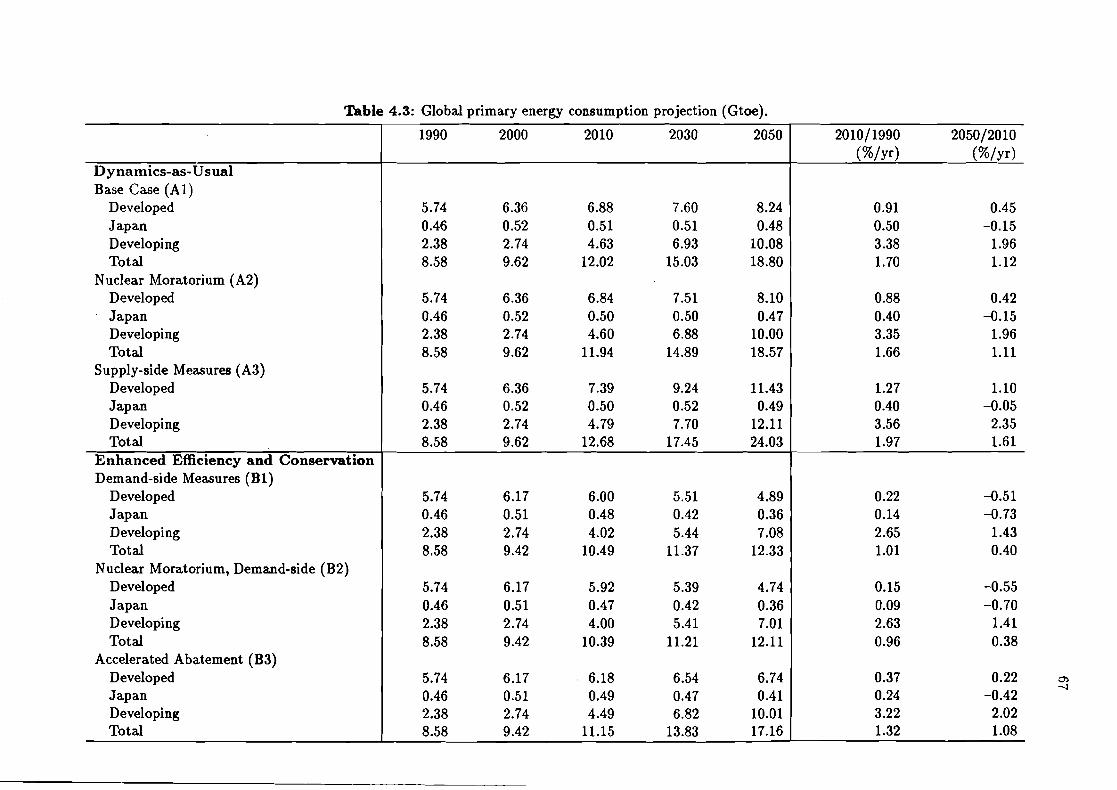
Table 4.3: Global primary energy consumption projection (Gtoe).
Dynamics-as-Usual Base Case (A l )
Developed Japan Developing Total
Nuclear Moratorium (A2) Developed Japan Developing Total
Supply-side Measures (A3) Developed Japan Developing Total
Enhanced Efficiency and Conservation Demand-side Measures (B l )
Developed Japan Developing Total
Nuclear Moratorium, Demand-side (B2) Developed Japan Developing Total
Accelerated Abatement (B3) Developed Japan Developing Total
1990 2000 2010 2030 2050
5.74 6.36 6.88 7.60 8.24 0.46 0.52 0.51 0.51 0.48 2.38 2.74 4.63 6.93 10.08 8.58 9.62 12.02 15.03 18.80
5.74 6.36 6.84 7.51 8.10 0.46 0.52 0.50 0.50 0.47 2.38 2.74 4.60 6.88 10.00 8.58 9.62 11.94 14.89 18.57
5.74 6.36 7.39 9.24 11.43 0.46 0.52 0.50 0.52 0.49 2.38 2.74 4.79 7.70 12.11 8.58 9.62 12.68 17.45 24.03
5.74 6.17 6.00 5.51 4.89 0.46 0.51 0.48 0.42 0.36 2.38 2.74 4.02 5.44 7.08 8.58 9.42 10.49 11.37 12.33
5.74 6.17 5.92 5.39 4.74 0.46 0.51 0.47 0.42 0.36 2.38 2.74 4.00 5.41 7.01 8.58 9.42 10.39 11.21 12.11
5.74 6.17 6.18 6.54 6.74 0.46 0.51 0.49 0.47 0.41 2.38 2.74 4.49 6.82 10.01 8.58 9.42 11.15 13.83 17.16
2010/1990 2050/2010
(%/yr) (%/yr)
0.91 0.45 0.50 -0.15 3.38 1.96 1.70 1.12
0.88 0.42 0.40 -0.15 3.35 1.96 1.66 1.11
1.27 1.10 0.40 -0.05 3.56 2.35 1.97 1.61
0.22 -0.51 0.14 -0.73 2.65 1.43 1.01 0.40
0.15 -0.55 0.09 -0.70 2.63 1.41 0.96 0.38
0.37 0.22 0.24 -0.42 3.22 2.02 1.32 1.08

4.2 Long-term Evolution of Global C02 Emission
Figure 4.1 shows the long-term carbon emission trajectories of the scenarios, together with the IPCC scenarios and the latest International Energy Workshop (IEW) poll results.
As can clearly be seen, the Base Case (A l ) is very much in line with the IEW poll median, which represents a consensus view of world's expertise, as well as the IPCC Business-as-Usual Scenario. Our Dynamics-as-Usual Scenario does not show any significant difference from those projections of the world's majority, as far as in the macroscopic result of global carbon emission.
By definition, the Accelerated Abatement Case (B3) goes along with the IPCC Accelerated Policy Scenario, toward 2.7 Gt-C per year in the year 2050. To see how this will be achieved, we compare the Supply-side Measures Case (A3), which realizes the global emission at 6.6 Gt-C per year in 2050, and the Demand-side Measures Case (Bl) , which shows 7.0 Gt-C per year. In the year 2010, however, the case (B l ) reaches 7.0 Gt-C per year, which is lower than 7.9 Gt-C per year reached in case (A3).
Generally, i t is difficult or even impossible to separate explicitly the effectiveness of supply- side and demand-side measures in analyses using macroscopic models like ours. Here we suggest, a t least, that the demand-side measures can play a practical and effective role in controlling the global carbon emission in the short term (e.g., until 2010), although the effectiveness of them does not go further (i.e., the emission in the case (B l ) cannot be substantially reduced after 2010). Meanwhile, supply-side measures, such as wide-scale development and utilization of nuclear energy and accelerated introduction of renewable energy sources, will need a couple of decades to demonstrate their powerful abatement abilities. The practical approach for carbon emission control, therefore, will be to take steady steps to advance R&D technology starting today, while carrying out the enhanced conservations and efficiency improvements in the near term.
The influence of nuclear moratorium varies depending on the final demand structure. In case (A2), the carbon emission in 2050 is evaluated as 14.5 Gt-C per year, which is 15% higher than the Base Case (Al) ; the case (B2) (8.0 Gt-C per year) shows an 11% increase from the case (B l ) (7.0 Gt-C per year.)
The enhanced conservation and efficiency improvements in Scenario (B) are expected to mitigate the impacts in the case where the nuclear moratorium policy is put into practice, compared with those based on the scenario (A). The degree t o soften the impacts, however, is too small to offset the increase of the emission. However the efforts of the end-users are not enough; and we anticipate that the implementation of the nuclear moratorium policy on a global scale will result in a 10% or more emission increase.
4.3 Factorial Analysis of C02 Emission Reduction
As stated in the often-cited Kaya paper,' carbon dioxide emission in a specific region or country can be expressed as a product of the following three factors:
C 0 2 = (C02/Energy) x (Energy/GNP) x GNP .
Let X = C02/Energy and Y = Energy/GNP. Then X i s an indicator of the carbon intensity of energy supply and Y is an indicator of energy intensity of economy or a reverse indicator of energy efficiency. The lower these two indicators, the less C 0 2 emission per unit of economic activity. The following relation between the changing rates of these three factors is derived from equation (4.1):
'Y. Kaya paper presented at EIS/RSWG/IPCC Meeting, Geneva (May, 1989).

A 2 : Nuclear Moratodum A 3 : Supply - slde Measures
B 1 : Demand - sMe Measures
B 2 : Nuclear Moratodum Plus Demand - side Measures
B 3 : Accelerated Abatement
IEW 1900 Poll ( Median + 1 S.D. ) IPCC ( a ) Buslness -as -Usual (2030 H )
( b ) Low emlsslons ( 2060 L ) . . - ( c ) Accelerated pdldes ( 21 00 )
Figure 4.1: Global energy-related C 0 2 emissions.

Table 4.4: Dynamics of structural changes, Base Case.
1990 2010 2050 Carbon emissions (Gf- C/yr) (%/yr) (Gt- C/Y r) (%/Y r) (Gt- C/Y r)
Total 6.30 1.43 8.37 1.04 12.64 Developed 4.07 0.58 4.57 0.50 5.58 Japan 0.25 0.30 0.26 -0.65 0.20 Developing 1.98 2.95 3.54 1.67 6.86
Prima y enetyy (Gfoe) (%/Y r) (Gt 0 4 (%/Y r) (Gtoe) Total 8.58 1.70 12.02 1.12 18.80 Developed 5.74 0.91 6.88 0.45 8.24 Japan 0.46 0.50 0.51 -0.15 0.48 Developing 2.38 2.38 4.63 1.96 10.08
C/E (t- C/t oe)) (%/y r) (C/E ( f - C / f oe)) (%/y r) (G/E (t - C/t oe)) Total 0.73 -0.26 0.70 -0.09 0.67 Developed 0.7 1 -0.33 0.66 0.05 0.68 Japan 0.53 -0.20 0.51 -0.50 0.42 Developing 0.83 -0.42 0.76 -0.29 0.68
(E/GNP (E/G NP (E/G N P (toe/US$SO)) (%/yr) ( f oe/US$SO)) (%/yr) (toe/US$SO))
Total 0.53 -0.73 0.46 -1.10 0.30 Developed 0.52 -1.27 0.40 -1.40 0.23 Japan 0.31 -2.18 0.20 -1.00 0.13 Developing 0.69 0.31 0.73 -1.36 0.42
In short, the growth or reduction rate of C02 emission can be analyzed by assessing the rates of changes of three factors; X, Y, and GNP.
According to NakiCenoviC: primary energy intensity (including biomass energy) per constant GDP declined historically a t an average rate of 1% per year; however, the rate has improved at rates of 2% to 3% per year since the early 1970s. Yamaji et aL3 analyzed, by country, the changes of X and Y after the first oil crisis. I t was observed that most of the developed countries have improved both indices by from 1% to 2% annually - with the notable exception of Japan (where the improvement of energy intensity was as high as 3% per year) and F'rance and Sweden (both of which reduced carbon intensity by about 3% per year).
Tables 4.4 and 4.5 show the analysis of Xand Yin the results for the Base Case (Al) and the Accelerated Abatement Case (B3), for the periods of 1990-2010 and 2010-2050. The changes of the two indices are illustrated in Figure 4.2.
In the Base Case (Al), the annual average improvement rate of global energy intensity is roughly 1% per year during the period of 2010-2050, with a remarkable exception in the developing region where the energy intensity may increase at least in the short term until the year 2010, due to economic development. Meanwhile, the annual average improvement rate of carbon intensity worldwide is as little as 0.1% per year over the whole period. This shows the importance of energy conservations and efficiency improvements as the priority measures for global carbon emission control in a practical sense.
In order to promote maximum global carbon emission reductions, it is necessary to in- crease both figures. In the Accelerated Abatement Case, the remarkable de-carbonization is implemented worldwide by as much as 3% per year up to the year 2050. Although energy con-
'N. NakiCenoviC (1992), Energy Strategies for Mitigating Global Change, Working Paper WP-92-1, IIASA, Laxenburg, Austria.
3K. Yamaji, R. Matsuhashi, Y. Nagata, and Y. Kaya (1990), An Integrated System for COz/Energy/GNP Analysis: Case Studies on Economic Measures for C02 Reduction in Japan, paper presented at the Workshop on Economic/Energy/Environmental Modeling for Climate Policy Analysis, Washington, DC.


Table 4.5: Dynamics of s tructural changes, Accelerated Abatement Case.
1990 2010 2050 Carbon emissions (Gi- C/y r) (%/Y r) (Gi- C/Y r) (%/Y r) (Gi- C/Y r)
Total 6.30 0.24 6.60 -2.23 2.68 Developed 4.07 -0.30 3.83 -2.67 1.30 Japan 0.25 -0.10 0.24 -3.41 0.06 Developing 1.98 1.23 2.53 -1.61 1.32
Primary energy (Gioe) ( % / ~ r ) (Gtoe) (%/Yr) (Gioe) Total 8.58 1.32 11.15 1.08 17.16 Developed 5.74 0.37 6.18 0.22 6.74 Japan 0.46 0.24 0.49 -0.42 0.41 Developing 2.38 3.22 4.49 2.02 10.01
(C/E (i- C/ioe)) (%/y r) (C/E (i- C/ioe)) ( y r) (C/E (2- C/ioe)) Total 0.73 -1.07 0.59 -3.28 0.16 Developed 0.71 -0.67 0.62 -2.88 0.19 Japan 0.53 -0.35 0.49 -3.00 0.15 Developing 0.83 -1.93 0.56 -3.57 0.13
(E/GNP (E/GNP (E/GNP (ioe/US$SO)) (%/y r) (ioe/US$SO)) (%/yr) (toe/US$SO))
Total 0.53 -1.11 0.43 -1.14 0.27 Developed 0.52 -1.80 0.36 -1.63 0.19 Japan 0.31 -2.42 0.19 -1.27 0.11 Developing 0.69 0.16 0.71 -1.30 0.42
servation should be promoted as well, the improvement rate remains roughly 1% per year. To achieve this global de-carbonization, the developing region must improve its carbon intensity even faster than the developed region. Yamaji et point out that de-carbonization has not occurred faster than 3% per year since the first oil crisis except in France and Sweden; these two countries have benefited from rapid restructuring of the energy supply through intensive development and utilization of nuclear energy. The Accelerated Abatement Case requires the developing region t o construct advanced energy supply systems while dealing with the rapid population increase, the fast economic growth, and an energy consumption increase. Obviously, this cannot be achieved by the developing region alone. Thus, the developed region must rec- ognize the need t o participate in economic and social developments, as well as carbon emission abatements, in the developing region.
4.4 Consideration on Equity
Tables 4.6 and 4.7 list the per capita indices of the Base ~ & e (A l ) and the Accelerated Abate- ment Case (B3).
According t o NakiCenoviC,' the per capita carbon emission in the year 1986 varies among countries, with the highest of roughly 5 tons per capita in the USA and with the lowest in some developing countries (as much as 10 times lower than in the USA).
l?ujii6 analyzed the increase of observed atmospheric carbon content over many years, and concluded that the developed countries have contribited more to global emission than is seen in their current share. He extended the analysis to future emission quota, which were assessed
'K. Yamaji, R. Matsuhashi, Y. Nagata, and Y. Kaya (1990), op. cit. 'N. Nakitenovit (1992), Energy Strategies for Mitigating Global Change, Working Paper WP-92-1, IIASA,
Laxenburg, Austria. 'Y. Fujii (1990), An Assessment of the Responsibility of for the Increase in the COz Concentration and
Inter-generational Carbon Accounts, Working Paper WP-90-55, IIASA, Laxenburg, Austria.

Table 4.8: Equity obstacles for global cooperation, Base Case. 1990 2010 2050
C/capita (t- C/person) (%/Y r) (1-C/person) ( y ) (2-C/person) Total 1.19 -0.06 1.17 -0.02 1.16 Developed 3.46 0.04 3.49 0.21 3.80 Japan 2.01 -0.02 2.00 -0.48 1.65 Developing 0.49 1.14 0.62 0.44 0.74
Developed/Developing M 7.00 w 6.00 a 5.00
E/capit a (toe/person) ( y ) (toe/person) (%/yr) (toe/person) Total 1.62 0.20 1.68 0.07 1.73 Developed 4.88 0.37 5.25 0.16 5.61 Japan 3.79 0.18 3.92 0.03 3.97 Developing 0.59 1.57 0.81 0.73 1.09
Table 4.7: Equity obstacles for global cooperation, Accelerated Abatement Case. 1990 2010 2050
C/cap ita (t-C/person) ( y ) (t-C/person) ( r ) (2-C/person) Total 1.19 -1.24 0.92 -3.25 0.25 Developed 3.46 -0.84 2.92 -2.94 0.88 Japan 2.01 -0.42 1.85 -3.23 0.50 Developing 0.49 -0.54 0.44 -2.80 0.14
Developed/Developing 7.00 a 7.00 a 6.00
E/cap ita (toe/person) ( y ) (toe/person) (%/yr) (toe/person) Tot a1 1.62 -0.18 1.56 0.03 1.58 Developed 4.88 -0.17 4.71 -0.07 4.58 Japan 3.79 -0.07 3.73 -0.24 3.39 Developing 0.59 1.42 0.79 0.79 1.08
Developed/Developing w 8.00 w 6.00 a 4.00
even though the quota savings of the developing countries in the past may have been offset by the explosive increase of their populations. In the future they may appeal for having the same quota, at least, as the developed countries.
In Tables 4.6 and 4.7, the current discrepancy of per capita carbon emission between the developed and developing regions is estimated to be a factor of seven. If the developed region reduced their per capita emissions to the level observed in the developing region, the average world level would be 60% lower than the current level and, consequently, would fulfill the target level of 60% reduction of the total global emission.
This discrepancy, however, does not disappear by the year 2050 in either the Base Case or Accelerated Abatement Case: 5 times in the former and 6 times in the latter, though the absolute levels are different. On the other hand, the per capita primary energy consumption, which shows a discrepancy of 8 times at present, is evaluated as 5 and 4 times in 2050, respectively.
Even though the inequality of the energy consumption shows more improvement in the Accelerated Abatement Case than in the Base Case, the inequality of the carbon emission gets worse, at least superficially. Since this phenomenon results from an enhanced supply of non- carbon clean energy in the developing region in the Accelerated Abatement Case, possibly with technology transfer from the developed countries, it is not necessarily an unfavorable outcome for the developing region. Here we point out, however, that the difficulty of leading all the countries to a reasonable level of impartiality in a given time horizon is an obstacle which cannot be overlooked.

4.5 Concluding Remark
Although the main stage of society's fight against global warming will shift to the developing region in the early 21st century, the main actors will remain in the developed countries.
To implement a global development strategy, however, it looks like it will be crucial to establish an appropriate institutional scheme to enable smooth transfer of technologies and financial resources from the developed region to the developing region, as well as to encourage the developing countries to participate in international negotiations and agreements.

Chapter 5
Economic and Inst it ut ional Considerations of a Global Energy/C O2 Policy
5.1 Energy-Savings and C02 Reduction Potentials
In this chapter we are going to touch on some general problems of cost-efficient approaches to a global C02 reduction strategy. Many aspects of the chapter require more detailed discussions, improvements, and perhaps even changes. The results at this stage are merely suggestions to an approach, rather than real recommendations. However, we believe that the discussion of the methodology used as well as the input data applied will be a good incentive for further improvements.
Energy projections and scenarios are especially of interest if they elaborate global strategies for solving the most important long-term problems of human development and progress. As mentioned earlier, one problem that needs to be solved by the worldwide scientific community is the mitigation of global warming and climate changes, which is a result of expanded an- thropogenic activities, expected to increase in the future. A description of how to approach a reasonable long-term strategy for preventing global warming caused by energy systems is a major goal of this chapter. The strategy evaluation includes:
a Identification of possible measures that will help to reduce C02 emissions directly by decreasing fossil fuel consumption or indirectly by removing C02 from flue gases and storing it in natural reservoirs or in the deep sea or by stimulating natural processes of C02 absorption (e.g., afforestation and marine biota).
Evaluation of reduction potentials for each measure, taking into account the availability and maturity of different technology options and their penetration rate depending on the time parameter and efficiency rates.
Selection of the most efficient sets of measures for the globe as a whole or for different regions which could provide achievements for specific goals in climate protection (for ex- ample, measured by the C02 reduction percentage within a given time period or by the time span needed to achieve the C02 sustainable state, when C02 releases are practically balanced with the absorption capacity of natural sinks, with least costs).
Because of the study's orientation, most attention is given to the measures within energy sys- tems and to those which already have been substantially developed and could make a remarkable contribution to the solution within the medium-term future (until 2010).
Two factors will play a leading role in the reduction of COz emissions within the time period selected for the analysis:

Energy conservation by economic structural changes and efficiency improvements, partly, by social behavioral changes; and
Implementation of cleaner and less-carbon content fuels and energy forms than was the practice in the past.
The central point of this section is the approach for estimating the energy-savings potential as a major factor in mitigating COz emissions over the next 20 years. Several approaches for the evaluation of energy savings can be used: based on comparison with the current status or with a certain base case or with a hypothetical case. We selected here the last approach, assuming that the Hypothetical Case can be calculated for a system under development, but with no changes within energy systems over the time horizon of the study (no efficiency improvements, no changes in fuel mix, etc.). This means that the Hypothetical Case corresponds to the situation where we apply only existing technologies and management practices to meet the system's expansion. The introduction of any changes in energy systems leads to the decline in energy demand which can be defined as energy savings. The energy-savings potential is the maximal difference between the Hypothetical Case and other projection cases (in our study the Enhanced Efficiency and Conservation Scenario). Naturally, the real savings are usually less than the potential because of the existence of different obstacles preventing the utilization of the whole potential.
The evaluation of COz reductions and energy-saving potentials was accomplished in two stages: energy end-uses, with the help of the MEDEE-2 model; and energy transformations, with the help of the LEAP model.
When identifying energy-savings potentials for different regions, three types of changes in energy demand are considered: structuml changes, due to shifts in the national economy toward less energy-intensive products and services; technology changes, due to the application of more energy efficient technologies and tools than currently in use; and social changes, due to alterations in lifestyle goals and priorities and transitions to less energy-wasting human behaviors. The cost- benefit analysis of energy-saving potentials is presented in Section 5.2.
5.2 Cost-Benefit Analysis of C02 Abatement Measures
The methodology for a cost-benefit analysis of C 0 2 abatement measures includes:
Identification of the scope of application for different new technologies;
Assessment of costs of application of new and improved technologies helping in energy saving and C 0 2 reductions; and
Evaluation of the benefits of energy savings resulting in expenditures due to the introduc- tion of new and improved energy technologies.
The difference between costs and benefits when referring to the quantity of energy saved or COz reduced illustrates the net cost-effectiveness of COz reduction measures:
Net cost per unit of product or service:'
where
'We have not included in the analysis the changes in external costs which are the results of technology applications. But in the future, when the assessments of this factor will be available, this component should also be taken into account in calculating net costa.
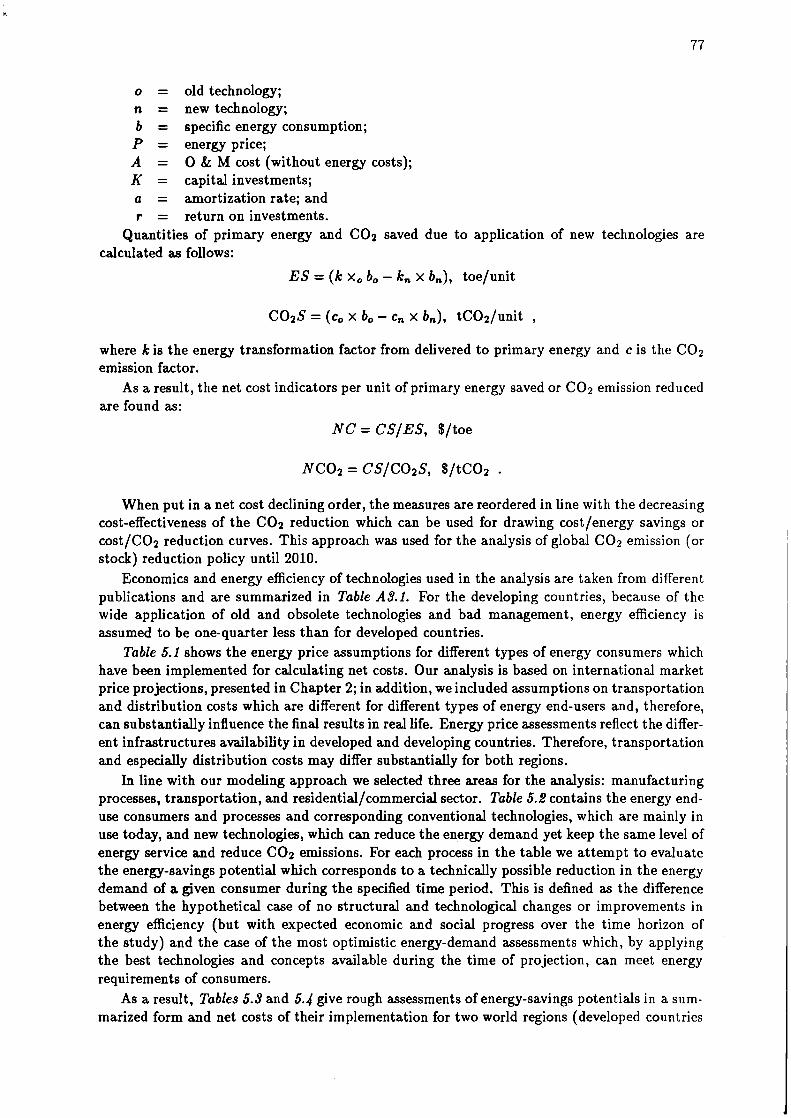
o = old technology; n = new technology; b = specific energy consumption; P = energy price; A = 0 & M cost (without energy costs); K = capital investments; a = amortization rate; and r = return on investments.
Quantities of primary energy and C02 saved due to application of new technologies are calculated as follows:
ES = (k x, b, - k, x b,), toelunit
C 0 2 S = (c, x b, - c, x b,), tCOz/unit ,
where k is the energy transformation factor from delivered to primary energy and c is the COz emission factor.
As a result, the net cost indicators per unit of primary energy saved or C02 emission reduced are found as:
N C = CSIES, $/toe
When put in a net cost declining order, the measures are reordered in line with the decreasing cost-effectiveness of the C 0 2 reduction which can be used for drawing cost/energy savings or cost/C02 reduction curves. This approach was used for the analysis of global C 0 2 emission (or stock) reduction policy until 2010.
Economics and energy efficiency of technologies used in the analysis are taken from different publications and are summarized in Table A9.1. For the developing countries, because of the wide application of old and obsolete technologies and bad management, energy efficiency is assumed to be one-quarter less than for developed countries.
Table 5.1 shows the energy price assumptions for different types of energy consumers which have been implemented for calculating net costs. Our analysis is based on international market price projections, presented in Chapter 2; in addition, we included assumptions on transportation and distribution costs which are different for different types of energy end-users and, therefore, can substantially influence the final results in real life. Energy price assessments reflect the differ- ent infrastructures availability in developed and developing countries. Therefore, transportation and especially distribution costs may differ substantially for both regions.
In line with our modeling approach we selected three areas for the analysis: manufacturing processes, transportation, and residential/commercial sector. Table 5. t contains the energy end- use consumers and processes and corresponding conventional technologies, which are mainly in use today, and new technologies, which can reduce the energy demand yet keep the same level of energy service and reduce C 0 2 emissions. For each process in the table we attempt to evaluate the energy-savings potential which corresponds to a technically possible reduction in the energy demand of a given consumer during the specified time period. This is defined as the difference between the hypothetical case of no structural and technological changes or improvements in energy efficiency (but with expected economic and social progress over the time horizon of the study) and the case of the most optimistic energy-demand assessments which, by applying the best technologies and concepts available during the time of projection, can meet energy requirements of consumers.
As a result, Tables 5.9 and 5.4 give rough assessments of energy-savings potentials in a sum- marized form and net costs of their implementation for two world regions (developed countries

Table 5.1: Energy price assumptions for 2010 (dollars in 1980 per unit).
International Processing Distribution Total con- market price costs costs sumer price
Developed countr ies Oil products (toe)
Motor fuels Heating oil Fuel oil
Power plants Industrial consumers Res. & comm. sector
Natuml gas (1000 m3) Power plants Industrial consumers Res. & comm. sector
C w l (tee) Power plants Industrial consumers Res. & comm. sector
Electricity (k Wh) Industrial consumers Res. & comm. sector
Developing countr ies Oil products (toe)
Motor fuels Heating oil Fuel oil
Power plants Industrial consumers Res. & comm. sector
Natuml gas (1000 m3) Power plants Industrial consumers Res. & comm. sector
Coal (tee) Power plants Industrial consumers Res. & comm. sector
Electricity (k Wh) Industrial consumers - - - 0.14 Res. & comm. sector - - - 0.24
Source: International Energy Workshop (1991), June 18-20, IIASA, Laxenburg, Austria; Working Consulting Group (1987), International Natural Gas Market, Working Paper WP-87-102, IIASA Laxenburg, Austria.

Table 5.2: Application of new energy-savings technologies at end-use.
Sector Conventional technolonv New technolonv Thermal processes Industrial furnace Oil-fired industrial furnace Insulation; new gas-fired industrial furnace;
electric furnace
Steam, space heating, and Coal-fired boiler; Fluidized bed boiler; gas-fired condensed-type hot water production oil-fired boiler boiler; steam cogeneration; gas turbine with
cogeneration; heat pumps; solar; reduction of thermal losses
Metallurgical coke Conventional blast oven Efficiency improvements by 10%-30%
Specific electricity Lighting Incandescent lamps New lamps with higher (3-5 times more) Electric motor Conventional electric motor efficiency; electric motor with improved
efficiency (by 10%-15%)
Transportation Motor fuel Conventional engine Efficiency improvements by 10%-30%;
replacement of motor fuel by electricity
Electric Conventional electric motor Efficiency improvement (by 10%-15%)
Sources: Manufacturn - J.H. Gibbons, P.D. Blair, and H.L. Gwin (1989), Strategies for Energy Use, Scientific Amer- ican, September; L. Nilsson (1991), Energy Efficiency in Industrial Sector, ESETT'91 Conference, Milan, October 21-25; K. Blok, Physical Modeling of Energy Demand; T. Kashiwagi (1991), Current Technology on Efficient Use of Energy and its Outlook, SPEC Meeting, Tokyo, February 27-28. Household/Service - A. Gadgil, A. Rosenfeldt, and L. Price (1991), Making the Market Right for Environmentally Efficient Technologies, US Building Sector Suc- cesses that Might Work in Developing Countries and Eastern Europe, ESETT'91 Conference, Milan, October 21-15; L. Schipper and D. Hawk (1991), More Efficient Household Electric Use, Energy Policy, April; Grazer Energie Info (1991), Stromverbranch von Hauahaltsgeriten; J. Norgard (1979), Improved Efficiency in Domestic Electricity Use, Energy Policy, March. Tmnsportation - D. Bleirss (1991), Efficiency Improvements and Fuel Substitution in the Transport Sector, ESETT'91 Conference, Milan, October 21-25; M. Walsh (1990), Global Trends in Motor Vehicle
, Use and Emissions, Annual Review of Energy 15:217-43; L. Schipper, S. Meyers, R. Horwarth, and R. Steiner (1991), Historic Trends in Transportation, ESETT'91 Conference, Milan, October 21-25; A. Schifer (1992), Carbon Emissions in the Passenger Transport Sector: Technology and Alternative Fuels, Working Paper WP-92-04, IIASA, Laxenburg, Austria. Electricity Sector- E. Bertz (1991), New Boiler Designs for Utility Service, Electrical World, May; G. Braun (1991), Improving Efficiency in Electricity Generation: Advanced Conversion Systems, ESETT'91 Conference, Milan, October 21-25.
and developing c~untr ies) .~ Tables A9.2 to A9.9 contain calculated energy-savings potentials at the end-use stage for 10 world region^.^
The analysis of energy-savings potentials for developed countries in 2010 shows that it is equal t o more than 40% (over 3,000 Mtoe) of the hypothetical energy demand in that year. The actual utilization of this potential is from 45% in the case of less energy conservation to practically full utilization in the case of energy efficient ways of development and restructuring. The efficiency of energy-savings efforts in developing countries within the time horizon of the study will be less pronounced because of the lower level of the total energy demand (only 20%, about 400 Mtoe, in the Hypothetical Case).
"he numerical values for the net cost assessments need further analysis and clarity. 3For China and other Asian CPCs and the Pacific region, for which we have no MEDEE-2 runs, the potentials
are assessed using the total difference between values of final energy demand for the hypothetical and enhanced conservation cases which were split by end-use processes in accordance with the analogous structures for other regions with a known structure; for example, the data for the other LDCs are used for China and for North Africa and the data for the Middle East for the Pacific region.

Table 5.3: Energy-savings and COz reduction potentials in developed countries in 2010. S a v i n g s
Process Measure Mtoe $It-C Mt-C/Mtoe Million $ Mt-C Electricity
Hydro+otherl ~ u c l e a r ~
NG c-cycle3 NG steam4
Coal steam5 Coal c-cycle6
Household and service Elec. appliances Air cond.'
Lighting8 Elec. motorsg
Space heating Solar lo
ons sump ti on' ' GT+wH/oil12
GT+WH/coal13 FBC boiler14 NG boiler''
Heat pump16 Manufactur ing Electricity Lighting1' Ind. furnace New types18
~nsulat ion '~ Consump t ion2'
Steam Consumption2' Space heat G T + w ~ / o i l ~ ~ Electricity Elec. motor23 Steam G ~ + w H / o i l ~ ~
Steam-~ogen.~' Motor fuel Elec. ~ e n e t . ~ ~ Ind. furnace Elec. ~ e n e t . ~ ' Space heat C o n ~ u m p t i o n ~ ~ Steam G T + W ~ / c o a l ~ ~ Space heat G T + ~ H / c o a l ~ ~ Steam FBC boiler3' Space heat FBC boiler32
NG boiler33 Heat pump"
Coke 30% savings3' Motor fuel Engines6
(30% impr.) Transpor tat ion Electric Elect. motor3' Freight Elect. penet.= Pass. intercity Elect. ~ e n e t . ~ ' Pass. urban Elect. ~ e n e t . ~ ' Freight Engine (30%)41 Pass. intercity Engine ( 3 0 % ) ~ ~ Pass. urban Engine (30%)43 Tot a1 ( rounded)

NOTES: Measures for saving energy (and reducing C 0 2 emissions): ' Wider application of hydro and other renewables in electricity generation. 2Wider application of nuclear energy. 3Natural gascombined cycle power plant. 4Natural gasfired power plant. 5Coal-fired power plant. %tegrated coal-gasification combined cycle power plant. 7 ~ e w types of air conditioners. sNew types of lighting in residential/commercial sectors. gNew types of electric motors in the residential/commercial sectors. ''Solar collectors.
Improved insulation, better management, etc. 12Cogeneration with gas-turbine and wasteheat boiler replaces old liquid fuel boilers in the residen- tial/commercial sectors. 13The aame replaces old coal-fired boilers. 14Coal-fired fluidized bed boiler in residential/commercial sectors. 15New type of natural gas boiler with condensing water in the flue gases in residential/commercial sectors. 16Heat pumps in the residential/commercial sectors. " ~ e w improved lighting systems in the manufacturing sector. ''New improved industrial furnaces. lg Better furnace insulation. 20Conservation in industrial furnaces due to structural changes. 21Conservation in industrial steam consumption due to structural changes. 22Cogeneration with gas turbine and wasteheat boiler replaces old liquid fuel boilers in the manufactur- ing sector. 23New improved electric motors. 24Cogeneration with gas turbines and waste-heat boilers replaces liquid fuel in steam production in the manufacturing sector. 25Steam cogeneration. 26~lectricity replaces motor fuel in manufacturing processes. 27Electricity use in industrial furnaces. 2sConservation in low-temperature heat consumption due to structural changes and better insulation of buildings. 2gCogeneration with gas turbine and waste-heat boiler replaces coal in steam production in the manu- facturing sector. SOThe same for low-temperature heat. 31Coal-fired fluidized bed boilers for steam production in the manufacturing sector. s2The aame for low-temperature heat. =New improved natural-gas-fired boilers for space heating in the manufacturing sector. 34Heat pump use for space heating in the manufacturing sector. 3530% coke savings. 3630% motor engine improvements in the manufacturing sector. 37New improved electric motors for electric drive in transportation. -Electricity expansion for freight transportation. 39The same for passenger intercity railway transportation. 40The same for urban transportation. 4130% motor engine improvements in transportation. 42The aame in passenger intercity transportation. 43The aame in urban traffic.

Table 6.4: Energy-savings and COz reduction potentials in developing countries in 2010. S a v i n g s
Process Measure Electricity
~ydro+other' Nuclear2
NG c-cycles NG steam4
Coal steam5 Coal c-cycle6
Household a n d service Elec. appliances Air ~ o n d . ~
Lightin$ Elec. motorsg
Space heating Solar lo
Consumption" GT+WH/oil12
G ~ + W ~ / c o a l ' ~ FBC boiler14 NG boiler15
Heat pump16 Manufactur ing Electricity Lighting" Ind. furnace New types1'
~nsulat ion'~ C o n s u r n p t i ~ n ~ ~
Steam Consumption2' Space heat G ~ + w H / o i l ~ ~ Electricity Elec. motor23 Steam G T + W H / O ~ ~ ~ ~
Steam-~ogen.~' Motor fuel Elec. ~ e n e t . ~ ~ Ind. furnace Elec. ~ e n e t . ~ ~ Space heat Consumption2' Steam G T + w H / ~ o a l ~ ~ Space heat G T + w ~ / c o a l ~ O Steam FBC boilerg1 Spsce heat FBC boilerg2
NG boilers3 Heat pump"
Coke 30% savingsg5 Motor fuel Engineg6
(30% impr.) Transport at ion Electric Elect. motorg7 Freight Elect. penet.= Paes. intercity Elect. ~ e n e t . ~ ' Pass. urban Elect. ~ e n e t . ~ ' Freight Engine (30%)~' Pass. intercity Engine (30%)42 Pass. urban Engine (30%)43 Total ( rounded)
NOTE: See notes to Table 5.3.
Mtoe Million $

Both potentials are measured relative to the Hypothetical Case. The potential for energy savings in final energy in 2010 compared with the Dynamics-=-Usual Scenario is equal to 850- 900 Mtoe globally, of which about 75% belongs to developed countries.
Figures 5.1 and 5.2 illustrate the results in a graphical form after reordering the results presented in Tables 5.3 and 5.4 in line with the diminishing cost per unit of carbon removed.
In fact, cost evaluations show that the C02 reduction potential in 2010 in energy systems of developed countries is equal to 11 Gt of C02 (3 Gt-C) or approximately 40% of the COz emissions in the Hypothetical Case, of which at least half (or 20%) could be reduced with the negative net cost, i.e., even with some increases in the GNP growth.' The potential in developing countries is several times less and equal only to 3.7 Gt of COz (or 1.0 Gt-C) (22% of the C 0 2 emissions in the Hypothetical Case); 15% can be saved with the negative net cost.
The cost-benefit analysis has shown that a C 0 2 reduction potential exists even for the rela- tively short time horizon of the study (until 2010). Of course, the degree of its implementation will depend on the expenditures which the world or some regions (or some nations) will be able to afford or agree on to mitigate global warming. In Section 5.3, an attempt is made to iden- tify an optimal global policy for C02 reduction until 2010 using the energy/C02 cost-benefit analysis.
5.3 Attempts at Identifying an Optimal C02 Reduction Strategy
The MARS model was used to find an optimal C02 abatement strategy until 2010 (for a brief model description see Appendix 1). The cost analysis described in the previous sections provides a basis for the optimization. To meet the requirements of the algorithm, the total number of measures was divided into 15 groups with not more than 12 policy actions for each of them. No constraints on different resources were introduced. The Hypothetical Case with no changes and improvements in the energy system was applied as a reference, with expected annual emissions of about 12.2 Gt in 2010 and a carbon accumulation of 860 Gt. To increase the model's flexibility, the large measures were divided into three equal groups with different specific costs oscillating around the average d u e by f 30%.
The optimization results are presented in Figure 5.3. The strategies on the curve are optimal in the sense that they guarantee the given C02 reductions until 2010 with minimum costs. The approximate positions of the scenarios are shown on the optimal curve, although we must be cautious in interpreting the results because in the scenario simulations the measures are indirectly present.
Table 5.5 contains the list of major energy-savings measures used in the analysis with the MARS model which, according t o our projections, may result in the achievement of the Base Case (Al) status in 2010.
Sometimes i t is important to present the optimization results relative to the Base Case but not relative to the Hypothetical Case, as done in the MARS model. Figure 5.3 provides the possibility for such recalculations with the results summarized in Table 5.6.
As follows from Table 5.6, switching from the Dynamics-as-Usual Scenario t o a more energy- efficient and less-COz-emission policy will require additional costs which are equal to 0.2%- 0.4% of the cumulative GNP produced globally. The Supply-side Measures Case (A3) seems to guarantee the same (or very close) level of expenditures but with C 0 2 emissions of more than 5% less than the Base Case. A more effective C02 abatement policy will require, of course, additional costs in energy conservation and efficiency improvements and changes in the primary energy mix, which in some cases could be overlapped by savings on the expansion of energy production and the use of old and conventional technologies. Additional technology
'This share is measured in relation to the Hypothetical Case. In Section 5.3, the analysis is given relative to the Base Case.

Figure 5.1: Cost-effectiveness of C 0 2 reduction measures in 2010 for developed countries.
Figure 5.2: Cost-effectiveness of C 0 2 reduction measures in 2010 for developing countries.
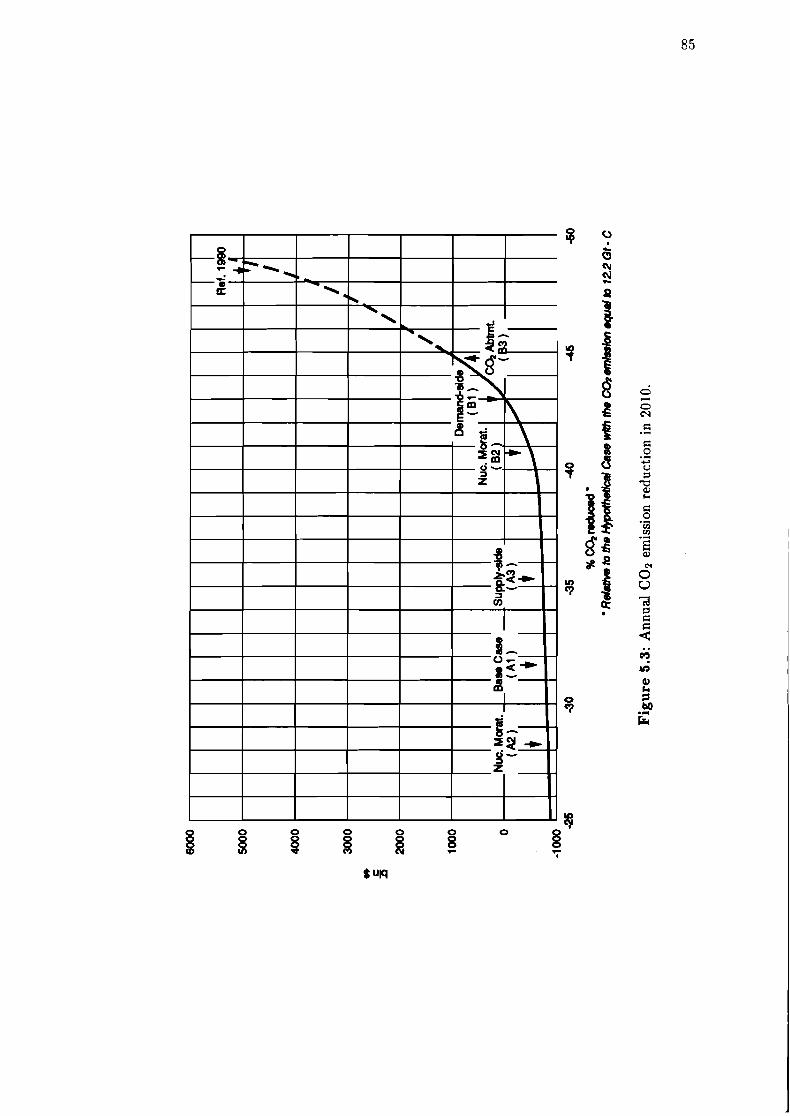
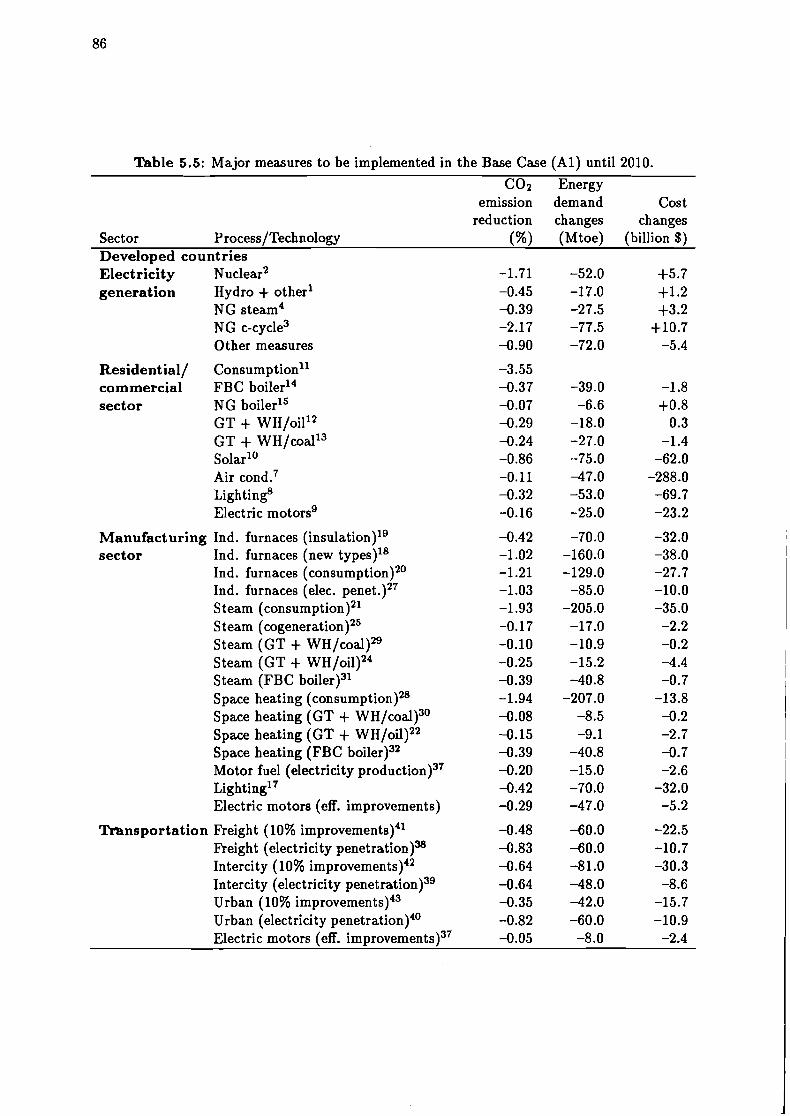
I'able 5.5: Major measures to be implemented in the Base Case (Al) until 2010.
C 0 2 Energy emission demand Cost
reduction changes changes Sector Process/Technology (%) (Mtoe) (billion $) Developed countries Electricity Nuclear2 generation Hydro + other1
NG steam4 NG c-cycle3 0 ther measures
Residential1 Consumption" commercial FBC boiler14 sector NG boiler15
GT + WH/oil12 GT + WH/coal13 Solar lo
Air ~ o n d . ~ Lighting8 Electric motorsg
Manufactur ing Ind. furnaces (insulation)lg sector Ind. furnaces (new types)18
Ind. furnaces (consumption)2o Ind. furnaces (elec. ~ e n e t . ) ~ ~ Steam (con~umption)~' Steam (~ogenera t ion)~~ Steam (GT + W H / ~ o a l ) ~ ~ Steam (GT + WH10i l )~~ Steam (FBC boiler)31 Space heating ( con~umpt ion )~~ Space heating (GT + WH/~oa l )~ ' Space heating (GT + WH10i l )~~ Space heating (FBC boiler)32 Motor fuel (electricity p r o d ~ c t i o n ) ~ ~ Lighting" Electric motors (eff. improvements)
Trbnsportat ion Freight (10% improvements)41 Freight (electricity penetration)38 Intercity (10% improvement^)^^ Intercity (electricity penetrat i~n)~' Urban (10% improvement^)^^ Urban (electricity penetrat i~n)~' Electric motors (eff. improvement^)^^

' hb le 5.5: Continued. C02 Energy
emission demand Cost reduction changes changes
Sector Process/Technology (%) (Mtoe) (billion $) Developing countries Electr icity Nuclear2 generat ion Hydro + other1
NG c-cycle3 Other measures
Residential/ C ~ n s u m p t i o n ~ ~ commercial FBC boiler14 sector NG boiler15
GT + WH/oil12 Solar lo
Air ~ o n d . ~ Lighting8 Electric motors (eff.
Manufacturing Ind. furnaces ( ins~lat ion) '~ sector Ind. furnaces (new types)18
Ind. furnaces ( cons~mpt ion )~~ Steam (cont ~ m ~ t i o n ) ~ ' Steam (cogenera t i~n)~~ Steam (GT " W H / ~ o a l ) ~ ~ Steam (GT + WH10i l )~~ Steam (FBC boiler)31 Space heating ( cons~mpt ion )~~ Space heating (GT + W H / ~ o a l ) ~ ~ Space heating (FBC boiler)32 Electric motors (eff. improvement^)^^
Transpor tat ion Freight (10% improvement^)^' -0.09 -1 1 .O -5.0 Intercity (10% improvement^)^^ -0.09 -11.0 -5.0 Intercity (electricity penetration)= -0.06 -4.5 +1.6 Urban (10% improvement^)'^ -0.32 -41.0 -18.6
Total ( rounded) -31.50 -2,905.0 -839.0 NOTE: See notes to Table 5.3

Table 5.6: C 0 2 abatement strategies relative to the Base Case (Al), 2010.
Annual Primary Additional Percentage emissions energy costs of
Strategy/Option (%I (%) (billion $) GNPa Dynamics-as-Usual Base Case (Al) 100.0 100.0 0 0 Nuclear Moratorium (A2) 104.3 100.4 -20 0 Supply-side Measures (A3) 94.4 105.5 +40 0 Enhanced Efflciency a n d Conservat ion Demand-side Measures (B 1) 83.0 87.3 +855 0.20 Nuclear Moratorium (B2) 86.4 86.4 +300 0.07 Accelerated C 0 2 Abatement (B3) 80.2 89.6 +1,655 0.40
aCumdative global GNP until 2010 is equal to $420 trillion.
measures (except those in economic restructuring and social changes) to be implemented in the Accelerated C 0 2 Abatement Case (B3) are summarized in Table 5.7. The maximum C 0 2 reduction in Case (B3) (compared to the Base Case) is expected to be equal to 20% in 2010. However, this reduction can be achieved only by additional expenditures of about $1.7 trillion which corresponds t o 0.4% of the global cumulative GNP produced over the period 1990-2010. Meanwhile, if implemented, the Accelerated C 0 2 Abatement Case would result in C 0 2 emissions in 2010 of about 7% higher than today's level (Figure 5.3).
5.4 Cos ts for the Implementation of a COz Reduction Policy
It is quite natural to assume that the transition from a normal development to one characterized by accelerated C 0 2 abatement will result from different efforts. For simplicity, we can presume that these efforts could be measured by the fraction of GNP spent on the energy systems includ- ing cumulative investments in energy production, conversion, transportation and distribution, and end-use over the time horizon of the study. The results of the MEDEE and LEAP modeling runs were used for the assessment of cumulative expenditures required over the period 1990- 2050 for the realization of the scenarios described (taking into account the different lifetimes for energy te~hnologies).~ Table 5.8 lists the summarized results of the model calculations. Com- paring the total expenditures by scenarios/cases and regions, the efforts can be summarized in the following way:
Total investments required by energy systems strongly depend on efforts in energy conser- vation and efficiency improvements. As a rule, the Enhanced Efficiency and Conservation policies are about onethird less capital intensive than the Dynamics-as-Usual policies, in spite of the common belief that a C 0 2 abatement policy will inevitable result in increased costs for society.= However, within the scenarios the cases differ by 10%-15% in favor of policies requiring less efforts in energy systems restructuring. As a result, the investments in the Base Case (A l ) and Accelerated C 0 2 Abatement (B3) differ only by about 15% in favor of the latter.
As usual, total global investments spent on the reconstruction of energy systems over the next several decades will keep, on the average, within 3%-4% of global GNP produced
'The investments are expressed in US dollars in1980 and totaled simply without discount. 'In this assessment, all direct expenditures in the energy sector are taken into account without, however,
any of the indirect measures required for changing the attitudes toward more energy efficient and conserving lifestyles and societiw, such as education, advertisement, and incentive-inducing policies. If these measures are incorporated in the calculation in an appropriate way, then strategies for stronger abatement will have increasing expenditures a s shown here.

Table 5.7: Additional technology measures required for the Accelerated C02 Abatement Case (B3) until 2010 (compared withthe Base Case in Table 5.5).
C02 Energy emission demand Cost
reduction changes changes Sector Process/Technology (%) toe) (bi l l ioh~) Developed countries Electricity Nuclear2 generation Coal steams
Coal c-cycle6 NG steam4
Residential/ Heat pump16 commercial NG boiler15 sector
Manufacturing Coke (30% savings)35 -0.60 -35.0 +35.0 sector Space heating (heat pump)34 -0.12 -7.6 +2.8
Space heating (NG boiler)15 -0.32 -30.0 +7.0 Motor fuels (30% improvement^)^^ -0.40 -50.0 +29.0
Transportat ion Freight (30% irnpr~vements)~' -0.98 -121.0 +353.5 Intercity (30% improvement^)^' -1.24 -156.0 +464.0 Urban (30% improvement^)^^ -0.63 -78.0 +234.3
Developing countries Electricity Coal steam5 generat ion NG steam
Residential/ FBC boiler14 commercial Heat pump'6 sector GT + HW/coa130
Manufactur ing Coke (30% savings)35 -0.16 -9.0 +9.6 sector Ind. furnaces (electricity
penetrat i~n)~' -1.17 -77.0 +36.2 Space heating (heat -0.09 -5.9 +4.7 Motor fuel (30% improvement^)^ -0.12 -15.2 +31.1
Transportat ion Freight (30% irnpr~vernents)~' -0.18 -23.0 +22.1 Freight (electricity p e n e t r a t i ~ n ) ~ ~ -0.05 -4.0 +1.4 Intercity (30% irnpro~ernents)~~ -0.20 -22.0 +27.1 Urban (30% irnpr~vernents)~~ -0.67 -82.0 +101.0 Urban (electricity p e n e t r a t i ~ n ) ~ ~ -0.91 -66.0 +10.0
Total (rounded) -12.60 -1255.0 +1485.0 NOTE: See notes to Table 5.3.
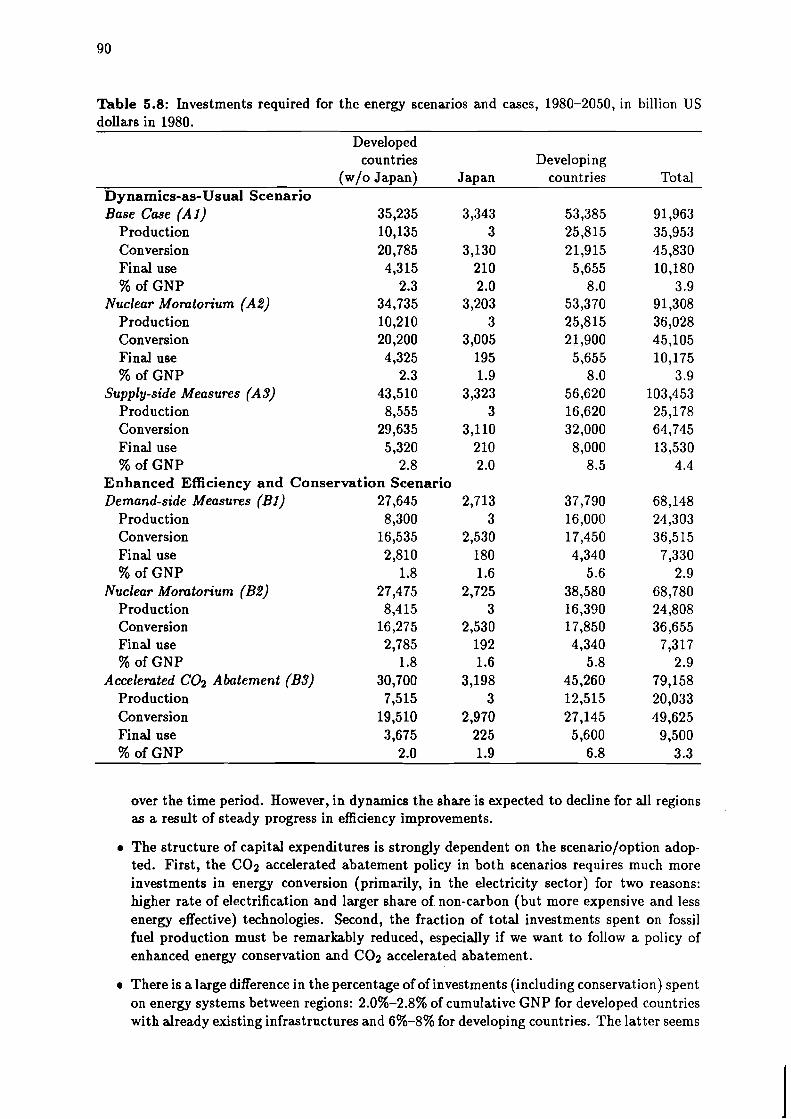
Table 5.8: Investments required for the energy scenarios and cases, 1980-2050, in billion US dollars in 1980.
Developed countries Developing
(w/o Japan) Japan countries Tot a1 Dynamics-as-Usual Scenario Base Case (A1) 35,235
Production 10,135 Conversion 20,785 Final use 4,315 % of GNP 2.3
Nuclear Momton'um (A2) 34,735 Production 10,210 Conversion 20,200 Final use 4,325 % of GNP 2.3
Supply-side Measures (A3) 43,510 Production 8,555 Conversion 29,635 Final use 5,320 % of GNP 2.8
Enhanced Efficiency and Conservation Scenario Demand-side Measures (Bf) 27,645
Production 8,300 Conversion 16,535 Final use 2,810 % of GNP 1.8
Nuclear Momton'um (B2) 27,475 Production 8,415 Conversion 16,275 Final use 2,785 % of GNP 1.8
Accelemted C02 Abatement (B3) 30,700 Production 7,515 Conversion 19,510 Final use 3,675 % of GNP 2.0
over the time period. However, in dynamics the shareis expected to decline for all regions as a result of steady progress in efficiency improvements.
The structure of capital expenditures is strongly dependent on the scenario/option adop- ted. First, the C 0 2 accelerated abatement policy in both scenarios requires much more investments in energy conversion (primarily, in the electricity sector) for two reasons: higher rate of electrification and larger share of. non-carbon (but more expensive and less energy effective) technologies. Second, the fraction of total investments spent on fossil fuel production must be remarkably reduced, especially if we want to follow a policy of enhanced energy conservation and C 0 2 accelerated abatement.
There is a large difference in the percentage of of investments (including conservation) spent on energy systems between regions: 2.0%-2.8% of cumulative GNP for developed countries with already existing infrastructures and 6%-8% for developing countries. The latter seems

alarming because it means that about 30%-40% of total capital available in developing countries over the next decades must be invested in energy systems reconstructions, which will be very difficult to maintain over a long time period. Therefore, the main task of industrialized countries is to provide enough assistance and aid to LDCs which will make it easier for them to bear this burden and help them in achieving (at a minimum) economic and social development.
In conclusion, one general remark should be made. The global long-term environmental problems will not be solved only by efforts undertaken in developed countries; there must be strong involvement of the developing world. However, developing countries faced with many problems will hardly be willing t o share responsibilities for environmental degradation with advanced countries (as it was seen a t the recent Earth Summit in Rio de Janeiro). This idea is illustrated by the different reaction toward environmental issues among industrialized countries (Figure 5.4). Addressing environmental problems starts actually only after reaching some level of prosperity (above $7000-$8000 per capita). Of course, with time this threshold level will be lower as our knowledge of the environment improves. Nevertheless, expected GNP per capita for most of the developing countries until the middle of the next century will still remain lower than this level. Therefore, the only path to the necessary transformations without waiting for catastrophic and irreversible consequences lies in helping developing countries as soon as possible to move to a more environmentally compatible way of development.
5.5 What to Do First?
In addition to the technological options described in this chapter, some institutional measures and arrangements are needed for formulating global strategies. To remove or, at least, weaken the influence of many obstacles preventing global and unified efforts, special programs of coordinated policy measures a t the global and national levels are strongly required. These include fiscal incentives to ensure further economic and social development with less energy requirements and cleaner fuels via technology changes, legislation or regulatory mechanisms to direct changes in the energy mix, and education to enhance public awareness. Substantial changes in current trends and practices should be brought about involving all sectors of society in sharing full responsibility. The approach toward global environmental problems, especially to those with high uncertainty, will not be an easy and fast process. Rather, we must consider the approach as an incremental, iterative, and learning process. The priority actions at the global and national levels are summarized in Table 5.9.
To make these strategies work, concerted efforts are required by individuals, private indus- tries, governments, and international institutions.

Index of structural enviromental impacts* per capita and economic performance level (1970 = 1 1985 = + ) and Change ( --rn )
Aggregated per capita indices of cement production,,energy consumption, crude steel consumption and weight of freight transport (Mean 1970185 = 0)
Gross domestic product per capita (US-$ at 1980 prices and exchange rates)
Suxw: M. Jpn#ko, H. &mh, T. l3amdmg end U. E. Sinnun's, EE#mwnic Simdvrn and Emironmental Impacts, IhsEnvfrmnmYlbl, d(S),lW.
Figure 5.4: Public perception of environmental degradation as a function of the national welfare in industrialized countries (GNP per capita). The index of environmental degradation reflects cement, steel, and energy consumption and freight transportation activity. The trend line (added to the original graph by the authors of this report) shows that only after reaching a certain level of prosperity is it possible to expect effective results in environmental improvements. Is it a universal law of environmental economics?

Area
Policy actions
Marketing guidelines
Educational programs
R&D priorities
Tab le 5.9: Institutional "environmentn for effective implementation of climate-addressed energy strategies.
Actions Nat iona l Level
Introduction of the social cost concept as the criterion for technology selection. Energy demand-oriented instead of today's supply-oriented strategies. Integration of environmental aspects directly into corporate strategic planning and management. Promotion of the utilization of clean and low (or no-carbon) content fuels. Long-term energy programs to outline short-term coordinated actions. Environmentally compatible lifestyle adjustments. Public acceptance/perception of new energy supply options and concepts and active participation in policy debates. Air pollution permits trading as an option t o a global environmentally sound energy policy.
Internalization of external costs of energy prices. Abolition of energy price subsidies where they prevent energy savings and conservation. Introduction of energy/CO2 taxes. Improved education and information systems. Regulatory and public measures t o promote energy efficiency and clean technologies; the right balance between regulation and
incentive must be achieved.
Environmentally oriented educational systems from primary school t o post-graduate programs. Personnel training, especially in developing countries. Public and industry consulting. Mass-media involvement. Science-industry-public cooperation.
Establishment of the total safety of nuclear energy. Development of new transportation and planning approaches for both developed and developing countries which integrate auto-
mobile, bus, highway planning, land-use planning, and other policies to transport people and commodities efficiently. New clean technologies for electricity generation and heat supply and their wide-scale commercialization. Energy-efficient concepts for human settlement planning. Lifestyle changes as a long-term factor of energy conservation. Environmental economics aimed a t external cost evaluations for different energy forms and technologies, taking into
a account local and global effects as well as short-term and long-term impacts and internalization of these components in the energy w
pricing mechanism. Global long-term greenhouse gas reduction strategy.

Area
International framework
Population control
Technology transfer
Financial mechanisms
Table 5.9: Continued. Actions Global Level
Integration of energy goals into social and economic international programs. Global COz convention and trade permits. Global greenhouse gas emission monitoring. Global energy charter to establish the approach to solving long-term global energy problems. Global energy coordination center to provide an effective global energy policy.
Improvements in the social welfare. Education.
New international institutions to encourage and support all uses of energy efficient and clean technologies. New and innovative financing packages that include support for training, spare parts, user education, and development of local
management skill in rural areas. Special care for the property rights for innovative technologies in the energy sector that do not prevent the dissemination of
up-to-date technologies to developing countries (many energy-saving technologies must become public-domain).
Reorientation in energy investments, paying more attention to environmentally benign technologies and options. Fund raising for energy/climate programs, primarily in developing countries. Debt equity and debt-for-nature swaps as options for the resolution of accumulated debts.

Chapter 6
Conclusions
1. The progress made in global energy systems over the next several decades (at least, until the middle of the next century) will be characterized by the following events:
(a) Further energy demand growth, primarily in developing countries;
(b) The steady increase in the importance of energy savings and conservation at all stages of the energy chain from primary energy production to end-use;
(c) Strong constraints on nuclear energy, especially in the near future (at least, until new generations of safer and more cost-effective nuclear reactors are developed, demon- strated, and publicly accepted);
(d) Limited contributions from renewable energies to the energy supply because of their low efficiencies and high costs; and
(e) Continued use of fossil fuels in the global energy supply because of their availability and low costs. However, ecological and climate factors may force humanity to restrict the use of fossil fuels, starting with those that are most harmful to the environment.
Since the mid-1980s, ecological and climate factors have played a more critical role in shaping energy policies in many developed countries. This tendency will continue in the future with logical results in changing the methodologies of energy technology selections and energy policy compilations, and will be followed by new concepts for long-term energy development, primarily oriented toward environmentally benign concepts.
2. The study is based on two scenario simulations:
(a) Dynamics-as- Usual (A), where the rate of social, economic, and technological changes stays the same over the whole time period (until the middle of the next century) and the competition between fuel and energy forms is based primarily on market mechanisms; and
(b) Enhanced Efficiency and Conservation (B), where special measures in addition to the conditions specified in the Dynamics-as-Usual Scenario are applied to promote and improve energy efficiency.
Several options within each energy scenario have been chosen for detailed analysis. The Dynamics-=-Usual Scenario has three options: Base Case (Al), no special constraints on energy systems development and modest introduction of nuclear and renewables resources; Nuclear Moratorium Case (A2), practically freezing nuclear energy at the level projected for 2005-2010; and Supply-side Measures Case (A3), effort in energy conservation applied primarily to the supply side.
The Enhanced Efficiency and Conservation Scenario also has three options: Demand- side Measures Case (Bl), efficiency improvements applied primarily to energy end-uses;

Nuclear Moratorium Case (B2), the Dynamics-as-Usual Scenario together with demand- side measures; and Accelerated C02 Abatement Case (B3), enhanced energy restructuring on both the demand and supply side, targeted to achieve COz emission reductions until 2050 of about 60% below the current man-made carbon dioxide emission level, which (as stated in a recent IPCC report) are required to stabilize concentrations.
The analytical framework of the study consists of two calculation blocks:
(a) Block 1 - long-term global/regional energy/C02 projections with two stages: first, for the simulation of final enetyy demand for 10 world regions with the MEDEE-2 model; second, for the evaluation of the tmnsfonnation sectors and primary energy production and tmdeefor two aggregated regions (developed and developing countries) with the LEAP model. C 0 2 emissions are calculated on the basis of both projections.
(b) Block 2 - the C 0 2 abatement strategy uses the MARS model for the selection of the optimized energy/C02 strategy until 2010.
3. In view of expected trends and changes within the global community over the first half of the 21st century, world energy consumption will increase from 8.6 Gtoe in 1990 to about 10 Gtoe in 2000 and further to 12-24 Gtoe in 2050 (with about 19 Gtoe for the Base Case (A1 ). Results show that the Nuclear Moratorium Cases, (A2) and (B2), have some influence on the primary energy consumption; more often, the consumption level is less in these cases than in the cases with a higher share of nuclear energy because of differences in efficiency coefficients used for converting nuclear electricity into primary energy, even in spite of the fact that coal is assumed to replace primarily nuclear energy in the nuclear moratorium projections. But in the Supply-side Measures Case (A3), primary energy consumption is one-quarter higher than in the Base Case (Al), although final energy demands for both cases are the same. This is explained by the different primary energy mixes projected for both cases with high level of non-carbon technologies (A3), which are characterized by lower conversion factors in these cases than in the cases using fossil fuels. The same situation is observed in the Enhanced Efficiency and Conservation Scenario, although even more pronounced because of larger differences between the Demand-side Measures Case (Bl) (12.3 Gtoe in 2050) and the Accelerated C02 Abatement Case (B3) (17.2 Gtoe). Energy demand in developed countries will likely stay at the current level over the time horizon of the study or may even slightly decline (it is quite possible that in some countries with very high per capita energy demand the reduction of primary energy consumption will start even in the near future). A major part of the growth in world energy demand will be justified by the needs of developing countries to improve their economic and social positions. It is expected that the primary energy demand in developing countries will increase by a factor of 3-5 compared with today's level. The share of developing countries in world energy demand will double from 28% currently to 55%-60% in 2050. These changes mean that within a few decades the burden of the global energy problems will shift from developed to developing countries, creating new political tensions on the world energy scene if proper measures and steps are not undertaken now.
4. World primary energy mix will strongly depend on development strategies applied over the next 50-60 years. In the Base Case of the Dynamics-as-Usual Scenario (i.e., without special constraints on fossil fuels or nuclear energy) coal production may reach 5.0-5.5 Gtoe in 2050, crude oil production will practically remain at the same level or slightly increase (however, with major changes in oil sources), and natural gas production will practically double compared with today's level. The share of non-carbon primary energy resources (nuclear and renewables) will increase from 12% in 1990 to about 25% in 2050. The Nuclear Moratorium Case (A2) will result in substantial increases of coal consumption (up to 7 Gtoe, 27% more than in the Base Case). However, if a strategy for global-warming prevention is to be followed, then the share of fossil fuels in primary energy consumption

must strongly be reduced, even down to 25% by 2050 in the Accelerated C02 Abatement Case (B3) of a 60% C02 emission reduction. Naturally, the most remarkable decrease is expected for coal and crude oil production, which releases much more carbon compared with natural gas production. The future of coal remains extremely uncertain and will strongly depend on the strategy selected: from only 125 Mtoe in 2050 in the Accelerated C 0 2 Abatement Case (B3) to 1.3 Gtoe in the Supply-side Measures Case (A3) or to 3.0 Gtoe in the Demand-side Measures Case (Bl).
5. Electricity maintains its position as the most universal energy carrier in all sectors of end- use, including transportation. The environmental protection goals can be achieved most effectively and with the least costs with the application of electrically driven technologies. Therefore, a strong growth rate for electricity generation is projected in both regions - developed and developing countries. The share of electricity in final energy is currently 14% in the developed region and 10% in the developing region. In both regions this ratio is expected to increase steadily - up to 27% and 23%, respectively. Total electricity generation will increase from about 11 TWh in 1990 to 14-14.5 TWh in 2000 and further to 40-45 TWh in 2050. The developing countries, which now contribute about 19% to total world electricity, will increase their share to 50%-60% in the long-term. The share of nuclear energy is expected to keep its level of 18% over the next couple of decades (or even slightly decrease). However, later some revitalization of the nuclear technology will be needed to keep up with the energy demand growth while controlling carbon emissions resulting in expansion of nuclear generation several times higher in absolute terms. With respect to the nuclear energy proportion within total electricity generation, its share will either remain at current levels or strongly increase to 50%, if C 0 2 abatement policies are implemented by the world community. The share of renewable energies in electricity generation, which now is equal to 17%, will either remain the same (with a tendency to decline rather than to increase) or, in case of an accelerated C 0 2 abatement, require more non-carbon electricity and the share of renewables can reach 30%-35% by the middle of the 21st century.
6. As projected, global C 0 2 emissions will continue to rise until 2010 (or even later) from 6.3 Gt-C/yr today to 6.7-8.8 Gt-C/yr in 2010. In the Base Case (Al) a further increase of C 0 2 emissions is foreseen, reaching about 12.6 Gt-C in 2050. Nuclear moratorium (A2) will result in even higher growth rates of carbon emissions, to a level of 14.5 Gt-C by the middle of the next century. It is hoped that the application of one-sided measures (on the supply- or demand-side) will result in the practical stabilization of emissions at the levels of the year 2000. Only the Accelerated C 0 2 Abatement Case (B3) achieves a 60% reduction of C 0 2 emissions compared with today's level, although this case, due to its very drastic changes within the global energy system, seems hardly to be achievable, taking into account that we are still unprepared to take this path.
7. F'actorial analysis of C 0 2 emission reductions was applied to the energy/C02 projections. In the Base Case (Al), the annual average improvement rate of global energy intensity is roughly 1% per year during the period 2010-2050 (the same as has been observed since the early 1970s), with a remarkable exception in the developing regions, where the energy intensity may even increase, at least in the short term due to their economic development. Moreover, the annual average improvement rate of carbon intensity worldwide is as little as 0.1% per year over the time horizon of the study. However, these efforts are not enough to promote global carbon emission reductions. To achieve a carbon concentration stabilization until the middle of the next century (Accelerated C 0 2 Abatement Case), the de-carbonization rate should be increased worldwide to as much as 3% per year (the developing regions must improve their carbon intensity even faster than the developed regions). The intermediate case assumes less dramatic, but more realistic, reduction rates for both factors: energy intensity and de-carbonization of the energy balance.

8. As shown, the implementation of the Dynamics-as-Usual Scenario (A) will require about 4% of world GNP be spent on investments within energy systems (without the expenditures on energy conservation), which is not significantly higher than today's investments. In the case of the Enhanced Efficiency and Conservation Scenario (B), the requirements are even lower (around 3%). However, if efforts in energy conservation are taken into account, the expenditures in the enhanced cases may be comparable or even higher than the expenditures in the Dynamics-as-Usual Scenario. Ln the Base Case (Al) one-third of the investments will be spent on fossil fuel production, half will be spent on energy conversion, and the rest will be spent at the end-use stage. The Accelerated C 0 2 Abatement Case (B3) will spend only onefourth of investments on fossil fuel production, two-thirds on energy conversion, and the rest on final uses.
9. The modeling results of the study have shown that a large energy-savings potential exists in both developed and developing countries, which if utilized could substantially reduce COz emissions. For example, in 2010 this potential is estimated for developed countries at the level of 3 Gt-C/yr (measured relative to the Hypothetical Case in 2010 with currently achieved energy efficiency), of which at least onehalf could be reduced with the negative net cost. The potential for developing countries is several times less and equal to 1 Gt-C/yr with 15% saved with the negative net cost. It is expected that the application of severe measures will help in reducing world primary energy consumption in 2010 by more than 10% and annual C02 emissions, produced by energy systems, by about 20%. However, this will cost $1.6 trillion more (or 0.4% of the global cumulative GNP) than in the Base Case. However, the Supply-side Measures Case (A3) could result in about 4%-5% primary energy consumption and C 0 2 emission reductions with practically no additional costs.
10. A global energy and climate change policy cannot be introduced without strong obligatory measures at the national and global levels. These measures should address policy actions, marketing guidelines, educational programs, financial mechanisms, and technology trans- fer. Global environmentally benign energy strategies cannot be developed without calling on all available measures in every place and sector, at both the national and global levels.
11. Many questions remain unanswered in the global-warming issue and in finding effective response strategies. Therefore, research of the problem and its links with energy systems will have to continue at the global level as well as regional and national levels. Special attention in these studies should be given to the process of international cooperation on implementing the measures required to mitigate global warming in the long term, the evaluation of the costs associated with the construction of future energy systems, as well as the introduction of advanced technologies. These measures must take into account all external costs associated with the creation, use, and decommissioning of energy technologies, and the formulation of a global strategy to control not only carbon dioxide as examined in this study but all the greenhouse gases and other sources and sinks.

Appendix 1
Energy Models Used in the Study

1. The MEDEE-2 Model
The MEDEE-2 (Model for Long-Term Energy Demand Evaluations) model uses the accounting end-use approach for calculating energy consumption of various end-use fuels. This approach consists of combining information on the activity level of a sector with information on efficiencies and energy intensities for each end-use. MEDEE-2 is an accounting framework for evaluating, over a given period of time, the energy demand implications of a scenario that describes the hypothetical evaluation of economic activities and the lifestyle of a population. Total energy demand is disaggregated into a multitude of end-use categories arising in the following sectors of energy use in an economy: goods production in agriculture, construction, mining, and manu- facturing; transportation; and household and service sector. The starting point for the demand projections is a scenario that defines population growth, economic development, and energy prices.
Sectoral energy consumption patterns are mainly described by energy intensities and pen- etration rates plus the efficiencies of the respective energy technologies. Calculation of basic energy use of an activity is based on its activity level (value-added at constant prices) and en- ergy intensity. A distinction is made between final energy for specific or non-substitutable uses and useful energy for substitutable uses. The prime model output is final energy demand by sector and energy forms.
The first computerized version of MEDEE2 was developed in the mid-1970s by Chateau and Lapillonne at the Institute of Energy Economics and Law, University of Grenoble,' and implemented at the International Institute for Applied Systems Analysis in the late 1970s and early 1980s in its energy-related studies. Later a more advanced version of the model was developed, incorporating investments in energy savings and consumer behavior, taking into account energy prices, cost of energy savings or fuel substitution, and other factors (subsidies, interest rates, financing constraints, etc.).
2. The LEAP Model
LEAP stands for Long-range Energy Alternative Planning systems and was designed by the Beijer Institute of the Swedish Academy of Sciences and the TELLUS Institute (formerly Energy System Research Group), Boston. LEAP is a computerized system which consists of several modules; each module covers part of the energy system. LEAP comprises modules for computing energy demand, for simulating energy conversion processes (e.g., electricity generation), for assessing biomass resources, for computing investment costs, and for determining impacts on the environment .2
Since none of the exact algorithms can be applied to tasks with more than 20 variables, a heuristic algorithm was developed for practical use to obtain a plausible approximation for the optimal solution within a reasonable calculation time. The two-step approach exploits the additive structure of the objective function to decompose in the first step the initial problem on a few independent subproblems and to use them for the synthesis of the optimal solution in the second step. A combinatoric algorithm of induced sorting, with rejecting infeasible or less-effective solutions, is used at the stage of the decomposition. At each iteration the method generates a new feasible solution and compares the value of the objective function with the best value achieved at the previous interactions. Finally, a finite set of mutually excluding solutions of the subproblems is generated. At the second step, Bellman's dynamic programming is used to obtain the optimal solution on the set obtained in the first step, taking into account possible
'B. Lapillonne (1978), MEDEE-2: A Model for Long-Term Energy Demand Evaluations, Research Report RR-78-17, IIASA, Laxenburg, Austria; B. Chateau and B. Lapillonne (1982), Energy Demand: Facts and Tmnds, Springer-Verlag, Vienna-New York.
'P. Raskin (1986), LEAP: A Description of the LDC Energy Alternative Planning System, Beijer Insti- tute/Scandinavian Institute of African Studies, Uppsala, Sweden.

constraints for some common variables. Such a procedure can help in finding practical solutions to problems with hundreds of variables.
The LEAP system runs on a PC (IBM compatible) and is fully menu-driven. The input fields are preformatted in a very user friendly way. This enables the LEAP system to be used quickly and easily by those users with no detailed knowledge about computers.
There were two reasons for using LEAP instead of energy supply models like MARKAL or EFOM. First, there was only limited time available for the modeling part of the study; therefore, a model had to be used that could quickly be made operational. LEAP is such a model. Second, another objective of this study was to test the way in which LEAP handles industrialized countries. LEAP was originally designed for studying developing countries, and has been applied successfully to those countries a number of times. LEAP proved to be applicable to industrialized countries, which meant that LEAP could be used as an accounting framework for global energy and C 0 2 emission studies.
3. The MARS Model
The MARS model was developed by Litwin of the Institute of Global Climate and Environmental Monitoring in Moscow and Sinyak of IIASA. It is a modified version of the CLAIR model used in Russia for the optimization of local atmospheric pollution abatement ~ t ra teg ies .~
Let us assume that we have a set of measures which can be described by a set of parameters forming a column-vector A;:
where gl; = annual C 0 2 emission reduction; g2; = C 0 2 atmospheric stock reduction; v; = required net cost; e; = energy savings; u; = nuclear energy; r; = renewable energies; and
6,; = fossil fuels (p = 1 for coal, 2 for crude oil, and 3 for natural gas).
Suppose we divide the initial set into several subsets of which the dimensions are selected in a way to reduce computation time to a reasonable limit. Every measure Ai belongs to only one of the disjoint subsets
Il ( i = 1, M), I2 ( i = MI + 1, M2), . . ., I,, ( i = MN - 1, MN) . -
I t is assumed that IlU12U.. . IN = I ( i = 1, M). The measure has a discrete characteristic: it is either fully accomplished or never accomplished.
Let us call two measures alternative if they cannot be implemented simultaneously. Usually, the combined implementation of measures depends on a number of specific conditions and, in general, there is no formal means on how to establish alternative pairs within a large set of measures A;, i = 1, M. Therefore, a table or tables which indicate the feasibility of different combinations are assumed to be constructed exogenously for each subset I,, in index pairs ( I , q), where I, q E I and a, + a, 5 1.
Suppose that there is a set. which includes no alternative pairs of measures. Let us call this set a permissible set which can be formed from the existing initial set I.
'see, for example, V. Litwin and S. Golovanov (1990), CLAIR: An Environmental Decision Support System for Atmospheric Air Pollution Simulation and Control, System Handbook, IIASA, Laxenburg, Austria.

With this in mind, a square symmetrical matrix (zCfl) of M x M can be formed where
x c 1 v = 1, if measures c and q are alternative; 0, if the opposite case takes place.
It is assumed that X,g, = 1. The total number of all permissible sets of measures from M is equal to
where CL is the number of combinations of M for i, Qj(M) is the set of all possible pairs of indexes (6, q) in the j-th lexicographical subset (vl, v2,. . .,vi); vl < vz < . . . < v;, 1 < v 5 M.
In the most simple case when no alternative measures are available, i.e., XC*" 0 for any pairs (6, q), 6 # q, the value of S is equal to (2M - 1). Usually, S 5 SM - 1.
Obviously, the idealistic apprwch is in finding and comparing all consecutive pairs (gK1, V1) , . . ., (gkd, rd) , . . . , (ckm, vm) where gr,l < gk2 < . . . < gkm and vl < ~2 < . . . < vm, k = 1 or 2 and (gkd, vkd) is a permissible set.
Therefore, we have the following model for the optimization of a C 0 2 abatement strategy:
Fl(a;) = Cgkjai + min; F2(a;) = C via; + min; i € I i€ I
(i) (j) (i) (j) ( j ) (j) (j) (j) where (El , E2 ), (Ul , U2 ), (R, , R2 ), (BPI , Bp2 ) are bilateral constraints. This model belongs to the class of multicriteria, integer, combinatoric, distributive problems
of a large dimension. When M is considerably large and if a number of alternative pairs is relatively small, the value of S can be too large to be easily handled by today's computers. Therefore, special algorithms are required. A practical way of solving these problems consists in splitting the entire set into several subsets (by using some combinatoric methods) and finding the best combinations (interrelations) between them (by using optimization methods, e.g., dynamic programming). The efficiency of the approach depends on the size of each subset.
Suppose the matrix of alternatives is diagonal, i.e., includes only zero elements (XCJ = 0) for 6 # q. In this case any combination cL, i = 1,M is possible for fulfillment of constraint - (A6). In this case, the variable ai, i E I, j = 1, N in each block (group of variables) can be casually divided into subsets (taking into account, of course, some specific aspects of a problem which can later help in understanding and interpreting the results).
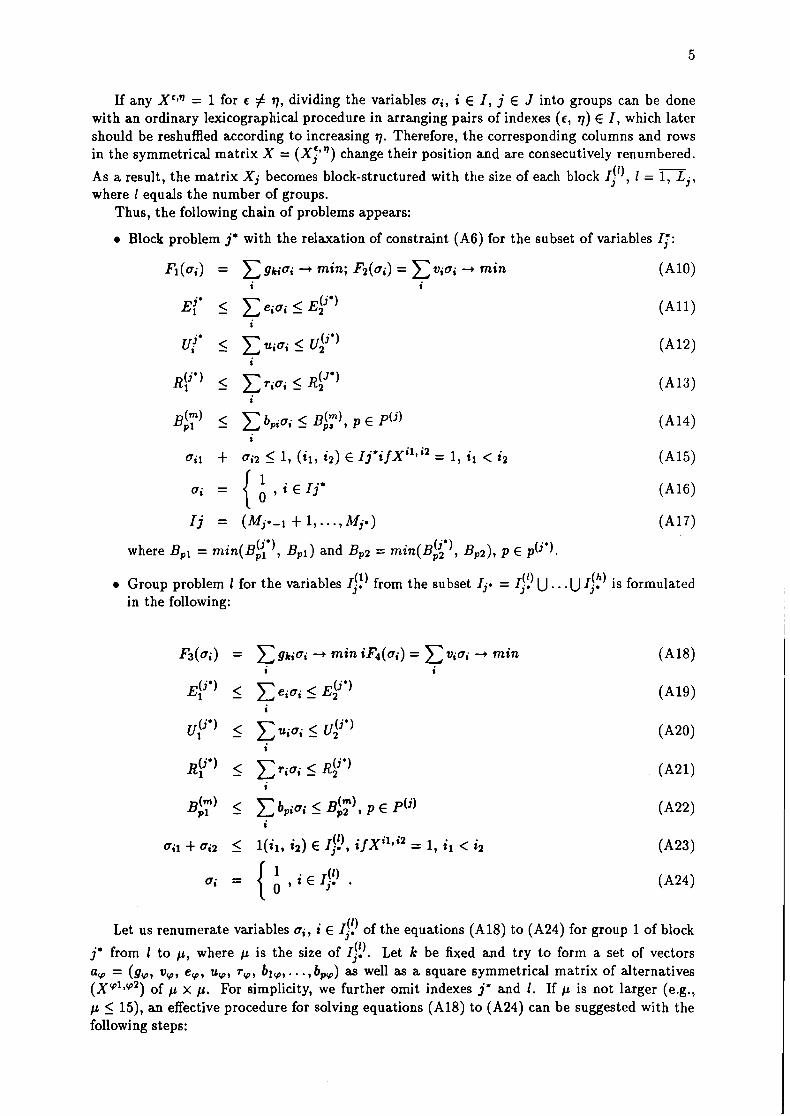
If any X'J = 1 for c # q, dividing the variables a;, i E I, j E J into groups can be done with an ordinary lexicographical procedure in arranging pairs of indexes ( 6 , q) E I, which later should be reshuffled according to increasing q. Therefore, the corresponding columns and rows in the symmetrical matrix X = (Xi") change their position and are consecutively renumbered.
As a result, the matrix X j becomes block-structured with the size of each block I:'), 1 = m,, where 1 equals the number of groups.
Thus, the following chain of problems appears:
Block problem j* with the relaxation of constraint (A6) for the subset of variables I;:
&(a;) = x gkio; + min; &(a;) = x v;a; + min a i
where BPI = min(B$*), BPI) and Bp2 = rnin(BK1, Bp2), p E ~ ( j . 1 .
(1) (1) Group problem 1 for the variables I,. from the subset I,. = I,. U . . .U I:? is formulated in the following:
F3(ai) = xgkiai + min ifi(u;) = x v;a; + min a a
EP*) 5 x e ; o ; < EP*) a
up.*) j x u;ui < uj'*) a
~ ( j * ) 1 < - x yioi j BY*) a
8::) < x bp;ui j B$), p € ~ ( j )
8
Let us renumerate variables a,, i E I!!) of the equations (A18) to (A24) for group 1 of block - (1) j* from 1 to p, where p is the size of I,. . Let k be fixed and try to form a set of vectors a, = (g,, v,, e,, u,, T,, bl,, . . .,bpcp) as well as a square symmetrical matrix of alternatives (X'p1*'p2) of p x p. For simplicity, we further omit indexes j* and I . If p is not larger (e.g., p < 15), an effective procedure for solving equations (A18) to (A24) can be suggested with the following steps:
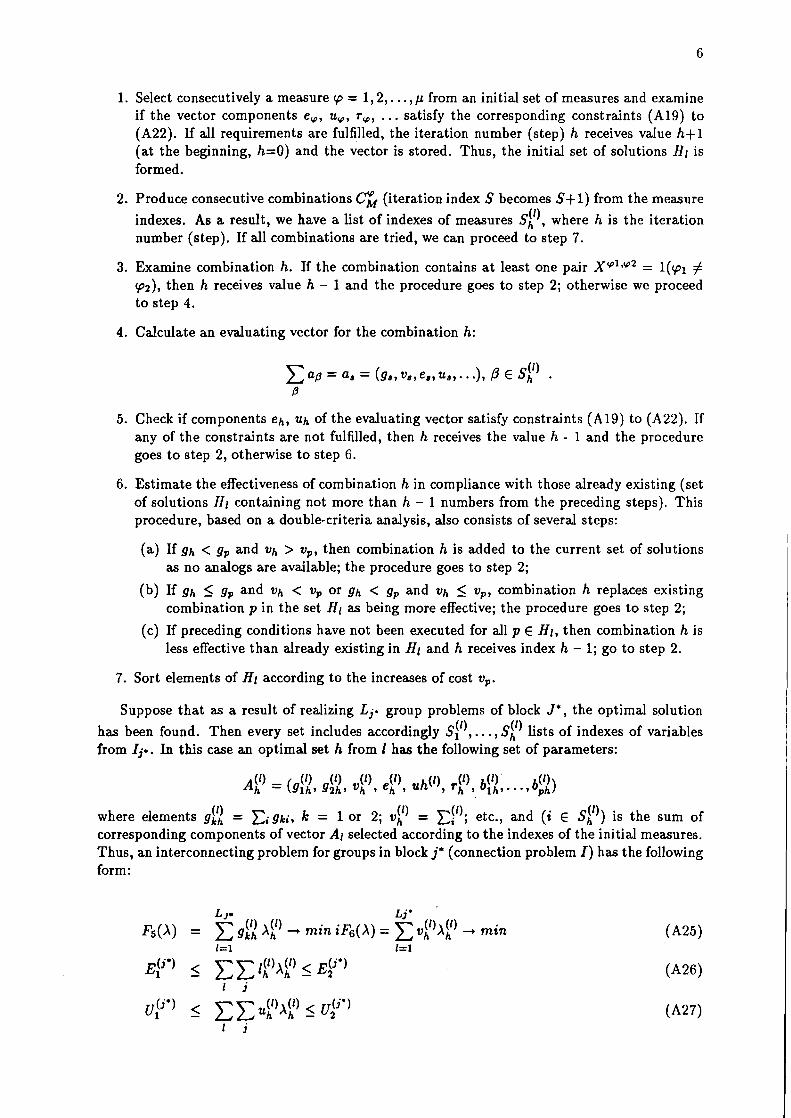
1. Select consecutively a measure p = 1,2,. . . , p from an initial set of measures and examine if the vector components e,, u,, r,, . . . satisfy the corresponding constraints (A19) to (A22). If all requirements are fulfilled, the iteration number (step) h receives value h+ l (at the beginning, h=O) and the vector is stored. Thus, the initial set of solutions HI is formed.
2. Produce consecutive combinations C& (iteration index S becomes S+1) from the measure
indexes. As a result, we have a list of indexes of measures sf), where h is the iteration number (step). If all combinations are tried, we can proceed to step 7.
3. Examine combination h. If the combination contains a t least one pair X'@'*w2 = l (p l # p2), then h receives value h - 1 and the procedure goes to step 2; otherwise we proceed to step 4.
4. Calculate an evaluating vector for the combination h:
5. Check if components eh, uh of the evaluating vector satisfy constraints (A19) to (A22). If any of the constraints are not fulfilled, then h receives the value h - 1 and the procedure goes to step 2, otherwise to step 6.
6. Estimate the effectiveness of combination h in compliance with those already existing (set of solutions HI containing not more than h - 1 numbers from the preceding steps). This procedure, based on a double-criteria analysis, also consists of several steps:
(a) If gh < gp and vh > v,, then combination h is added to the current set of solutions as no analogs are available; the procedure goes to step 2;
(b) If gh 5 gp and vh < v, or gh < g, and vh 5 v,, combination h replaces existing combination p in the set HI as being more effective; the procedure goes to step 2;
(c) If preceding conditions have not been executed for all p E HI, then combination h is less effective than already existing in HI and h receives index h - 1; go to step 2.
7. Sort elements of HI according to the increases of cost v,.
Suppose that as a result of realizing Lj* group problems of block J*, the optimal solution (1) has been found. Then every set includes accordingly s?, . . . , Sh lists of indexes of variables
from Ij*. In this case an optimal set h from 1 has the following set of parameters:
(1) (1) where elements gkh = Cigki, k = 1 or 2; vf) = xi1); etc., and ( i E Sh ) is the sum of corresponding components of vector Al selected according to the indexes of the initial measures. Thus, an interconnecting problem for groups in block j* (connection problem I ) has the following form:
LJ* Lj* F~(x ) = C gfl A!) - min i&(X) = c vf)XB) + min

Because all effective sets inside every group are fully independent, it is possible to solve any model as consequent steps of dynamic programming problems.
(1) (1) (1) (1) (1) Let k be fixed and the criteria evaluations (gl , g2 , . . . ,gH ) and (vl , v2 , . . . , vz)) corre- spond to the optimal solution of group problem I . Then the following multistage procedure can be organized:
1. Assume that the index of the step is r = 1. Form the initial list of solution indexes Q$) (1) (1) (1) v(l) keeping pairs (gl , vl ), ( , v ) . . . , ( g , HI). The index of solution g becomes equal
to HI.
2. Consequently fix group indexes 1 = 2,3, . . . , Lj* . If 1 > Lj* , then go to step 3.
3. Calculate the estimates for criteria gc) = gF) + gr) and viT) = v r ) + v r ) where P E HI, and p E Hz. If p > H1 and p > H2, go to step 6.
4. Calculate the components of the evaluating vector e t ) , ug) , . . . , rg ) . Then examine if they satisfy constraints (A27) to (A31). If any of the constraints are not fulfilled, return to step 3.
5. Compare the current pair of evaluations (gg), vi')) with already existing ones, indexes are stored in Q!:). In selecting pairs (g,, v,) for p E Q:), we have three cases:
(a) Ifg:) < gp and VP) > vp, then pair combination q, having no analogs, completes the current list of indexes and the procedure goes to step 3.
( (b) If gg) < g, and viT) < v, or gg) < g, and v,') < v,, then pair combination q, being ( more effective, replaces the existing combination p in the current list of indexes Qj:)
and we go to step 3.
(c) If the previous two cases are not fulfilled for all p E Q$), then combination q is not effective and we go to step 3.
(1 ) When SL i da rge and components (gh, vh) have small differences, the size of the index vector can increase considerably. In such cases approximate solutions should be found by introducing the sensitivity thresholds €1 and €2 for g and v.
6. Sort components g(T)and v('), belonging to the list of indexes Q$), according to increased
costs. Then we obtain a systematic list of solution indexes Q!:) at the step r and an (j*) appropriate vector AqT , q E Q$), i.e., the so-called step monogram r.
As a result of realizing linking problems for different groups (A26) to (A31), we obtain N optimal solutions ( j E J) for model (A10) to (A17), Q j sets of measures in each j-th solution
(j) (1) (j) (1) (q = l ,Q), and a list of indexes Wl , . . ., Wq ,. . ., Wgj from I = U I L . A characteristic vector for any optimal set q in this case is:

where elements = Xi gki, k = 1,2 ;
up) = C~ v v ) ; etc. ,(j) = ~ ( ' 1 ,
3
where L* < L is a subset of group indexes from j, which entered the optimal set q, and are the indexes of measures entering the optimal combination h selected from group 1 into set q.
Thus, the linking problem (interrelation problem 11) receives the following form:
n Qj n Qj (j)x(j) min; F~()L) = C c v~)x!) 3 min n ( x ) = C C 9 k P 9
To solve model (A33) to (A35), the multistage procedure described above is used. As a result of solving problems (A33) to (A35), we have an effective solution for the initial problems - (Al) to (A9) which consists of m sets (d = 1, m) and corresponds to the list of measures Fl , . . . , Fz, . . . , Fm from I = Uj I,. A characteristic vector of every effective set is:
where elements gkd = Co gki, k = 1,2; vd = Ci ; ed = Ci li, etc.;
(1) Fd = UjcJmWPj = UjEJ*Shl, 1 c L: .
Thus, we have optimal pairs (gkl, vl), (gk2, v2), . . . , (gkm, urn) as the solution to the initial model (Al) to (A9).
The block scheme of the procedure is shown in Figure A l .

Input o f i n i t i a l data: I ) vector colwms o f measures evaluation A , I = ~ H ; 2) pa i rs o f numbers o f a l te rna t i ve measures (J,y) c I 3) number o f blocks ( j=l ,N);
(,) 1) blocks b~ la te ra l I ~ r n ~ t s E ~ ) , E ~ ) , U ~ J ' , U ~ ) , . . .B~{'. . . . B ~ L . p e p
- 1 5) camon b i la te ra l I ~ r n ~ t s Bp4 .Bps , D=I ,P. I
I ) opt imal sets = r m ; 2) measure number c m i n a t i o n s (sets Foc );
- 3
Figure A 1: Block scheme: Algorithms of decomposition and information flow.
I-emission Cho Ice k=
2-accum I a t ion CQ
I Formation o f a l ternat ives
matr ix X , {x jp '7 }
1 Given number o f block j = 1
L v 4
1
Formation o f a l t e r n a t ~ v e s matr ix for block j
A l ternat I ves matr ix anal yses fo r block j and ca lcu la t ing L j
Cho Ice o f group number 1 = I 4 A
x I
Format~on o f a l te rna t i ve matr i x fo r group 1
Construct~on o f m d e l fo r group 1
Solution o f m d e l for group 1
L v
I
Saving the resu l t o f so lu t lon o f m d e l for group I:
I) e f f ec t i ve sets h = c ~ p ; (0 2) measure number q p l n a t ions (sets !+, ); 3) vector colwms Ah o f sets evaluations.
A 1 A L
I yes ChecK~ng: I = LJ L
r
I
for block J
4
I
I Choce o f group (1 + I )
A 1 I
Formation o f group cor re la t ion m d e l for block j
I Solution o f group corre la t ton m d e l
for block j
Sav~ng the r e s u l t of so lu t ion o f groups cor re la t ion m d e l fo r block j:
1) o p t i m l sets q = l , c Cjl 2) measure number c p i n a t ions (sets W9 ) ; 3) vector colwms Ag o f sets evaluations.
A / T L
I
v
Yes L v
Choice o f block ( j t l )
A w
1
Formation o f group c o r r e l a t ~ o n m d e l fo r block j
Solution o f group corre la t ion m d e l

Appendix 2
Initial Assumptions, Input Data, and Final Energy-Demand Project ions for all Regions

Table A2.1: Demographic assumptions for North America, Australia, and New Zealand.
1980 1990 2000 2010 2030 2050 Population (million) 269.1 296.0 318.0 336.0 365.0 390.0 potential labor forck (%) 64.0 66.0 67.0 68.0 64.0 60.0 Share of working population (%) 73.0 72.0 71.0 70.0 69.0 69.0 Share of rural population (%) 26.0 25.5 25.0 25.0 23.0 20.0 Average household size
(persons per household) 2.8 2.6 2.4 2.3 2.2 2.1
Sources: Statist ical Abstracts of the United States, 109th edition (1989); World Population Prospects 1988 (1989), Population Studies no. 106, UN, New York; Yearbook of Labor Stat ist ics 1987, 47th issue (1987), ILO, Geneva; Demographic Yearbook 1987(1989), UN, New York; K.C. Zachariah and M.T. Vu (1988), Wor ld Population Projections, 1987-1988 edition, World Bank, Johns Hopkins University Press, Baltimore; authors' assessments.

Table A2.2: GNP and value-added assumptions for North America, Australia, and New Zealand.
2010 2050 Dynamics- Enhanced Dynamics- Enhanced
as- Efficiency and as- Efficiency and 1980 1990 2000 Usual (Al) Conservation (B3) Usual (Al) Conservation (B3)
GNP (billion $ in 1980) 3,020 3,690 4,725 5,760 5,760 11,525 11,525 GNP formation (%) 100.0 100.0 100.0 100.0 100.0 100.0 100.0
Agriculture 3.0 2.8 2.6 2.4 2.4 2.0 2.0 Construction 4.0 4.6 4.5 4.4 4.3 3.8 3.5 Mining 3.8 3.8 3.8 3.8 3.7 3.4 3.0 Manufacturing 22.6 21.2 20.4 20.0 20.0 19.2 18.2 Energy sector ' 2.6 2.6 2.6 2.6 2.6 2.6 2.0 Services (incl. transportation) 64.0 65.0 66.1 66.8 67.0 69.0 71.3
Value-added in manufacturing (%) 100.0 100.0 100.0 100.0 100.0 100.0 100.0 Basic materials 25.0 24.0 23.2 22.2 21.0 20.0 17.0 Machinery (incl. equipment) 44.0 45.0 46.3 47.5 48.0 50.2 50.0 Food & textiles 31.0 31.0 30.5 30.3 31.0 29.8 33.0 Other 0 0 0 0 0 0 0
Sources: Siaiisiical Abstracts of the United Siaies (1989), op. cit.; Energy Modeling Forum (1990), Study Design for EMF-12 Global Climate Change: Energy Sector Impacts of Greenhouse Gas Emission Control Strategies, December, Stanford University (unpublished); authors' assessments.

Table A2.3: Thermal energy demand for North America, Australia, and New Zealand (Mtoe).
2010 2050 Dynamics- Enhanced Dynamics- Enhanced
as- Efficiency and as- Efficiency and 1980 1990 2000 Usual (A l ) Conservation (B3) Usual (A l ) Conservation (B3)
Thermal uses in manufacturing sector (useful)
Steam 95 100 115 128 112 178 85 Furnace 117 124 144 159 139 220 106 Space & water heating 23 24 28 31 2 7 43 20
Thermal uses in agriculture, construction, and mining (final) 11 14 16 18
Thermal uses in household sector (useful)
Space heating 170 216 258 285 Water heating 24 35 42 47 Cooking 9 12 13 13 Air conditioning 12 17 22 25
Thermal uses in service sector (useful)
Space & water heating 49 58 72 79 66 66 37 Air conditioning 23 30 3 7 44 35 4 7 28


Table A2.5: Dwellings and service sector buildings for North America, Australia, and New Zealand.
Dynamics- Enhanced Dynamics- Enhanced as- Efficiency and as- Efficiency and
1980 1990 2000 Usual (A l ) Conservation (B3) Usual (A l ) Conservation (B3) Dwellings (million) 95 115 130 140 140 185 185 Dwellings requiring
heating (%) Heated dwellings (%)
Pre-1980 Single-family homes Apartments
Post-1980 Single-family homes Apartments
Service sector buildings (million m2) 6,150 7,305 8,800 10,150
Buildings requiring heating (%) 100 100 100 100
Heated service sector buildings (7%) 100 100 100 100
Pre-1980 100 84 68 55 Post-1980 0 16 32 45
Sources: Statistical Abstracts of the United States (1989), op. cit.; authors' assessments.
0,

Table A2.6: Final energy-demand projections for North America, Australia, and New Zealand (Mtoe).
2010 2050 Dynamics- Enhanced Dynamics- Enhanced
as- Efficiency and as- Efficiency and 1980 1990 2000 Usual (Al) Conservation (B3) Usual (Al) Conservation (B3)
Total commercial (including feedstock) 1,567 1,702 1,865 1,910
By sector Agriculture, construction,
mining, manufacturing (including feedstock) 609 627 690 730
Transportation 499 518 545 540 Household/services 459 557 630 640
Total final energy 1,567 By energy form
Fossil fuel (substitution) 689 Centralized heating 0 Soft solar -0 Electricity 206 Motor fuel 549 Coal, specific uses 18 Feedstock 105
Noncommercial fuels 0 0 0 0 0 0 0 Sources: Energy Balances of OECD Countries, 1971-1981 (1987)) OECDIIEA, Paris; Energy Statistics, vol. I1 (1987)) OECDIIEA, Paris; authors' assessments.

Table A2.7: Demographic assumptions for Western Europe.
1980 1990 2000 2010 2030 2050 Population (million) 429.00 497.0 524.0 545.0 570.0 590.0 Potential labor force (%) 63.50 64.3 65.0 65.0 65.0 65.0 Share of working population (%) 72.50 73.7 75.0 75.7 76.3 77.0 Share of rural population (%) 50.50 49.3 47.0 45.0 35.0 30.0 Average household size
(persons per household) 2.94 2.8 2.7 2.6 2.5 2.2
Sources: World Population Prospects 1988 (1989), Population Studies no. 106, UN; New York; Yearbook of Labor Staiistics 1987, 47th issue (1987), ILO, Geneva; Demographic Yearbook 1987 (1989), UN, New York; authors' assessments.

Table A2.8: GNP and value-added assumptions for Western Europe.
2010 2050 Dynamics- Enhanced Dynamics- Enhanced
as- Efficiency and as- Efficiency and 1980 1990 2000 Usual (A l ) Conservation (B3) Usual (A l ) Conservation (B3)
GNP (billion $ in 1980) 3,849 5,250 6,850 8,350 8,350 16,700 16,700 GNP formation (%)
Agriculture Construction Mining Manufacturing Energy sector Services (incl. transportation)
Value-added in manufacturing (%) Basic materials Machinery (incl. equipment) Food & textiles 0 t her
Sources: National Accounts Statistics: Analgsis of Main Aggregates 1986 (1989), UN, New York; Energy Modeling Forum, EMF-12 Working Group (1990-1991), University of Stanford, CA; authors' assessments.

Table A2.9: Thermal energy demand for Western Europe (Mtoe).
2010 2050 Dynamics- Enhanced Dynamics- Enhanced
as- Efficiency and as- Efficiency and 1980 1990 2000 Usual (Al) Conservation (B3) Usual (A l ) Conservation (B3)
Thermal uses in manufacturing - sector (useful)
Steam Furnace Space & water heating
Thermal uses in agriculture, construction, and mining (final) 29.3 34.1 39 42
Thermal uses in household sector (useful)
Space heating 162.0 170 .O 184 195 Water heating 24.0 32.9 40 4 5 Cooking 15.0 18.0 20 2 1 Air conditioning 0.8 2.5 5 8
Thermal uses in service sector (useful)
Space & water heating 32.0 38.8 43 45 44 44 27 Air conditioning 1.3 2.0 4 6 6 11 8


Table A2.12: Final energy-demand projections for Western Europe (Mtoe).
20 10 2050 Dynamics- Enhanced Dynamics- Enhanced
as- Efficiency and as- Efficiency and 1980 1990 2000 Usual (Al) Conservation (B3) Usual (Al) Conservation (B3)
Total commercial (including feedstock) 1,045 1,165 1,265 1,290
By sector Agriculture, construction,
mining, manufacturing (including feedstock) 423 493 560 595
Transportation 236 25 1 260 250 Household/services 386 42 1 445 445
Total final energy 1,045 1,165 1,265 1,290 1,165 1,330 775 By energy form
Fossil fuel (substitution) 528 558 580 555 498 310 130 Centralized heating 3 12 23 35 35 115 74 Soft solar 0 3 8 14 12 35 19 Electricity 148 194 235 260 254 405 285 Motor fuel 246 263 270 265 208 285 94 Coal, specific uses 42 34 27 20 20 6 5 Feedstock 78 101 122 141 138 174 168
Noncommercial fuels 0 0 0 0 0 0 0
Sources: Energy Balances of O E C D Countries 1971-1981 (1983), OECD/IEA, Paris: Energy Statistics, vol. I1 (1987), OECDIIEA, Paris; Towards Sustainability: A European Programme of Policy Action in Relation to the Environment and Sustainable Development, March 1992; authors' assessments.

Table A2.13: Demographic assumptions for Eastern Europe.
1980 1990 2000 2010 2030 2050 Population (million) 93.0 96.00 100.0 104.0 107.0 110.0 Potential labor force (%) 64.0 64.00 64.0 63.0 62.0 61.0 Share of working population (%) 60.7 61.70 62.5 63.3 64.0 65.0 Share of rural population (%) 38.7 34.70 30.0 26.0 20.0 15.0 f ierage household size
(persons per household) 3.5 3.25 3.0 2.8 2.6 2.4
Sources: World Population Prospects 1988 (1989), Population Studies no. 106, UN, New York; Yearbook of Labor Statistics 1987, 47th issue (1987), ILO, Geneva; Demographic Yearbook 1987 (1989), UN, New York; authors' assessments.

Table A2.14: GNP and value-added assumptions for Eastern Europe.
2010 2050 Dynamics- Enhanced Dynamics- Enhanced
as- Efficiency and as- Efficiency and 1980 1990 2000 Usual (A l ) Conservation (B3) Usual (A l ) Conservation (B3)
GNP (billion S in 1980) 445 495 550 705 705 1,900 1,900 GNP formation (%)
Agriculture Construction Mining Manufacturing Energy sector Services (incl. transportation)
Value-added in manufacturing (%) Basic materials Machinery (incl. equipment) Food & textiles Other
Sources: National Accounts Statistics: A n a l y ~ i ~ of Main Aggregates 1986 (1989), UN, New York; authors' assessments.

Table A2.15: Thermal energy demand for Eastern Europe (Mtoe).
2010 2050 Dynamics- Enhanced Dynamics- Enhanced
as- Efficiency and a- Efficiency and 1980 1990 2000 Usual (Al) Conservation (B3) Usual (Al) Conservation (B3)
Thermal uses in manufacturing sector (useful)
Steam 43.4 42.3 38.0 40.0 Furnace 25.4 26.7 24.0 29.0 Space & water heating 3.7 3.2 3.0 3 .O
Thermal uses in agriculture, construction, and mining (final) 26.0 27.1
Thermal uses in household sector (useful)
Space heating Water heating Cooking Air conditioning
Thermal uses in service sector (useful)
Space & water heating 3.0 4.6 6.0 8.0 Air conditioning 0 0.2 0.5 1 .O 1 .O 4 4
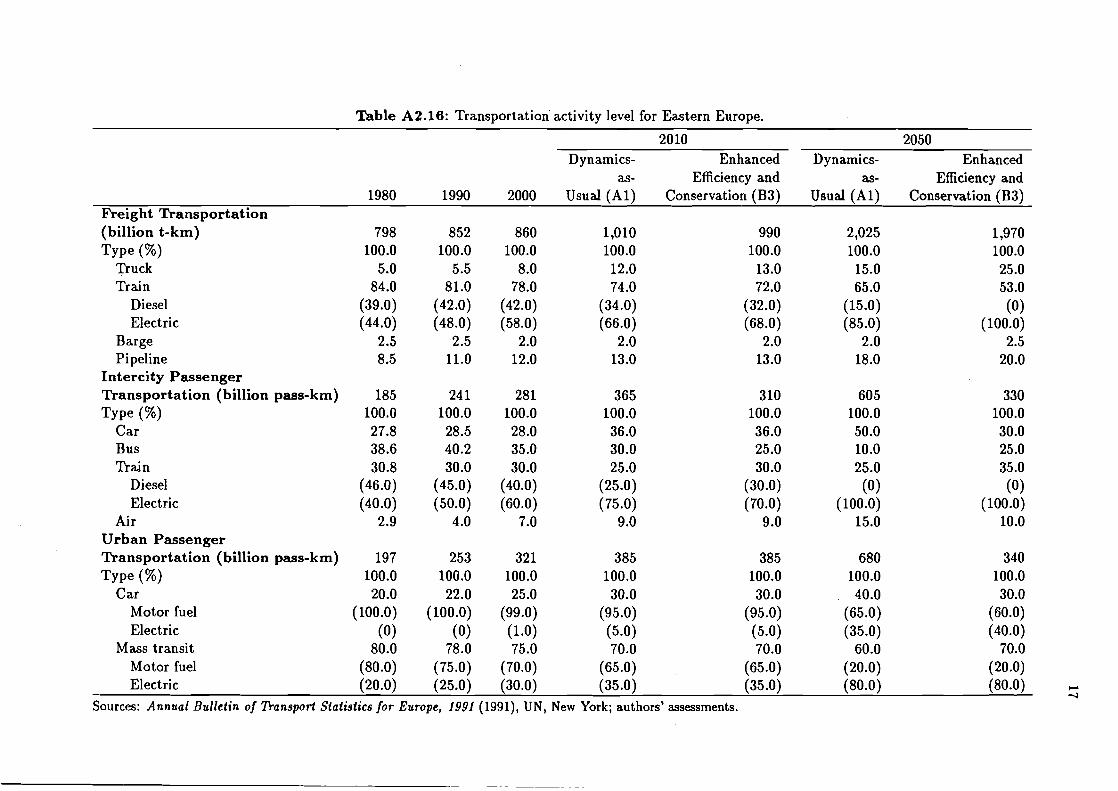
Table A2.16: Transportation'activity level for Eastern Europe.
2010 2050 Dynamics- Enhanced Dynamics- Enhanced
as- Efficiency and as- Efficiency and 1980 1990 2000 Usual (Al) Conservation (B3) Usual (Al) Conservation (B3)
F'reight Transportation (billion t-km) 798 852 860 1,010 990 Type 100.0 100.0 100.0 100.0 100.0
Truck 5.0 5.5 8.0 12.0 13.0 Train 84.0 81.0 78.0 74.0 72.0
Diesel (39.0) (42.0) (42.0) (34.0) (32.0) Electric (44.0) (48.0) (58.0) (66.0) (68.0)
Barge 2.5 2.5 2.0 2.0 2.0 Pipeline 8.5 11.0 12.0 13.0 13.0
Intercity Passenger Transportation (billion pass-km) 185 24 1 28 1 365 3 10 Type (%I 100.0 100.0 100.0 100.0 100.0
Car 27.8 28.5 28.0 36.0 36.0 Bus 38.6 40.2 35.0 30.0 25.0 Train 30.8 30.0 30.0 25.0 30.0
Diesel (46.0) (45.0) (40.0) (25.0) (30.0) Electric (40.0) (50.0) (60.0) (75.0) (70.0)
Air 2.9 4.0 7.0 9.0 9.0 Urban Passenger Transportation (billion pass-km) 197 253 32 1 385 385 Type (%) 100.0 100.0 100.0 100.0 100.0
Car 20.0 22.0 25.0 30.0 30.0 Motor fuel (100.0) (100.0) (99.0) (95.0) (95.0) Electric (0) (0) (1.0) (5.0) (5.0)
Mass transit 80.0 78.0 75.0 70.0 70.0 Motor fuel (80.0) (75.0) (70.0) (65.0) (65.0) Electric (20.0) (25.0) (30.0) (35.0) (35.0)
Sources: Annual Bulletin of Ranspor f Statistics for Europe, 1991 (1991), UN, New York; authors' assessments.

Table A2.17: Dwellings and service sector buildings for Eastern Europe.
2010 2050 Dynamics- Enhanced Dynamics- Enhanced
as- Efficiency and as- Efficiency and 1980 1990 2000 Usual (A l ) Conservation (B3) Usual (A l ) Conservation (B3)
Dwellings (million) 24 30 34 3 7 37 46 46 Dwellings requiring
heating (%) Heated dwellings (%)
Pre-1980 Single-family homes Apartments
Post- 1980 Single-family homes Apartments
Service sector buildings (million m2) 260 411 545 770
Buildings requiring heating (%) 100 100 100 100
Heated service sector buildings (%) 100 100 100 100
Pre-1980 100 61 41 24 Post-1980 0 39 59 76

Table A2.18: Final energy-demand projections for Eastern Europe (Mtoe).
Dynamics- Enhanced Dynamics- Enhanced as- Efficiency and as- Efficiency and
1980 1990 2000 Usual (A l ) Conservation (B3) Usual (A l ) Conservation (B3) Total commercial
(including feedstock) 259 269 260.0 280 240 350 200 By sector
Agriculture, construction, mining, manufacturing (including feedstock) 177 173 155.0 160
Ttansportation 18 20 22.0 28 Household/services 64 76 83.0 92
Total final energy By energy form
Fossil fuel (substitution) Centralized heating Soft solar Electricity Motor fuel Coal, specific uses Feedstock
Noncommercial fuels 5 5 4 .O 3 3 0 0 Source: ECE Energy Data Bank. Energy Balances, 1970-1988.

Table A2.19: Demographic assumptions for Japan.
1980 1990 2000 2010 2030 2050 Population (million) 117.0 122.0 128.0 130.0 126.0 121.0 Potential labor force (%) 67.0 67.0 67.0 63.0 61.0 58.0 Share of working population (%) 73.0 73.0 72.0 70.0 65.0 62.0 Share of rural population '(%) 24.0 23.0 22.0 21.0 22.0 23.0 Average household size
(persons per household) 3.5 3.5 3.4 3.3 3.0 2.9
Sources: Japan Statist ical Yearbook (1990), Statistics Bureau, Management and Coordination Agency; authors' assessments.


Table A2.21: Thermal energy demand for Japan (Mtoe).
Dynamics- Enhanced Dynamics- Enhanced as- Efficiency and as- Efficiency and
1980 1990 2000 Usual (Al) Conservation (B3) Usual (Al) Conservation (B3) Thermal uses in manufacturing sector (useful)
Steam 12.7 16.2 21.0 23 Furnace 15.5 19.7 26.0 28 Space & water heating 3.0 4.0 5.0 6
Thermal uses in agriculture, construction, and mining (final) 3.0 4.0 4.0 4
Thermal uses in household sector (useful)
Space heating 7.0 8.5 10.0 12 Water heating 3.0 5.0 8.0 13 Cooking 2.0 2.0 3.0 4 Air conditioning 0.7 1.2 2.5 4
Thermal uses in service sector (useful)
Space & water heating 22.5 23.0 23 .O 22 21 16 10 Air conditioning 0.7 1.4 3.0 5 5 6 6
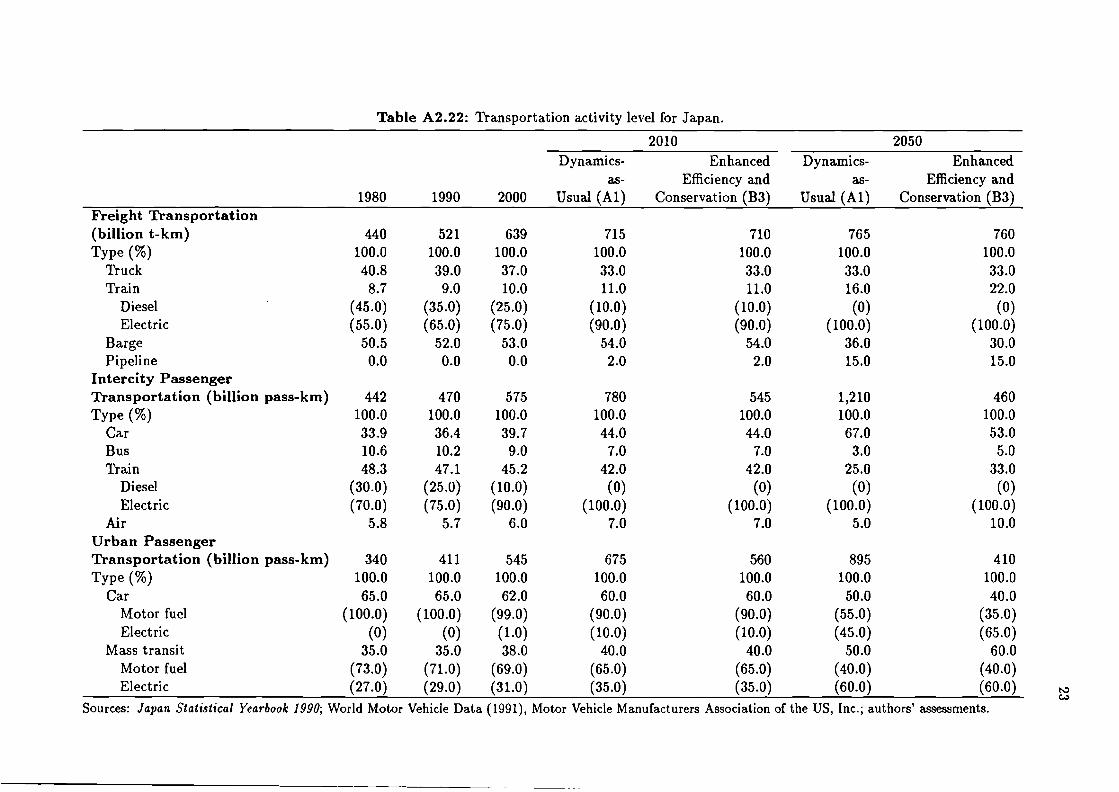
Table A2.22: Transportation activity level for Japan.
2010 2050 Dynamics- Enhanced Dynamics- Enhanced
as- Efficiency and as- Efficiency and 1980 1990 2000 Usual (Al) Conservation (B3) Usual (Al) Conservation (B3)
height Transportation (billion t-km) 440 52 1 639 715 710 765 760 Type (%) 100.0 100.0 100.0 100.0 100.0 100.0 100.0
Truck 40.8 39.0 37.0 33.0 33.0 33.0 33.0 Train 8.7 9.0 10.0 11.0 11.0 16.0 22.0
Diesel (45.0) (35.0) (25.0) (10.0) (10.0) (0) (0) Electric (55.0) (65.0) (75.0) (90.0) (90.0) (100.0) (100.0)
Barge 50.5 52.0 53.0 54.0 54.0 36.0 30.0 Pipeline 0.0 0.0 0.0 2.0 2.0 15.0 15.0
Intercity Passenger Transportation (billion pass-km) 442 470 575 780 545 1,2 10 460 Type (%I 100.0 100.0 100.0 100.0 100.0 100.0 100.0
Car 33.9 36.4 39.7 44.0 44.0 67.0 53.0 Bus 10.6 10.2 9.0 7.0 7.0 3.0 5.0 Train 48.3 47.1 45.2 42.0 42.0 25.0 33.0
Diesel (30.0) (25.0) (10.0) (0) (0) (0) (0) Electric (70.0) (75.0) (90.0) (100.0) (100.0) (100.0) (100.0)
Air 5.8 5.7 6.0 7.0 7.0 5.0 10.0 Urban Passenger Transportation (billion pass-km) 340 41 1 545 675 560 895 410 Type (%I 100.0 100.0 100.0 100.0 100.0 100.0 100.0
Car 65.0 65.0 62.0 60.0 60.0 50.0 40.0 Motor fuel (100.0) (100.0) (99.0) (90.0) (90.0) (55.0) (35 .O) Electric (0) (0) (l.0) (10.0) (10.0) (45.0) (65.0)
Mass transit 35.0 35.0 38.0 40.0 40.0 50.0 60.0 Motor fuel (73.0) (71.0) (69.0) (65.0) (65.0) (40.0) (40.0) Electric (27.0) (29.0) (31.0) (35.0) (35.0) (60.0) (60.0) ~3
c4 Sources: Japan Statistical Yearbook 1990; World Motor Vehicle Data (1991), Motor Vehicle Manufacturers Association of the US, Inc.; authors' assessments.
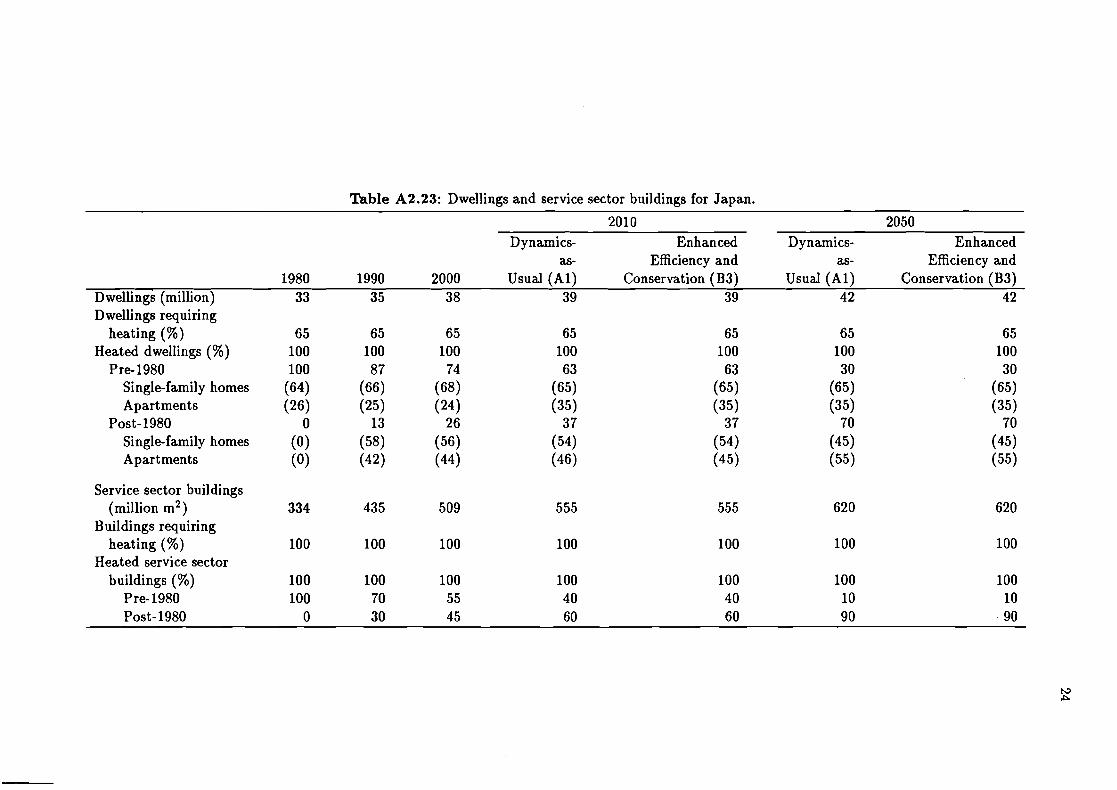
Thble A2.23: Dwellings and service sector buildings for Japan.
Dynamics- Enhanced Dynamics- Enhanced as- Efficiency and as- Efficiency and
1980 1990 2000 Usual (Al) Conservation (B3) Usual (Al) Conservation (B3) D welling6 (million) 33 35 38 39 39 42 42 - .
Dwellings requiring heating (%)
Heated dwellings (%) Pre- 1980
Single-family homes Apartments
Post- 1980 Single-family homes Apartments
Service sector buildings (million m2) 334 435 509 555
Buildings requiring heating (%) 100 100 100 100
Heated service sector buildings (%) 100 100 100 100
Pre-1980 100 70 55 40 Post- 1980 0 30 45 60
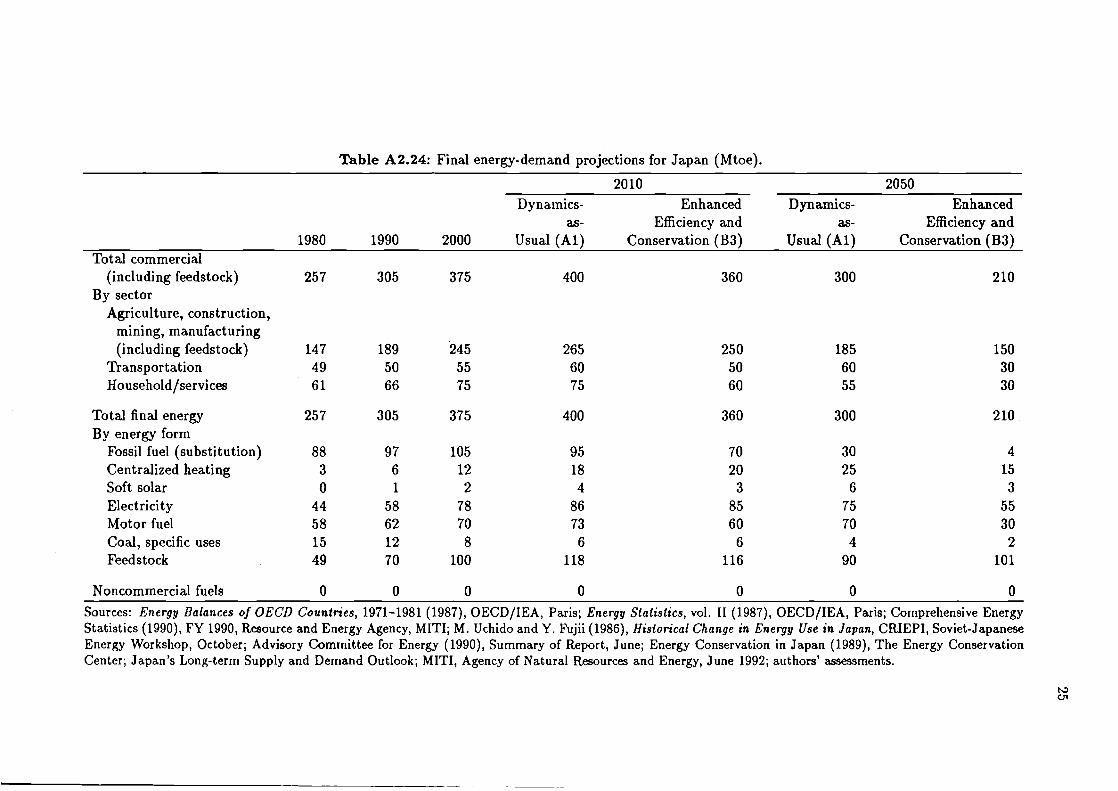
Table A2.24: Final energy-demand projections for Japan (Mtoe).
2010 2050
Dynamics- Enhanced Dynamics- Enhanced as- Efficiency and as- Efficiency and
1980 1990 2000 Usual (Al) Conservation (B3) Usual (Al) Conservation (B3) Total commercial
(including feedstock) 257 305 375 400 By sector
Agriculture, construction, mining, manufacturing (including feedstock) 147 189 245 265
Transportation 49 50 55 60 Household/services 6 1 66 75 75
Total final energy By energy form
Fossil fuel (substitution) Centralized heating Soft solar Electricity Motor fuel Coal, specific uses Feedstock
Noncommercial fuels 0 0 0 0 0 0 0
Sources: Energy Balances of OECD Countries, 1971-1981 (1987), OECDIIEA, Paris; Energy Slalislics, vol. I1 (1987), OECDIIEA, Paris; Comprehensive Energy Statistics (1990), FY 1990, Resource and Energy Agency, MITI; M. Uchido and Y. Fujii (1986), Hislorical Change in Energy Use in Japan, CRIEPI, Soviet-Japanese Energy Workshop, October; Advisory Committee for Energy (1990), Summary of Report, June; Energy Conservation in Japan (1989), The Energy Conservation Center; Japan's Long-term Supply and Demand Outlook; MITI, Agency of Natural Resources and Energy, June 1992; authors' assessments.

Table A2.25: Demographic assumptions for the USSR. 1980 1990 2000 2010 2030 2050
Population (million) 265.0 288.0 308.0 326.0 360.0 380.0 Potential labor force (%) 65.0 65.0 65.0 65.0 64.0 63.0 Share of working population (%) 73.0 73.0 73.0 72.0 71.0 65.0 Share of rural population (%) 37.0 33.0 30.0 27.0 25.0 20.0 Average household size
(persons per household) 4.0 3.9 3.8 3.7 3.3 3.0
Sources: USSR Economy in 1988 (1989)) Statistical Yearbook, Finance and Statistics Publishing House, Moscow; World Population Prospects 1988 (1989), Population Studies no. 106, UN, New York; Yearbook of Labor Statistics 1987,47th edition (1987), ILO, Geneva; Demographic Yearbook 1987(1989), UN, New York; authors' assessments.

Table A2.26: GNP and value-added assumptions for the USSR.
Dynamics- Enhanced Dynamics- Enhanced as- Efficiency and as- Efficiency and
1980 1990 2000 Usual (A l ) Conservation (B3) Usual (A l ) Conservation (B3) GNP (billion in $ 1980) 1,225 1,640 1,730 2,215 2,215 5,950 5,950 GNP formation (%) 100 100 100 100 100 100 100
Agriculture 11 10 10 8 8 6 5 Construction 8 8 8 6 5 5 4 Mining 7 7 6 5 4 4 2 Manufacturing 24 25 26 26 25 23 20 Energy sector 8 7 7 7 7 5 4 Services (incl. transportation) 42 42 43 47 50 57 65
Value-added in manufacturing (%) 100 100 100 100 100 100 100 Basic materials 30 28 26 23 21 18 15 Machinery (incl. equipment) 50 51 52 53 52 55 50 Food & textiles 20 2 1 22 24 2 7 27 35 Other 0 0 0 0 0 0 0
Sources: The Economist, April 28, 1990; A.M. Illarionov (1989), Where are we? Communist Economies l(3); National Account Statistics: Main Aggregates and Detailed Tables (1989), UN, New York; World Bank (1980), World Tables, third edition, The Johns Hopkins University Press, Baltimore and London; USSR Economy in 1989, op. cit.

Table A2.27: Thermal energy demand for the USSR (Mtoe).
2010 2050 Dynamics- Enhanced Dynamics- Enhanced
as- Efficiency and as- Efficiency and 1980 1990 2000 Usual (Al) Conservation (B3) Usual (Al) Conservation (B3)
Thermal uses in manufacturing sector (useful)
Steam 14.8 19.0 17 19 17 30 11 Furnace 84.5 95.0 77 85 77 105 65 Space & water heating 76.8 114.7 112 125 106 165 79
Thermal uses in agriculture, constr.uction, and mining (final) 41.5 50.0 48 44
Thermal uses in household sector (useful)
Space heating 62.7 93.0 100 113 Water heating 4.0 7.0 9 15 Cooking 9.0 13.0 14 13 Air conditioning 0 0 0 1
Thermal uses in service sector (useful)
Space & water heating 19.0 20.0 24 31 32 3 1 27 Air conditioning 0 0 2 6 7 17 16

Table A2.28: Transportation activity level for the USSR.
2010 2050 Dynamics- Enhanced Dynamics- Enhanced
as- Efficiency and as- Efficiency and 1980 1990 2000 Usual (A l ) Conservation (B3) Usual ( A l ) Conservation (B3)
Freight Transportation (billion t-km) Type (%I
Truck Train
Diesel Electric
Barge Pipeline
Intercity Passenger Transportation (billion pass-km) Type
Car Bus Train
Diesel Electric
Air Urban Passenger Transportation (billion pass-km) Type (%)
Car Motor fuel Electric
Mass transit Motor fuel Electric (20.0) (22.0) (25.0) (30.0) (30.0) (85.0) (95.0) t3
CD Sources: USSR Economy in 1989, op. cit.; S. Schlikhter and E. Schlikhter (1981), Analysis of Energy Intensities in the Transport Sector and Energy Savings Measures, Energy-Fuel 4:31 (in Russian); A. Vanichov and A. Syrmsa (eds.) (1988), Improvements in Z'kansportation Energy Systems, Nauka, Moscow (in Russian); authors' assessments.

Table A2.29: Dwellings and service sector buildings for the USSR.
Dynamics- Enhanced Dynamics- Enhanced as- Efficiency and as- Efficiency and
1980 1990 2000 Usual (Al) Conservation (B3) Usual (Al) Conservation (B3) Dwellings (million) 50 74 81 88 88 126 126 Dwellings requiring
heating (%) Heated dwellings (%)
Pre- 1980 Single-family homes Apartments
Post-1980 Single-family homes Apartments
Service sector buildings (million m2) 1,500 1,600 1,760 2,510
Buildings requiring heating (%) 100 100 100 100
Heated service sector buildings (%) 100 100 100 100
Pre-1980 100 90 80 52 Post-1980 0 10 20 48
Sources: USSR Economy in 1989, op. cit.; Modern Problems of Household Electrification (1987), Nauka, Moscow (in Russian); O.A. Nekrasova (1990), Residential Heat Supply: Problems, Methods of Research, presented a t the International Workshop on Evaluation of Energy/COz Data for the World with Major Emphasis on CMEA Countries, January 22-23, IIASA, Laxenburg, Austria.

Table A2.30: Final energy-demand projections for the USSR (Mtoe).
Dynamics- Enhanced Dynamics- Enhanced as- Efficiency and as- Efficiency and
1980 1990 2000 Usual (Al) Conservation (B3) Usual (Al) Conservation (B3) Total commercial
(including feedstock) 796 994 985 1,065 By sector
Agriculture, construction, mining, manufacturing (including feedstock) 52 1 633 588 610
Transportation 130 162 184 220 Household/services 145 199 213 235
Total final energy By energy form
Fossil fuel (substitution) Centralized heating Soft solar Electricity Motor fuel Coal, specific uses Feedstock
Noncommercial fuels 16 16 13 8 8 0 0

Table A2.31: Demographic assumptions for Latin America.
1980 1990 2000 2010 2030 2050 Population (million) 362.0 448.0 540.0 630.0 770.0 850.0 Potential labor force (%) 57.0 59.0 62.0 65.0 66.0 66.0 Share of working population (%) 59.0 61.0 63.0 65.0 65.0 65.0 Share of rural population (%) 35.0 27.0 22.0 19.0 15.0 12.0 Average household size
(persons per household) 4.4 4.4 4.4 4.2 4.0 3.5
Sources: World Population Prospects 1988 (1989), Population Studies no. 106, UN, New York; Demo- graphic Yearbook 1987 (1989), UN, New York; Siaiisiical Abstracts of the United States, 109th edition (1989); authors' assessments.


Table A2.33: Thermal energy demand for Latin America (Mtoe).
2010 2050 Dynamics- Enhanced Dynamics- Enhanced
as- Efficiency and as- Efficiency and 1980 1990 2000 Usual (A l ) Conservation (B3) Usual (A l ) Conservation (B3)
Thermal uses in manufacturing sector (useful)
Steam 23 28 3 7 49 46 118 74 Furnace 34 4 1 54 71 70 172 109 Space & water heating 1 1 2 3 4 6 4
Thermal uses in agriculture, .construction, and mining (final) 7 9 12 15
Thermal uses in household sector (useful)
Space heating 8 9 11 14 Water heating 4 6 9 13 Cooking 12 15 18 21 Air conditioning 0 0 1 2
Thermal uses in service sector (useful)
Space & water heating 3 7 12 20 17 49 32 -
Air conditioning 0 1 2 4 4 24 32


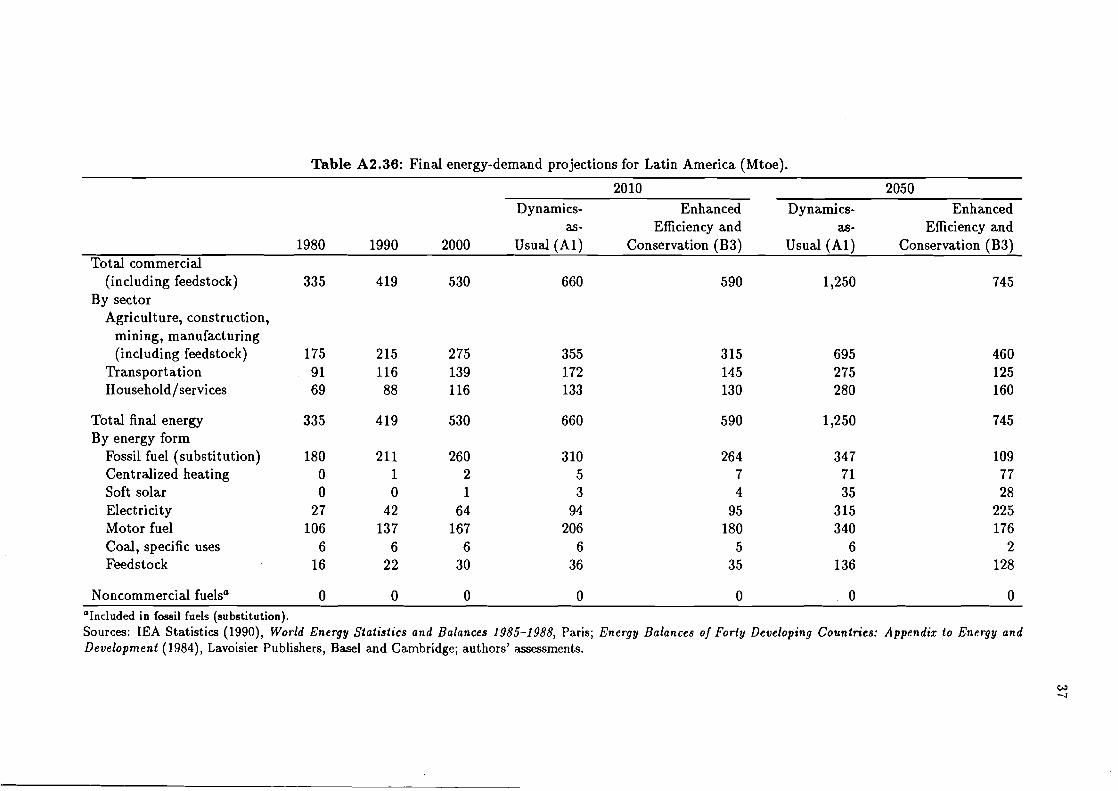
Table A2.36: Final energy-demand projections for Latin America (Mtoe).
2010 2050 Dynamics- Enhanced Dynamics- Enhanced
as- Efficiency and as- Efficiency and 1980 1990 2000 Usual (Al) Conservation (B3) Usual (Al) Conservation (B3)
Total commercial (including feedstock) 335 419 530 660
By sector Agriculture, construction,
mining, manufacturing (including feedstock) 175 215 275 355
Transportation 91 116 139 172 Household/services 69 88 116 133
Total final energy By energy form
Fossil fuel (substitution) Centralized heating Soft solar Electricity Motor fuel Coal, specific uses Feedstock
Noncommercial fuelsa 0 0 0 0 0 0 0 OIncluded in fossil fuels (substitution). Sources: IEA Statistics (1990), World Energy Statist ics and Balances 1985-1988, Paris; Energy Balances of Forty Developing Countries: Appendiz to Energy and Development (1984), Lavoisier Publishers, Basel and Cambridge; authors' assessments.

Table A2.37: Major initial assumptions and final energy projections for the Pacific region.
Dynamics- Enhanced Dynamics- Enhanced as- Efficiency and a- Efficiency and
1980 1990 2000 Usual (A l ) Conservation (B3) Usual (A l ) Conservation (B3) Population (million) 33 1 405 487 565 565 965 965 GNP (billioh $ in 1980) 402 540 725 975 EnergyIGNP elasticity 0 0.85 0.77 0.70 Percent of final energy in
primary energy demand 52 53 55 60 Percent of electricity sector
in primary energy demand 20 22 25 28 28 50 50 Final energy demand (Mtoe) 140 185 240 310 305 665 560 Of which (%)
Solid Liquid Gaseous Electricity Soft solar Noncommercial
Sources: World Population Prospects 1988 (1989), Population Studies no. 106, U N , New York; Statistical Abstracts of the United States, 109th edition (1989); IEA World Energy Statistics and Balances 1985-1988 (1990), OECD/IEA, Paris; SPEC IV, Energy Statistics (1987); UN Statistical Yearbook for Asia and Pacific 1989; Asian Development Outlook (1990); authors' assessments.

Table A2.38: Demographic assumptions for North Africa and the Middle East.
1980 1990 2000 2010 2030 2050 Population (million) 162.0 218.0 284.0 359.0 485.0 580.0 Potential labor force (%) 53.0 54.0 58.0 63.0 67.0 69.0 Share of working population (%) 44.0 45.0 50.0 55.0 63.0 65.0 Share of rural population (%) 60.0 56.0 50.0 43.0 34.0 25.0 Average household size
(persons per household) 5.2 5.0 4.8 4.3 4.0 3.8
Sources: Wor ld Population Projections 1988 (1989)) Population Studies no. 106, UN, New York; Demo- graphic Yearbook 1987 (1989), UN, New York; authors' assessments.

Table A2.39: GNP and value-added assumptions for North Africa.
Dynamics- Enhanced Dynamics- Enhanced as- Efficiency and as- Efficiency and
1980 1990 2000 Usual (A l ) Conservation (B3) Usual (A l ) Conservation (B3) GNP (billion $ in 1980) 470 630 850 1,140 1,140 3,700 3,700 GNP formation (%)
Agriculture Construction Mining Manufacturing Energy sector Services (incl. transportation)
Value-added in manufacturing (%) Basic materials Machinery (incl. equipment) Food & textiles Other 0 0 0 0 0 0 0
Sources: National Account Statistics: Analysis of Main Aggregates 1986 (1989), UN, New York; authors' assessments.

Table A2.40: Thermal energy demand for North Africa (Mtoe).
Dynamics- Enhanced Dynamics- Enhanced as- Efficiency and as- Efficiency and
1980 1990 2000 Usual (A l ) Conservation (B3) Usual (A l ) Conservation (B3) Thermal uses in manufacturing sector (useful)
Steam 5.0 9.0 14.0 Furnace 8.0 13.0 21.0 Space & water heating 0 0 0
Thermal uses in agriculture, construction, and mining (final) 20.0 25.0
Thermal uses in household sector (useful)
Space heating Water heating Cooking Air conditioning
Thermal uses in service sector (useful)
Space & water heating 0.7 1 .O 2.0 3 4 9 5 Air conditioning 0 0.2 0.6 1 1 7 12

Table A2.41: Transportation activity level for North Africa.
2010 2050 Dynamics- Enhanced Dynamics- Enhanced
as- Efficiency and as- Efficiency and 1980 1990 2000 Usual (A l ) Conservation (B3) Usual (Al) Conservation (B3)
Freight Transportat ion (billion t-km) 786 1,044 Type 100.0 100.0
Truck 44.8 50.0 Train. 2.7 4.3
Diesel (94.0) (91.0) Electric (6.0) (9.0)
Barge 3.0 3.3 Pipeline 42.5 42.4
Interci ty Passenger Transportat ion (billion pass-km) 223 436 Type (%) 100.0 100.0
Car 27.1 27.9 Bus 60.5 57.3 Train 10.2 12.0
Diesel (94.0). (91.0) Electric (6.0) (9.0)
Air 2.2 2.7 Urban Passenger Transportat ion (billion pass-km) 284 478 Type (%) 100.0 100.0
Car 32.5 36.7 Motor fuel (100.0) (100.0) Electric
Mass transit (0)
67.5 (0)
63.3 Motor fuel (97.7) (97.2) Electric (2.3) 2.8)
Sources: IIASA MEDEE2 Data Base; authors' assessments.

Table A2.42: Dwellings and service sector buildings for North Africa.
2010 2050 Dynamics- Enhanced Dynamics- Enhanced
as- Efficiency and as- Efficiency and 1980 1990 2000 Usual (Al) Conservation (B3) Usual (Al) Conservation (B3)
Dwellings (million) 32 44 59 83 83 153 153 Dwellings requiring
heating (%) Heated dwellings (%)
Pre- 1980 Single-family homes Apartments
Post- 1980 Single-family homes Apartments
Service sector buildings (million m2) 220 324 570 1,045 1,045 3,120 3,640
Buildings requiring heating (%) 100 100 100 100 100 100 100
Heated service sector buildings (%) 100 100 100 100 100 100 100
Pre-1980 100 66 35 17 17 0 0 Post-1980 0 34 65 87 83 100 100
Sources: Compendium of Housing Statistics 1972-1974 (1978), UN, New York; IIASA MEDEEP Data Base; authors' assessments.

Table A2.43: Final energy-demand projections for North Africa (Mtoe).
2010 2050 Dynamics- Enhanced Dynamics- Enhanced
as- Efficiency and as- Efficiency and 1980 1990 2000 Usual (A l ) Conservation (B3) Usual (Al) Conservation (B3)
Total commercial (including feedstock) 123 180 260 365 By sector
Agriculture, construction, mining, manufacturing (including feedstock) 65 92 133 185
Transportation 42 63 90 120 Household/services 16 2 5 3 7 60
Total final energy By energy form
Fossil fuel (substitution) Centralized heating Soft solar Electricity Motor fuel Coal, specific uses Feedstock
Noncommercial fuels 1 1 1 1 1 1 1
Sources: IEA Statistics (1990), World Energy Statistics and Balances 1985-1988, IEAIOECD, Paris; authors' assessments.

Table A2.44: Major initial assumptions and final energy projections for China and other Asian CPCs.
Dynamics- Enhanced Dynamics- Enhanced as- Efficiency and as- Efficiency and
1980 1990 2000 Usual (A l ) Conservation (B3) Usual (A l ) Conservation (B3) Population (million) 1,068 1,225 1,395 1,515 1,515 1,775 1,775 GNP (billion $ in 1980) 305 722 1,120 1,660 Energy/GNP elasticity 0 0.51 0.80 0.77 Percent of final energy in
primary energy demand 84 83 81 78 Percent of electricity sector
in primary energy demand 17 20 22 24 25 33 36 Final energy demand (Mtoe) 423 660 915 1,190 1,135 2,870 1,925 Of which (%)
Solid Liquid Gaseous Electricity Soft solar Noncommercial
Sources: World Population Prospects 1988 (1989), Population Studies no. 106, UN, New York; Energy Modeling Forum (1990), First-Round Study Design for EMF-12 "Global Climate Change", Stanford University; Lu Yingzhong (1989), Carbon Dioxide Issues and Energy Policy in the People's Ftepublic of China, Inl. Journal of Global Issues l(1-2); Lu Yingzhong (1990), Comparison of Energy Consumption, Supply and Policy of the People's Republic of China and Some Other Developing Countries, Tsinghua Univerfty, Beijing; Lu Yingzhong (1990), Energy Conservation in China, paper presented at the International Energy Workshop, June 7-8, East-West Center, Honolulu; Shi-Tong Li (1991), Energy Supply/Demand Analysis in China, 7th Conference on Energy System's and Economics, Japan Society of Energy and Resources, Tokyo; Lin Gan (1990)' Global Warming and Options for China: Energy and Environmental Policy Profile, Working Paper WP-90-52, IIASA, Laxenburg, Austria; WEC (1989), China: National Energy Data Profile, 14th Congress; authors' assessments.

Table A2.45: Demographic assumptions for other LDCs.
1980 1990 2000 2010 2030 2050 Population (million) 1,304.0 1,706.0 2,190.0 2,630.0 3,795.0 5,100.0 Potential labor force (%) 55.0 57.0 60.0 61.0 64.0 65.0 Share of working population (%) 70.0 70.0 70.0 70.0 69.0 65.0 Share of rural population (%) 70.0 66.0 60.0 54 .O 43.0 25.0 Average household size
(persons per household) 5.5 5.5 5.3 5.1 4.8 4.2
Sources: World Population Prospects 1988 (1989), Population Studies no. 106, UN, New York; De- mographic Yearbook 1987 (1989), UN, New York; Energy Modeling Forum (1990), Stanford University; IIASA's MEDEE-2 Data Base; authors' assessments.

Table A2.46: GNP and value-added assumptions for other LDCs.
2010 2050 Dynamics- Enhanced Dynamics- Enhanced
as- Efficiency and as- Efficiency and 1980 1990 2000 Usual (A l ) Conservation (B3) Usual (A l ) Conservation (B3)
GNP (billion $ in 1980) 430 480 695 960 960 3,185 3,185 GNP formation (%) 100 100.0 100 100.0 100.0 100.0 100.0
Agriculture 29 28.0 2 7 25.0 25.0 25.0 25.0 Construction 6 6.0 6 6.0 6.0 5.0 5.0 Mining 7 7.0 7 7.0 7.0 7.0 7.0 Manufacturing 15 15.0 15 16.0 16.0 14.5 14.5 Energy sector 2 2.5 3 3.5 3.5 4.5 4.5 Services (incl. transportation) 41 41.5 42 42.5 42.5 44.0 44.0
Value-added in manufacturing (%) 100 100.0 100 100.0 100.0 100.0 100.0 Basic materials 28 28.0 29 30.0 30.0 30.0 30.0 Machinery (incl. equipment) 19 20.0 21 22.0 22.0 30.0 30.0 Food & textiles 53 52.0 50 48.0 48.0 40.0 40.0 Other 0 0 0 0 0 0 0
Sources: National Account Statistics: ~ L l y s i s of Main Aggregates 1986 (1989), UN, New York; Energy Modeling Forum (1990-1991), EMF-12 Working Group, Stanford University; World Bank (1982), 1981 World Bank Atlas, Washington, DC; IIASA MEDEE2 Data Base; authors' assessments.

Table A2.47: Thermal energy demand for other LDCs (Mtoe).
Dynamics- Enhanced Dynamics- Enhanced as- Efficiency and as- Efficiency and
1980 1990 2000 Usual (A l ) Conservation (B3) Usual (A l ) Conservation (B3) Thermal uses in manufacturing sector (useful)
Steam 10 11 16 22 Furnace 16 17 25 33 Space & water heating 0 0 0 0
Thermal uses in agriculture, construction, and mining (final) 1 1 1
Thermal uses in household sector (useful)
Space heating 1 1 1 2 Water heating 1 1 1 2 Cooking 28 30 4 1 53 Air conditioning 0 0 0 1
Thermal uses in service sector (useful)
Space & water heating 1 1 1 3 3 11 11 Air conditioning 0 1 1 3 3 43 44

Table A2.48: Transportation activity level for other LDCs.
2010 2050 Dynamics- Enhanced Dynamics- Enhanced
as- Efficiency and its- Efficiency and 1980 1990 2000 Usual (Al) Conservation (B3) Usual (Al) Conservation (B3)
height Transportation (billion t-km) Type (%I
Truck Train
Diesel Electric
Barge Pipeline
Intercity Passenger Transportation (billion pass-km) 717 1,109 1,640 2,235 2,235 1,2750 5,100 Type (%I 100.0 100.0 100.0 100.0 100.0 100.0 100.0
Car 16.6 15.6 15.7 16.0 19.0 25.0 39.0 Bus 55.8 56.3 55.6 55.0 51.7 43.0 32.0 Train 25.8 25.6 25.3 25.0 25.3 25.0 24.0
Diesel (48.0) (48.0) (58.0) (58.0) (58.0) (50.0) (35.0) Electric (20.0) (24.0) (30.0) (35.0) (35.0) (50.0) (65.0)
Air 1.7 2.5 3.4 4.0 4.0 7.0 5.0 Urban Passenger Transportation (billion pass-km) 1,357 2,159 4,000 6,050 6,050 27,900 20,940 Type (%I 100.0 100.0 100.0 100.0 100.0 100.0 100.0
Car 33.5 34.3 35.0 35.0 35.0 35.0 25.0 Motor fuel (100.0) (100.0) (100.0) (99.0) (99.0) (95.0) (90.0) Electric (0) (0) (0) ( 1-01 ( 1.0) (5.0) (10.0)
Mass transit 66.5 65.7 65.0 65.0 65.0 65.0 75.0 Motor fuel (97.0) (97.0) (96.0) (95.0) (95.0) (85.0) 65.0) Electric (3.0) (3.0) (4.0) (5.0) (15.0) (15.0) (35.0)
Sources: IIASA MEDEE-2 Data Base; authors' assessments.

Table A2.49: Dwellings and service sector buildings for other LDCs.
2010 2050 Dynamics- Enhanced Dynamics- Enhanced
as- Efficiency and as- Efficiency and 1980 1990 2000 Usual (Al) Conservation (B3) Usual (Al) Conservation (B3)
Dwellings (million) 300 310 415 515 515 1,215 1,215 Dwellings requiring
heating (%) Heated dwellings (%)
Pre- 1980 Single-family homes Apartments
Post-1980 Single-family homes Apartments
Service sector buildings (million m2) 1,250 3,200 4,635 6,205 6,205 18,960 18,960
Buildings requiring heating (76) 35 35 35 35 35 35 35
Heated service sector buildings (%) 100 100 100 100 100 100 100
Pre-1980 100 39 25 18 18 2 2 Post- 1980 0 61 75 82 82 98 98
Sources: IIASA MEDEE2 Data Base; authors' assessments.

Table A2.50: Final energy demand projections for other LDCs (Mtoe).
Dynamics- Enhanced Dynamics- Enhanced as- Efficiency and as- Efficiency and
1980 1990 2000 Usual (Al) Conservation (B3) Usual (Al) Conservation (B3) Total commercial
(including feedstock) 177 218 340 470 By sector
Agriculture, construction, mining, manufacturing (including feedstock) 8 7 95 149 205
Transportation 64 80 137 185 Household/services 26 4 3 54 80
Total final energy By energy form
Fossil fuel (substitution) Centralized heating Soft solar Electricity Motor fuel Coal, specific uses Feedstock
Noncommercial fuels 230 294 310 310 310 260 260 Sources: IEA Statistics (1990), World Energy Statist ics and Balances, 1985-1989, OECD/IEA, Paris; Energy Balances for Forty Developing Countries: An Appendix to Energy and Development (1984), Lawisier Publishers, Basel and Cambridge; authors' assessments.

Appendix 3
Expected Energy- Savings Potential at End-Use by 2010: Regional Results of Model Runs

Table A3.1: Technology options for energy-savings and COz abatement measures until 2010. Specific 0 & M
investment costs Energy Technology Unit ($/unit) ($/uni t /~r) efficiency
Electricity generat ion Conventional coal-fired power plant
kW(e) 1,000 0.0081 (per kwh) 33%
Conventional gas-fired power plant New coal-fired power plant Integrated coal-gas-combined cycle Natural gas combined-cycle
power plant LWR Hydro and other renewables
Others Manufacturing, residential, a n d commercial sectors Industrial furnaces
Conventional New gas-fired Electric Insulation
Blast furnaces
10% saving 20% saving 30% saving
Heat production Conventional coal boiler Conventional gas boiler FBC boiler Gas-condensed boiler GT w/cogeneration Steam cogeneration Heat pump Solar
Transportat ion Engine and vehicle improvements
10% 20% 30%
Electricity penetration Speciflc electricity Lighting
Incandescent
600 2,900
1,000-8,000 (av. 2500)
5ob
t of metal
12-16 25-30
5-6 2
t of metal
50 120 300
Gcal 25 10
50-60 20-30
kW(e) 600 1,100
200-350 m2 150
0.0024 iper kwh) 0.0095 (per kwh) 0.011 (per kwh)
0.0028 O.Oll"(per kwh)
0.01-0.02 (per kwh) (av. 0.15) (per kwh)
New type 20 W 20 10,000 h Electric motor 50 12%'
"Including uranium costs. b ~ e r kW(e) saved. 'Efficiency improvements. d C ~ ~ = coefficient of performance. =Compared with 20% for motor fuel. !life-cycle, in hours.

Sources to Table A3.1:
J.A. Emonds, J.A. Ashton, H.C. Cheng, and M. Steinberg (1989), A Preliminary Analysis of US C02 Emissions Reduction Potential from Energy Conservation and the Substitution of Natural Gas for Coal in the Period to 2010, DOE-NBB-0085, February, US Department of Energy, Washington, DC.
H.C. Cheng, M. Steinberg, and M. Beller (1986), Effects of Energy Technology on Global C 0 2 Emissions. DOE Contract No. DEAC02-76CMO 0016, April, US Department of Energy, Washington, DC.
P. Blair (1987), New Electric Power Technologies: Cost and Performance in the 1992, Energy Systems and Policy lO(3).
K.G. Durrow, D.M. Nesbitt, and R.A. Marshalls (1983), An Analysis of the Benefits of Gas Technology R&D, Energy Systems Policy 7(3): 195-233.
A.S. Nekrasov and Y.V. Sinyak (1965), Industrial Heat Economics, Gosenergoizdat, Moscow (in Russian).
W.C. Heyes (1990), Combustion Turbines, Electrical World 204(5):51-58. P.A. Okken, J.R. Ybema, D. Gerbers, T. Kram, and P. Lako (1991), The Challenge of
Drastic C02 Reduction: Opportunity for New Energy Technologies to Reduce C02 Emissions in the Netherlands Energy System up to 2020, Report for the National Research Programme on Global Air Pollution and Climate Change, ESC-Energy Studies, Petten, Netherlands.

Table A3.2: Expected energy-savings potential at end-use by 2010 for North America, Aus- tral ia, and New Zealand (Mtoe).
2010 Energy-
Enhanced savings Hypothetical Efficiency and potential
Sector/Process 1990 case (1) Conservation (2) [(1)-(2)1 Manufactur ing Thermal uses (useful)
Steam 98.0 142 110 32 Furnace 121.8 176 136 40 Space heating and hot water 23.6 35 2 6 9
Thermal uses in agriculture (final) 13.7 20 16 4
Specific electricity 89.4 130 102 28 Motor fuel (final) 55.6 80 61 19 Metallurgical coke 13.4 11 8 3
Transpor tat ion Motor fuel (final)
Freight 119.0 158 Passenger, intercity 181.0 201 Passenger, urban 183.1 218
Electricity Freight 0 0 Passenger, intercity 0 0 Passenger, urban 1 1
Household Useful energy
Space heating 202.1 280 Hot water 32.5 40 Cooking 10.9 15 Air conditioning 21.2 39
Specific electricity 20.4 46
Services Useful energy
Thermal uses 53.7 70 62 8 Air conditioning 27.5 32 32 0
Specific electricity 62.6 9 1 75 16

Table A3.3: Expected energy-savings potential at end-use by 2010 for Western Europe (Mtoe).
Energy- Enhanced savings
Hypothetical Efficiency and potential Sector/Process 1990 Case (1) Conservation (2) [(1)-(2)1 Manufacturing Thermal uses (useful)
Steam 62.0 90 82 8 Furnace 75.4 110 82 28 Space heating and hot water 14.6 21 19 2
Thermal uses in agriculture (final) 34.1 50 4 0 10
Specific electricity 95.1 138 109 29 Motor fuel (final) 19.7 29 2 1 8 Metallurgical coke 33.8 27 20 7 Transportation Motor fuel (final)
height 79.6 91 6 1 30 Passenger, intercity 111.3 137 84 53 Passenger, urban 53.5 92 38 54
Electricity height 1 1 1 0 Passenger, intercity 3 4 3 1 Passenger, urban 1 2 4 - 2
Household Useful energy
Space heating 170.0 230 180 50 Hot water 31.9 46 40 6 Cooking 18.0 2 1 18 3 Air conditioning 2.5 11 8 3
Specific electricity 25.3 60 4 8 12 Services Useful energy
Thermal uses 38.8 48 44 4 Air conditioning 20.0 8 6 2
Specific electricity 25.4 39 30 9
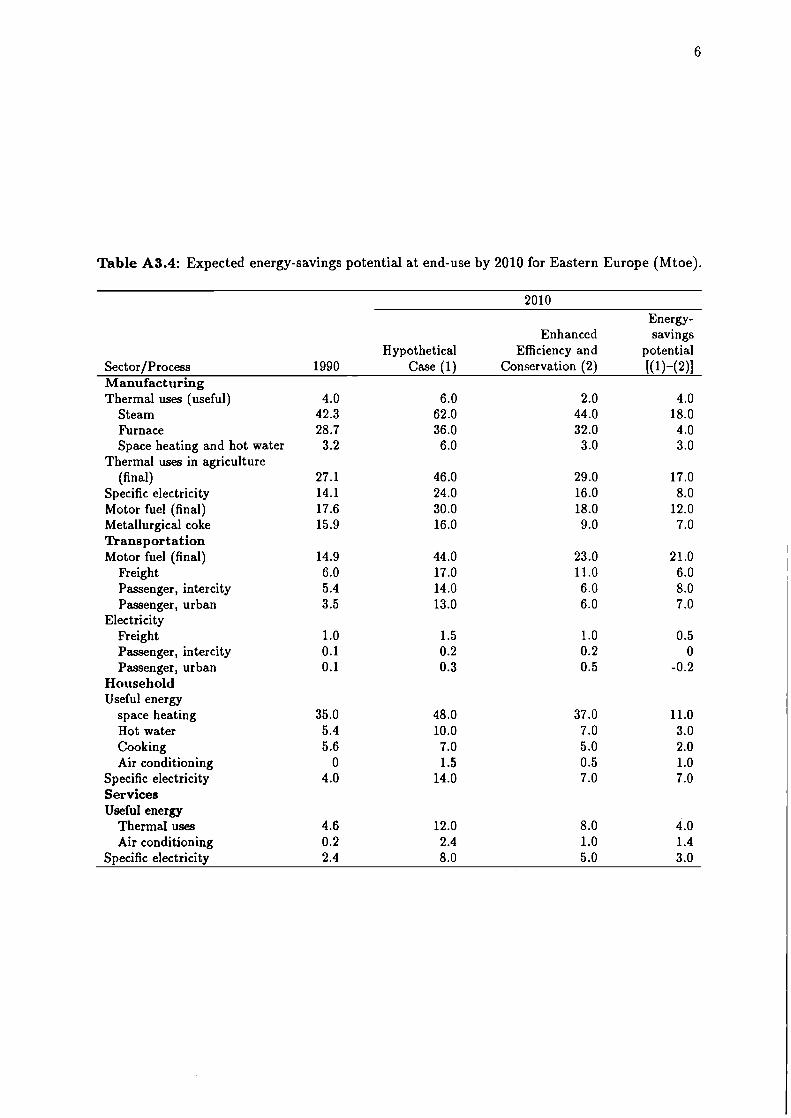
Table A3.4: Expected energy-savings potential at end-use by 2010 for Eastern Europe (Mtoe).
Energy- Enhanced savings
Hypothetical Efficiency and potential Sector/Process 1990 Case (1) Conservation (2) [(1)-(2)1 Manufactur ing Thermal uses (useful) 4.0 6.0 2.0 4.0
Steam 42.3 62.0 44.0 18.0 Furnace 28.7 36.0 32.0 4.0 Space heating and hot water 3.2 6.0 3.0 3.0
Thermal uses in agriculture (final) 27.1 46.0 29.0 17.0
Specific electricity 14.1 24.0 16.0 8.0 Motor fuel (final) 17.6 30.0 18.0 12.0 Metallurgical coke 15.9 16.0 9.0 7.0 Transpor tat ion Motor fuel (final) 14.9 44.0 23.0 21.0
Freight 6.0 17.0 11.0 6.0 Passenger, intercity 5.4 14.0 6.0 8.0 Passenger, urban 3.5 13.0 6.0 7.0
Electricity Freight 1.0 1.5 1.0 0.5 Passenger, intercity 0.1 0.2 0.2 0 Passenger, urban 0.1 0.3 0.5 -0.2
Household Useful energy
space heating 35.0 48.0 37.0 11.0 Hot water 5.4 10.0 7.0 3.0 Cooking 5.6 7.0 5 .O 2.0 Air conditioning 0 1.5 0.5 1.0
Specific electricity 4.0 14.0 7.0 7.0 Services Useful energy
Thermal uses 4.6 12.0 8.0 4.0 Air conditioning 0.2 2.4 1 .O 1.4
Specific electricity 2.4 8.0 5.0 3.0

Table A3.5: Expected energy-savings potential at end-use by 2010 for Japan (Mtoe).
2010 Energy-
Enhanced savings Hypothetical Efficiency and potential
Sector/Process 1990 Case Conservation (2) [(1)-(2)1 Manufacturing Thermal uses (useful)
Steam 16.2 26.0 21.0 5.0 Furnace 19.7 33.0 26.0 7.0 Space heating and hot water 4.0 6.0 5.0 1 .O
Thermal uses in agriculture (final) 4.0 5.0 4.0 1 .O
Specific electricity 36.7 61.0 56.0 5.0 Motor fuel (final) 13.2 22.0 15.0 7.0 Metallurgical coke 11.8 8.0 6.0 2.0 Transportation Motor fuel (final)
. Freight 26.9 36.0 26.0 10.0 Passenger, intercity 6.3 9.0 5.0 4.0 Passenger, urban 10.0 17.0 9.0 9.0
Electricity Freight 0.1 0.2 0.3 -0.1 Passenger, intercity 0.6 0.7 0.7 0 Passenger, urban 0.4 0.6 0.8 -0.2
Household Useful energy
Space heating 8.5 16.0 11 .O 5.0 Hot water 5.0 12.0 11 .O 1 .O Cooking 2.0 3.0 2.0 1 .O Air conditioning 1.4 5.0 5.0 0
Specific electricity 6.5 15.0 8.0 7.0 Services Useful energy
Thermal uses 23.9 25.0 21.0 4.0 Air conditioning 1.4 5.0 5.0 0
Specific electricity 4.2 5.2 4.2 1 .O
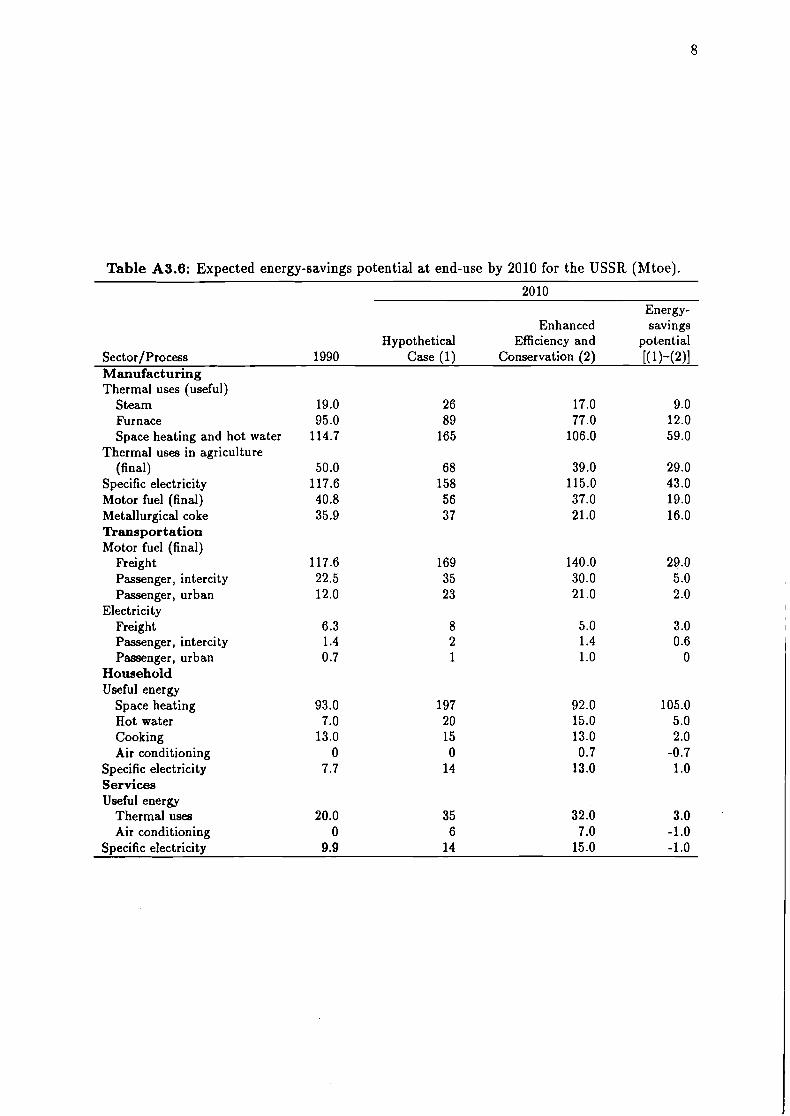
Table A3.6: Expected energy-savings potential at end-use by 2010 for the USSR (Mtoe).
Energy- Enhanced savings
Hypothetical Efficiency and potential Sector/Process 1990 Case (1) Conservation (2) [( 1)-(2:11 Manufacturing Thermal uses (useful)
Steam 19.0 26 17.0 9.0 Furnace 95.0 89 77.0 12.0 Space heating and hot water 114.7 165 106.0 59.0
Thermal uses in agriculture (final) 50.0 68 39.0 29.0
Specific electricity 117.6 158 115.0 43.0 Motor fuel (final) 40.8 56 37.0 19.0 Metallurgical coke 35.9 37 21.0 16.0 Transport at ion Motor fuel (final)
Freight 117.6 169 140.0 29.0 Passenger, intercity 22.5 35 30.0 5.0 Passenger, urban 12.0 23 21 .O 2.0
Electricity Freight 6.3 8 5.0 3.0 Passenger, intercity 1.4 2 1.4 0.6 Passenger, urban 0.7 1 1 .O 0
Household Useful energy
Space heating 93.0 197 92.0 105.0 Hot water 7.0 20 15.0 5.0 Cooking 13.0 15 13.0 2.0 Air conditioning 0 0 0.7 -0.7
Specific electricity 7.7 14 13.0 1 .O Services Useful energy
Thermal uses 20.0 35 32.0 3.0 Air conditioning 0 6 7.0 -1.0
Specific electricity 9.9 14 15.0 -1.0

Table A3.7: Expected energy-savings potential a t end-use by 2010 for Latin America (Mtoe).
2010 Energy-
Enhanced savings Hypothetical Efficiency and potential
Sector/Process 1990 Case (1) Conservation (2) [( 1)-(2)1 Manufacturing Thermal uses (useful)
Steam 28.0 5 1 46 5 Furnace 41.0 80 70 10 Space heating and hot water 1 .O 6 4 2
Thermal uses in agriculture (final) 9.0 17 15 2
Specific electricity 21.7 3 9 39 0 Motor fuel (final) 22.5 41 3 6 5 Metallurgical coke 5.8 7 5 2 Transportation Motor fuel (final)
Freight 64.0 97 75 22 Passenger, intercity 16.7 39 29 10 Passenger, urban 35.4 68 40 28
Electricity Freight Passenger, intercity Passenger, urban
Household Useful energy
Space heating 9.0 15 13 2 Hot water 6.0 16 14 2 Cooking 15.0 23 21 2 Air conditioning 0.3 2 2 0
Specific electricity 9.0 21 18 3 Services Useful energy
Thermal uses 7.0 20 17 3 Air conditioning 1 .O 5 4 1
Specific electricity 5.3 18 15 3

?'able A3.8: Expected energy-savings potential at end-use by 2010 for North Africa and the Middle East (Mtoe).
2010 Energy- savings
potential [(1)-(2)1
Enhanced Efficiency and Hypothetical
Case (1) Sector/Process Manufacturing
Conservation (2)
Thermal uses (useful) Steam Furnace Space heating and hot water
Thermal uses in agriculture (final)
Specific electricity Motor fuel (final) Metallurgical coke Transportation Motor fuel (final)
Freight Passenger, intercity Passenger, urban
Electricity Freight Passenger, intercity Passenger, urban
Household Useful energy
Space heating Hot water Cooking Air conditioning
Specific electricity Services Ueeful energy
Thermal uses Air conditioning
Specific electricity

Table A3.9: Expected energy-savings potential a t end-use by 2010 for other LDCs (Mtoe).
2010 Energy- --
Enhanced savings Hypothetical Efficiency and potential
Sector/Process 1990 case (1) Conservation (2) [( 1)-(2)1 Manufacturing Thermal uses (useful)
Steam Furnace 17.0 33.0 29 4 .O Space heating and hot water 0' 0 0 0
Thermal uses in agriculture (final) 1 .O 1 .O 1 0
Specific electricity 12.3 24.0 25 -1 .O Motor fuel (final) 10.8 38.0 36 2.0 Metallurgical coke 6.2 11.0 8 3.0 Transportation Motor fuel (final)
Freight 17.4 30.0 28 2.0 Passenger, intercity 16.4 35.0 29 6.0 Passenger, urban 48.0 140.0 90 50.0 Steam coal 2.5 5.0 1 4.0
Electricity Freight Passenger, intercity Passenger, urban
Household Useful energy
Space heating 1 .O 2.0 2 0 Hot water 1 .O 3.0 2 1 .O Cooking 30.0 75.0 53 22.0 Air conditioning 0 2.0 1 1 .O
Specific electricity 2.1 7.0 6 1 .O Services Useful energy
Thermal uses 1 .O 3.5 3 0.5 Air conditioning 1 .O 5.0 4 1 .O
Specific electricity 6.2 21.0 18 3.0

Appendix 4
International Workshop on
Modeling and Projections: Summary and Agenda

International Workshop Energy/Ecology/Climate Modeling and Projections
28-29 January 1992
Summary
The Workshop was organized in line with the IIASA 1992 Research Plan and the contract between the International Institute for Applied Systems Analysis (IIASA) and the Central Re- search Institute of Electric Power Industry (CRIEPI) of Japan. The major goal of the workshop was to discuss the details of the global and regional energy projections which usually remain in the shadows at many international meetings and workshops and to make the results more transparent and compatible. More than 50 participants from the West, East, and developing countries attended the workshop.
The workshop started with the detailed presentation by Y. Sinyak on several global/regional energylclimate scenarios and options that are being investigated at IIASA and on major policy measures required for the next decades to follow: the no-regret energy policy and uncertain consequences of global warming. K. Nagano spoke on the implications of the IIASA global scenarios. Three prominent reviewers were invited to comment or criticize the study: J. Edmonds (Battelle, USA), J.-R. Frisch (EDF, France and World Energy Council), and M. Styrikovich (Working Consulting Group of the Russian Academy of Sciences).
The discussions focused on three major issues:
r Better understanding of background and constraints for global energy/ecology/climate modeling exercises: N. NakiCenoviC, A. Griibler, and G. Heilig (IIASA), P. Ghosh (TATA Institute, India), J. LaMontagne (BNL, USA), K. Gorlich (Poland), and J. Swisher (Lund University, Sweden).
r Analysis of numerical results of global energylclimate projections: A. Walker (OPEC), T. Miiller (IAEA), L. Schrattenholzer, S. Messner (IIASA), G. Schmid (Stuttgart University, FRG), K. Yamaji (CRIEPI, Japan).
r New tools and approaches for energylclimate projections and policy actions: C.-0. Wene (Chalmers University, Sweden), S. Peck (EPRI, USA), H. Pitcher (Battelle, USA), M. Amann (IIASA), Y. Fujii (Tokyo University, Japan), V. Litvine (Institute of Global Cli- mate, Russia).
The following conclusions were made during the workshop:
r Many countries in the West and the East as well as some developing countries (e.g., China, India, Zimbabwe) are concerned about the environment.
r No unified view on the necessity of strong policy actions has been achieved (many prefer to wait and observe the actions of big countries such as the USA or the former USSR, but so far these actions have been cautious.
r No unified approach to the selection of policy measures required to stop or postpone global warming, and their evaluations, have been agreed on.
r The methodological support to justify greenhouse gas abatement policy is still very weak.
r There are strong constraints beyond the energy sector which will strongly affect the en- ergy policy and will require immediate discussions at the global level (e.g., population growth control, financing mechanisms especially in developing countries, new approaches to lifestyle in developing countries). In other words, the problem of energy and develop- ment should be addressed at the global level.

International Workshop on Energy/Ecology/Climate Modeling and Projections
International Institute for Applied Systems Analysis A-2361 Laxenburg, Austria
P R O G R A M (as of January 23, 1992)
28 January 1992, Morning Review of the IIASA Scenarios
L. D. Hamilton, Chairman
08:30 Registration
09:OO Welcoming address, P. de Jinosi
09:15 IIASA 's Long-Term Scenario Analysis of Global Energy and Climate Change, Y. Sinyak
10:15 Implications of the IIASA Global Scenarios, K. Nagano
10:45 Coffee Break
11:15 Panel Discussion, J . Edmonds, J.-R. Frisch, and M. Styrikovich (panelists)
12:30 Lunch
28 January 1992, Afternoon Background and Constraints for Global
Energy/Ecology/Climate
M. A. Styrikovich, Chairman
14:OO Environmentally Compatible Energy Strategies, N. NakiCenoviC
14:30 Social Behavior: Limiting Globhl Warming or Limits for Mit- igation? A. Griibler

29 January 1992, Afternoon Global Energy/Ecology/Climate Modeling
J. Edmonds, Chairman
13:30 MARKA L-MA CRO: Linking an Energy Systems Engineering Model to a Macroeconomic Growth Model, A.S. Manne and C.-0. Wene
14:OO CETA: A Model for Carbon Emission Trajectory Assessment, S. Peck and T. J. Teisberg
14:30 Modeling Future Greenhouse Gas Emissions: A First Report from the Second Generation Modeling Project, J . Edmonds and H. Pitcher
15:OO Coffee Break
15:30 Economic Restructure in Eastern Europe and Acid Rain Abate- ment Strategies, M. Amann
16:OO Assessment of C02 Emission Reduction Technologies and Build- ing of a Global Energy Balance Model, Y . Fujii
16:30 MARS Model: Optimization of C02 Abatement Strategies, V . Litvine
17:OO Summary of the Workshop and Closing Remarks

15:OO Strategies and Projections for Future Energy/Environmental Evaluations in Developing Countries, P. Ghosh
15:30 Coffee Break
16:00 Cleaning Air in Krakow: Selecting the Best Approach, J . La- Montagne and K. Gorlich
16:30 World Population: Trends and Prospects, G. Heilig
17:OO Bottom-up Analysis of COz Emission Savings from Forestry, Biomass and Solar Projects, J.N. Swisher
18.00 Social Evening ("Heuriger")
29 January 1992, Morning Global Energy/Ecology/Climate Projections
J.-R. Frisch, Chairman
08:45 Global Economic Repercussions of a Pigouvian Tax: Who Bears the Brunt? A. Walker
09:20 Global Energy Projections in the IEW, L. Schrattenholzer
09:55 Impact of Technological Changes on C02 Emissions in the Elec- tricity Sector, T . Miiller
10:30 Coffee Break
11:OO A Model-Based Analysis of Medium-Term C02 Reduction Strate- gies: The EC Results, G. Schmid
11:30 A Simulation Study on International Trade of C02 Emission Permits, K . Yamaji
12:OO Potential Eflects of Emission Taxes, S. Messner and M. Strub- egger
12:30 Lunch