global distribution of crustal magnetization discovered by...
TRANSCRIPT

DOI: 10.1126/science.284.5415.790 , 790 (1999); 284Science
et al.M. H. Acuña,ExperimentDiscovered by the Mars Global Surveyor MAG/ER Global Distribution of Crustal Magnetization
www.sciencemag.org (this information is current as of April 10, 2009 ):The following resources related to this article are available online at
http://www.sciencemag.org/cgi/content/full/284/5415/790version of this article at:
including high-resolution figures, can be found in the onlineUpdated information and services,
306 article(s) on the ISI Web of Science. cited byThis article has been
http://www.sciencemag.org/cgi/content/full/284/5415/790#otherarticles 12 articles hosted by HighWire Press; see: cited byThis article has been
http://www.sciencemag.org/cgi/collection/planet_sciPlanetary Science
: subject collectionsThis article appears in the following
http://www.sciencemag.org/about/permissions.dtl in whole or in part can be found at: this article
permission to reproduce of this article or about obtaining reprintsInformation about obtaining
registered trademark of AAAS. is aScience1999 by the American Association for the Advancement of Science; all rights reserved. The title
CopyrightAmerican Association for the Advancement of Science, 1200 New York Avenue NW, Washington, DC 20005. (print ISSN 0036-8075; online ISSN 1095-9203) is published weekly, except the last week in December, by theScience
on
Apr
il 10
, 200
9 w
ww
.sci
ence
mag
.org
Dow
nloa
ded
from

O2 (molecular). It is thus possible that CO2 willfinally dissociate into its constituent elements,at multimegabar pressures, directly from thea-quartz phase.
The stability of the a-quartz structure oversuch a large pressure range is surprising, par-ticularly when compared with SiO2, wherea-quartz is observed to transform into coesite at2.1 GPa and then into stishovite at 7.6 GPa. Wesuggest that CO2 behaves differently becausethe C sp3 hybrid is energetically closer than theSi sp3 hybrid to the p state of the bridgingoxygen. Structurally, this implies stabilizationof a more covalent C™O™C bond and, morespecifically, a decrease of the C™O™C bendingangle with respect to Si™O™Si. This is consis-tent with our observation that the C™O™C bend-ing angle in all fourfold coordinated CO2 struc-tures is systematically lower than the corre-sponding values for SiO2 (for a-quartz at zeropressure, we find for CO2 a bending angle of137°, compared with a value of 144° for SiO2).Preference for low C™O™C bending angles maythen explain why CO2 cristobalite, where allbending angles are fixed by symmetry to 180°,and coesite, where the same is true for one ofthe bending angles, are energetically disfavored(Fig. 2). This may also be the rationale for theappearance of the layered-CO2 structure, andm-chalcopyrite, where the bending angles arefound to be about 109° at all pressures.
If a-quartz CO2 could be quenched tozero pressure, we predict that its lattice pa-rameters would be a 5 4.13 Å and c 5 4.58Å, its density 3.28 g/cm3, and its bulk mod-ulus 183 GPa. It would be insulating, with anenergy gap that we estimate to be around 10eV (18). We also calculated the piezoelectricstrain coefficient (19) of a-quartz CO2 at zeropressure, and found it to be 1.0 pC/N, about40% that of SiO2, possibly as a result of thelower ionicity of a-quartz CO2. Finally, wegive an estimate of the relative value of thesecond harmonic intensity ISH of a-quartzCO2 with respect to that of a-quartz SiO2.ISH is proportional (20) to the square of thesecond-order susceptibility x(2) that can beestimated with Miller’s rule (21), and the factthat first-order susceptibility roughly scaleslinearly with electron density and with theinverse square of the energy gap. ISH ofa-quartz CO2 estimated in this way is about50 times larger than that of a-quartz SiO2.
Note added in proof: Recently, Iota et al.(22) have shown that, in agreement with ourfindings, quartzlike CO2 can in fact be syn-thesized above 40 GPa and 1800 K.
References and Notes1. C. A. English and J. A. Venables, Proc. R. Soc. London
Ser. A. 340, 57 (1974).2. B. Kuchta and R. D. Etters, Phys. Rev. B 38, 6265
(1988).3. D. A. Dows and V. Schettino, J. Chem. Phys. 58, 5009
(1973).4. H. Olijnyk et al., ibid. 88, 4204 (1988).5. K. Aoki et al., Science 263, 356 (1994).
6. F. Gygi, Comput. Mater. Sci. 10, 63 (1998).7. R. Lu and A. M. Hofmeister, Phys. Rev. B 52, 3985
(1995).8. H. Olijnyk and A. P. Jephcoat, ibid. 57, 879 (1998).9. L. Liu, Earth Planet. Sci. Lett. 71, 104 (1984).
10. P. Focher et al., Europhys. Lett. 36, 345 (1994).11. S. Scandolo et al., Phys. Rev. Lett. 74, 4015 (1995); M.
Bernasconi et al., ibid. 78, 2008 (1997); J. Kohanoff etal., ibid., p. 2783; F. Ancilotto et al., Science 275,1288 (1997); S. Serra et al., Phys. Rev. Lett. 80, 5160(1998); C. Cavazzoni et al., Science 283, 44 (1999).
12. S. Bernard et al., Phys. Rev. Lett. 81, 2092 (1998).13. A. D. Becke, Phys. Rev. A 38, 3098 (1988); C. Lee, W.
Yang, R. G. Parr, ibid. B 37, 785 (1988).14. L. Kleinman and D. M. Bylander, Phys. Rev. Lett. 48,
1425 (1982).15. N. Trouiller and J. L. Martins, Phys. Rev. B 43, 1993
(1991).16. S. Nose, Mol. Phys. 52, 255 (1984).
17. In this structure carbon is fourfold coordinated tooxygen, oxygen twofold coordinated to carbon, andthe C™O™C bending angle is 109°.
18. The LDA is known to underestimate band gaps. Wecalculate a LDA/GGA gap of 6.5 eV for a-quartz CO2.In a-quartz SiO2 the LDA/GGA band gap is also 6.5eV, compared with an experimental value of about10 eV. Here we assume that the same correctionapplies to CO2.
19. D. Vanderbilt, available at xxx.lanl.gov/abs/cond-mat/9903137.
20. Y. R. Shen, The Principles of Nonlinear Optics (Wiley,New York, 1984).
21. R. C. Miller, Appl. Phys. Lett. 5, 17 (1964); Y. R. Shen,in (20), p. 37.
22. V. Iota, C. S. Yoo, H. Cynn, Science 283, 1510 (1999).23. We acknowledge partial support from INFM and
MURST.
21 December 1998; accepted 18 March 1999
Global Distribution of CrustalMagnetization Discovered by
the Mars Global SurveyorMAG/ER Experiment
M. H. Acuna,1 J. E. P. Connerney,1 N. F. Ness,2 R. P. Lin,3
D. Mitchell,3 C. W. Carlson,3 J. McFadden,3 K. A. Anderson,3
H. Reme,4 C. Mazelle,4 D. Vignes,4 P. Wasilewski,1 P. Cloutier5
Vector magnetic field observations of the martian crust were acquired by theMars Global Surveyor (MGS) magnetic field experiment/electron reflectometer(MAG/ER) during the aerobraking and science phasing orbits, at altitudes be-tween ;100 and 200 kilometers. Magnetic field sources of multiple scales,strength, and geometry were observed. There is a correlation between thelocation of the sources and the ancient cratered terrain of the martian high-lands. The absence of crustal magnetism near large impact basins such as Hellasand Argyre implies cessation of internal dynamo action during the earlyNaochian epoch (;4 billion years ago). Sources with equivalent magneticmoments as large as 1.3 3 1017 ampere-meter2 in the Terra Sirenum regioncontribute to the development of an asymmetrical, time-variable obstacle tosolar wind flow around Mars.
The primary science goals of the MAG/ERinvestigation are the detection and characteriza-tion of the magnetic field of the planet and thestudy of its interaction with the solar wind.Vector measurements of the ambient magneticfield are acquired by a twin fluxgate magne-tometer system. An electron reflection analyzeris used to remotely sense magnetic fields ofplanetary origin at the top of the martian atmo-sphere and to provide information about thelocal electron distribution function (1, 2). Mea-surements made early in the mission estab-lished unambiguously that Mars does not cur-
rently possess a significant global magneticfield, with an estimated upper limit for a Marsdipole moment of ;2 3 1018 A-m2.
At the same time the detection of strong,small-scale crustal magnetic sources associ-ated with the ancient, heavily cratered terrainrevealed that Mars must have had an internalactive dynamo in its past, which is now ex-tinct (1).
The first part of the aerobraking phase ofMGS (AB1) was carried out between Septem-ber and November 1997 and was followed byaerobraking hiatus orbits (AHO) and sciencephasing orbits SPO1 and SPO2 from March toJuly 1998. The latter were designed to allow theheliocentric motion of Mars to bring the space-craft orbit plane into the desired alignment withthe Mars-sun direction before initiating the sec-ond aerobraking phase AB2 and “pop-up” ma-neuver which would raise periapsis to achievethe final mapping orbit. These recently com-
1NASA Goddard Space Flight Center, Greenbelt, MD20771, USA. 2Bartol Research Institute, University ofDelaware, Newark, DE 19716, USA. 3Space SciencesLaboratory, University of California, Berkeley, CA94720, USA. 4Centre d’Etude Spatiale des Rayonne-ments, 31028 Toulouse Cedex 4, France. 5Departmentof Space Physics and Astronomy, Rice University,Houston, TX, 77005, USA.
R E P O R T S
30 APRIL 1999 VOL 284 SCIENCE www.sciencemag.org790
on
Apr
il 10
, 200
9 w
ww
.sci
ence
mag
.org
Dow
nloa
ded
from

pleted maneuvers circularized the orbit at;380-km altitude in the 2 a.m.–2 p.m. localtime plane. During AB1, AHO, SPO1, andSPO2 the latitude of periapsis, startingaround ;30°N, progressed slowly toward andover the north pole, allowing detailed samplingof this region at altitudes between 170 and 200km. The AB2 phase started in late December1998 lowered periapsis altitude to ;100 kmand introduced rapid southward progression ofperiapsis latitude, reaching a maximum of 87°Sbefore the termination of aerobraking. Magnet-ic field measurements were performed duringmost of AB2 for periods of 30 to 60 mincentered around periapsis.
The instrumentation associated with theMAG/ER investigation has been described inmore detail in (1) and (2) and a brief summa-ry is given in (3). Using data compression,the fluxgate magnetometers are capable ofacquiring up to 32 vector samples per secondwhen downlink rates are high, but here wereport results obtained with “full word” 12-bit vector samples that occurred every 0.75 to3 s depending on the selected data rate. Thissampling rate was sufficient for the unaliaseddetection of crustal magnetic sources at alti-tudes .100 km and a spacecraft velocity atperiapsis of ;4 km s21. The estimated accu-racy of the measurements is 63 nT (4). Wereport here observations carried out duringthe 916 elliptical orbits for which magneticfield data were acquired, from the start to theend of AB1, through AHO, SPO1, and SPO2,and to near the end of AB2 when spacecraftresource limitations could no longer supportdata acquisition. Longitude coverage wasglobally distributed but sparse. Consideringthat the equivalent “pixel” size of the mag-netic field observations can be represented asa square with a side dimension about equiv-alent to the orbital height, the spatial cover-age achieved below 200 km amounts to;20% of the surface of the planet.
The dense spatial coverage achieved bythe MGS orbit over the north pole of Marsmade possible the detailed mapping of sev-eral relatively weak but discrete magneticsource regions centered around 330°W lon-gitude and extending from 60°N to almost90°N in latitude (Fig. 1). The highly ellipticalorbit of MGS with varying periapsis altitudeintroduced complications in the modeling andestimation of possible source geometry andstrength (magnetic moment). As the space-craft altitude increased, the shorter spatialwavelengths associated with the crustalsources were attenuated. Magnetic profilesobtained on adjacent passes (nearby in longi-tude), when plotted as a function of time, mayappear different if the altitude was variable.The MGS observations over the north pole ofMars were acquired over periapsis altitudesbetween 170 and 200 km, which results innegligible variation in magnetic profiles of
the sources over adjacent orbits. An addition-al source of error is the contribution of “mag-netic noise” by ionospheric currents inducedby the Mars–solar wind interaction, whichbecomes important above 120 to 150 km. The
reduction of source geometry and strength toa common altitude using continuation meth-ods similar to those used for terrestrial mag-netic anomalies (5 ) has not been carried out.Because the draping of the interplanetary
0°
180°
0°
180°
Br (nT)-40 -20 0 20 40
60°
80°70°
60°
80°
70°
90°W 270°W90°W270°W
Fig. 1. Polar stereographic projection from 55°N latitude to the north pole of Mars. (Left) Radial(vertical) component of the field, where blue represents the magnetic field direction into the planetand red represents the direction out of the planet. The spacecraft periapsis altitude was ;170 kmduring this time. Data taken between 170 and 200 km have been organized in 100 km by 100 kmbins, median sorted, and smoothed to yield the contours shown. (Right) Mars north polar regionimage of topography corresponding to the left panel above included for reference (16). The northpolar ice cap of Mars is the white, scalloped region visible in the center of the figure and is elevatedabove its surroundings by ;3 km.
Fig. 2. Map showing the location and intensity of crustal magnetic sources detected by the MGS-MAG/ER experiment superimposed on a topographic image of Mars (16). The measured radial(vertical) component of the magnetic field associated with the crustal sources is illustrated by thecolor scale shown. No correction has been made for the varying spacecraft altitude, which resultsin attenuation of the small-scale signature of the sources with increasing altitude. The dichotomyboundary is marked by the solid line separating the northern lowlands from the southern highlands(8). Data acquired at altitudes between ;100 and 200 km for 916 elliptical orbits are included. Thecolor scale has been chosen to illustrate the relative intensity of the crustal sources. Note the largerange in magnetic field intensity associated with this color scale versus that shown in Fig. 1.
R E P O R T S
www.sciencemag.org SCIENCE VOL 284 30 APRIL 1999 791
on
Apr
il 10
, 200
9 w
ww
.sci
ence
mag
.org
Dow
nloa
ded
from

magnetic field over the martian ionospheredue to the solar wind interaction results inmostly horizontal components parallel to theplanet’s surface (6 ), the radial component ofthe crustal field is largely free of ionospheric
contributions and may be used as a sensitiveindicator of the presence of magnetic sourcesin the crust.
The data from the north polar region whereMGS coverage was dense were binned and
sorted into 100 km by 100 km regions and themedian value of the bins determined. This pro-cedure yielded smoothed isocontours of theradial component of the crustal magnetic fieldwhich range from 240 nT to 140 nT at 170 to200 km (Fig. 1). This process yielded estimateduncertainties ranging from ;3 to 10 nT, de-pending on the number of estimates in each bin,resulting in smaller uncertainties at higher lati-tudes. An approximate calculation using a sin-gle-dipole model at ;100-km depth yields anequivalent moment of ;1016 A-m2 for thesesources. There were no other crustal magneticsources in this region of the northern lowlands,which is one of the youngest geological prov-inces of Mars as determined by the low impactcrater density and evidence of repeated volca-nism. No gravity, topography, or geologicalfeature has been associated with the north polarmagnetic sources detected by MGS althoughthe presence in this region of significant gravityanomalies is suggestive (7) of an associationwith deep, iron-rich concentrations in the crust.
The Mars–solar wind interaction is pri-marily atmospheric in nature (1), and thepronounced draping of the interplanetarymagnetic field over the ionosphere in thenorth polar region, superposed with the mag-netic field from the crustal sources, gives riseto asymmetries and the formation of localizedEarth-like “cusps” and/or magnetic reconnec-tion regions where plasmas from the martianionosphere, its comet-like tail, and the solarwind can intermix.
Contrary to the observations in SPO1 andSPO2, as the latitude of periapsis progressedsouthward in the AB2 phase (in 3 weeks), morefrequent and intense crustal sources were de-tected, particularly in the range of 120°W to210°W and 30°S to 85°S, where total fields aslarge as ;1600 nT at orbital altitude (;100km) were observed (radial component shown inFigs. 2 to 4). Because of the sparse coverageover these regions, it was not possible to binand median sort the data. Superposition of dataobtained for multiple nonoverlapping orbitsover the planet’s surface was used to identifyand map the distribution of magnetic sources inthe martian crust. The wide dynamic range inthe strength (magnetic moment) of the sourcesmakes their graphic visualization difficult withlinear color scales on a global map (Fig. 2),although this map helps to illustrate the relativelocation and intensity of the sources. The weak-er magnetic sources disappear in the back-ground, overwhelmed by more intense sources.In order to approximate a logarithmic represen-tation of field magnitude, the color scale wasadjusted to make all the sources look similarusing a highly compressed color scale. Infor-mation about their relative intensity is lost, butthe location and approximate morphology of allthe sources detected were enhanced (Figs. 3 and4). The majority of the crustal magnetic sourceslie south of the dichotomy boundary on the
Fig. 3. Map showing the distribution of crustal magnetic field sources superimposed on a map showingthe distribution of craters greater than 15 km in diameter (8) and the dichotomy boundary (solid line).The spacecraft tracks below 200-km altitude have been projected onto the surface as light green thicklines to illustrate the orbital coverage. The thickness of the subsatellite tracks has been chosen toapproximate the equivalent “pixel” size for the observations as discussed in the text. The measuredradial (vertical) component of the magnetic field associated with the crustal sources is illustrated usinga color scale that reveals the location of significant magnetic sources detected regardless of intensity.Note the high correlation between the region where magnetic crustal sources appear and high craterdensities (ancient terrain) and the absence of magnetic imprints within the Hellas, Argyre, and Isidisimpact basins. No magnetic signatures have been found over Elysium, Olympus Mons, or TharsisMontes.
Fig. 4. Polar stereographic projection from 55°S to the south pole of Mars. (Left) The radial(vertical) component of the magnetic field is illustrated using the same color scale as Fig. 3.Coverage of this region is sparse and does not allow binning, sorting, and smoothing as done forFig 1. Superposition of magnetic field data acquired from largely nonoverlapping orbits is showninstead. Note the change in intensity scale with respect to Fig. 1. The polar stereographic projectionprovides a more realistic spatial illustration of the Terra Sirenum crustal sources, where linearlystructured magnetic field sources are found. (Right) Mars south polar region topographic imagecorresponding to the left panel above included for reference (16).
R E P O R T S
30 APRIL 1999 VOL 284 SCIENCE www.sciencemag.org792
on
Apr
il 10
, 200
9 w
ww
.sci
ence
mag
.org
Dow
nloa
ded
from
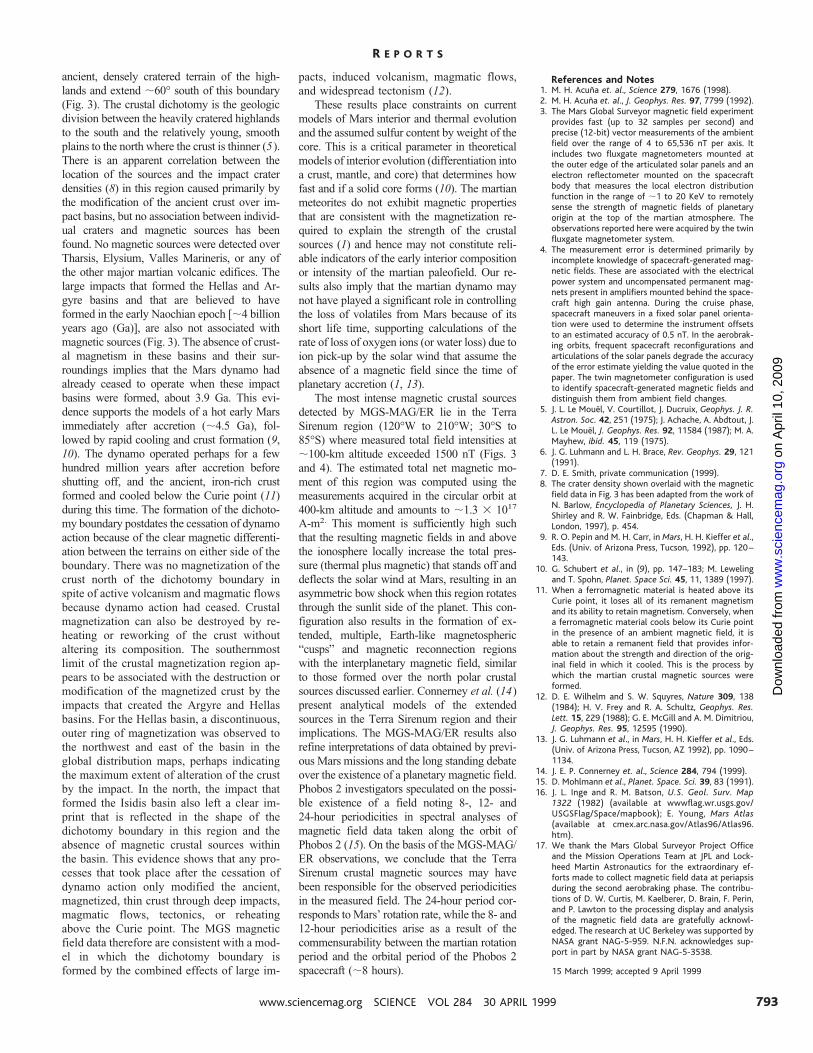
ancient, densely cratered terrain of the high-lands and extend ;60° south of this boundary(Fig. 3). The crustal dichotomy is the geologicdivision between the heavily cratered highlandsto the south and the relatively young, smoothplains to the north where the crust is thinner (5).There is an apparent correlation between thelocation of the sources and the impact craterdensities (8) in this region caused primarily bythe modification of the ancient crust over im-pact basins, but no association between individ-ual craters and magnetic sources has beenfound. No magnetic sources were detected overTharsis, Elysium, Valles Marineris, or any ofthe other major martian volcanic edifices. Thelarge impacts that formed the Hellas and Ar-gyre basins and that are believed to haveformed in the early Naochian epoch [;4 billionyears ago (Ga)], are also not associated withmagnetic sources (Fig. 3). The absence of crust-al magnetism in these basins and their sur-roundings implies that the Mars dynamo hadalready ceased to operate when these impactbasins were formed, about 3.9 Ga. This evi-dence supports the models of a hot early Marsimmediately after accretion (;4.5 Ga), fol-lowed by rapid cooling and crust formation (9,10). The dynamo operated perhaps for a fewhundred million years after accretion beforeshutting off, and the ancient, iron-rich crustformed and cooled below the Curie point (11)during this time. The formation of the dichoto-my boundary postdates the cessation of dynamoaction because of the clear magnetic differenti-ation between the terrains on either side of theboundary. There was no magnetization of thecrust north of the dichotomy boundary inspite of active volcanism and magmatic flowsbecause dynamo action had ceased. Crustalmagnetization can also be destroyed by re-heating or reworking of the crust withoutaltering its composition. The southernmostlimit of the crustal magnetization region ap-pears to be associated with the destruction ormodification of the magnetized crust by theimpacts that created the Argyre and Hellasbasins. For the Hellas basin, a discontinuous,outer ring of magnetization was observed tothe northwest and east of the basin in theglobal distribution maps, perhaps indicatingthe maximum extent of alteration of the crustby the impact. In the north, the impact thatformed the Isidis basin also left a clear im-print that is reflected in the shape of thedichotomy boundary in this region and theabsence of magnetic crustal sources withinthe basin. This evidence shows that any pro-cesses that took place after the cessation ofdynamo action only modified the ancient,magnetized, thin crust through deep impacts,magmatic flows, tectonics, or reheatingabove the Curie point. The MGS magneticfield data therefore are consistent with a mod-el in which the dichotomy boundary isformed by the combined effects of large im-
pacts, induced volcanism, magmatic flows,and widespread tectonism (12).
These results place constraints on currentmodels of Mars interior and thermal evolutionand the assumed sulfur content by weight of thecore. This is a critical parameter in theoreticalmodels of interior evolution (differentiation intoa crust, mantle, and core) that determines howfast and if a solid core forms (10). The martianmeteorites do not exhibit magnetic propertiesthat are consistent with the magnetization re-quired to explain the strength of the crustalsources (1) and hence may not constitute reli-able indicators of the early interior compositionor intensity of the martian paleofield. Our re-sults also imply that the martian dynamo maynot have played a significant role in controllingthe loss of volatiles from Mars because of itsshort life time, supporting calculations of therate of loss of oxygen ions (or water loss) due toion pick-up by the solar wind that assume theabsence of a magnetic field since the time ofplanetary accretion (1, 13).
The most intense magnetic crustal sourcesdetected by MGS-MAG/ER lie in the TerraSirenum region (120°W to 210°W; 30°S to85°S) where measured total field intensities at;100-km altitude exceeded 1500 nT (Figs. 3and 4). The estimated total net magnetic mo-ment of this region was computed using themeasurements acquired in the circular orbit at400-km altitude and amounts to ;1.3 3 1017
A-m2. This moment is sufficiently high suchthat the resulting magnetic fields in and abovethe ionosphere locally increase the total pres-sure (thermal plus magnetic) that stands off anddeflects the solar wind at Mars, resulting in anasymmetric bow shock when this region rotatesthrough the sunlit side of the planet. This con-figuration also results in the formation of ex-tended, multiple, Earth-like magnetospheric“cusps” and magnetic reconnection regionswith the interplanetary magnetic field, similarto those formed over the north polar crustalsources discussed earlier. Connerney et al. (14)present analytical models of the extendedsources in the Terra Sirenum region and theirimplications. The MGS-MAG/ER results alsorefine interpretations of data obtained by previ-ous Mars missions and the long standing debateover the existence of a planetary magnetic field.Phobos 2 investigators speculated on the possi-ble existence of a field noting 8-, 12- and24-hour periodicities in spectral analyses ofmagnetic field data taken along the orbit ofPhobos 2 (15). On the basis of the MGS-MAG/ER observations, we conclude that the TerraSirenum crustal magnetic sources may havebeen responsible for the observed periodicitiesin the measured field. The 24-hour period cor-responds to Mars’ rotation rate, while the 8- and12-hour periodicities arise as a result of thecommensurability between the martian rotationperiod and the orbital period of the Phobos 2spacecraft (;8 hours).
References and Notes1. M. H. Acuna et. al., Science 279, 1676 (1998).2. M. H. Acuna et. al., J. Geophys. Res. 97, 7799 (1992).3. The Mars Global Surveyor magnetic field experiment
provides fast (up to 32 samples per second) andprecise (12-bit) vector measurements of the ambientfield over the range of 4 to 65,536 nT per axis. Itincludes two fluxgate magnetometers mounted atthe outer edge of the articulated solar panels and anelectron reflectometer mounted on the spacecraftbody that measures the local electron distributionfunction in the range of ;1 to 20 KeV to remotelysense the strength of magnetic fields of planetaryorigin at the top of the martian atmosphere. Theobservations reported here were acquired by the twinfluxgate magnetometer system.
4. The measurement error is determined primarily byincomplete knowledge of spacecraft-generated mag-netic fields. These are associated with the electricalpower system and uncompensated permanent mag-nets present in amplifiers mounted behind the space-craft high gain antenna. During the cruise phase,spacecraft maneuvers in a fixed solar panel orienta-tion were used to determine the instrument offsetsto an estimated accuracy of 0.5 nT. In the aerobrak-ing orbits, frequent spacecraft reconfigurations andarticulations of the solar panels degrade the accuracyof the error estimate yielding the value quoted in thepaper. The twin magnetometer configuration is usedto identify spacecraft-generated magnetic fields anddistinguish them from ambient field changes.
5. J. L. Le Mouel, V. Courtillot, J. Ducruix, Geophys. J. R.Astron. Soc. 42, 251 (1975); J. Achache, A. Abdtout, J.L. Le Mouel, J. Geophys. Res. 92, 11584 (1987); M. A.Mayhew, ibid. 45, 119 (1975).
6. J. G. Luhmann and L. H. Brace, Rev. Geophys. 29, 121(1991).
7. D. E. Smith, private communication (1999).8. The crater density shown overlaid with the magnetic
field data in Fig. 3 has been adapted from the work ofN. Barlow, Encyclopedia of Planetary Sciences, J. H.Shirley and R. W. Fainbridge, Eds. (Chapman & Hall,London, 1997), p. 454.
9. R. O. Pepin and M. H. Carr, in Mars, H. H. Kieffer et al.,Eds. (Univ. of Arizona Press, Tucson, 1992), pp. 120–143.
10. G. Schubert et al., in (9), pp. 147–183; M. Lewelingand T. Spohn, Planet. Space Sci. 45, 11, 1389 (1997).
11. When a ferromagnetic material is heated above itsCurie point, it loses all of its remanent magnetismand its ability to retain magnetism. Conversely, whena ferromagnetic material cools below its Curie pointin the presence of an ambient magnetic field, it isable to retain a remanent field that provides infor-mation about the strength and direction of the orig-inal field in which it cooled. This is the process bywhich the martian crustal magnetic sources wereformed.
12. D. E. Wilhelm and S. W. Squyres, Nature 309, 138(1984); H. V. Frey and R. A. Schultz, Geophys. Res.Lett. 15, 229 (1988); G. E. McGill and A. M. Dimitriou,J. Geophys. Res. 95, 12595 (1990).
13. J. G. Luhmann et al., in Mars, H. H. Kieffer et al., Eds.(Univ. of Arizona Press, Tucson, AZ 1992), pp. 1090–1134.
14. J. E. P. Connerney et. al., Science 284, 794 (1999).15. D. Mohlmann et al., Planet. Space. Sci. 39, 83 (1991).16. J. L. Inge and R. M. Batson, U.S. Geol. Surv. Map
1322 (1982) (available at wwwflag.wr.usgs.gov/USGSFlag/Space/mapbook); E. Young, Mars Atlas(available at cmex.arc.nasa.gov/Atlas96/Atlas96.htm).
17. We thank the Mars Global Surveyor Project Officeand the Mission Operations Team at JPL and Lock-heed Martin Astronautics for the extraordinary ef-forts made to collect magnetic field data at periapsisduring the second aerobraking phase. The contribu-tions of D. W. Curtis, M. Kaelberer, D. Brain, F. Perin,and P. Lawton to the processing display and analysisof the magnetic field data are gratefully acknowl-edged. The research at UC Berkeley was supported byNASA grant NAG-5-959. N.F.N. acknowledges sup-port in part by NASA grant NAG-5-3538.
15 March 1999; accepted 9 April 1999
R E P O R T S
www.sciencemag.org SCIENCE VOL 284 30 APRIL 1999 793
on
Apr
il 10
, 200
9 w
ww
.sci
ence
mag
.org
Dow
nloa
ded
from