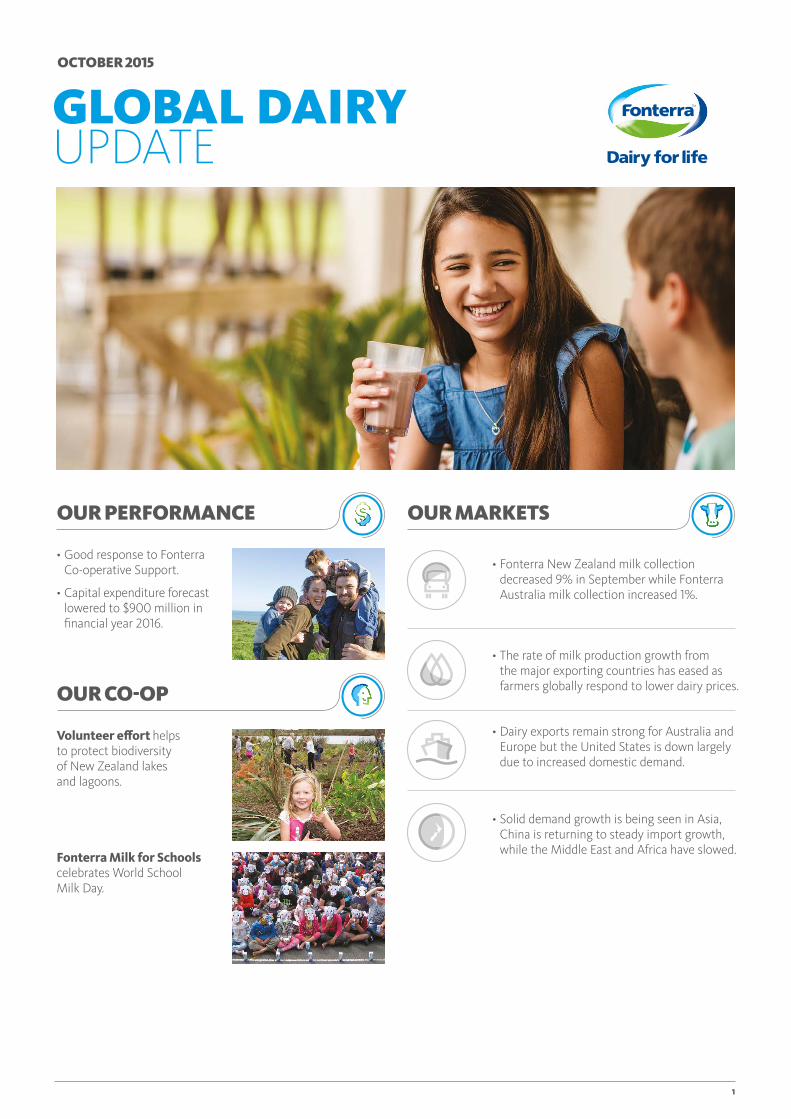
global dairy update...fonterra milk for schools celebrates world school milk day. • good response...
TRANSCRIPT
1
GLOBAL DAIRY UPDATE
OCTOBER 2015
OUR PERFORMANCE OUR MARKETS
OUR CO-OP
Volunteer effort helps to protect biodiversity of New Zealand lakes and lagoons.
Fonterra Milk for Schools celebrates World School Milk Day.
• Good response to Fonterra Co-operative Support.
• Capital expenditure forecast lowered to $900 million in financial year 2016.
• Fonterra New Zealand milk collection decreased 9% in September while Fonterra Australia milk collection increased 1%.
• The rate of milk production growth from the major exporting countries has eased as farmers globally respond to lower dairy prices.
• Dairy exports remain strong for Australia and Europe but the United States is down largely due to increased domestic demand.
• Solid demand growth is being seen in Asia, China is returning to steady import growth, while the Middle East and Africa have slowed.

2
OUR MARKETS
PRODUCTION
THE RATE OF MILK PRODUCTION GROWTH FROM THE MAJOR EXPORTING COUNTRIES HAS EASED AS FARMERS GLOBALLY RESPOND TO LOWER DAIRY PRICES
Australia production in July increased 5% compared to the same month last year. This is the seventh consecutive increase in production.
Production in the year to July increased 3% compared to the same period last year.
New Zealand production decreased 1% in August compared to the same month last year as the season got underway.
Peak milk collection occurs around mid-October.
Although milk production in the year to August was up 1%, unfavourable spring pasture growth conditions and the low milk price environment continue to put downward pressure on milk production.
Production increase from January to July 2015
Production increase from January to August 2015
AUSTRALIANEW ZEALAND
3%1%
US production increased 1% in August compared to the same month last year.
While the rate of growth has slowed, the United States Department of Agriculture estimates US production will increase by 1.4% in 2015.
Milk production in the year to August has also increased 1% compared to the same period last year.
USA
Production in the EU in July increased 3% compared to the same month last year.
In the four months following the quota removal, on 1 April 2015, Ireland was up 12%, Netherlands up 7%, the UK up 4% and Germany up 2%.
Production in the year to July increased 1% compared to the same period last year. The EU Commission is forecasting milk collection to increase 1% in 2015 which remains lower than the growth originally anticipated by the market.
Production increase from January to July 2015
Production increase from January to August 2015
EUROPEAN UNION
1%
To view a chart that illustrates year-on-year changes in production –
1%

3
%
OUR MARKETS
EXPORTS
DAIRY EXPORTS REMAIN STRONG FOR AUSTRALIA AND EUROPE BUT THE UNITED STATES IS DOWN LARGELY DUE TO INCREASED DOMESTIC DEMAND
New Zealand exports increased 15% in July compared to the same month last year. Increases were seen across most of the major dairy catagories, excluding SMP which decreased 17%.
Exports in the year to July remain 2% higher when compared to the same period last year. Increases of 20% for cheese and 13% for SMP were partially offset by butter down 11%, WMP down 5% and AMF down 4%.
EU exports increased 15% in June compared to the same month last year. This increase was driven by whey powder and fluid and fresh dairy increasing 48% and 39% respectively.
Exports increased 4% in the year to June due to increases in fluid and fresh dairy up 13%, SMP and whey powder up 9%, and infant formula up 8%.
Export decrease from January to July 2015
NEW ZEALAND EUROPEAN UNION
11
US exports decreased 13% in July compared to the same month last year. Other than in April 2015, the US has experienced negative growth in dairy exports since June 2014.
Exports in the year to July decreased 11%, reflecting a drop across most of the major dairy categories, in particular cheese, down 13%, and whey powder, down 12%. This decrease in exports is largely a result of higher domestic demand, particularly cheese and butter.
Export increase from January to July 2015
USA
9
Australia exports increased 13% in July compared to the same month last year largely driven by SMP increasing 31% and fluid and fresh dairy up 18%.
Exports in the year to July have increased 9% when compared to the same period last year. This is led by SMP up 28%, fluid and fresh dairy up 11% and cheese up 10%.
AUSTRALIA
%
Export increase from January to July 2015
2Export increase from January to June 2015
4
To view a chart that illustrates year-on-year changes in exports –
%%

4
OUR MARKETS
IMPORTS
SOLID DEMAND GROWTH IS BEING SEEN ACROSS ASIA, CHINA IS RETURNING TO STEADY GROWTH WHILE THE MIDDLE EAST AND AFRICA HAVE SLOWED
Asia (excluding China)1 import volumes increased 8% in June compared to the same month last year, with increases seen across all major dairy categories.
Imports in the year to June remain strong, increasing 13% as a result of SMP up 25%, WMP up 19%, cheese up 16% and fluid and fresh dairy up 10%.
Import increase from January to June 2015
ASIA
13
China imports increased 9% in August and this is the second consecutive month that imports have increased compared to the same month last year. This increase was largely a result of increased imports of fluid and fresh dairy, whey powder and infant formula.
Imports in the year to August decreased 19% when compared to the same period last year. This decrease is largely a result of powders, with WMP down 54% and SMP down 24%. Infant formula and fluid and fresh dairy have increased 30% and 27% respectively.
Import decrease from January to August 2015
CHINA
19
Imports into the Middle East and Africa decreased 4% in June compared to the same month last year. This was due to a decrease across all major dairy categories excluding fluid and fresh dairy which increased 20%.
Imports in the year to June increased 2%, however the rate of growth has slowed in recent months. WMP and fluid and fresh dairy have increased 18% and 8% respectively, when compared to the same period last year.
MIDDLE EAST & AFRICA
1 Includes estimate for Indonesia in May and June
% %
Import increase from January to June 2015
2%
To view a chart that illustrates year-on-year changes in imports –

5
OUR MARKETS
FONTERRA MILK COLLECTION 2015/16 SEASON
Australia milk collection in September reached 13 million kgMS which is in line with September last season.
Milk collection across Australia for the three months to 30 September reached 30 million kgMS, 2% above the same period last season.
North Island collection in September reached 116 million kgMS, 10% lower than September last season.
South Island milk collection in September was 62 million kgMS, 7% below September last season.
NORTH ISLANDNEW ZEALAND
Increase for the season to date from 1 July to 30 September compared to same period last season
2Decrease for the season to date from 1 June to 30 September compared to same period last season
AUSTRALIA
4SOUTH ISLAND
Fonterra’s milk collection across New Zealand in September was 9% lower than September last year. For the four months to 30 September it reached 305 million kgMS, 5% behind the same period last season. Farmers continue to reduce stocking rates and supplementary feed to help reduce costs in the low milk price environment. This has resulted in lower production for the 2015/16 season to date.
In New Zealand, milk volumes are approaching the seasonal peak which is forecast for mid-October 2015.
MAYAPRMARFEBJANDECNOVOCTSEPAUGJULJUN
2015/16 2014/15 2013/14
VO
LUM
E (M
LIT
RES
/DAY
)
0
20
40
60
80
100
% %
To view a table that shows our detailed milk collection in New Zealand and Australia compared to the previous season –
Decrease for the season to date from 1 June to 30 September compared to same period last season
6%
NEW ZEALAND MILK COLLECTION

6
OUR MARKETS
DAIRY COMMODITY PRICES
CHEDDAR
0.5%
12.9%WMP
13.8%BMP SMP
13.4%Compared to the last trading event:The GDT price index increased for the fourth consecutive event. All dairy prices excluding butter increased compared to the last trading event.
Dairy commodity prices and New Zealand dollar trend
The New Zealand dollar has recently strengthened against the US dollar, increasing off the multi-year lows.
Last trading event 6 October 2015:The Fonterra volume sold was 33,320 MT, with weighted average prices increasing 11.2% compared to the last event.
The next trading event will be held on 20 October 2015. Visit www.globaldairytrade.info for more information.
To view a table that summarises the latest results and provides a snapshot of the rolling year-to-date results –
0
300
600
900
1,200
1,500
SEP 15 OCT 15JUL 15MAY 15MAR 15JAN 15NOV 14SEP 14JUL 14MAY 14MAR 14JAN 14NOV 13SEP 13
NZD/USD SPOT RATEGDT PRICE INDEX
0.60
0.65
0.70
0.75
0.80
0.85
USD 3,234/MT
USD 2,267/MTUSD 1,945/MT USD 2,824/MT
GDT Price Index
9.9%
GDT Average winning price (USD/MT, FAS)
2,834USD
AMF
9.9%
2.3%
4.0%
RENNET CASEIN
BUTTER
USD 3,763/MT
USD 3,037/MT
USD 6,048/MT

7
Good response to Fonterra Co-operative Support
Fonterra Co-operative Support is all about standing together as a Co-operative and using the collective strength of Fonterra to help farmers get through these tough times.
The underlying strength of the Co-operative, including one-off cash savings such as working capital, that the business is currently making, means we are able to help smooth the impact of low global milk prices by making interest-free loans available to Fonterra farmers.
The Support provides 50 cents for every share-backed kgMS produced between 1 June and 1 December 2015 and is interest-free until 31 May 2017.
Farmers can repay all or part of the loan at any time, but repayments commence when the Total Advance Rate Payment exceeds $6.00 per kgMS.
Applications have closed with 76% (or around 7,800) farmers choosing to participate. In the first month of payment those
participating will receive a payment of 12 cents per kgMS, or $30 million over 255 million kgMS. Total payments for Fonterra Co-operative Support may reach around $390 million through to May and will be funded as cash is generated from one-off working capital savings from the business transformation.
OUR PERFORMANCE
CO-OP SUPPORT PAYMENTS (CUMULATIVE FORECAST)
September paid October $0.12
October paid November $0.15
November paid December $0.18
December paid January $0.21
January paid February $0.28
February paid March $0.35
March paid April $0.42
April paid May $0.50
TOTAL $0.50
Capital expenditure forecast lowered in financial year 2016
In financial year 2015, we rounded off one of our largest phases of capacity development. This includes investments in the Pahiatua powder dryer, the Edendale expansion and additional capacity in our consumer and foodservice business with investments in mozzarella at Clandeboye and slice-on-slice cheese at Eltham.
In addition, our on-going strategic investment in China Farms and continued essential expenditure (including health and safety, food safety and maintenance) resulted in total capex of around $1.5 billion in financial year 2015.
We have reduced our capital expenditure forecast significantly in financial year 2016 to more normal historical levels of $900 million. Of this, we are prioritising four key areas:
• Growth – our strategy emphasises shifting greater volumes of milk into higher-returning products, and these investments in the consumer and foodservice segment remain a priority.
• Capacity – with capacity now more in line with current expectations of milk growth, we have reduced this significantly.
The key investment is around $220 million in the completion of Lichfield.
• Essential – includes items such as tanker replacement, investment in food safety and quality, and maintenance.
• China Farms – we are slowing the development phase and will complete our second hub in 2016.

8
Volunteer effort protects biodiversity of NZ lakes and lagoons
Pupils from Melville Primary School are among hundreds of volunteers helping plant 30,000 plants into the ground at Living Water catchments around New Zealand this spring.
The Melville Primary School contingent is part of a group of more than 100 volunteers at Lake Ruatuna who, over three days with the Living Water team, are planting 7,000 shrubs, flaxes and
grasses to improve the biodiversity and habitat of the lake shore.
Lake Ruatuna, near Ohaupo, is one of three Waikato peat lakes that along with nearby Rotoma–nuka and Lake Areare by Ngaruawahia make up the Waikato Peat Lake Living Water catchment.
This planting is one of several run by the Living Water programme – a 10-year
partnership between Fonterra and the Department of Conservation (DOC) that’s working with dairy farmers, iwi, conservation groups, schools and other agencies to improve the health of five catchments in significant dairying regions throughout the country. Work includes planting native trees alongside streams and rivers to improve water quality, managing animal pests and weeds and making sure the right habitats are in place around farms to enhance biodiversity and provide homes for native fish and birds.
These plantings are part of the efforts of the Living Water programme to make a real difference to the biodiversity and water quality in New Zealand. And it’s great to have the local community and schools joining in to restore these important natural resources.
World School Milk Day 2015This year marked the sixteenth World School Milk day which falls on the last Wednesday of September every year. It is a celebration of the health benefits of school milk programmes around the world by the Food and Agriculture Organisation of the United Nations.
Every year, events are held in over 25 countries and in New Zealand celebrations happened a week early this year so kids didn’t miss out while they were on school holidays.
In New Zealand, Fonterra provides milk to more than 170,000 primary school
children every day through our Fonterra Milk for Schools initiative.
Fonterra Milk for Schools celebrated the day with ‘The Big Slurp’ where hundreds of Kiwi kids sat down to enjoy the goodness of our milk at the same time. The kids made cow masks and wrote letters to Fonterra farmers thanking them for the milk.
The schools really got into the spirit of the programme. We received a lot of photos and letters to our Fonterra farmers and it’s encouraging to see their enthusiasm and appreciation.
Check out our website for more information.
OUR CO-OP
9
SUPPLEMENTARY INFORMATION
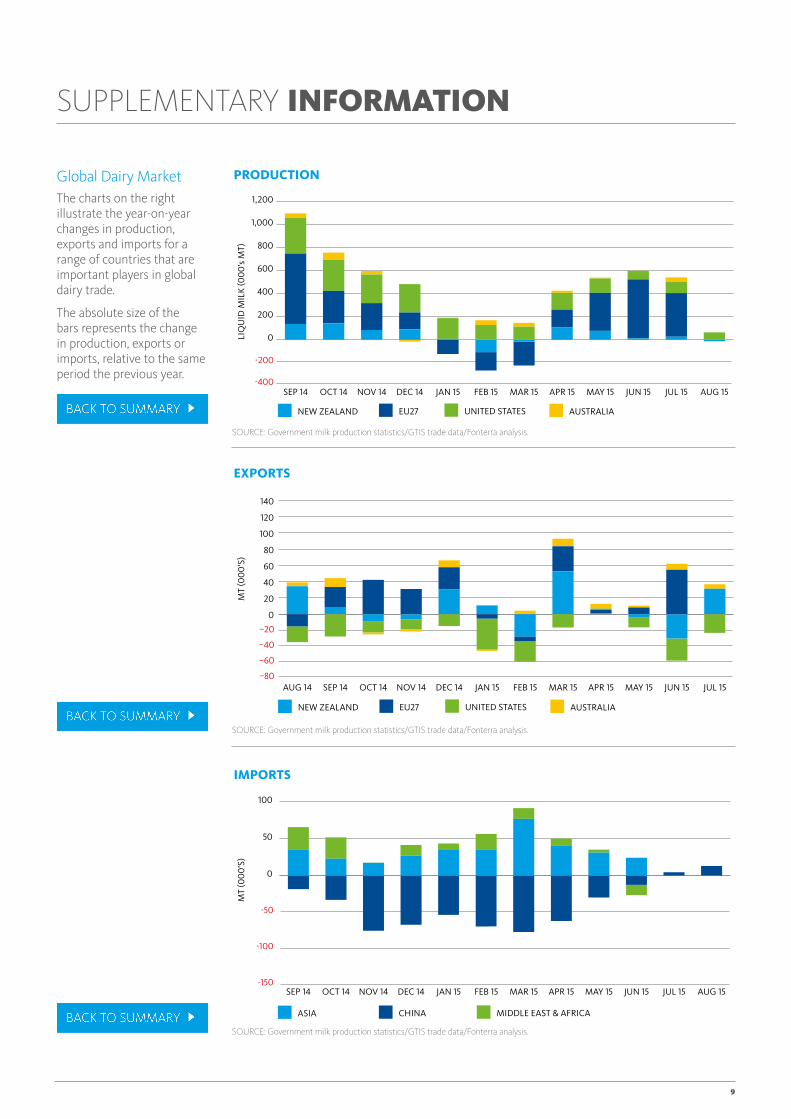
Global Dairy Market The charts on the right illustrate the year-on-year changes in production, exports and imports for a range of countries that are important players in global dairy trade.
The absolute size of the bars represents the change in production, exports or imports, relative to the same period the previous year.
LIQ
UID
MIL
K (0
00
’s M
T)
PRODUCTION
AUSTRALIAUNITED STATESEU27NEW ZEALAND
0
200
400
600
800
1,000
1,200
AUG 15JUL 15JUN 15MAY 15APR 15MAR 15FEB 15JAN 15DEC 14NOV 14OCT 14SEP 14-400
-200
SOURCE: Government milk production statistics/GTIS trade data/Fonterra analysis.
SOURCE: Government milk production statistics/GTIS trade data/Fonterra analysis.
SOURCE: Government milk production statistics/GTIS trade data/Fonterra analysis.
MT
(00
0’S
)
AUSTRALIAUNITED STATESEU27NEW ZEALAND
EXPORTS
0
20
40
60
80
100
120
140
JUL 15JUN 15MAY 15APR 15MAR 15FEB 15JAN 15DEC 14NOV 14OCT 14SEP 14AUG 14–80
–60
–40
–20
MT
(00
0’S
)
MIDDLE EAST & AFRICACHINAASIA
0
50
100
AUG 15JUL 15JUN 15MAY 15APR 15MAR 15FEB 15JAN 15DEC 14NOV 14OCT 14SEP 14
IMPORTS
-150
-100
-50

10
Fonterra milk productionThe table on the right shows Fonterra milk solids collected in New Zealand and Australia compared to the previous season.
GDT resultsThis table summarises the latest GDT results and provides a snapshot of the rolling year-to-date results.
SUPPLEMENTARY INFORMATION
MILK COLLECTION (MILLION KGMS)
SEPT 2015
SEPT 2014
MONTHLY CHANGE
SEASON-TO-DATE
2015/16
SEASON-TO-DATE
2014/15
SEASON-TO-DATE CHANGE
Total Fonterra New Zealand
178.0 194.9 (8.7%) 305.3 322.2 (5.3%)
North Island 115.8 128.2 (9.7%) 214.4 227.2 (5.7%)
South Island 62.2 66.6 (6.7%) 91.0 95.0 (4.3%)
Fonterra Australia 12.7 12.6 1.0% 30.0 29.5 1.9%
LAST TRADING EVENT (6 OCTOBER 2015)
YEAR-TO-DATE (FROM 1 AUGUST 2015)
Fonterra Quantity Sold on GDT (Winning MT)
33,320 185,960
GDT Average Winning Price (USD/MT, FAS)
2,834 2,284
Change in GDT Price Index over same period last year
9.8% (19.4%)
Change in GDT Price Index from previous event
9.9% –

11
AMFAnhydrous Milk Fat.
BMPButter Milk Powder.
DIRADairy Industry Restructuring Act 2001 (New Zealand).
Dry sharesAny shares held by a farmer shareholder in excess of the number of shares required to be held by that farmer shareholder in accordance with the minimum shareholding requirement for a season.
Farmgate Milk PriceThe price for milk supplied in New Zealand to Fonterra by farmer shareholders.
Fluid and Fresh DairyThe Fonterra grouping of fluid milk products (skim milk, whole milk and cream – pasteurised or UHT processed), concentrated milk products (evaporated milk and sweetened condensed milk) and yoghurt.
GDT Price IndexAll GDT price indices are chain-linked Fisher indices using winning quantities and winning prices. For the period prior to April 2010, the GDT Price Index and the AMF, SMP and WMP price indices use GDT prices and quantities where available, and USDA Dairy Market News prices and GTIS export volumes elsewhere. USDA Western Europe average price for butter oil is used for AMF prior to December 2009, USDA Oceania average price for SMP is used prior to April 2010 and USDA Oceania average price for WMP is used prior to August 2008.
Reference ProductsThe dairy products used in the calculation of the Farmgate Milk Price, which are currently WMP, SMP, BMP, butter and AMF.
SeasonNew Zealand: A period of 12 months to 31 May in each year.
Australia: A period of 12 months to 30 June in each year.
Share StandardThe number of shares a farmer shareholder is required from time to time to hold as determined in accordance with the Constitution. The Fonterra Board may permit the Share Standard to be satisfied through the holding of both shares and vouchers.
SMPSkim Milk Powder.
VoucherA certificate that is provided to a farmer shareholder upon transfer of the Economic Rights of a wet share to the Fonterra Shareholders’ Fund in accordance with the Trust Deed.
Wet sharesAny shares held by a farmer shareholder that are required to be held in accordance with the minimum shareholding requirement for a season.
WMPWhole Milk Powder.
GLOSSARY