oceania fob prices and exports of milk powder by major...
TRANSCRIPT

1
United States Department of Agriculture Foreign Agricultural Service
Approved by the World Agricultural Outlook Board/USDA
July 2015
Shipments of whole milk powder (WMP) by major exporters are expected to decrease by 8 percent
in 2015 while skim milk powder (SMP) exports are forecast to register a 5 percent increase in
comparison to last year. Global demand for WMP remains weak and prices have plunged to levels
not witnessed since 2009. This was reflected at the most recent (July 15, 2015) Global Trade
Auction. The winning price for regular WMP offered by Fonterra for deferred delivery (5 months)
fell to $1,820/MT FOB. Prices for SMP (low heat) appear to be dropping rapidly with a one
winning bid indicating a price of $1,595/MT for shipment starting in three months. The factors that
initially precipitated the decline in prices remain present; Chinese import for demand for WMP
remains anemic, the Russian import ban on dairy products from major producers has been extended
to August 2016, and the dollar remains relatively strong. Nevertheless, markets are adjusting as the
low product prices are being transmitted to farmers as lower milk prices. Consequently, milk
production forecasts for a number of countries have been scaled back. This is particularly evident
for New Zealand where milk production for 2015 is now forecast to decline by 1 percent from
2014.
Note: Major suppliers includes, Argentina, Australia, EU-28, and the United States
Source: AMS mid-point Oceania FOB prices
1,500
2,000
2,500
3,000
3,500
4,000
4,500
5,000
2,000
2,200
2,400
2,600
2,800
3,000
3,200
3,400
3,600
3,800
4,000
2009 2010 2011 2012 2013 2014 2015 (Jul)
$ p
er
Me
tric
To
n
1,0
00
MT
Oceania FOB Prices and Exports of Milk Powder by Major Suppliers
Milk Powder (SMP+WMP) WMP Prices SMP Prices

2
Dairy Production and Trade Developments
Milk Production: Forecast Summary
Milk Production Summary for Major Exporters (Million Metric Tons)
The milk production 2015 forecast for Argentina is revised down 9 percent due to
unfavorable weather early in the year and ongoing adverse economic conditions. High
inflation continues to be a problem which is compounded by limited access to credit. In
addition, dairy farmers face import controls which limit key inputs such as farm equipment,
export restrictions on shipments of dairy products, and a sharp drop in global prices of
WMP. Argentina dairy exports comprise primarily WMP and the recent drop in global
WMP prices plus the dim price outlook will likely increase the pressure on dairy farmer
margins. Dairy herd numbers which peaked in 2012 are expected to shrink by 6 percent for
the third consecutive year. On a positive note, as the dairy sector shrinks leaving the more
efficient farmers, milk yields per cow are expected to rise.
Milk output in Australia for this year through May is currently running 3 percent ahead in
comparison to the same period last year. However, the bulk of seasonal production starts
ramping-up in August and peaks in October. Weather conditions have so far been favorable
for milk production but the forecast for an El Nino event is injecting a degree of uncertainty
for future milk production. Assuming normal conditions, the milk forecast remains
unchanged and represents a 1 percent increase over last year. Milk cow numbers are
expected to hold steady over last year so the rise in milk output is largely attributed to higher
milk per cow yields
Although EU milk production in the first four months has been lagging last year’s pace by 1
percent, milk output is expected to increase slightly for the balance of the year.
Consequently, the 2015 forecast is unchanged from December but 2015 milk output is
expected to be fractionally higher than in 2014. Despite the end of milk production quotas,
2014
2015
Dec. 2014 For.
2015
July 2015 For. Forecast
Change %
Argentina 11.1 11.7 10.7 -9%
Australia 9.7 9.8 9.8 0%
EU-28 146.5 147.0 147.0 0%
New Zealand 21.9 22.1 21.7 -2%
United States 93.5 96.3 94.7 -2%
Total 282.7 286.9 283.4 -1%
Foreign Agricultural Service/USDA July 2015Office of Global Analysis
3
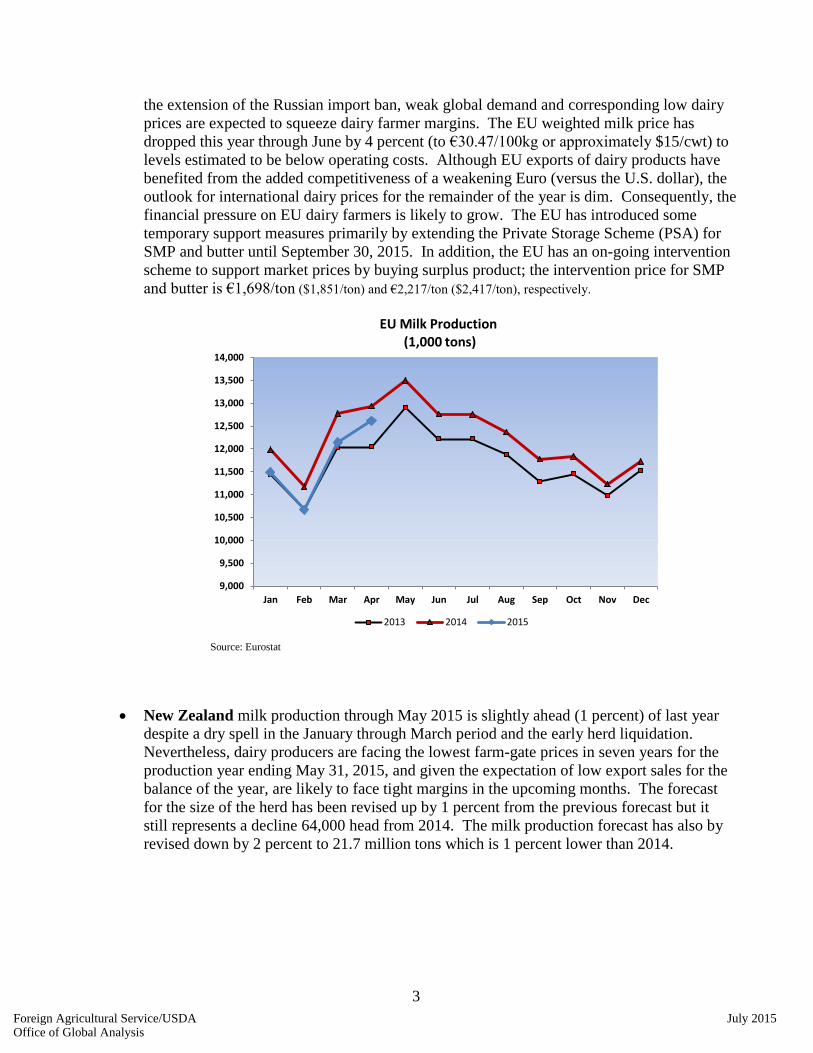
the extension of the Russian import ban, weak global demand and corresponding low dairy
prices are expected to squeeze dairy farmer margins. The EU weighted milk price has
dropped this year through June by 4 percent (to €30.47/100kg or approximately $15/cwt) to
levels estimated to be below operating costs. Although EU exports of dairy products have
benefited from the added competitiveness of a weakening Euro (versus the U.S. dollar), the
outlook for international dairy prices for the remainder of the year is dim. Consequently, the
financial pressure on EU dairy farmers is likely to grow. The EU has introduced some
temporary support measures primarily by extending the Private Storage Scheme (PSA) for
SMP and butter until September 30, 2015. In addition, the EU has an on-going intervention
scheme to support market prices by buying surplus product; the intervention price for SMP
and butter is €1,698/ton ($1,851/ton) and €2,217/ton ($2,417/ton), respectively.
Source: Eurostat
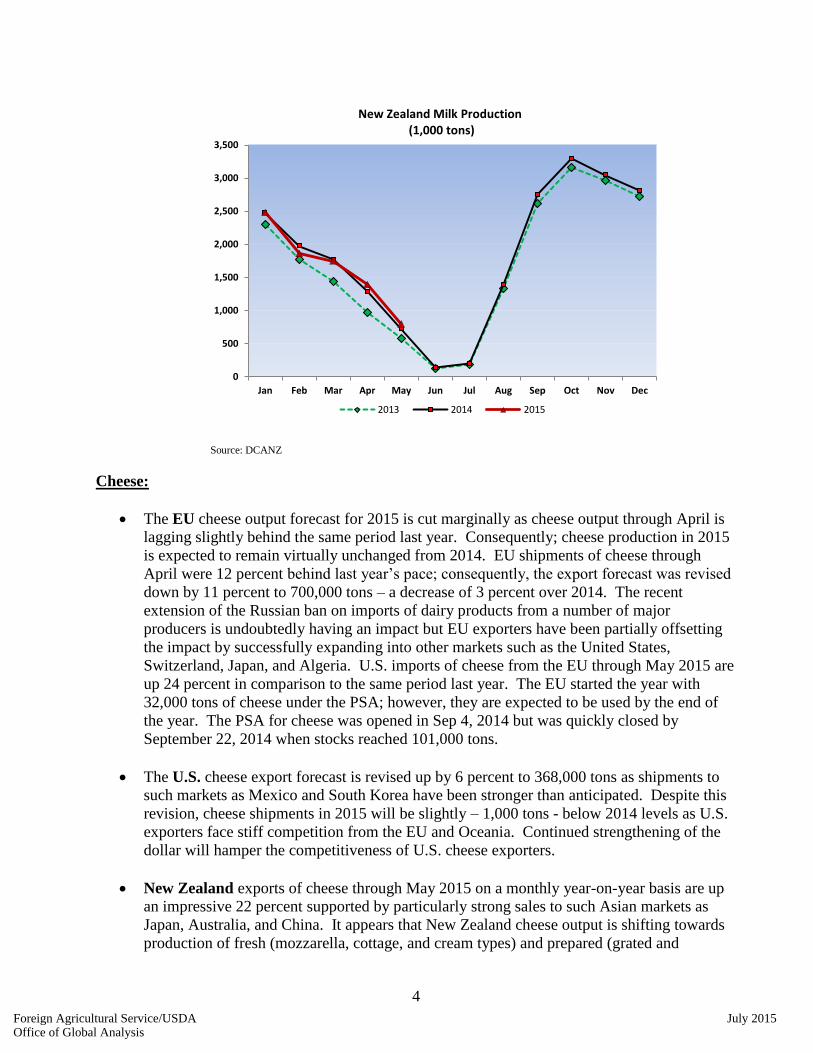
New Zealand milk production through May 2015 is slightly ahead (1 percent) of last year
despite a dry spell in the January through March period and the early herd liquidation.
Nevertheless, dairy producers are facing the lowest farm-gate prices in seven years for the
production year ending May 31, 2015, and given the expectation of low export sales for the
balance of the year, are likely to face tight margins in the upcoming months. The forecast
for the size of the herd has been revised up by 1 percent from the previous forecast but it
still represents a decline 64,000 head from 2014. The milk production forecast has also by
revised down by 2 percent to 21.7 million tons which is 1 percent lower than 2014.
9,000
9,500
10,000
10,500
11,000
11,500
12,000
12,500
13,000
13,500
14,000
Jan Feb Mar Apr May Jun Jul Aug Sep Oct Nov Dec
EU Milk Production (1,000 tons)
2013 2014 2015
Foreign Agricultural Service/USDA July 2015Office of Global Analysis
4
Source: DCANZ
Cheese:
The EU cheese output forecast for 2015 is cut marginally as cheese output through April is
lagging slightly behind the same period last year. Consequently; cheese production in 2015
is expected to remain virtually unchanged from 2014. EU shipments of cheese through
April were 12 percent behind last year’s pace; consequently, the export forecast was revised
down by 11 percent to 700,000 tons – a decrease of 3 percent over 2014. The recent
extension of the Russian ban on imports of dairy products from a number of major
producers is undoubtedly having an impact but EU exporters have been partially offsetting
the impact by successfully expanding into other markets such as the United States,
Switzerland, Japan, and Algeria. U.S. imports of cheese from the EU through May 2015 are
up 24 percent in comparison to the same period last year. The EU started the year with
32,000 tons of cheese under the PSA; however, they are expected to be used by the end of
the year. The PSA for cheese was opened in Sep 4, 2014 but was quickly closed by
September 22, 2014 when stocks reached 101,000 tons.
The U.S. cheese export forecast is revised up by 6 percent to 368,000 tons as shipments to
such markets as Mexico and South Korea have been stronger than anticipated. Despite this
revision, cheese shipments in 2015 will be slightly – 1,000 tons - below 2014 levels as U.S.
exporters face stiff competition from the EU and Oceania. Continued strengthening of the
dollar will hamper the competitiveness of U.S. cheese exporters.
New Zealand exports of cheese through May 2015 on a monthly year-on-year basis are up
an impressive 22 percent supported by particularly strong sales to such Asian markets as
Japan, Australia, and China. It appears that New Zealand cheese output is shifting towards
production of fresh (mozzarella, cottage, and cream types) and prepared (grated and
0
500
1,000
1,500
2,000
2,500
3,000
3,500
Jan Feb Mar Apr May Jun Jul Aug Sep Oct Nov Dec
New Zealand Milk Production (1,000 tons)
2013 2014 2015
Foreign Agricultural Service/USDA July 2015Office of Global Analysis

5
powdered) cheeses. The export forecast is raised 10 percent or an additional 30,000 tons to
320,000 tons – an increase of 15 percent over the previous year. The cheese production
forecast was revised up 6 percent as the strength in demand is expected to support increased
production.
Butter:
U.S. exports of butter have dropped off sharply this year trailing last year’s pace by 74
percent when comparing January-May shipment periods. A major part of this is due to the
strength of the domestic market that has kept the average monthly Chicago Mercantile
Exchange butter prices at above $1.72/lb ($3,790/ton) since February 2015. In contrast, the
Oceania mid-point FOB price has averaged $1.55/lb ($3,434/ton) through June trading most
recently at $1.35/lb ($2,975/ton). The EU FOB butter export price was also about $400/ton
lower at the end of June. The export forecast is lowered by 35 percent to 36,000 tons – a
decline of 51% from the volume exported in 2014 as U.S. prices are not expected to regain
competitiveness.
In contrast to the relatively slow pace of New Zealand and U.S. butter exports, shipments of
EU butter have been surprisingly strong despite the loss of the Russian market. In the first 4
months of the year, EU butter exports were up 16 percent over the same period in 2014.
The EU appears to be successfully competing and exporting additional volumes to such
markets as Saudi Arabia, Egypt, and even the United States. It is likely that the EU will
continue to be competitive and the export forecast is revised up by an additional 7 percent to
160,000 tons.
SMP:
EU SMP production during the first four months was reported to be up 1.5 percent over the
same period in 2014 and the forecast for the year was raised by 20,000 tons to 1.62 million
tons – a 5 percent increase over 2014. This is attributed to increased drying capacity
especially in France and Germany, increased available supplies of skim milk, and strong
demand from export markets. Shipments of SMP during January-April 2015 registered a
gain of 17 percent over the comparable period in 2014. Although SMP exports to such key
destinations as China and Algeria are down this year they have been offset by increased
sales to Egypt and other Asian destinations such as Thailand, Philippines, and Vietnam.
Based on the strong pace of exports in the first four months of 2015, the export forecast is
revised up by 8 percent to 710,000 tons. If realized, EU shipments of SMP since 2013 will
have increased by 74 percent in a 3-year time span.
The import forecast for China is cut by 35 percent to 200,000 tons which reflects the slow
pace of imports in early 2015. SMP imports through May are lagging last year’s pace over
the same period by 31 percent and exports for the year are forecast 21 percent lower. It
appears that China’s economic slowdown may be impacting on consumption of milk
beverages and infant formula.
Foreign Agricultural Service/USDA July 2015Office of Global Analysis

6
U.S. production of
SMP (including nonfat dry
milk) has been surprisingly
strong primarily in the form
of nonfat dry milk which has
more available options for use
either in the export or
domestic market. As a result,
the SMP production forecast
is raised by 7 percent (65,000
tons) to 1.06 million tons.
Exports of SMP were weak
early in the year but have
since ramped-up and total
shipments through May of
this year are up 2 percent over
the comparable period last
year. Mexico has been the leading destination for U.S. SMP and this year is no different
with exports through May up 20 percent over the comparable period in 2014. It appears that
U.S. producers are in a position to match global prices as lower SMP prices may be partly
offset by higher returns from domestic sales of the butterfat component when producing
skim milk. The current strong pace of SMP shipments are anticipated to continue and the
export forecast is revised-up 14 percent to a record 586,000 tons.
The import forecast for Mexico is raised by 10 percent to 230,000 tons as imports during the
first four months of this year are up 20 percent over the monthly year-over-year pace of
2014. It is likely that the significant drop in international dairy prices is spurring a pick-up
in purchases of SMP.
WMP:
The import forecast for China is lowered by one-third to 400,000 tons as carry-over stocks
from 2014 are estimated to total over 300,000 tons. These stocks are anticipated to be
drawn down significantly throughout the year and will thus reduce the need for imports.
This lower import estimate is a sharp reversal from 2014 when China imported a record
671,000 tons. Consequently, WMP prices are being pressured as major suppliers such as
New Zealand seek alternative markets.
Although New Zealand’s shipments of WMP to China in the first 5 months of this year are
down 65 percent on a monthly year-to-year basis, total WMP exports are down only 7
percent. New Zealand has been able to some extent offset the volume losses of the Chinese
market by increased sales to destinations such as Algeria, Malaysia, and the United Arab
Emirates. Since Chinese imports of WMP are not expected to recover this year, New
Zealand’s export forecast is cut by 5 percent to 1.425 million tons.
0
50,000
100,000
150,000
200,000
250,000
1,0
00
lbs
U.S. Production of SMP and NDM
SMP NDM
Foreign Agricultural Service/USDA July 2015Office of Global Analysis

7
The export forecast for the EU is lowered by 23 percent to 345,000 tons reflecting the
current slow pace of shipments during the first five months of this year relative to 2014.
Shipments to Algeria are down 59 percent likely due to strong competition from New
Zealand. Shipments of New Zealand WMP to Algeria in 2015 through May have more than
doubled (to 49,000 tons) in comparison to 2014.
Foreign Agricultural Service/USDA July 2015Office of Global Analysis

8
Additional Resources:
For additional information, please contact Paul Kiendl at 202-720-8870 or
Subscription services for FAS circulars can be obtained at:
https://public.govdelivery.com/accounts/USDAFAS/subscriber/new
Individual FAS country reports covering dairy are available at:
http://gain.fas.usda.gov/Pages/Default.aspx
The USDA Production, Supply and Demand database is available at:
http://www.fas.usda.gov/psdonline
A monthly “Livestock, Dairy, and Poultry Outlook” for the United States published by the
Economic Research Service is available at: http://www.ers.usda.gov/publications/ldpm-livestock,-
dairy,-and-poultry-outlook/
U.S. trade data is available on the Global Agricultural Trade System (GATS):
http://apps.fas.usda.gov/gats/default.aspx
The next publication of this circular will be in December 2015
Foreign Agricultural Service/USDA July 2015Office of Global Analysis

Fluid Milk - Cow Numbers: Summary For Selected Countries
1,000 Head
2011 2012 2013 2014 2015
Dec
2015
Jul
none
Cows In Milk
1,7862,0001,9002,1002,1932,150 Argentina
1,7051,7051,7001,6501,6501,620 Australia
21,30021,30020,68020,45019,90019,200 Brazil
955955955961960983 Canada
8,4009,0008,5008,3508,0007,620 China
23,50023,70023,48123,19323,05323,122 European Union
52,50052,50050,50048,25046,40044,900 India
775775773798813805 Japan
203203204206209191 Korea, South
6,4006,4006,3506,3006,3506,400 Mexico
5,2005,1375,2645,0055,0104,816 New Zealand
212118161514 Philippines
7,7507,8508,0508,2508,6008,650 Russia
595960605955 Taiwan
2,4802,4802,5452,5542,5822,631 Ukraine
133,034134,085130,980128,143125,794123,157 Subtotal
9,3159,3259,2569,2219,2379,199 United States
142,349143,410140,236137,364135,031132,356 World Total
Foreign Agricultural Service/USDA July 2015Office of Global Analysis

Cows Milk Production and Consumption: Summary For Selected Countries
1,000 Metric Tons
2011 2012 2013 2014 2015
Dec
2015
Jul
none
Cows Milk Production
10,70011,74611,10011,51911,67911,470 Argentina
9,8009,8009,7009,4009,8119,568 Australia
34,25034,50033,35032,38031,49030,715 Brazil
8,5358,5358,4098,4438,6148,400 Canada
37,50037,50037,25034,30032,60030,700 China
147,000147,000146,500140,100139,000138,220 European Union
63,50063,50060,50057,50055,50053,500 India
7,3507,3507,3157,5087,6317,474 Japan
2,0652,0652,0732,0932,1111,888 Korea, South
11,68011,60011,46411,29411,27411,046 Mexico
21,67522,12021,89320,20020,56718,965 New Zealand
202020191817 Philippines
29,50029,30030,55330,52931,83131,646 Russia
350350347358348336 Taiwan
11,16011,16011,20011,18911,08010,804 Ukraine
395,085396,546391,674376,832373,554364,749 Subtotal
94,71096,25293,46191,27791,01089,020 United States
489,795492,798485,135468,109464,564453,769 World Total
none
Fluid Use Dom. Consum.
1,9572,1072,0042,0652,1332,093 Argentina
2,6702,6752,6002,4942,5112,422 Australia
12,85812,85812,39012,00011,71211,429 Brazil
2,9462,9462,9462,9823,0403,164 Canada
15,45015,74415,15014,35013,51712,600 China
34,47033,90034,46633,80033,80033,870 European Union
59,54759,54757,00054,40052,00051,660 India
3,8903,8903,9153,9754,0454,058 Japan
1,5691,5691,5751,5871,5781,623 Korea, South
4,1854,1854,1804,1604,1684,100 Mexico
495495495451425300 New Zealand
626262585261 Philippines
9,5009,6259,90010,15011,00011,650 Russia
362362359356340354 Taiwan
5,7505,7505,5805,3165,5885,442 Ukraine
155,711155,715152,622148,144145,909144,826 Subtotal
29,34029,79828,93028,29428,35328,449 United States
185,051185,513181,552176,438174,262173,275 World Total
Foreign Agricultural Service/USDA July 2015Office of Global Analysis

Cheese Production and Consumption: Summary For Selected Countries
1,000 Metric Tons
2011 2012 2013 2014 2015
Dec
2015
Jul
none
Production
000000 Algeria
571566564556564572 Argentina
330330320320330339 Australia
751751736722700679 Brazil
390390389388386378 Canada
9,5709,6009,5609,3689,2878,981 European Union
505050494745 Japan
232322222325 Korea, South
280280275270264270 Mexico
338320316311328300 New Zealand
222222 Philippines
700460760713790753 Russia
000000 Taiwan
9090100140145185 Ukraine
13,09512,86213,09412,86112,86612,529 Total Foreign
5,2765,1605,1945,0364,9384,806 United States
18,37118,02218,28817,89717,80417,335 Total
none
Total Dom. Consumption
000000 Algeria
519511507507513514 Argentina
244245239220240256 Australia
770770755750724715 Brazil
402402403412400395 Canada
8,9728,9368,8838,6568,5978,374 European Union
295285282285282260 Japan
128123119107101101 Korea, South
384373370368349344 Mexico
393940393930 New Zealand
261720162118 Philippines
9656951,0571,1541,2141,143 Russia
29026252322 Taiwan
8888909194117 Ukraine
12,86112,48412,79112,63012,59712,289 Total Foreign
5,0454,9254,9484,8384,7864,716 United States
17,90617,40917,73917,46817,38317,005 Total
Foreign Agricultural Service/USDA July 2015Office of Global Analysis

Cheese Trade: Summary For Selected Countries
1,000 Metric Tons
2011 2012 2013 2014 2015
Dec
2015
Jul
none
Total Exports
556057515460 Argentina
160160151163163168 Australia
700790721787768682 European Union
320290278277306253 New Zealand
30529262525 Russia
292936788495 Others
1,2941,3341,2721,3821,4001,283 Total Foreign
368347369317260225 United States
1,6621,6811,6411,6991,6601,508 Total
none
Total Imports
827880697572 Australia
245235232236235215 Japan
10510097857876 Korea, South
11099991038978 Mexico
275240348463449416 Russia
182150188198197196 Others
9999021,0441,1541,1231,053 Total Foreign
145120127113122110 United States
1,1441,0221,1711,2671,2451,163 Total
Foreign Agricultural Service/USDA July 2015Office of Global Analysis

Butter Production and Consumption: Summary For Selected Countries
1,000 Metric Tons
2011 2012 2013 2014 2015
Dec
2015
Jul
none
Production
000000 Algeria
566056605863 Argentina
122115117117119121 Australia
959593838179 Brazil
909085959885 Canada
2,2852,2752,2502,1002,1002,055 European Union
5,0355,0354,8874,7454,5254,330 India
606560686963 Japan
195195192190190187 Mexico
565580580535527487 New Zealand
235240252219216217 Russia
000000 Taiwan
110110115938876 Ukraine
8,8488,8608,6878,3058,0717,763 Total Foreign
845900842845843821 United States
9,6939,7609,5299,1508,9148,584 Total
none
Domestic Consumption
000000 Algeria
444141413835 Argentina
959189858278 Australia
909087878878 Brazil
101961001029997 Canada
2,1732,1702,1612,0312,0271,982 European Union
5,0275,0254,8764,7354,5254,320 India
767273727783 Japan
227227221234226223 Mexico
222222222120 New Zealand
350368365357340334 Russia
281722192020 Taiwan
1071111111009678 Ukraine
8,3408,3308,1687,8857,6397,348 Total Foreign
827854793782792757 United States
9,1679,1848,9618,6678,4318,105 Total
Foreign Agricultural Service/USDA July 2015Office of Global Analysis

Butter Trade: Summary For Selected Countries
1,000 Metric Tons
2011 2012 2013 2014 2015
Dec
2015
Jul
none
Total Imports
100130137140124120 Russia
464553445244 European Union
404037503736 Mexico
281722192020 Taiwan
212123212119 Australia
158117811 Canada
1581141015 Japan
23111484 Ukraine
111581 Brazil
101180 India
111101 New Zealand
000000 Algeria
000100 Argentina
270274308307296271 Total Foreign
331622121712 United States
303290330319313283 Total
none
Total Exports
540560560508506449 New Zealand
160150144122121124 European Union
404745505442 Australia
121914192127 Argentina
9101010811 India
888610 Mexico
765302 Ukraine
667112 Brazil
524222 Russia
222410 Canada
000000 Algeria
000000 Japan
000000 Taiwan
789810799725715659 Total Foreign
365574934765 United States
825865873818762724 Total
Foreign Agricultural Service/USDA July 2015Office of Global Analysis

Nonfat Dry Milk Production and Consumption: Summary For Selected Countries
1,000 Metric Tons
2011 2012 2013 2014 2015
Dec
2015
Jul
none
Production
220195205215235230 Australia
157157154151141132 Brazil
1,6201,6001,5501,2501,2701,180 European Union
540550520490450430 India
385400395404404366 New Zealand
513524509489510455 Others
3,4353,4263,3332,9993,0102,793 Total Foreign
1,0609951,047956973882 United States
4,4954,4214,3803,9553,9833,675 Total
none
Total Dom. Consumption
249360300289225186 China
909951889848802807 European Union
489470445400425410 India
217217215222205197 Indonesia
285265258253291220 Mexico
1,0331,0321,0431,047977934 Others
3,1823,2953,1503,0592,9252,754 Total Foreign
490496457424522438 United States
3,6723,7913,6073,4833,4473,192 Total
Foreign Agricultural Service/USDA July 2015Office of Global Analysis

Nonfat Dry Milk Trade: Summary For Selected Countries
1,000 Metric Tons
2011 2012 2013 2014 2015
Dec
2015
Jul
none
Total Imports
230210203198236194 Mexico
220220215225205196 Indonesia
200310253235168130 China
125125168119112129 Algeria
9011595113106111 Philippines
90851011319671 Russia
524543323227 Japan
302123243331 Brazil
292323212122 Taiwan
212121201934 Korea, South
855535 Australia
5557107 Chile
336333 Canada
212520 European Union
222552 New Zealand
222232 Ukraine
000000 Argentina
00001432 India
1,1091,1931,1671,1451,068996 Total Foreign
123120 United States
1,1101,1951,1701,1461,070996 Total
none
Total Exports
710660646407520518 European Union
405395383392390362 New Zealand
150145164119168140 Australia
508061130373 India
303030122622 Ukraine
252022251419 Argentina
111413131010 Canada
353300 Russia
222042 Chile
24561217 Philippines
102000 China
111111 Indonesia
000000 Algeria
000000 Brazil
000000 Japan
000000 Korea, South
000000 Mexico
000000 Taiwan
1,3901,3561,3321,1081,1821,094 Total Foreign
586516546555445435 United States
1,9761,8721,8781,6631,6271,529 Total
Foreign Agricultural Service/USDA July 2015Office of Global Analysis
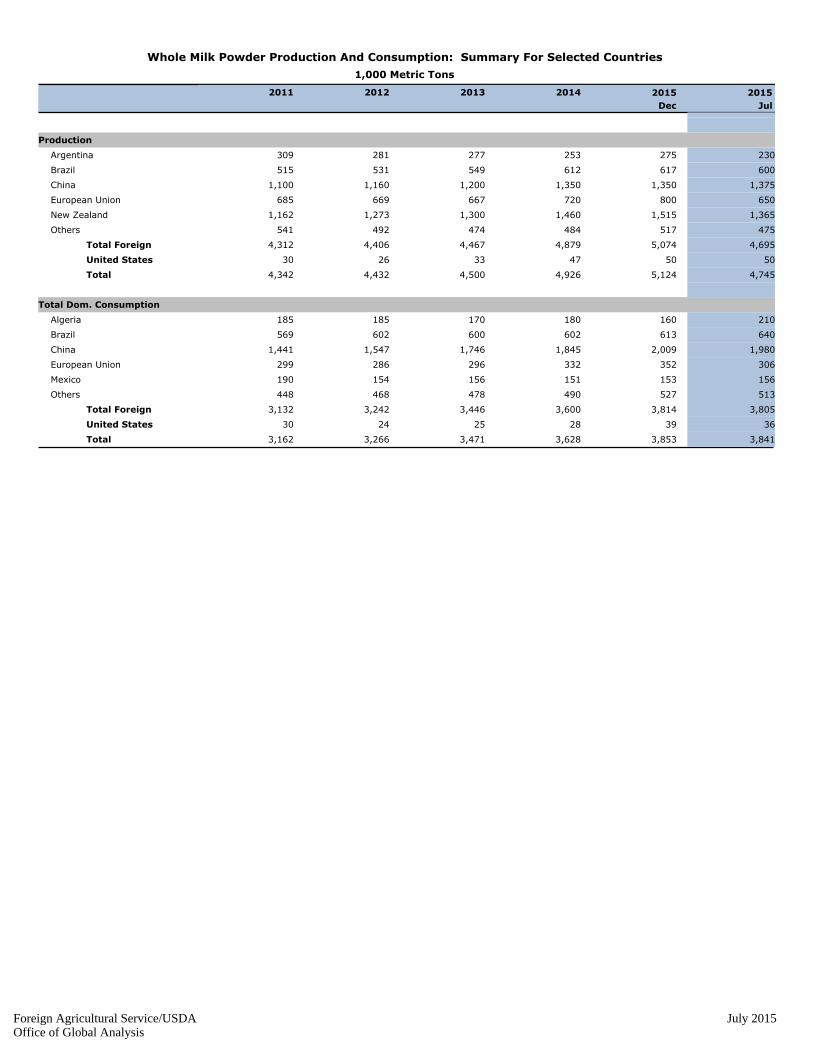
Whole Milk Powder Production And Consumption: Summary For Selected Countries
1,000 Metric Tons
2011 2012 2013 2014 2015
Dec
2015
Jul
none
Production
230275253277281309 Argentina
600617612549531515 Brazil
1,3751,3501,3501,2001,1601,100 China
650800720667669685 European Union
1,3651,5151,4601,3001,2731,162 New Zealand
475517484474492541 Others
4,6955,0744,8794,4674,4064,312 Total Foreign
505047332630 United States
4,7455,1244,9264,5004,4324,342 Total
none
Total Dom. Consumption
210160180170185185 Algeria
640613602600602569 Brazil
1,9802,0091,8451,7461,5471,441 China
306352332296286299 European Union
156153151156154190 Mexico
513527490478468448 Others
3,8053,8143,6003,4463,2423,132 Total Foreign
363928252430 United States
3,8413,8533,6283,4713,2663,162 Total
Foreign Agricultural Service/USDA July 2015Office of Global Analysis

Whole Milk Powder Trade: Summary For Selected Countries
1,000 Metric Tons
2011 2012 2013 2014 2015
Dec
2015
Jul
none
Total Imports
000000 Afghanistan
210170204142188204 Algeria
000000 Argentina
1010108913 Australia
603030547155 Brazil
444863 Chile
400600671619406320 China
121332 European Union
605553505652 Indonesia
85711930 Mexico
222111 New Zealand
253220293530 Philippines
354037442820 Russia
383133313132 Taiwan
000111 Ukraine
8539811,0721,001844763 Total Foreign
9677108 United States
8629871,0791,008854771 Total
none
Total Exports
000000 Afghanistan
000000 Algeria
125180144182201201 Argentina
70908196109116 Australia
203440301 Brazil
232322191514 Chile
626399 China
345450389374386388 European Union
000000 Indonesia
556558 Mexico
1,3501,5001,4231,2911,2611,110 New Zealand
888132124 Philippines
111122 Russia
000000 Taiwan
222012 Ukraine
1,9552,2952,1221,9872,0101,875 Total Foreign
20201815128 United States
1,9752,3152,1402,0022,0221,883 Total
Foreign Agricultural Service/USDA July 2015Office of Global Analysis