glenn r. mueller, ph.d. johns hopkins university real estate institute director, capital markets...
Post on 21-Dec-2015
216 views
TRANSCRIPT

Glenn R. Mueller, Ph.D.Johns Hopkins University
Real Estate InstituteDirector, Capital Markets & International Programs
&
Legg Mason, Inc.Real Estate Research Group
Real Estate Investment Strategist

Market Cycle AnalysisMarket Cycle Analysis
Physical CyclePhysical Cycle
Demand, Supply and Vacancy Demand, Supply and Vacancy
affect Rental Growthaffect Rental Growth
Legg Mason Real Estate Research
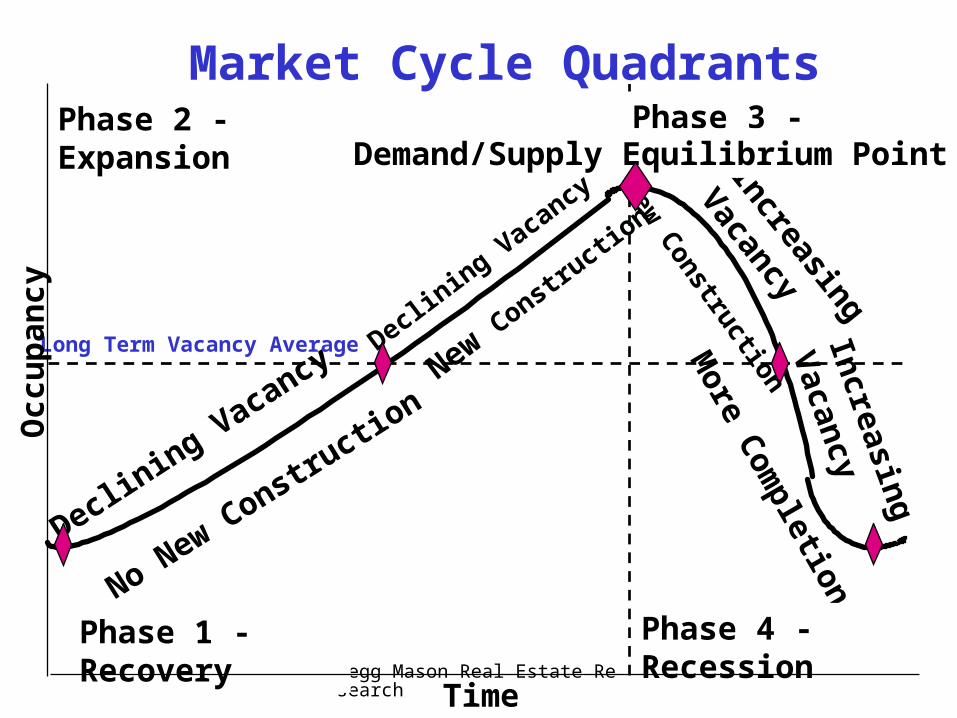
Market Cycle Quadrants
Declining V
acancy N
ew C
onstruction
No New Constructio
n
Increasing
Vacancy
Declining Vacancy
Increasing
Vacancy
More C
ompletions
New Constr
uction
Phase 1 - Recovery
Phase 2 - Expansion
Phase 3 - Hypersupply
Phase 4 - Recession
Demand/Supply Equilibrium Point
Long Term Vacancy Average
Occ
up
ancy
Time
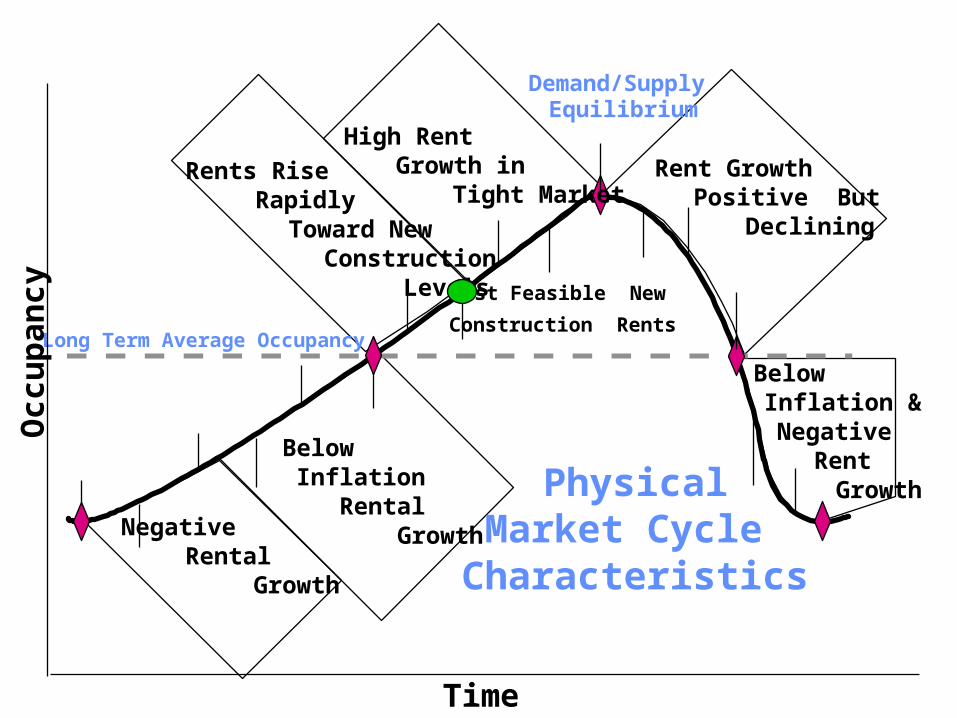
PhysicalMarket Cycle
Characteristics
Negative Rental Growth
Below Inflation Rental Growth
Rents Rise Rapidly Toward New Construction Levels
High Rent Growth in Tight Market
Demand/Supply Equilibrium
Rent Growth Positive But Declining
-Below Inflation & Negative Rent Growth
Cost Feasible New
Construction RentsLong Term Average Occupancy
Occ
up
ancy
Time
2
54
3
89
7
10
16
15
13
1
6
11
14
1
12
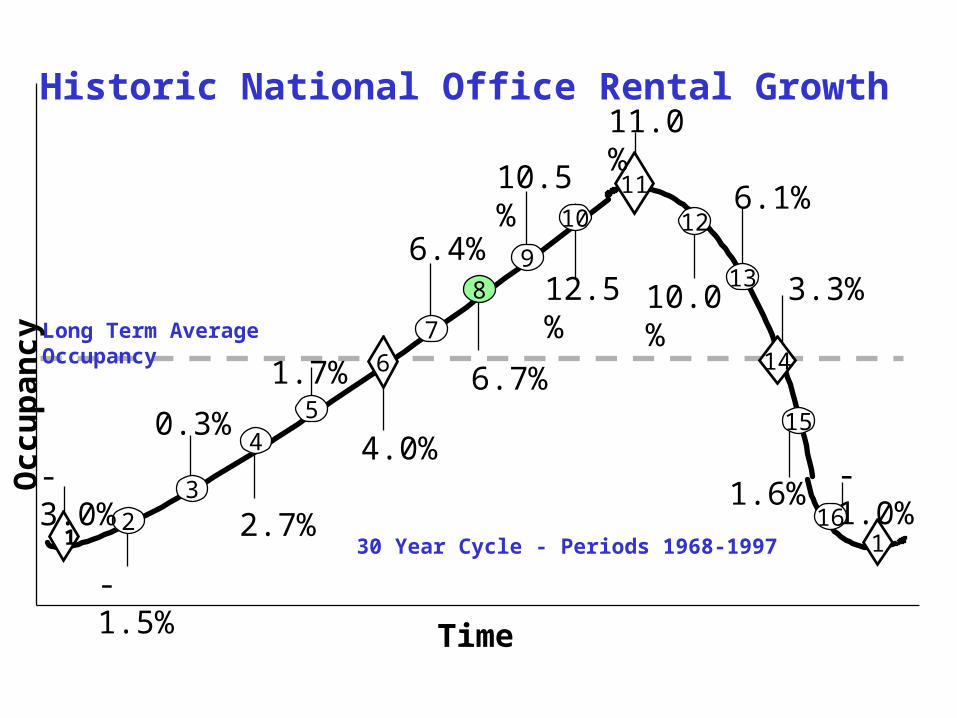
0.3%
2.7%
-3.0%
-1.5%
1.7%
4.0%
6.4%
11.0%
12.5%
10.5%
6.7%
-1.0%1.6%
3.3%
6.1%
10.0%
Historic National Office Rental Growth
30 Year Cycle - Periods 1968-1997
Long Term Average Occupancy
Occ
up
ancy
Time
2
54
3
89
7
10
16
15
13
1
6
11
14
1
12
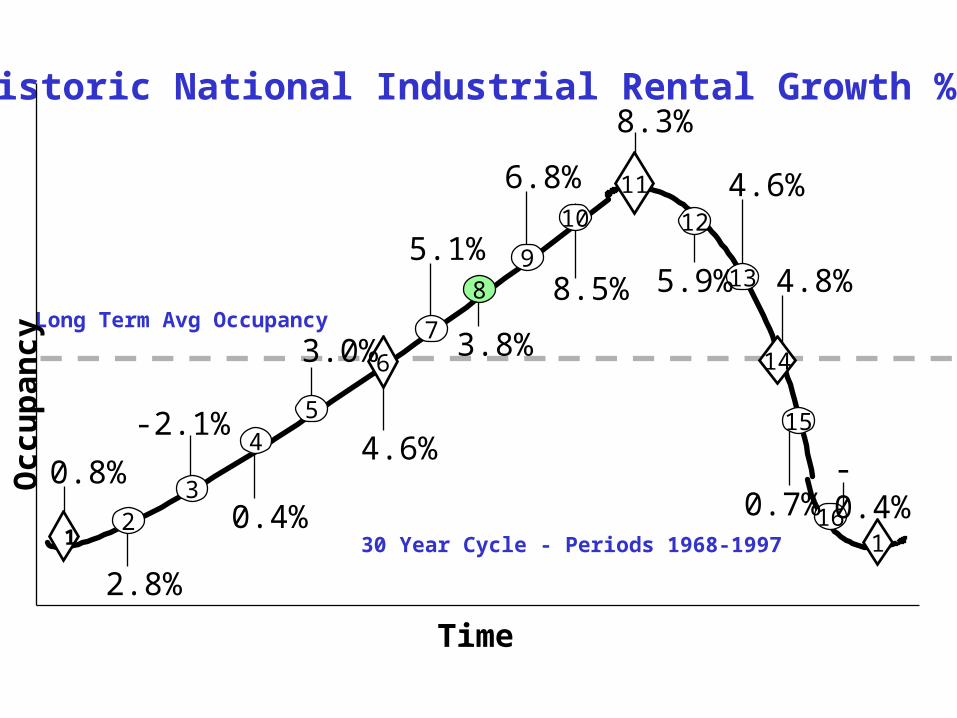
-2.1%
Historic National Industrial Rental Growth %
0.4%
0.8%
2.8%
3.0%
4.6%
5.1%
8.3%
8.5%
6.8%
3.8%
-0.4%0.7%
4.8%
4.6%
5.9%
30 Year Cycle - Periods 1968-1997
Long Term Avg Occupancy
Occ
up
ancy
Time
Orange County+1
Riverside+1
LT Average Occupancy
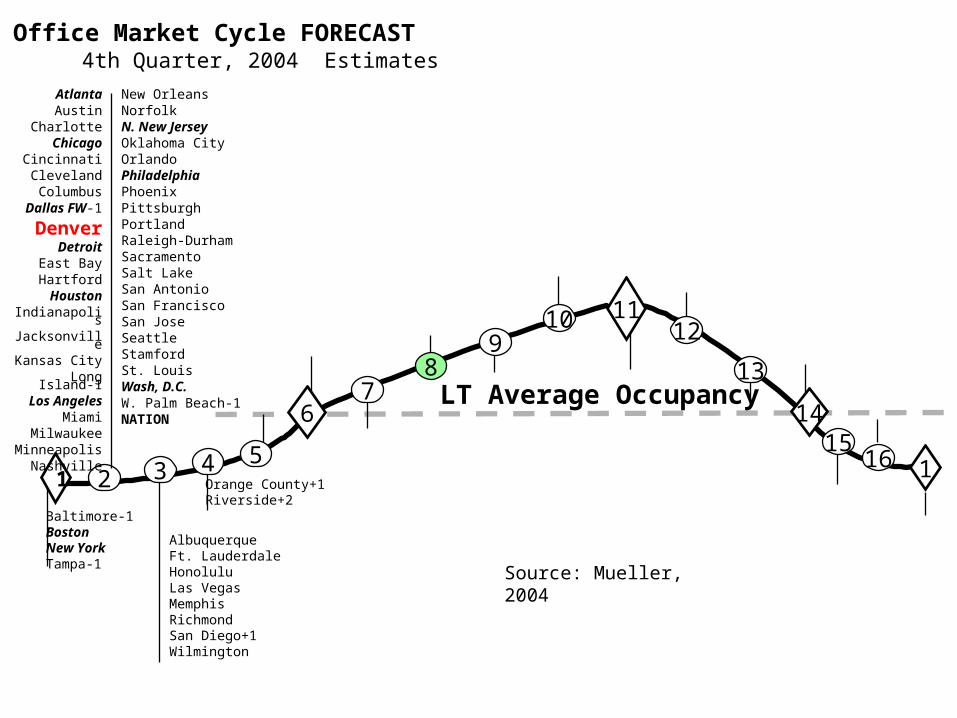
Source: Mueller, 2004
11
1467
89
1012
13
115
165432 1
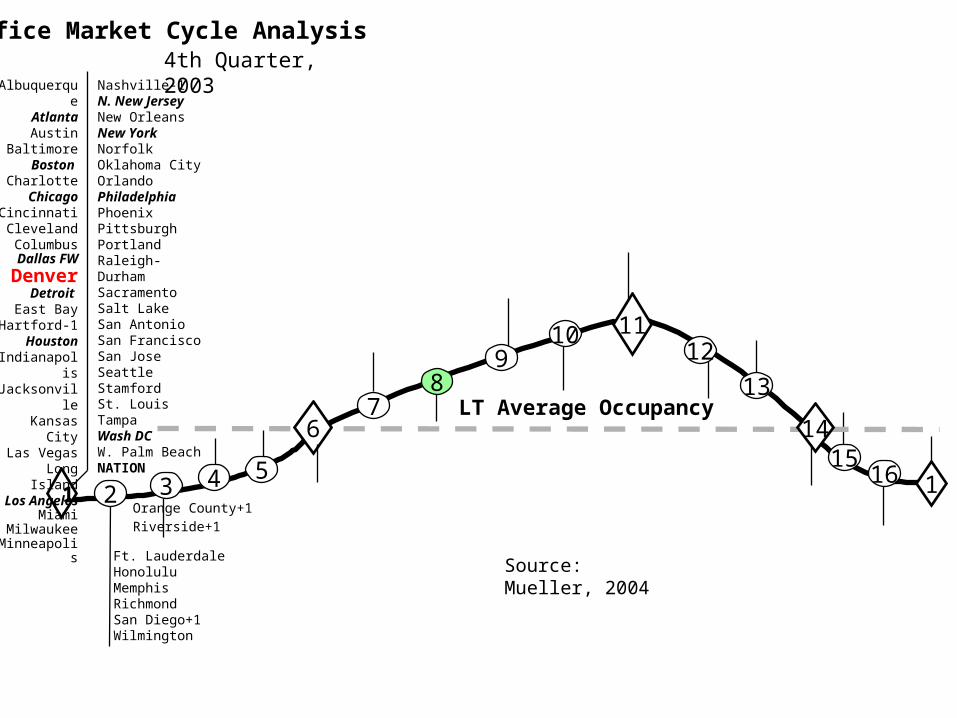
Office Market Cycle Analysis4th Quarter, 2003
Nashville-1N. New JerseyNew OrleansNew YorkNorfolkOklahoma CityOrlandoPhiladelphiaPhoenixPittsburghPortlandRaleigh-DurhamSacramentoSalt LakeSan AntonioSan FranciscoSan JoseSeattleStamfordSt. LouisTampaWash DCW. Palm BeachNATION
Ft. LauderdaleHonoluluMemphisRichmondSan Diego+1Wilmington
AlbuquerqueAtlantaAustin
BaltimoreBoston
CharlotteChicago
CincinnatiClevelandColumbus
Dallas FW
DenverDetroit
East BayHartford-1
HoustonIndianapolisJacksonvilleKansas City
Las VegasLong IslandLos Angeles
MiamiMilwaukee
Minneapolis
Source: Mueller, 2004
11
1467
89
10 12
13
115
165432 1
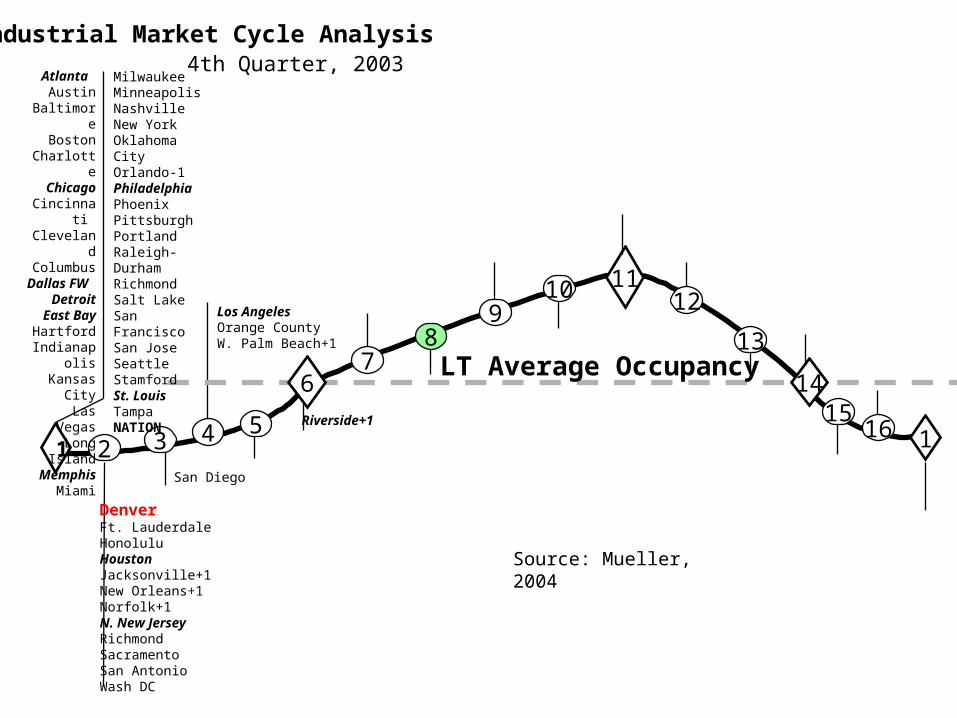
4th Quarter, 2003
LT Average Occupancy
Industrial Market Cycle Analysis
DenverFt. LauderdaleHonoluluHoustonJacksonville+1New Orleans+1Norfolk+1N. New JerseyRichmondSacramentoSan AntonioWash DC
San Diego
MilwaukeeMinneapolisNashvilleNew YorkOklahoma CityOrlando-1PhiladelphiaPhoenixPittsburghPortlandRaleigh-DurhamRichmondSalt LakeSan FranciscoSan JoseSeattleStamfordSt. LouisTampaNATION
Atlanta Austin
BaltimoreBoston
CharlotteChicago
Cincinnati ClevelandColumbus
Dallas FW Detroit
East BayHartford
IndianapolisKansas City
Las VegasLong Island
MemphisMiami
Los AngelesOrange CountyW. Palm Beach+1
Riverside+1
Source: Mueller, 2004
11
1467
89
10 12
115
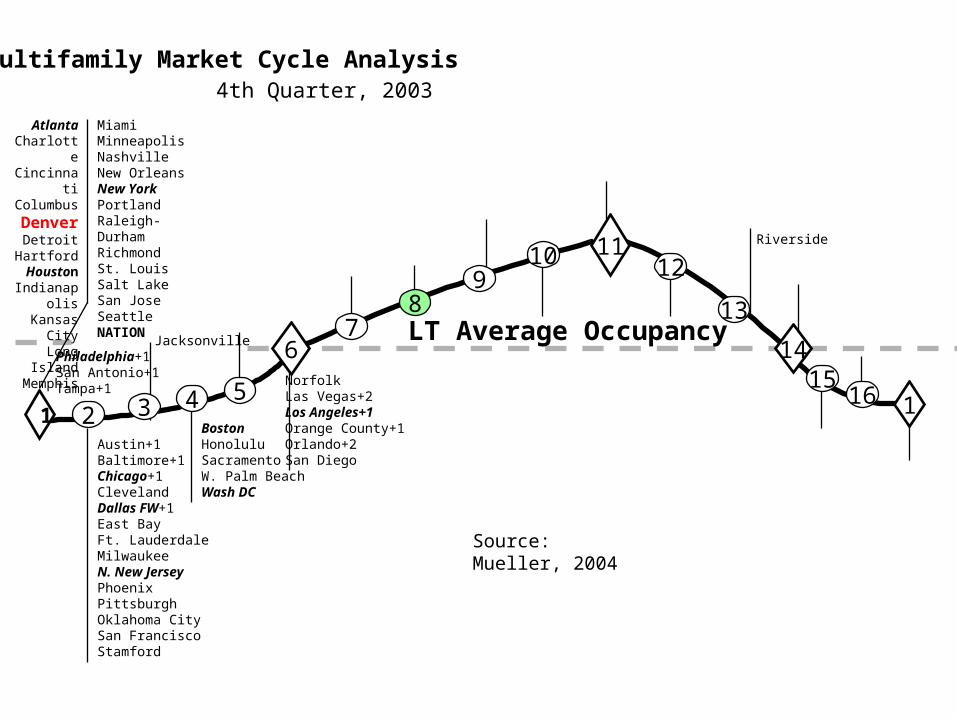
165432 1BostonHonoluluSacramentoW. Palm BeachWash DC
LT Average Occupancy
Multifamily Market Cycle Analysis4th Quarter, 2003
NorfolkLas Vegas+2Los Angeles+1Orange County+1Orlando+2San Diego
Riverside
Austin+1Baltimore+1Chicago+1ClevelandDallas FW+1East BayFt. LauderdaleMilwaukeeN. New JerseyPhoenixPittsburghOklahoma CitySan FranciscoStamford
13
AtlantaCharlotte
CincinnatiColumbus
DenverDetroit
HartfordHouston
IndianapolisKansas CityLong Island
Memphis
MiamiMinneapolisNashvilleNew OrleansNew YorkPortlandRaleigh-DurhamRichmondSt. LouisSalt LakeSan JoseSeattleNATION
Philadelphia+1San Antonio+1Tampa+1
Jacksonville
Source: Mueller, 2004
11
1467
89 12
13
115
165432 1
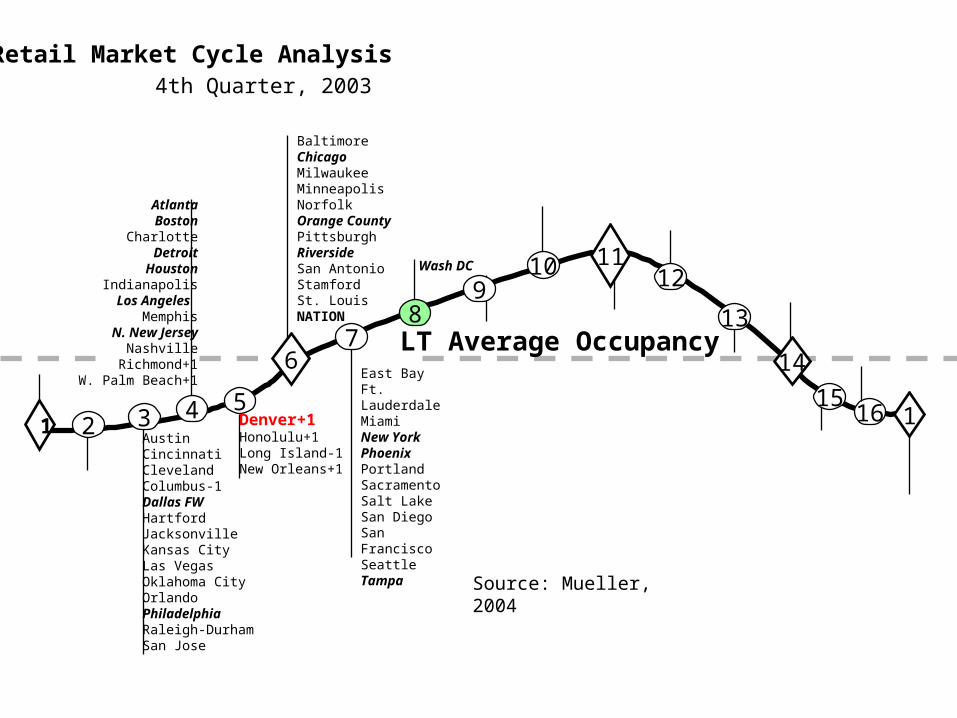
Retail Market Cycle Analysis
10
LT Average Occupancy
4th Quarter, 2003
East BayFt. LauderdaleMiamiNew YorkPhoenixPortlandSacramentoSalt LakeSan DiegoSan FranciscoSeattleTampa
BaltimoreChicagoMilwaukeeMinneapolisNorfolkOrange CountyPittsburghRiversideSan AntonioStamfordSt. LouisNATION
AustinCincinnatiClevelandColumbus-1Dallas FWHartfordJacksonvilleKansas CityLas VegasOklahoma CityOrlandoPhiladelphiaRaleigh-DurhamSan Jose
AtlantaBoston
CharlotteDetroit
HoustonIndianapolis
Los Angeles Memphis
N. New JerseyNashville
Richmond+1W. Palm Beach+1
Wash DC
Denver+1Honolulu+1Long Island-1New Orleans+1
Source: Mueller, 2004
1467
89 12
13
115
165
432 1
1110
LT Average Occupancy
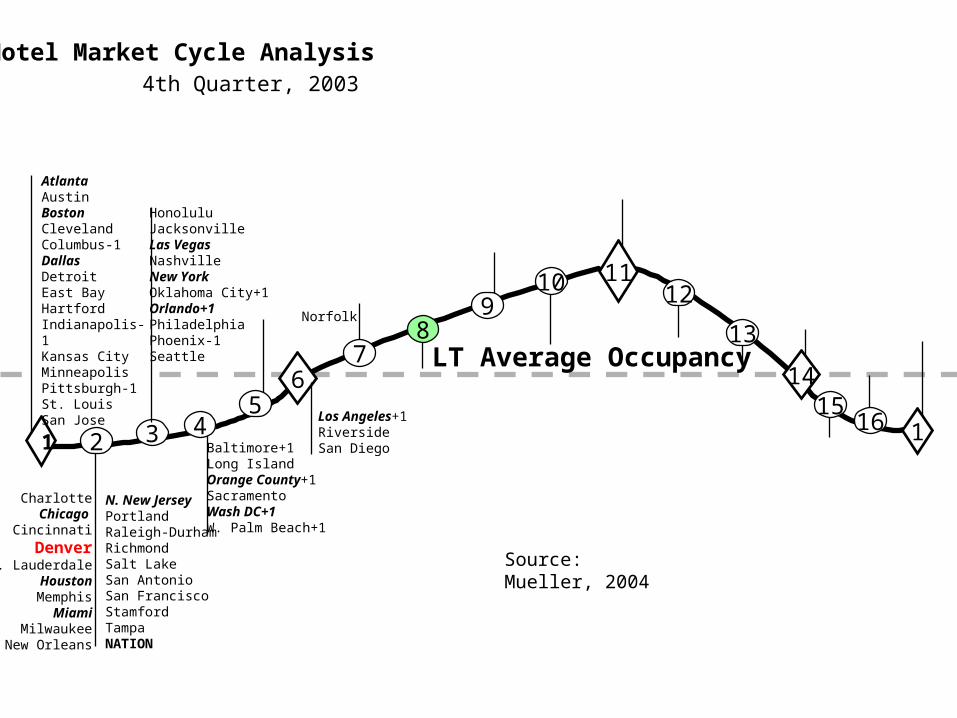
Hotel Market Cycle Analysis4th Quarter, 2003
Norfolk
HonoluluJacksonvilleLas VegasNashvilleNew YorkOklahoma City+1Orlando+1PhiladelphiaPhoenix-1Seattle
Baltimore+1Long IslandOrange County+1SacramentoWash DC+1W. Palm Beach+1
Los Angeles+1RiversideSan Diego
AtlantaAustinBostonClevelandColumbus-1DallasDetroitEast BayHartfordIndianapolis-1Kansas CityMinneapolisPittsburgh-1St. LouisSan Jose
CharlotteChicago
Cincinnati
DenverFt. Lauderdale
HoustonMemphis
MiamiMilwaukee
New Orleans
N. New JerseyPortlandRaleigh-DurhamRichmondSalt LakeSan AntonioSan FranciscoStamfordTampaNATION
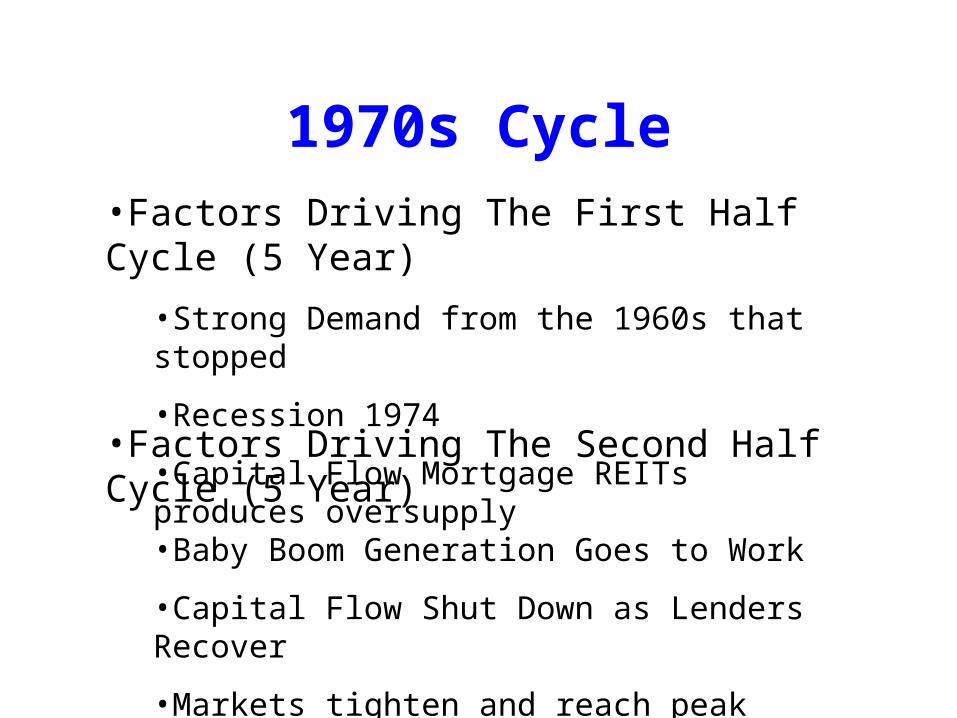
1970s Cycle•Factors Driving The First Half Cycle (5 Year)
•Strong Demand from the 1960s that stopped
•Recession 1974
•Capital Flow Mortgage REITs produces oversupply
•Factors Driving The Second Half Cycle (5 Year)
•Baby Boom Generation Goes to Work
•Capital Flow Shut Down as Lenders Recover
•Markets tighten and reach peak occupancy 1979
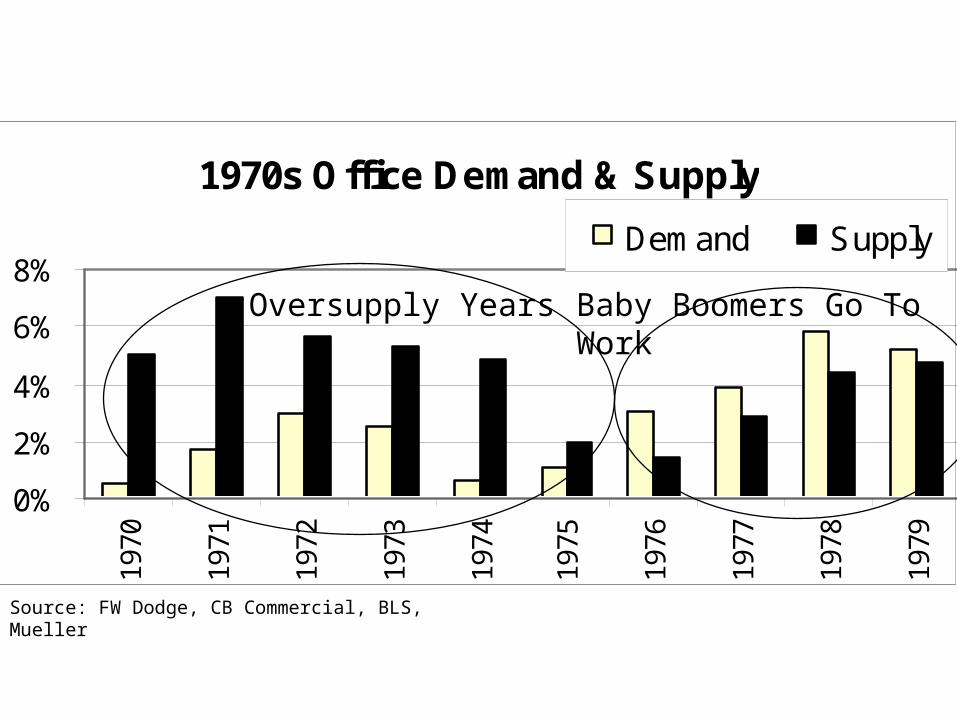
1970s Office Demand & Supply
0%
2%
4%
6%
8%
1970
1971
1972
1973
1974
1975
1976
1977
1978
1979
Demand Supply
Source: FW Dodge, CB Commercial, BLS, Mueller
Oversupply Years Baby Boomers Go To Work

1980s Cycle•Factors Driving The First Half Cycle (5 Year)
•Tight market in 1979 pushes rents and prices up
•Tax Act of 1981 attracts taxable investors supply up
•Factors Driving The Second Half Cycle (5 Year)
•Thrift Deregulation allows capital to flow
•Inflation pushes real estate prices higher
•Tax Act of 1986 slows taxable investors, but not tax free
•Poor stock market attracts Pension & Foreign capital
•Rising R.E. prices masks poor income returns
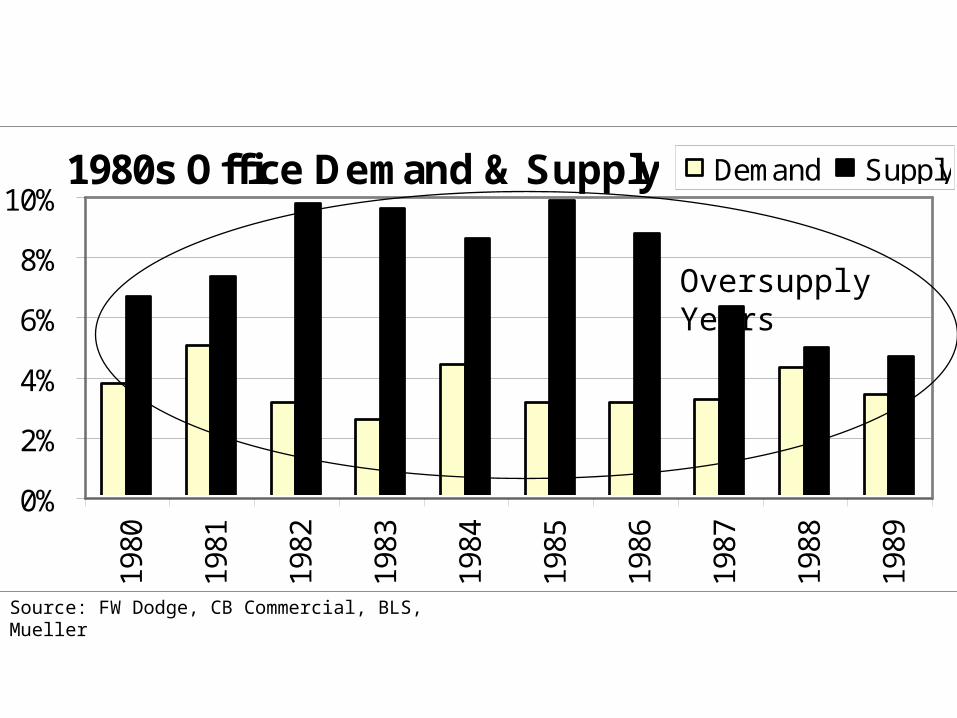
1980s Office Demand & Supply
0%
2%
4%
6%
8%
10%
1980
1981
1982
1983
1984
1985
1986
1987
1988
1989
Demand Supply
Source: FW Dodge, CB Commercial, BLS, Mueller
Oversupply Years
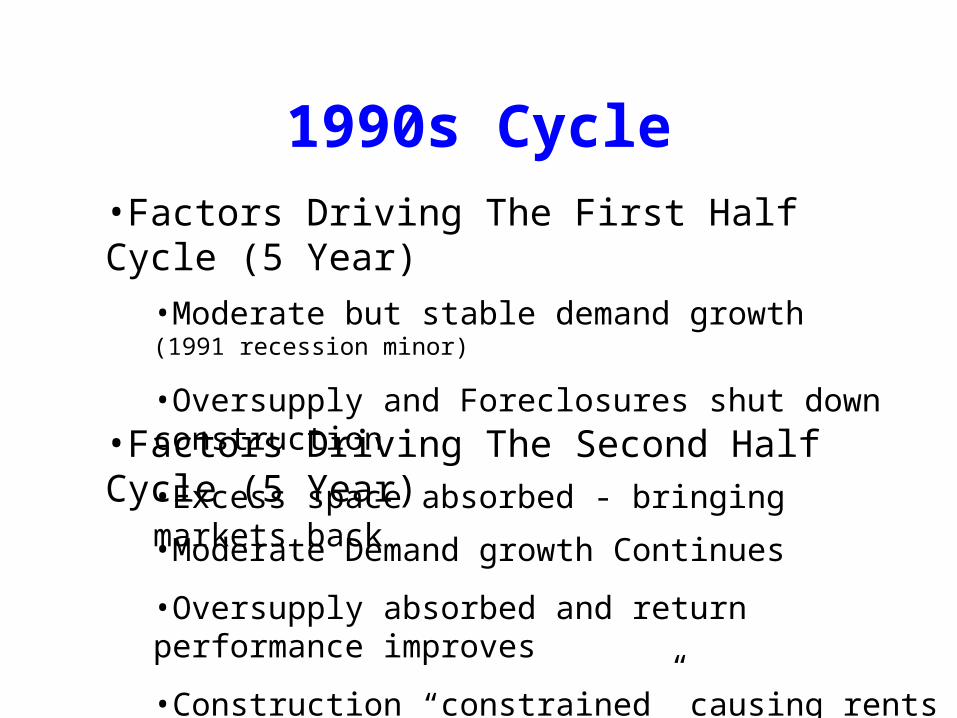
1990s Cycle•Factors Driving The First Half Cycle (5 Year)
•Moderate but stable demand growth (1991 recession minor)
•Oversupply and Foreclosures shut down construction
•Excess space absorbed - bringing markets back
•Factors Driving The Second Half Cycle (5 Year)
•Moderate Demand growth Continues
•Oversupply absorbed and return performance improves
•Construction “constrained” causing rents & prices to rise
•More efficient markets match supply to demand
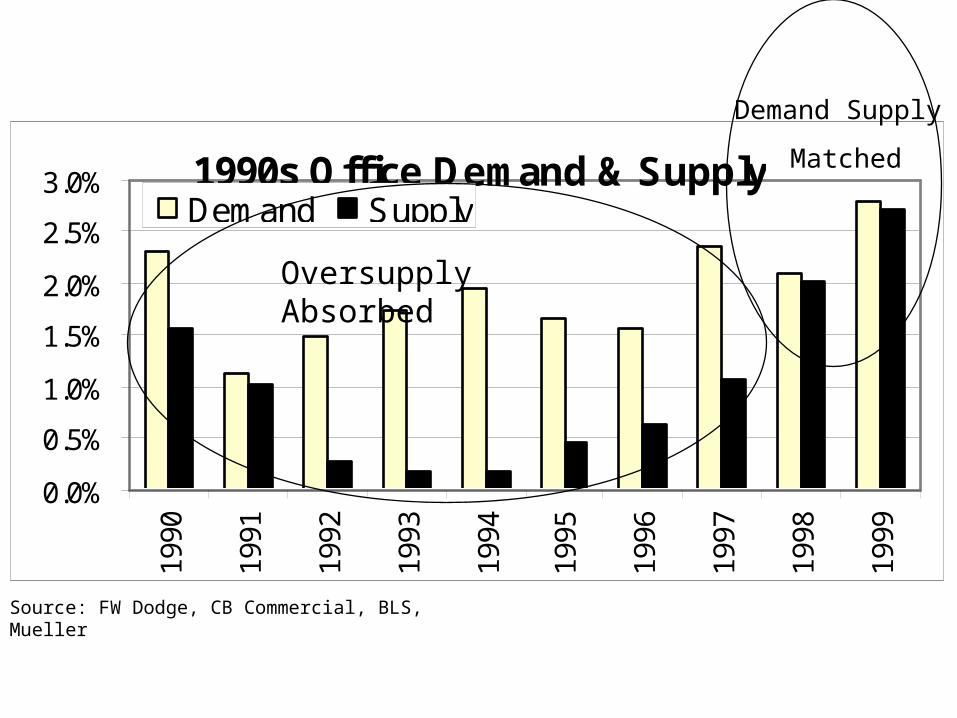
1990s Office Demand & Supply
0.0%
0.5%
1.0%
1.5%
2.0%
2.5%
3.0%19
90
1991
1992
1993
1994
1995
1996
1997
1998
1999
Demand Supply
Source: FW Dodge, CB Commercial, BLS, Mueller
Oversupply Absorbed
Demand Supply
Matched
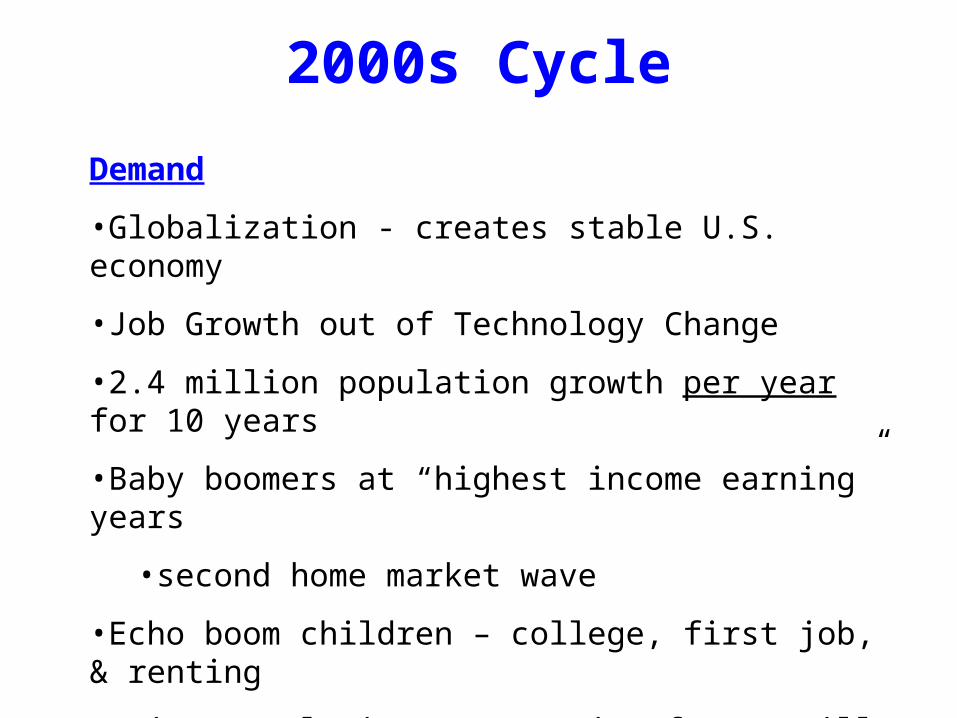
2000s Cycle
Demand
•Globalization - creates stable U.S. economy
•Job Growth out of Technology Change
•2.4 million population growth per year for 10 years
•Baby boomers at “highest income earning” years
•second home market wave
•Echo boom children – college, first job, & renting
•Aging population not a major factor till 2014
•Employment growth - determines demand - WHEN
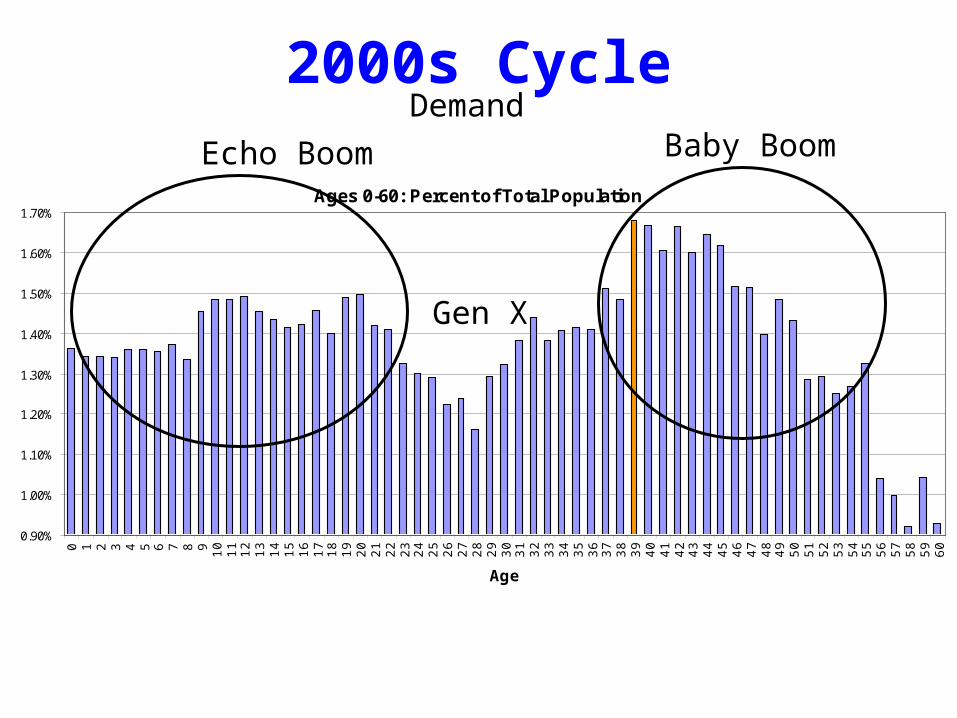
Ages 0-60: Percent of Total Population
0.90%
1.00%
1.10%
1.20%
1.30%
1.40%
1.50%
1.60%
1.70%
0 1 2 3 4 5 6 7 8 9 10 11 12 13 14 15 16 17 18 19 20 21 22 23 24 25 26 27 28 29 30 31 32 33 34 35 36 37 38 39 40 41 42 43 44 45 46 47 48 49 50 51 52 53 54 55 56 57 58 59 60
Age
Demand2000s Cycle
Baby BoomEcho Boom
Gen X
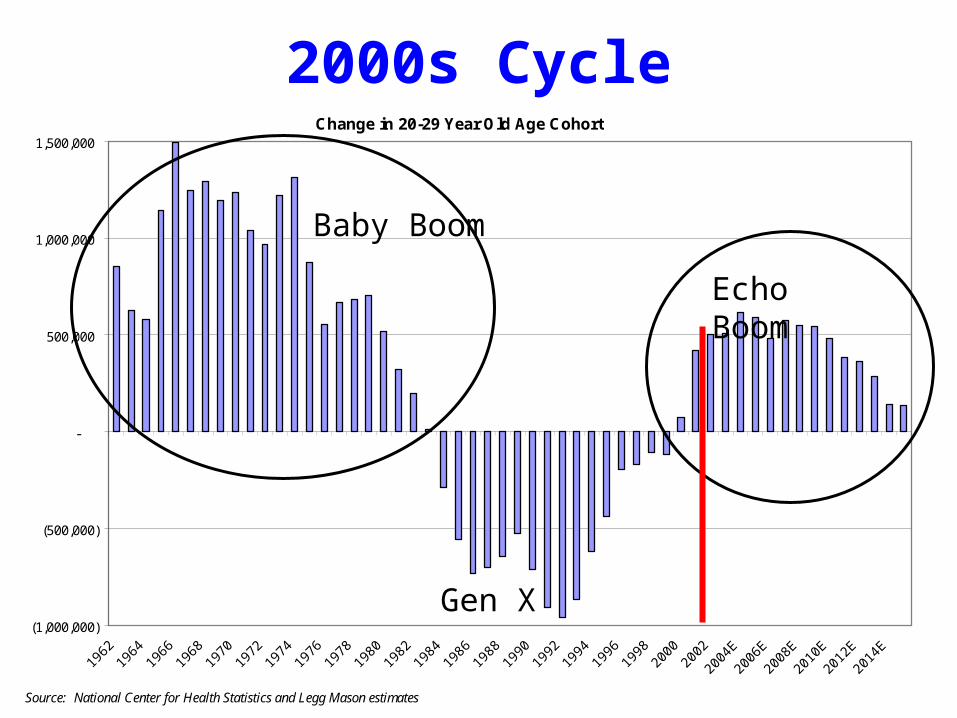
Change in 20-29 Year Old Age Cohort
(1,000,000)
(500,000)
-
500,000
1,000,000
1,500,000
1962
1964
1966
1968
1970
1972
1974
1976
1978
1980
1982
1984
1986
1988
1990
1992
1994
1996
1998
2000
2002
2004
E
2006
E
2008
E
2010
E
2012
E
2014
E
Source: National Center for Health Statistics and Legg Mason estimates
2000s Cycle
Baby Boom
Echo Boom
Gen X
Supply Constraint
•Public Markets make R.E. Capital markets efficient
•Economically driven capital - low spec construction
•Research watchdogs
•Constrained Supply (economically driven capital)
•construction labor harder to find
•materials costs increasing
•infrastructure problems constrain growth
•Feedback loop keeps demand and supply in better balance
•greater transparency
•Faster reaction to demand slowdown
2000s Cycle
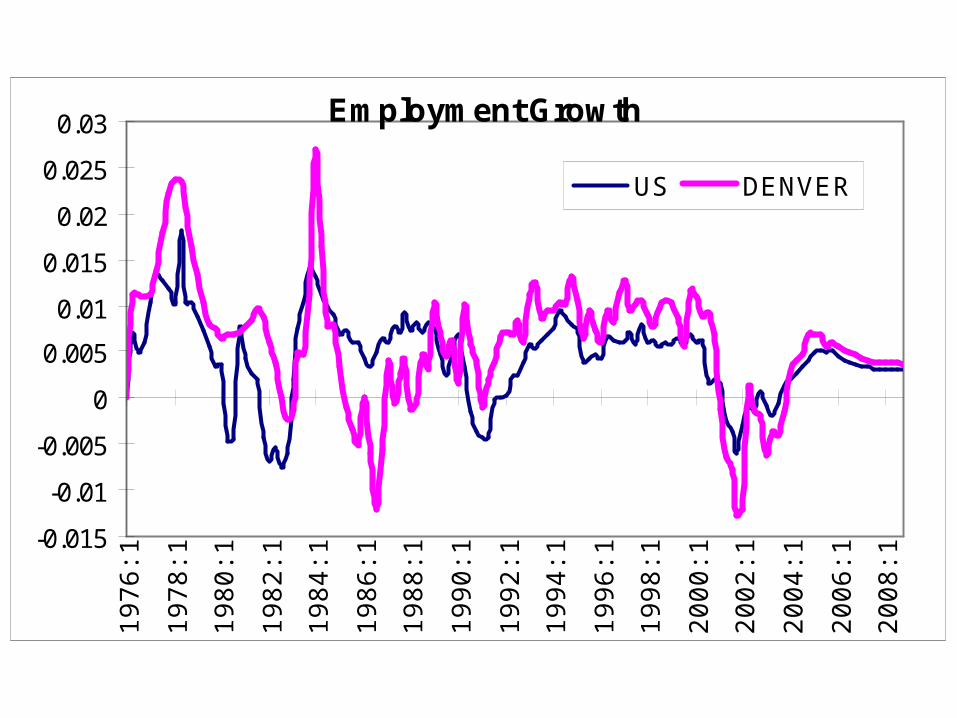
Employment Growth
-0.015
-0.01
-0.005
0
0.005
0.01
0.015
0.02
0.025
0.0319
76:1
1978
:1
1980
:1
1982
:1
1984
:1
1986
:1
1988
:1
1990
:1
1992
:1
1994
:1
1996
:1
1998
:1
2000
:1
2002
:1
2004
:1
2006
:1
2008
:1
US DENVER
Source: Mueller, 2004
11
1467
89
10 12
13
115
16432 1
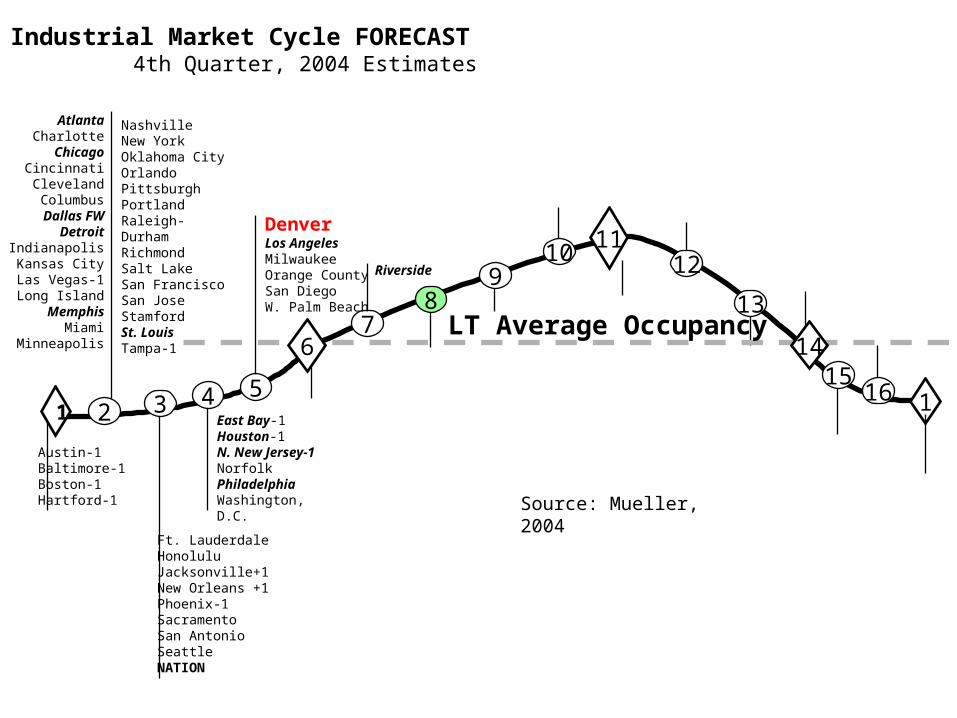
4th Quarter, 2004 Estimates
LT Average Occupancy
Office Market Cycle FORECAST
AlbuquerqueFt. LauderdaleHonoluluLas VegasMemphisRichmondSan Diego+1Wilmington
5
Baltimore-1BostonNew YorkTampa-1
Orange County+1Riverside+2
New OrleansNorfolkN. New JerseyOklahoma CityOrlandoPhiladelphiaPhoenixPittsburghPortlandRaleigh-DurhamSacramentoSalt LakeSan AntonioSan FranciscoSan JoseSeattleStamfordSt. LouisWash, D.C.W. Palm Beach-1NATION
AtlantaAustin
CharlotteChicago
CincinnatiClevelandColumbus
Dallas FW-1
DenverDetroit
East BayHartfordHouston
IndianapolisJacksonvilleKansas City
Long Island-1Los Angeles
MiamiMilwaukee
MinneapolisNashville
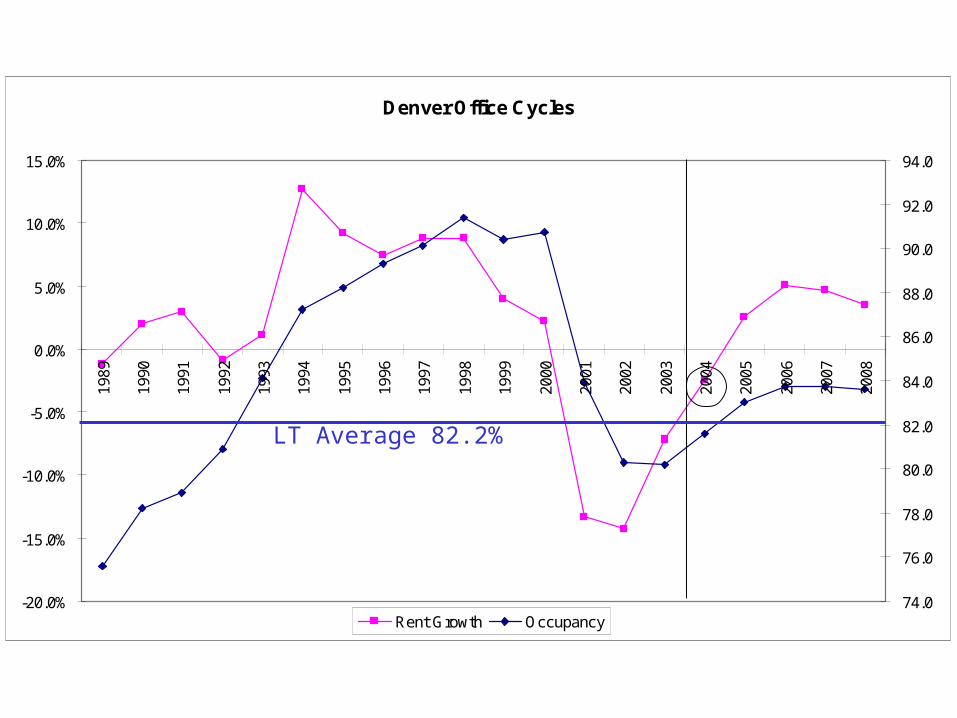
Denver Office Cycles
-20.0%
-15.0%
-10.0%
-5.0%
0.0%
5.0%
10.0%
15.0%
1989
1990
1991
1992
1993
1994
1995
1996
1997
1998
1999
2000
2001
2002
2003
2004
2005
2006
2007
2008
74.0
76.0
78.0
80.0
82.0
84.0
86.0
88.0
90.0
92.0
94.0
Rent Growth Occupancy
LT Average 82.2%
Source: Mueller, 2004
11
1467
89
10 12
13
115
1653 1
4th Quarter, 2004 Estimates
DenverLos AngelesMilwaukeeOrange CountySan DiegoW. Palm Beach
LT Average Occupancy
Industrial Market Cycle FORECAST
Riverside
4
AtlantaCharlotteChicago
CincinnatiClevelandColumbus
Dallas FWDetroit
IndianapolisKansas CityLas Vegas-1Long Island
MemphisMiami
Minneapolis
2
Ft. LauderdaleHonoluluJacksonville+1New Orleans +1Phoenix-1SacramentoSan AntonioSeattleNATION
Nashville New YorkOklahoma CityOrlandoPittsburghPortlandRaleigh-Durham RichmondSalt LakeSan FranciscoSan JoseStamfordSt. LouisTampa-1
East Bay-1Houston-1N. New Jersey-1NorfolkPhiladelphiaWashington, D.C.
Austin-1Baltimore-1Boston-1Hartford-1
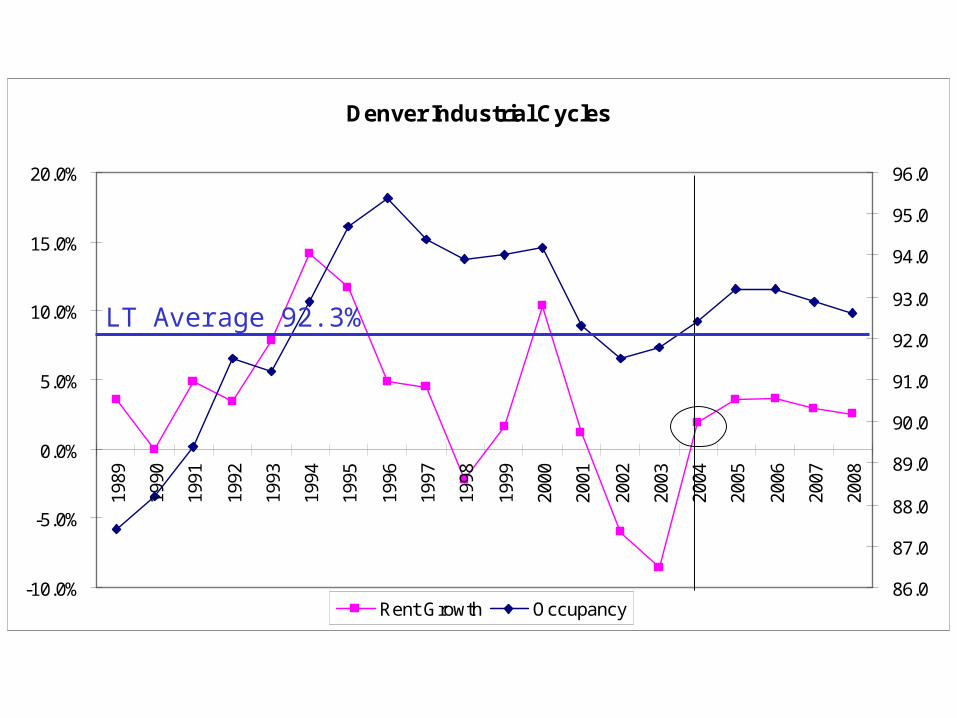
Denver Industrial Cycles
-10.0%
-5.0%
0.0%
5.0%
10.0%
15.0%
20.0%
1989
1990
1991
1992
1993
1994
1995
1996
1997
1998
1999
2000
2001
2002
2003
2004
2005
2006
2007
2008
86.0
87.0
88.0
89.0
90.0
91.0
92.0
93.0
94.0
95.0
96.0
Rent Growth Occupancy
LT Average 92.3%
Source: Mueller, 2004
11
1467
89
10 12
13
115
16432 1
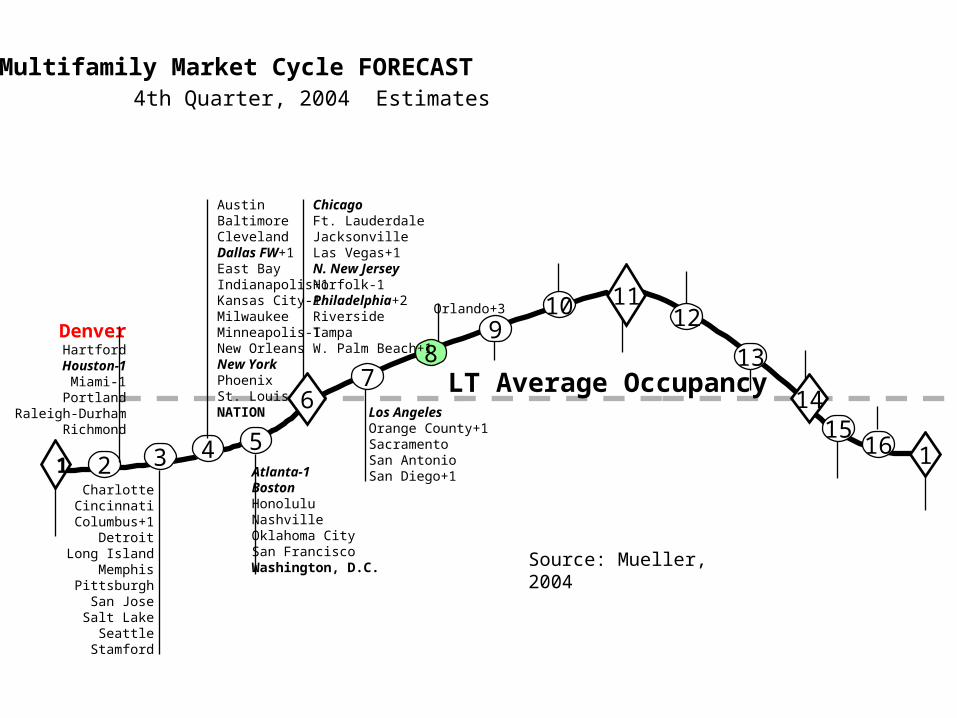
4th Quarter, 2004 Estimates
Los AngelesOrange County+1SacramentoSan AntonioSan Diego+1
LT Average Occupancy
Multifamily Market Cycle FORECAST
CharlotteCincinnati
Columbus+1Detroit
Long IslandMemphis
PittsburghSan Jose
Salt LakeSeattle
Stamford
Atlanta-1BostonHonoluluNashvilleOklahoma CitySan FranciscoWashington, D.C.
ChicagoFt. LauderdaleJacksonvilleLas Vegas+1N. New JerseyNorfolk-1Philadelphia+2RiversideTampaW. Palm Beach+1
AustinBaltimoreClevelandDallas FW+1East BayIndianapolis+1Kansas City-1MilwaukeeMinneapolis-1New OrleansNew YorkPhoenixSt. LouisNATION
DenverHartford
Houston-1Miami-1Portland
Raleigh-DurhamRichmond
5
Orlando+3
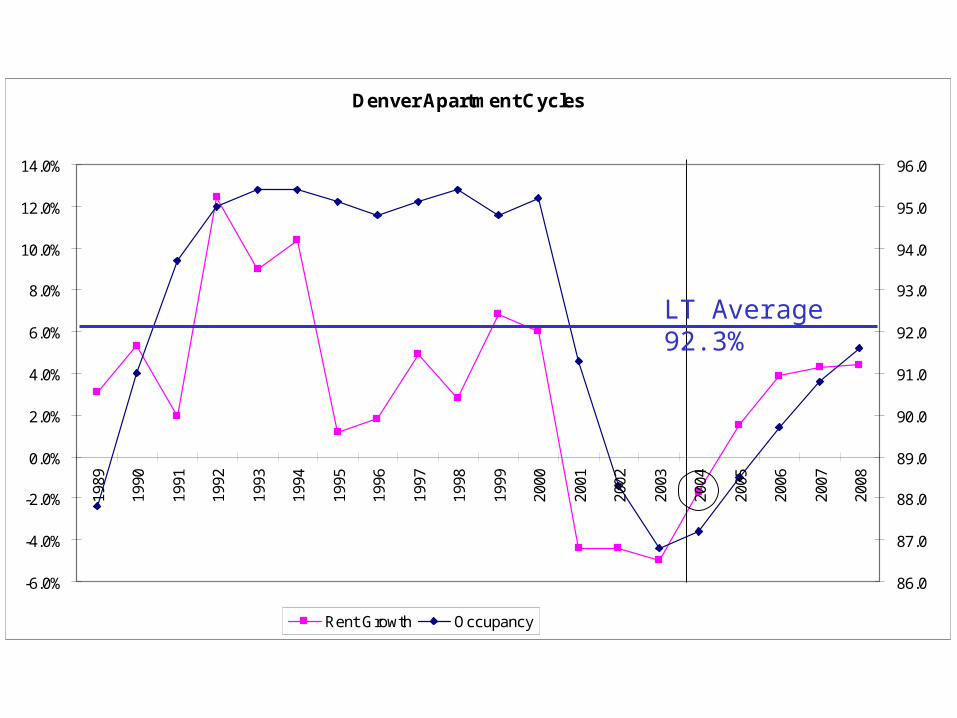
Denver Apartment Cycles
-6.0%
-4.0%
-2.0%
0.0%
2.0%
4.0%
6.0%
8.0%
10.0%
12.0%
14.0%
1989
1990
1991
1992
1993
1994
1995
1996
1997
1998
1999
2000
2001
2002
2003
2004
2005
2006
2007
2008
86.0
87.0
88.0
89.0
90.0
91.0
92.0
93.0
94.0
95.0
96.0
Rent Growth Occupancy
LT Average 92.3%
Source: Mueller, 2004
11
147
89
10 12
13
115
165432 1
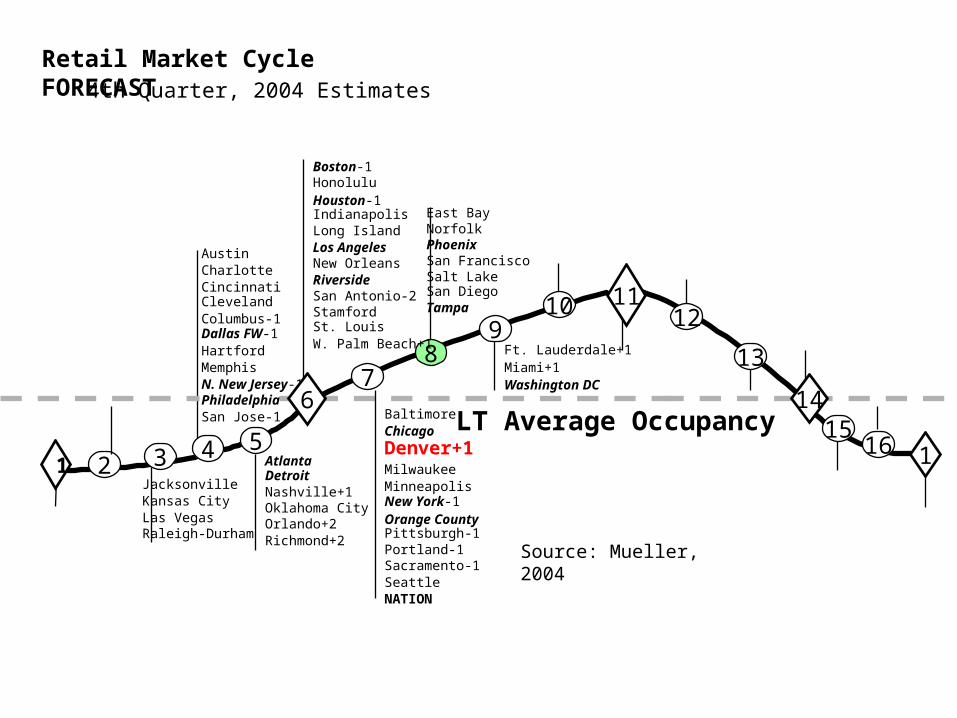
4th Quarter, 2004 Estimates
Boston-1HonoluluHouston-1IndianapolisLong IslandLos AngelesNew OrleansRiversideSan Antonio-2StamfordSt. LouisW. Palm Beach+1
LT Average Occupancy
Retail Market Cycle FORECAST
AustinCharlotteCincinnatiClevelandColumbus-1Dallas FW-1HartfordMemphisN. New Jersey-1PhiladelphiaSan Jose-1
AtlantaDetroitNashville+1Oklahoma City Orlando+2Richmond+2
East BayNorfolkPhoenixSan FranciscoSalt LakeSan DiegoTampa
JacksonvilleKansas CityLas VegasRaleigh-Durham
6
Ft. Lauderdale+1Miami+1Washington DC
BaltimoreChicago
Denver+1MilwaukeeMinneapolisNew York-1Orange CountyPittsburgh-1Portland-1Sacramento-1SeattleNATION
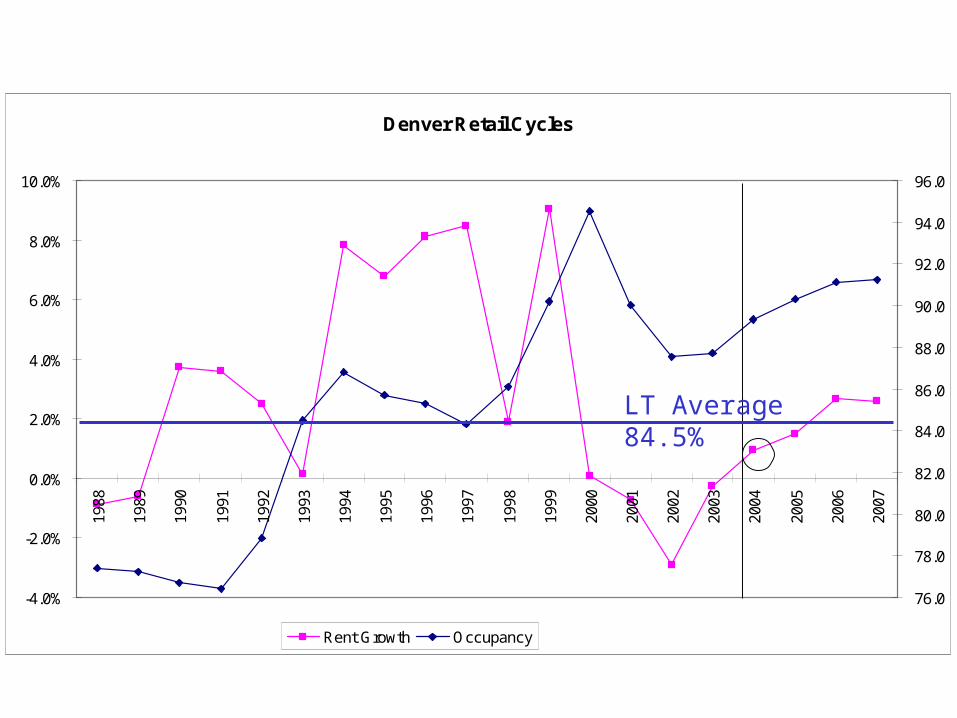
Denver Retail Cycles
-4.0%
-2.0%
0.0%
2.0%
4.0%
6.0%
8.0%
10.0%
1988
1989
1990
1991
1992
1993
1994
1995
1996
1997
1998
1999
2000
2001
2002
2003
2004
2005
2006
2007
76.0
78.0
80.0
82.0
84.0
86.0
88.0
90.0
92.0
94.0
96.0
Rent Growth Occupancy
LT Average 84.5%
Source: Mueller, 2004
11
1467
89
10 12
13
115
165432 1
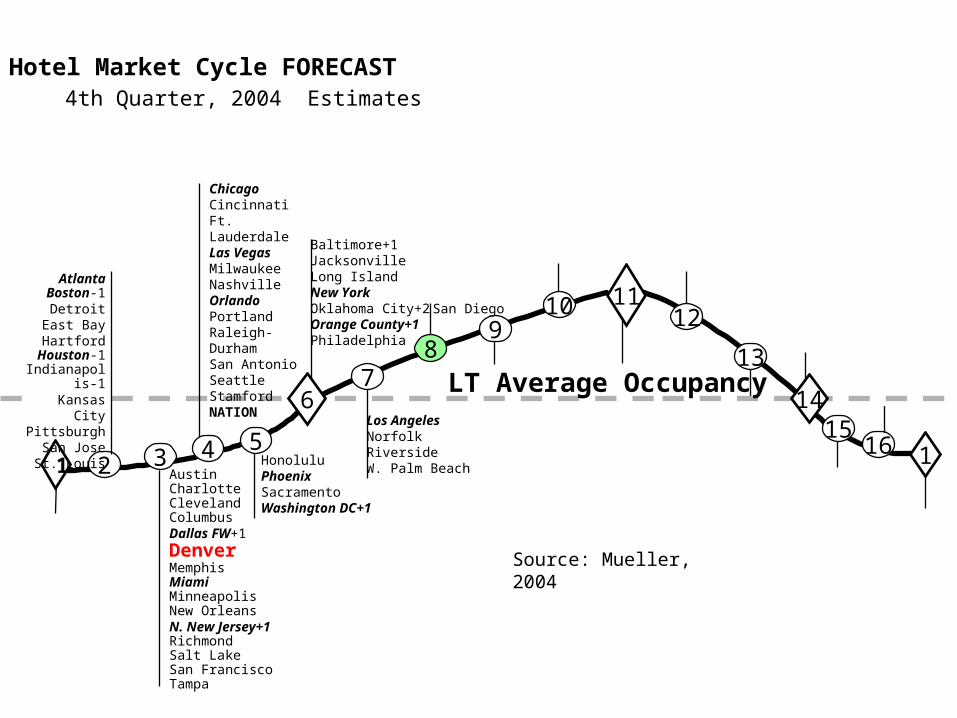
4th Quarter, 2004 Estimates
LT Average Occupancy
Hotel Market Cycle FORECAST
AustinCharlotteClevelandColumbusDallas FW+1
DenverMemphisMiamiMinneapolisNew OrleansN. New Jersey+1Richmond Salt LakeSan FranciscoTampa
ChicagoCincinnatiFt. LauderdaleLas VegasMilwaukeeNashvilleOrlandoPortlandRaleigh-DurhamSan AntonioSeattleStamfordNATION
HonoluluPhoenixSacramentoWashington DC+1
Baltimore+1JacksonvilleLong IslandNew YorkOklahoma City+2Orange County+1Philadelphia
AtlantaBoston-1
DetroitEast BayHartford
Houston-1Indianapolis-1
Kansas CityPittsburgh
San JoseSt. Louis
Los AngelesNorfolkRiversideW. Palm Beach
San Diego
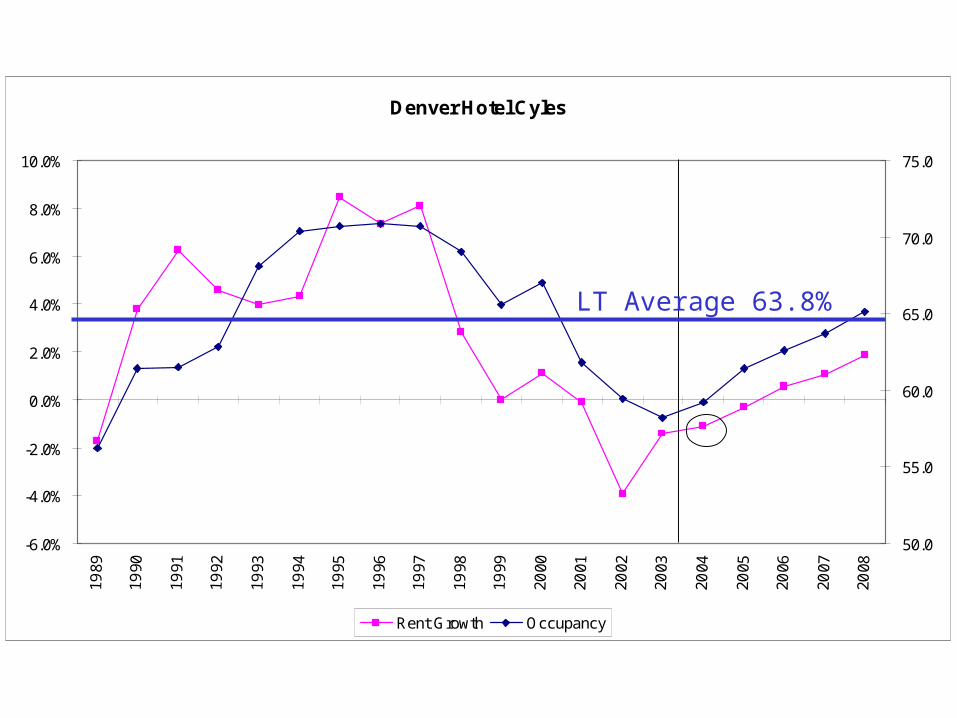
Denver Hotel Cyles
-6.0%
-4.0%
-2.0%
0.0%
2.0%
4.0%
6.0%
8.0%
10.0%
1989
1990
1991
1992
1993
1994
1995
1996
1997
1998
1999
2000
2001
2002
2003
2004
2005
2006
2007
2008
50.0
55.0
60.0
65.0
70.0
75.0
Rent Growth Occupancy
LT Average 63.8%
Real Estate Financial Cycles
Capital Flows
Affect Prices
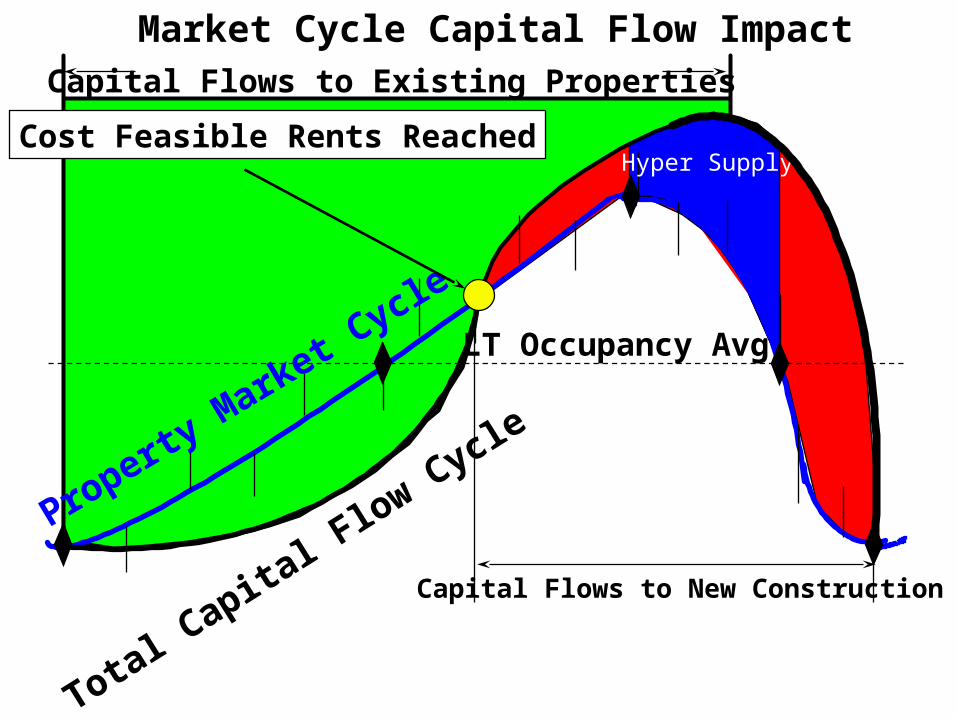
Hyper Supply
LT Occupancy Avg.
Market Cycle Capital Flow Impact
Capital Flows to Existing Properties
Capital Flows to New Construction
Total Capita
l Flow CycleProperty M
arket Cycle
Cost Feasible Rents Reached
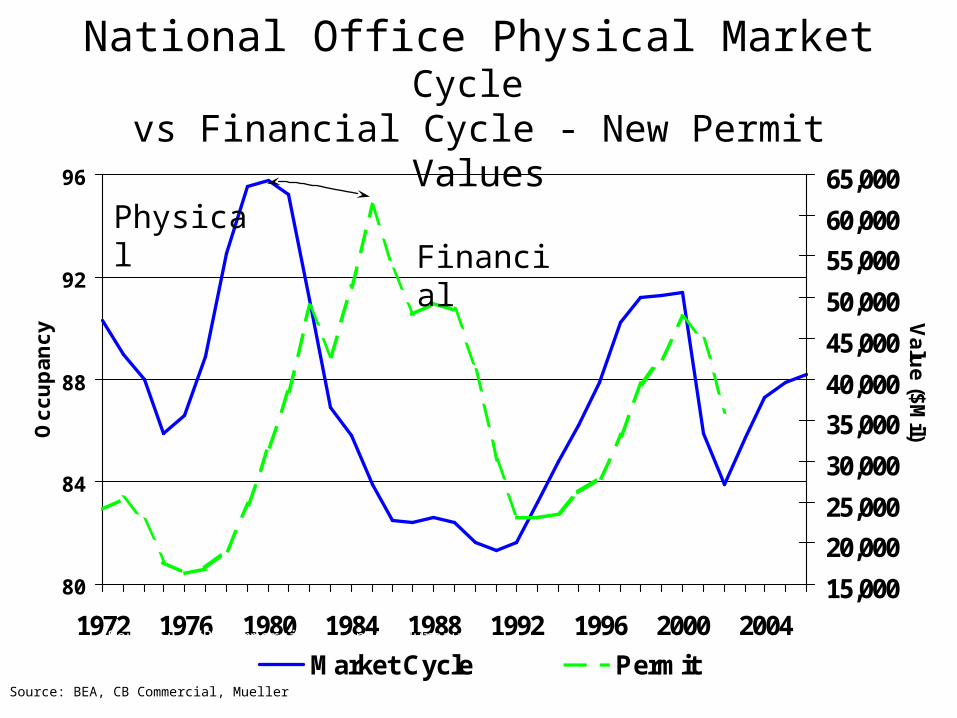
National Office Physical Market Cycle vs Financial Cycle - New Permit Values
80
84
88
92
96
1972 1976 1980 1984 1988 1992 1996 2000 2004
Oc
cu
pa
nc
y
15,000
20,000
25,000
30,000
35,000
40,000
45,000
50,000
55,000
60,000
65,000
Va
lue
($M
il)
Market Cycle PermitSource: CB Commercial, Census Bureau
PhysicalFinancial
Source: BEA, CB Commercial, Mueller
-10,000
-5,000
0
5,000
10,000
15,000
20,000
25,000
1970
Q1
1972
Q1
1974
Q1
1976
Q1
1978
Q1
1980
Q1
1982
Q1
1984
Q1
1986
Q1
1988
Q1
1990
Q1
1992
Q1
1994
Q1
1996
Q1
1998
Q1
2000
Q1
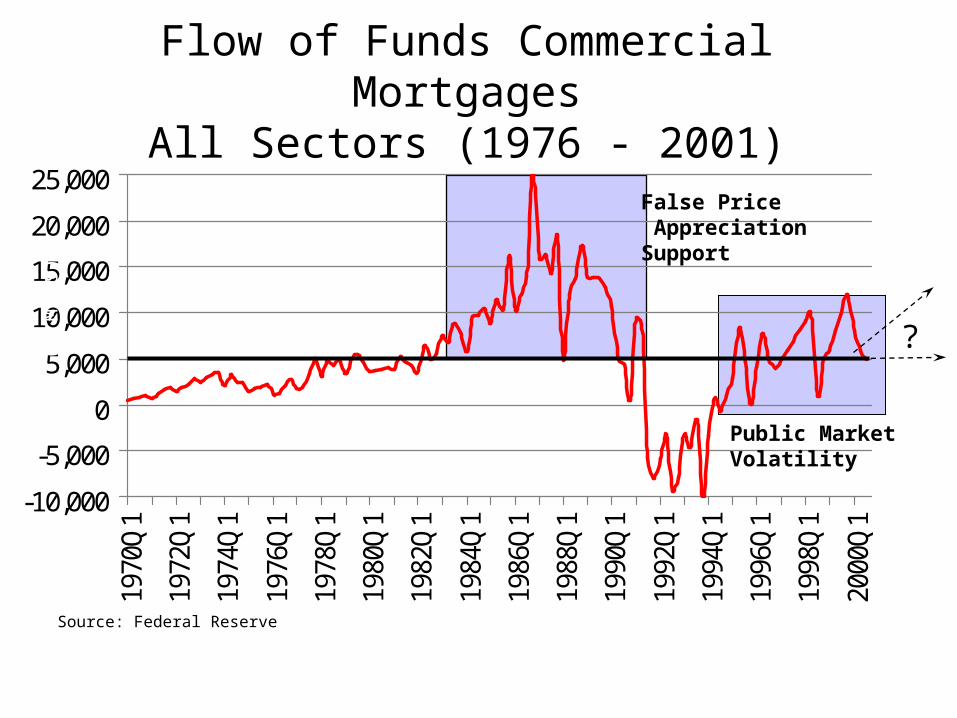
Flow of Funds Commercial MortgagesAll Sectors (1976 - 2001)
False Price AppreciationSupport
?($ M
ils)
Source: Federal Reserve
Public MarketVolatility
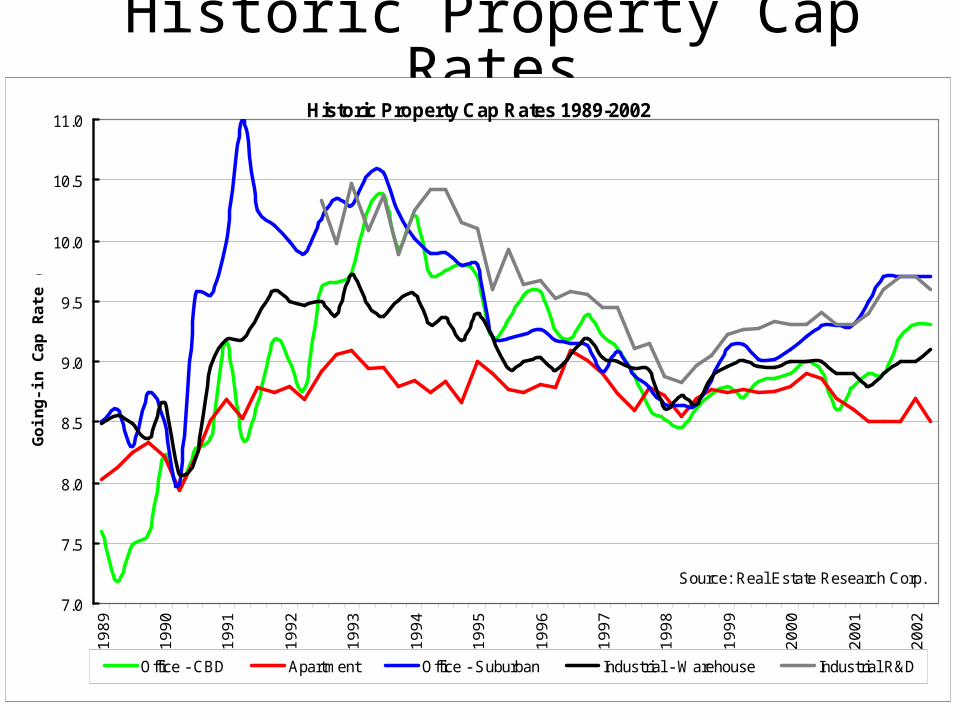
Historic Property Cap RatesHistoric Property Cap Rates 1989-2002
7.0
7.5
8.0
8.5
9.0
9.5
10.0
10.5
11.019
89
1990
1991
1992
1993
1994
1995
1996
1997
1998
1999
2000
2001
2002
Go
ing
-in
Cap
Rat
e (%
)
Office - CBD Apartment Office - Suburban Industrial - Warehouse Industrial R&D
Source: Real Estate Research Corp.
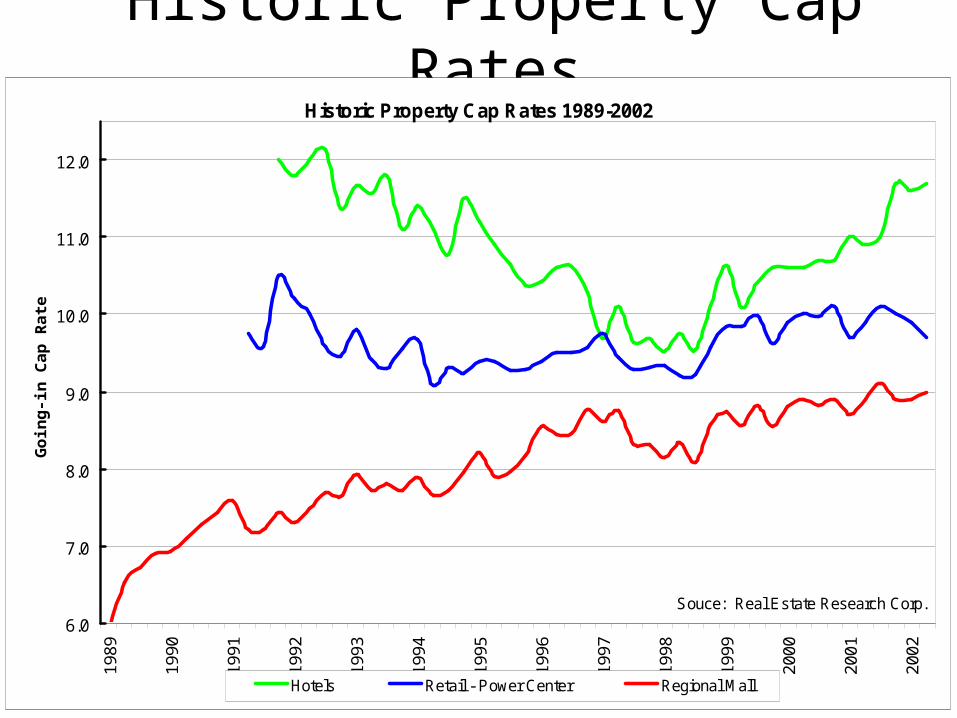
Historic Property Cap RatesHistoric Property Cap Rates 1989-2002
6.0
7.0
8.0
9.0
10.0
11.0
12.0
1989
1990
1991
1992
1993
1994
1995
1996
1997
1998
1999
2000
2001
2002
Go
ing
-in
Cap
Rat
e (%
)
Hotels Retail - Power Center Regional Mall
Souce: Real Estate Research Corp.
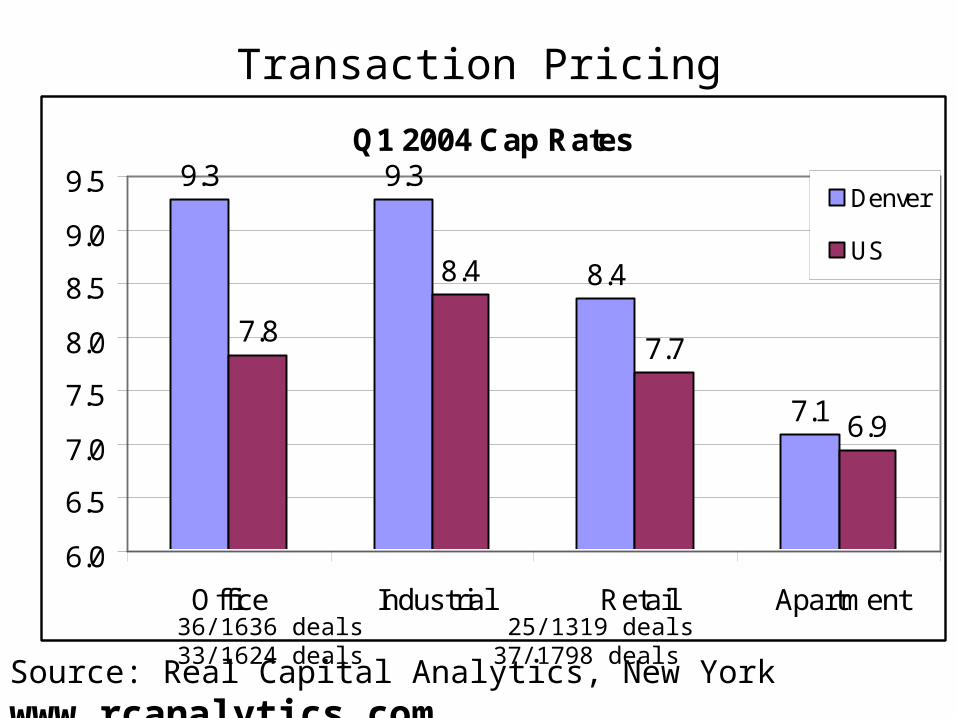
Transaction Pricing
Source: Real Capital Analytics, New York www.rcanalytics.com
Q1 2004 Cap Rates9.3 9.3
8.4
7.1
7.8
8.4
7.7
6.9
6.0
6.5
7.0
7.5
8.0
8.5
9.0
9.5
Office Industrial Retail Apartment
Denver
US
36/1636 deals 25/1319 deals 33/1624 deals 37/1798 deals
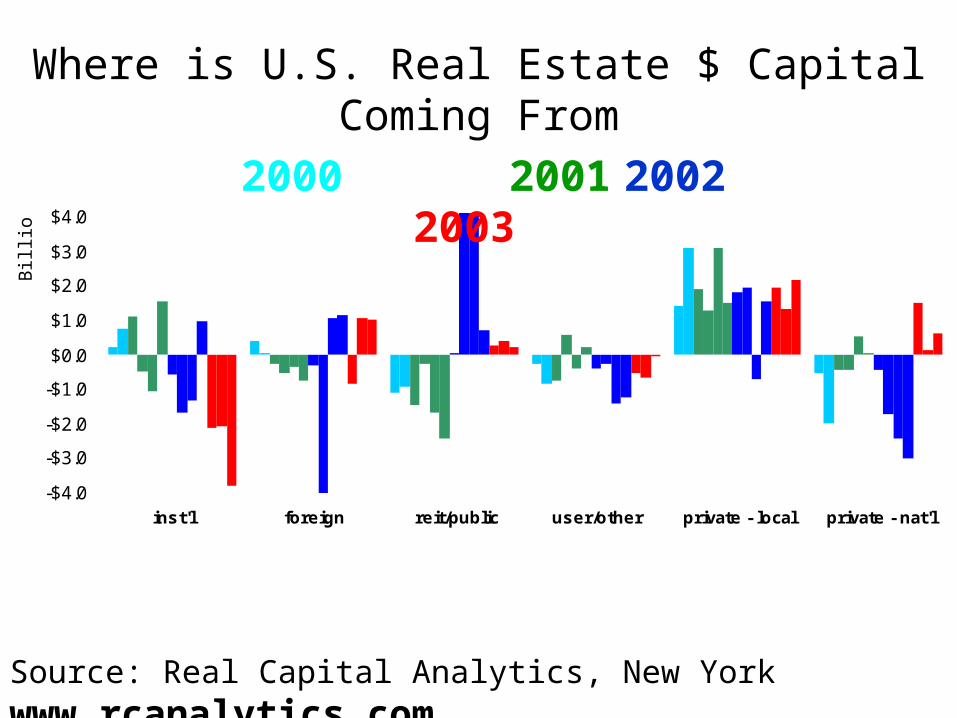
Where is U.S. Real Estate $ Capital Coming From
-$4.0
-$3.0
-$2.0
-$1.0
$0.0
$1.0
$2.0
$3.0
$4.0
inst'l foreign reit/public user/other private - local private - nat'l
Bill
ion
s
2000 2001 2002 2003
Source: Real Capital Analytics, New York www.rcanalytics.com
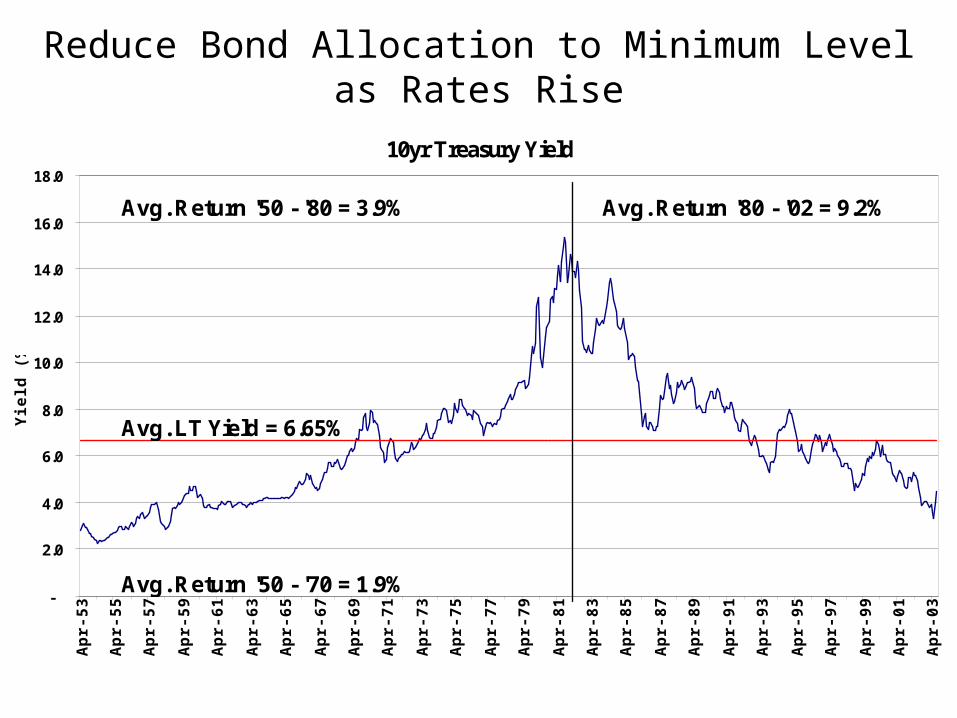
Reduce Bond Allocation to Minimum Level as Rates Rise
10yr Treasury Yield
-
2.0
4.0
6.0
8.0
10.0
12.0
14.0
16.0
18.0
Apr
-53
Apr
-55
Apr
-57
Apr
-59
Apr
-61
Apr
-63
Apr
-65
Apr
-67
Apr
-69
Apr
-71
Apr
-73
Apr
-75
Apr
-77
Apr
-79
Apr
-81
Apr
-83
Apr
-85
Apr
-87
Apr
-89
Apr
-91
Apr
-93
Apr
-95
Apr
-97
Apr
-99
Apr
-01
Apr
-03
Yie
ld (
%)
Avg. LT Yield = 6.65%
Avg. Return '50 - '70 = 1.9%
Avg. Return '80 - '02 = 9.2%Avg. Return '50 - '80 = 3.9%

2003 Physical CycleDemand & Supply Affect Vacancies Rental Growth
Demand Growth - MUCH SLOWER for How long?
Supply Slowing - how long to absorb?
Return to Growth Phase in 2006?
Wars stop progress - Create Economic Recovery after ?
2003 Financial CycleCapital Flows Affect Prices – Stock Market Fear
Real Estate the SAFEST Investment Alternative?
Interest Rates are driving investments in the short run
R E Equity – dominated by private markets (currently international)
Public Market Debt – Biggest RE Capital Source
Confidence will return in 200?