gis for assessing spatio-temporal variations in trawl
TRANSCRIPT
Abstract
In India, trawl is the major gear contributing morethan 50% of the marine fish landing and during2008-2011, the average landing along the Indiancoast was estimated at 1.7 million t. In India, fishbrought from trawl fishery for human consumptionin fresh or processed form is termed as commerciallanding and the rest is called low valued bycatch(LVB). The increased demand for LVB from fishmeal plants is an emerging threat for marine fishproduction in the future, since LVB was constitutedmainly by juveniles of commercial fishes. The studyshowed that the percentage of LVB from the trawlersin India increased from 21% in 2008 to 23% in 2011.The results of the study identify some of the fishinggrounds and seasons, in which the percentage ofjuvenile bycatch of the commercial species is veryhigh. Implementing operational restrictions in thefishery in such areas will help in reviving the stock.The paper illustrates the utility of the spatio-temporal data in suggesting seasonal and spatialrestrictions in fishing operations in tropicalmultispecies scenario.
Keywords: Trawl fishery, bycatch reduction, juve-nile exploitation, GIS, operational restriction
Introduction
About 27 million t of the total global catch isdiscarded annually (Alverson et al., 1994). Thereare various bycatch reduction devices employed indifferent countries for different gears and Eayrs(2005), Boopendranath (2007) and Pravin et al.
Fishery Technology 52 (2015) : 152 - 156
© 2015 Society of Fisheries Technologists (India)
GIS for Assessing Spatio-temporal Variations in TrawlBycatch off Mangalore Coast
A. P. Dineshbabu1*, Sujitha Thomas1 and A. C. Dinesh2
1 Central Marine Fisheries Research Institute, Research Centre Mangalore, P.B.No.244, Mangalore - 575 001, India2 Geological Survey of India, Marine Wing, Pandeshwar, Mangalore - 575 001, India
(2011) have reviewed the development and utilityof design based bycatch reduction devices (BRD).The use of selection technology in reducing theincidental catch of non-target species from fishinggrounds in tropical waters was found to be lesseffective due to various reasons (Dineshbabu et al.,2014). In tropical fishery scenario, where variousspecies at different phases of their life cycle co-exist, mesh size regulation and similar design basedrestrictions have lot of practical difficulties. It issuggested that the BRDs in association with spatialand temporal closures of trawling will be the bestoption for the bycatch reduction in tropical waters.Expert Consultation on International Guidelines forBycatch Management of Discards (FAO, 2010)suggested that closure of nursery/spawning groundsor areas of special biological significance canreduce bycatch and such spatially based measureshelp in the creation of marine protected areas,marine parks and zones reserved for traditionalfishing activities.
Geographic information systems (GIS) is a powerfultool which integrates the spatial component with thepresent temporal studies, but GIS rarely appearswithin the institutionalized system of science inmany countries (St. Martin, 2004). GIS mapping ofspatio-temporal distribution of all fishes and thedifferent life stages and sizes of the fish distributedin a specific area can form a background informationfor spatial restriction of fishery to reduce bycatch.This multilayered information on different species,different size groups and different maturity stages,will enable researchers and policy makers to assessthe fishing ground under their jurisdiction in termsof resource conservation and exploitation. GIS basedmapping was used for spatial allocation of fishingintensity successfully implemented in inshore wa-ters of bay of Fundy in Canada (Caddy & Carocci,1999). Operational restrictions in fisheries manage-ment will help in curtailing fishing operations in
Received 30 March 2015; Revised 15 May 2015; Accepted 21 July2015
* E-mail: [email protected]
certain areas of biological significance, designated asmarine protected areas (MPA). MPA managers andscientists are increasingly using GIS to manage, mapand analyze resources under their jurisdiction(Manson & Die, 2001). Objective of the study wasto understand the spatial and temporal distributionof juvenile fishes to suggest approaches for conser-vation of resources.
Material and Methods
Data on total catch, bycatch and discards werecollected from a pre-identified commercial trawler.The LOA of trawler was 15.85 m with 160 hp enginewhich was engaged in multi-day trawling rangingfrom 8 to 13 days. Crew in the sampling vessel weretrained for onboard data collection using a log sheet.Along with fishing information, an unsorted portionof discarded catch was collected as sample foranalysis. The samples were preserved in ice andstored in fish-hold and were identified up to specieslevel. The spatial data collected were used as aninput for the GIS study. For spatio-temporaldistribution mapping and smooth handling of data,two softwares were used, viz., ArcGIS and VisualBasic 6. Visual Basic was populated with data ofcommercial catch and discards, geographic coordi-nates, water depths and net types. Thematic shapefiles/feature classes were prepared by sendingqueries to this database. Data collection was doneduring 2008-2009 and data from 483 trawling dayswere used for the analysis.
To get an overall picture of catch-bycatch situationin trawl fishery of India, trawl fishery data werecollected from all the major fishing harbours ofIndia, namely Veraval (Gujarat), Mumbai(Maharashtra), Karwar and Mangalore (Karnataka),Calicut, Cochin and Sakthikulangara (Kerala),Chennai (Tamil Nadu) and Visakhapatnam (AndhraPradesh) during 2007-2012.
Results and Discussion
Even though trawl is a non-selective gear, there isa targeted fishery in each season. Major targets areshrimps, cephalopods and high value demersalfishes. Fish trawls are dragged with high speed tocatch bottom and off bottom resources. The esti-mated all India trawl landing showed an increasingtrend during the period of study. Average all Indiatrawl landing for the period 2008-2011 was 17 lakht. with a maximum of 20 lakh t in 2011. Trawllandings formed 51% of the total marine fish
landing in the country. It was observed that eventhough the total landing by trawlers showed steadyincrease during 2008-2011, corresponding increasewas not recorded in the edible portion of thelanding, which fluctuated around 3 lakh t during theperiod. The non-edible portion of the landingsteadily increased from 50,000 t in 2008 to 1 lakht in 2011. Overall analysis of the trawl centres ofIndian coast showed that the LVB percentage in thetotal landed fish was 16% in 2008, which increasedto 27% in 2011. Though trash landing was on theincrease in all the centres the quantity discarded wasless. Alverson et al. (1994) observed that the Chineseshrimp trawl fleet discards very little of the non-shrimp catch and all the bycatch was used as feedfor Chinese aquaculture industry. In Asia, there hasbeen considerable growth in aquaculture in recentyears and the demand for trash in fish meal plantsin India has also increased to a large extent. In fooddeficit countries, bycatch is used for feeding peopleand better utilization of the bycatch has reduced thediscards substantially (Clucas, 1996). In manyinstances the value realized for trash is more thanthat is available for low value edible variety and thisis causing serious threat to food security (Chandrapal,2005).
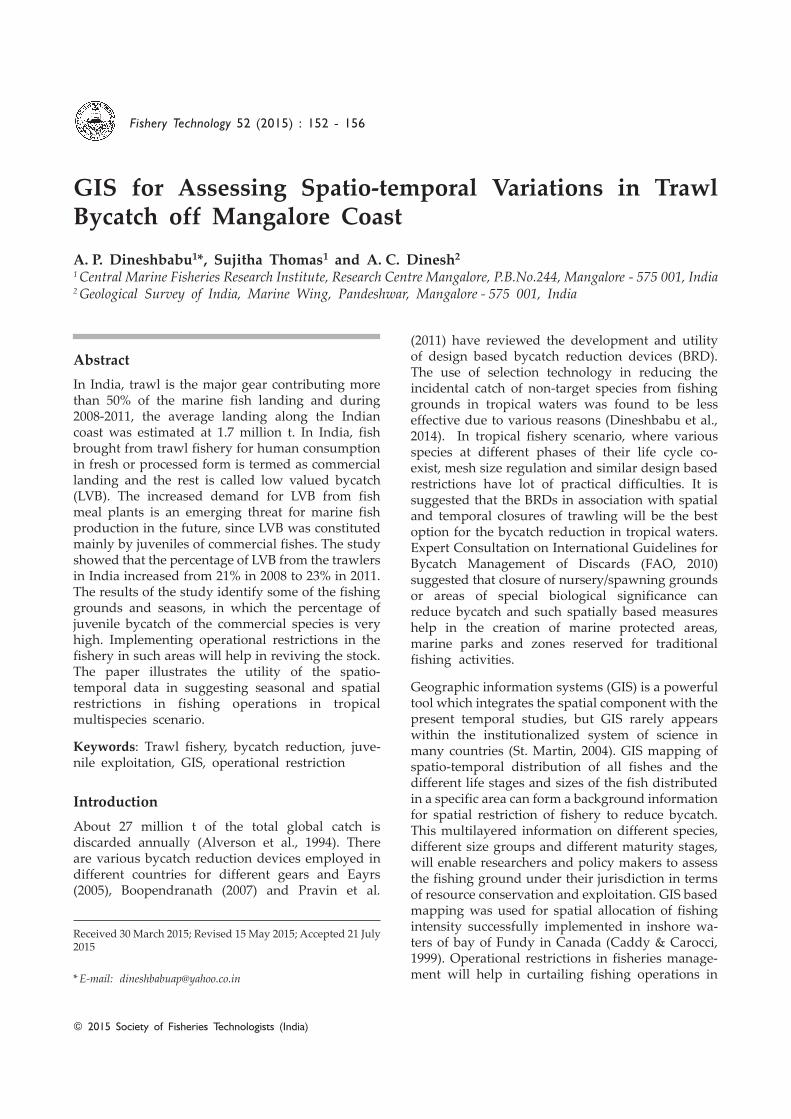
Karnataka accounted for 11% of the country’s trawllanding during 2008-2011. Over the years trawlingin Karnataka have undergone considerable changes.Shrimp trawling became a minor activity and thetarget is shifted towards finfishes and cephalopods.About 90% of the trawl landing of Mangalore in2012 was formed by fin fishes and the contributionof shrimps was reduced to mere 2%. There wasconsiderable reduction in discarded bycatch inMangalore during 2008-2011. In 2008, the estimateddiscard percentage of multi day trawlers was 22%,which came down to 6% in 2011. Bycatch fromsingle-day trawlers formed 30 to 40 % of total catch.There was a considerable increase in landedbycatch (trash) in Mangalore. The trash landingwhich formed only 3% (3,000 t) of the trawl landingin 2008 increased to 26% of the total fish landed(12,000t) in 2011. Detailed study of the compositionof catch, LVB and discards from trawlers operatedfrom Mangalore during 2008 and 2009 is shown inFig. 1.
This kind of increase in LVB landing was the resultof increased demand from the fish meal plantsoperating all along the Karnataka coast. Juveniles of95 species of finfishes, 27 species of crustaceans and
Operation Based Juvenile Bycatch Reduction 153
© 2015 Society of Fisheries Technologists (India) Fishery Technology 52 : 152-156
20 species of molluscs were identified from LVBlanding from Mangalore.
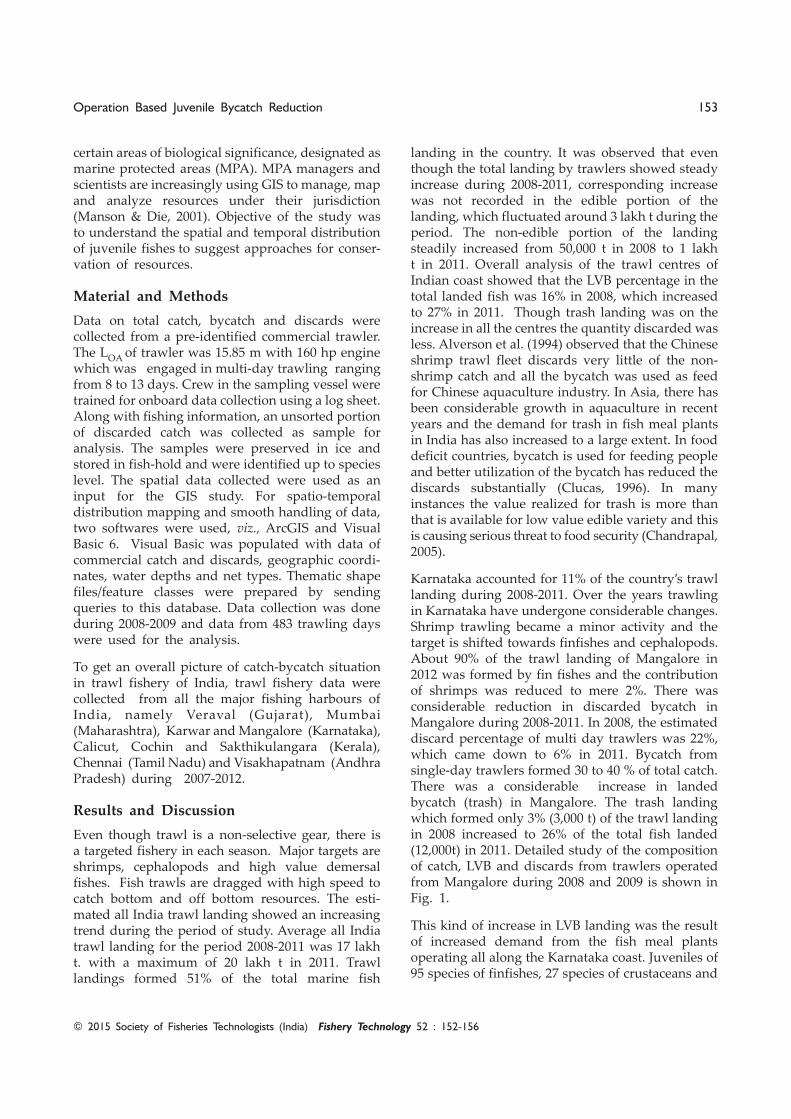
GIS mapping of the trawling grounds covered bytrawlers from Mangalore in 2008-2009 showed that,they operated from seas off Malabar and Konkancoast, Calicut in the south (75o E, 11oN) and to offRatnagiri in the north (73.5 o E to 17 o N) (Fig. 2).The depth of operation was between 5m and 167m.While analyzing the fishing operation for 2008-2009,most intensive trawling operations were observedin fishing grounds at 30m depth off Mangalore toPanaji, followed by fishing ground at 100 m depth
off Malpe to Karwar. Fishing ground at 30m depthoff Ratnagiri also has found to be fished withmoderate intensity. The present study reveals thatmost of the fishing operations are concentratedwithin the 150 m depth zone and extension wasmainly parallel to the shore, towards south or north.
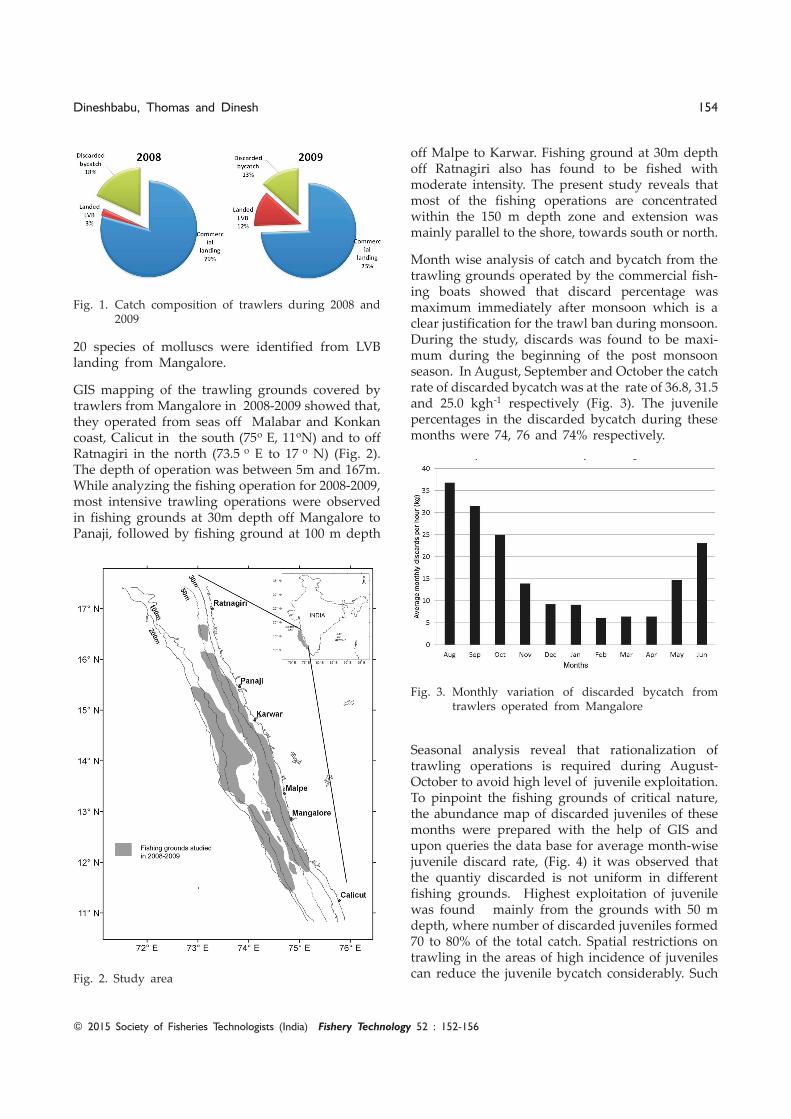
Month wise analysis of catch and bycatch from thetrawling grounds operated by the commercial fish-ing boats showed that discard percentage wasmaximum immediately after monsoon which is aclear justification for the trawl ban during monsoon.During the study, discards was found to be maxi-mum during the beginning of the post monsoonseason. In August, September and October the catchrate of discarded bycatch was at the rate of 36.8, 31.5and 25.0 kgh-1 respectively (Fig. 3). The juvenilepercentages in the discarded bycatch during thesemonths were 74, 76 and 74% respectively.
Fig. 1. Catch composition of trawlers during 2008 and2009
Fig. 2. Study area
Fig. 3. Monthly variation of discarded bycatch fromtrawlers operated from Mangalore
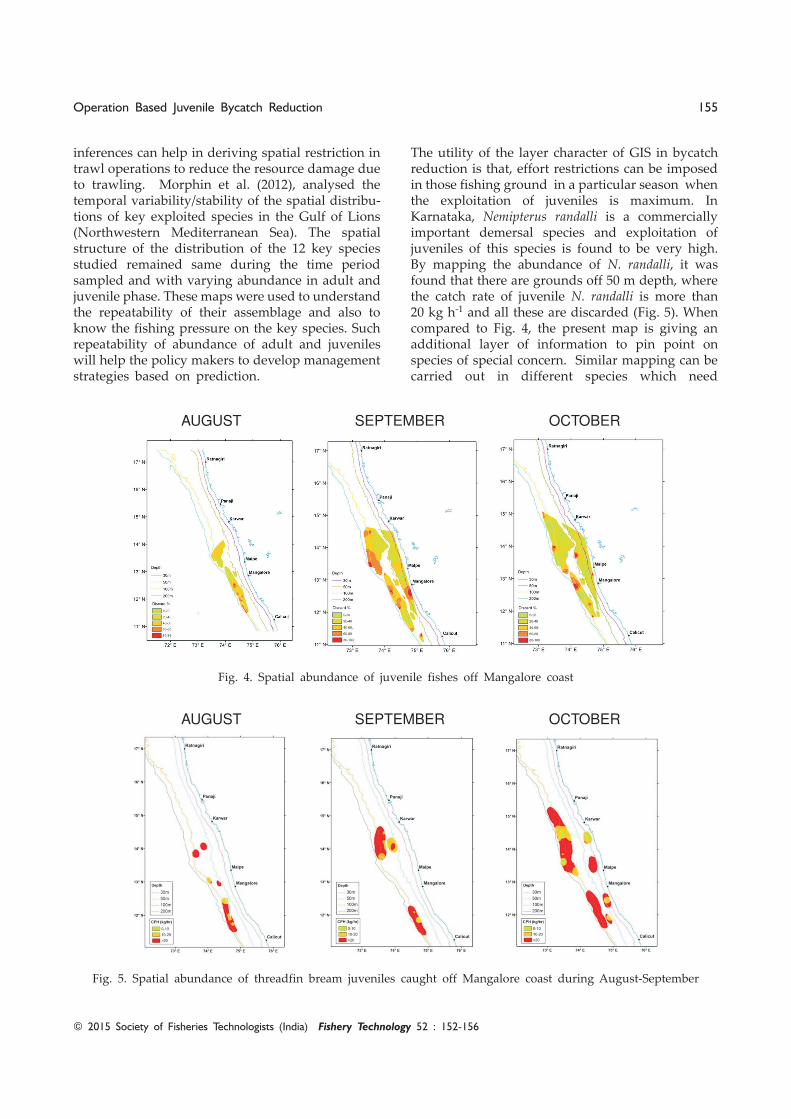
Seasonal analysis reveal that rationalization oftrawling operations is required during August-October to avoid high level of juvenile exploitation.To pinpoint the fishing grounds of critical nature,the abundance map of discarded juveniles of thesemonths were prepared with the help of GIS andupon queries the data base for average month-wisejuvenile discard rate, (Fig. 4) it was observed thatthe quantiy discarded is not uniform in differentfishing grounds. Highest exploitation of juvenilewas found mainly from the grounds with 50 mdepth, where number of discarded juveniles formed70 to 80% of the total catch. Spatial restrictions ontrawling in the areas of high incidence of juvenilescan reduce the juvenile bycatch considerably. Such
Dineshbabu, Thomas and Dinesh 154
© 2015 Society of Fisheries Technologists (India) Fishery Technology 52 : 152-156
inferences can help in deriving spatial restriction intrawl operations to reduce the resource damage dueto trawling. Morphin et al. (2012), analysed thetemporal variability/stability of the spatial distribu-tions of key exploited species in the Gulf of Lions(Northwestern Mediterranean Sea). The spatialstructure of the distribution of the 12 key speciesstudied remained same during the time periodsampled and with varying abundance in adult andjuvenile phase. These maps were used to understandthe repeatability of their assemblage and also toknow the fishing pressure on the key species. Suchrepeatability of abundance of adult and juvenileswill help the policy makers to develop managementstrategies based on prediction.
The utility of the layer character of GIS in bycatchreduction is that, effort restrictions can be imposedin those fishing ground in a particular season whenthe exploitation of juveniles is maximum. InKarnataka, Nemipterus randalli is a commerciallyimportant demersal species and exploitation ofjuveniles of this species is found to be very high.By mapping the abundance of N. randalli, it wasfound that there are grounds off 50 m depth, wherethe catch rate of juvenile N. randalli is more than20 kg h-1 and all these are discarded (Fig. 5). Whencompared to Fig. 4, the present map is giving anadditional layer of information to pin point onspecies of special concern. Similar mapping can becarried out in different species which need
Fig. 4. Spatial abundance of juvenile fishes off Mangalore coast
Fig. 5. Spatial abundance of threadfin bream juveniles caught off Mangalore coast during August-September
Operation Based Juvenile Bycatch Reduction 155
AUGUST SEPTEMBER OCTOBER
AUGUST SEPTEMBER OCTOBER
© 2015 Society of Fisheries Technologists (India) Fishery Technology 52 : 152-156

management intervention to sustain and improvetheir production. Using fishery stock assessmentprojection model (Thomson & Bell, 1934), and withless exploitation of juveniles better production inupcoming years was projected leading to bettereconomic return, (Dineshbabu & Radhakrishnan,2009, Dineshbabu et al., 2012). Further studies onthe juvenile abundance in these particular fishinggrounds will help in identification of critical fishingground where seasonal and spatial closure of trawlfishery can be implemented to improve fisheryproduction in the long run. Similarly spatio-temporal management of fisheries was suggested byDunn et al. (2011) in USA to reduce bycatch offinfish or protected species. They also found thatsuch measures are helpful in ecosystem-basedmanagement approaches. More fisheries can bemanaged through multispecies, multi-objectivemodels with spatial component.
The resource maps can be used as an excellent toolfor the policy makers to weigh each fishing groundin terms of commercial value and juvenile abun-dance so that the policy decisions match groundreality. Illustrated maps with seasonal and fishingground wise distribution of juveniles and commer-cial fishes will help as a useful tool in awarenessprograms to extend the research findings to thestake holders.
Acknowledgements
The authors are thankful to Dr. G. Syda Rao, Director,Central Marine Fisheries Research Institute, Cochin forhis constant encouragement, support and valuablesuggestions. The co-operation and help provided by thefishing community of Mangalore especially the ownerand crew of trawler group “Harikripa” from MangaloreFisheries Harbour is acknowledged with gratitude. Thetechnical assistance provided by Shri. B. Sridhara, Shri.S. Kemparaju, Shri. G. Nataraj and Shri. Y. Muniyappaof Mangalore Research Centre of CMFRI and Softwaresupport provided by Miss. Shwethal and Miss. Shylaja,Research Scholars are also thankfully acknowledged.
References
Alverson, D.L., Freeberg, M.H., Pope, J.G. and Murawski,S.A. (1994) A global assessment of fisheries bycatchand discard. FAO Fish. Tech. Pap. 339: 233p
Boopendranath, M. R. (2007) Possibilities of bycatchreduction from Trawlers in India. In: Indian Fisheriesan Progressive Outlook. Central Marine FisheriesResearch Institute, Kochi, pp 12-29
Caddy, J. F. and Carocci, F. (1999) The Spatial Allocationof Fishing Intensity byport-based inshore fleets: a GISapplication. ICES J. Mar. Sci. 56(3): 388-403
Chandrapal, G.D. (2005) Status of trash fish utilizationand fish feed requirements in aquaculture-India.Paper presented at the regional workshop on lowvalue and trash fish in the Asia-Pacific region. Hanoi,Vietnam 7-9 June 2005
Clucas, I.A. (1996) Study of the options for utilization ofbycatch and discard from marine capture fisheries,FAO Fisheries Circular No.928, Rome, FAO, 59p
Dineshbabu A. P. and E. V. Radhakrishnan (2009) Trawlfishery of juvenile fishes along Mangalore-MalpeCoast of Karnataka and its impact on fish stock. AsianFish. Sci. 22(2): 491-500
Dineshbabu, A. P., Muthaiah, C., Geetha Sasikumar,Prathibha Rohit and Uma. S. Bhat (2012) Impact ofnon-selective gears on king seer, Scomberomoruscommerson fishery in Karnataka. Indian J. Geo-Mar.Sci. 41(3): 265-271
Dineshbabu, A.P., Thomas, S. and Vivekanandan, E. (2014) Assessment of low value bycatch and itsapplication for management of trawl fisheries. J. Mar.Biol. Ass. India, 56(1): 103-108
Dunn, D. C., A. M. Boustany and Halpin, P. N. (2011)Spatio-temporal management of fisheries to reduceby-catch and increase fishing selectivity. Fish Fish. 12:110-119
Eayrs, S. (2005) A guide to bycatch reduction in tropicalshrimp trawl Fisheries, FAO, Rome 110p
FAO (2010) Catch concepts: Diagrammatic Presentation ,FAO Yearbook: Fishery and Aquaculture Statistics2008. FAO, Rome: 96p
Manson, F.J. and Die, D.J. (2001) Incorporating Commer-cial Fishery Information into the Design of MarineProtected Areas. Ocean and Coastal Management, 44:517-530
Morfin, M., Fromentin J. M., Jadaud, A. and Bez, N. (2012)Spatio-Temporal Patterns of Key Exploited MarineSpecies in the Northwestern Mediterranean Sea. PLoSONE 7(5): e37907. doi:10.1371/journal.pone.0037907
Pravin. P., Gibinkumar, T. R., Sabu, S. and Boopendranath,M.R. (2011) Hard bycatch reduction devices forbottom trawls: A review. Fish. Technol. 48(2): 107-118
St. Martin, K. (2004) “GIS in Marine Fisheries Science andDecision Making,” in Geographic Information Sys-tems in Fisheries (W. L. Fisher and Rahel, F. J., Eds),Am. Fish. Soc. pp 237-258
Thompson W.F. and Bell, F. H. (1934) Biological statisticsof the pacific halibut fishery 2. Effect of changes inintensity upon total yield and yield per unit of gear.Rep. Int. Fish. (Pacific Halibut) Comm. 8: 48 p
Dineshbabu, Thomas and Dinesh 156
© 2015 Society of Fisheries Technologists (India) Fishery Technology 52 : 152-156