gis based planning for finding optimal gas pipeline route...
TRANSCRIPT

* Corresponding Author. Tel.: +9411149251, +919548469322, Mailing Address: DG-26 Jawahar Bhawan IIT Roorkee, Roorkee Uttrakhand- 247667
Name of the Presenter: Avinash Kumar
Paper Reference Number: PN-131
GIS based planning for finding optimal gas pipeline route in IITR campus
Avinash Kumar a, Dr. /Prof. S.K. Ghosh b, Dr. Mili Ghosh c, Kishore Kumar a & Siddhartha Khare a , Pradeep Chaudhry a
a Department of Civil Engineering, IIT Roorkee [email protected]
b Department of Civil Engineering, IIT Roorkee [email protected]
c Department of Remote Sensing, BIT Mesra, Ranchi [email protected]
GIS provides a large number and a variety of analytical functions that are capable of replacing manual and traditional methods of route planning. It is a powerful tool to integrate thematic layers in an automated environment to compute possible shortest route with associated costs which eventually can reduce the cost and time of project execution and hence the operating expenses. Planning for the optimum route requires an extensive evaluation process to identify the best possible path. This path must comply with the requirements of the user in terms of safety and cost. With the fast development environment in gas industry, and with the increase in consumption of these products, the need for an optimum route becomes more important as this can reduce a huge operational cost. In this case study we are considering IIT Roorkee campus for gas pipeline planning. This study incorporates the georeferencing of the scanned image, digitization of vector layers, database development and route network analysis to find out the best possible route for laying pipeline in the campus area.
1. Introduction GIS is a science and technology which combines different data from various sources for route design processes through spatial analysis. The present study was initiated to demonstrate the use

of various data from different sources and geospatial information system (GIS) analysis for developing a path way for gas pipeline in IIT Roorkee campus. Pipelines are the most efficient, cost effective and environment friendly means of gas transport. Careful and intelligent planning of the pipeline route can save on cost, time and other several expenses to ensure longer operational life. Proper planning and management are considered essential means of guiding and accelerating the development.
The purpose of the establishment of the gas pipeline is to strengthen the operation and management of gas network and affiliated facilities in IITR campus, to solve traditional backward mode of artificial management and to promote the informationization construction process through systematic construction and application.
1.1 Data collection and processing Data is the life of GIS, and the function of GIS is nothing if there is no data input. The data of the gas pipeline GIS include the basic geographical data, the measurement data, attribute data, pipeline metadata. For the drawing function of gas network and facilities, the GIS offers external importing tools for a variety of graphical data, providing flexible, convenient, and powerful functions for graph editing and processing; The pipeline attribute information can easily be input and managed through strong editing and operating functions to attribute data, absolutely ensuring that pipeline and facilities are corresponding to the related attribute information. The quality of all pipeline data must be detected before entering database, including the logical consistency and integrity of gas network data and labeled data. Data that not satisfy the requirements are sent back to modify, ensuring the correct data enter into the database. Seamless combination of graphics ensures that map accuracy meets requirements and the output is of high quality.
1.2 Data organization and storage Gas pipeline is having spatial data and attribute data. Spatial data refers to the location of geographical entities and relationship amongst them, which includes geographic data, measurement data of pipeline. Attribute data includes form data, documents data, multimedia data and so on. The relations between spatial data and corresponding attribute data are linked through the keyword ID. Data is stored in layer so as to be convenient for update, maintenance and management. When layered, geometric characteristic symbols (such as points, lines, surfaces) and special type should be considered in a comprehensive way, so that data of each layer having the same geometric characteristic symbols and the same attributes compositions.. According to surface elements, basic geographic data can be divided into residential buildings, public buildings, sport complex, general utilities, and educational departments.
1.3 Pipeline The pipelines shall be designed in a manner that ensures adequate public safety under all conditions likely to be encountered and to withstand all installation, testing and operating conditions/loads. All necessary calculations shall be carried out to verify structural integrity and stability of the pipeline for combined effect of pressure, temperature, soil-pipe interaction, external loads and other environmental parameters as applicable. Such calculations
Buoyancy control and stability analysis for pipeline section to be installed.
Pipeline expansion/contraction and its effect on station piping.
Evaluation of potential for earthquake occurrence along pipeline route and carrying out requisite seismic analysis to ensure safety and integrity of the pipeline system.
The pipelines shall be normally designed for an assumed economic design life of 30 years. The pipelines are designed for the following operating temperature 1imits:

above ground: 65°C maximum and –28°C minimum
below ground: 60”C maximum and –28°C minimum
1.4 Clearance between pipelines/mains and other ground structures A clearance of at least 150 mm shall be provided between a buried pipeline and other underground structure not used in conjunction with the pipeline. Wherever such-clearance cannot be provided, adequate precautions to protect the pipeline by means of casing, bridging, or insulating material shall be ensured. In laying parallel pipelines in the same trench, the minimum clear distance between the pipelines shall be 500 mm. The ‘location of a new underground pipeline, when running parallel to an existing underground pipeline shall beat a minimum clear distance of 5 m. Wherever such clearances cannot be provided, adequate precautions to protect the pipelines by means of casing or insulating material shall be ensured.
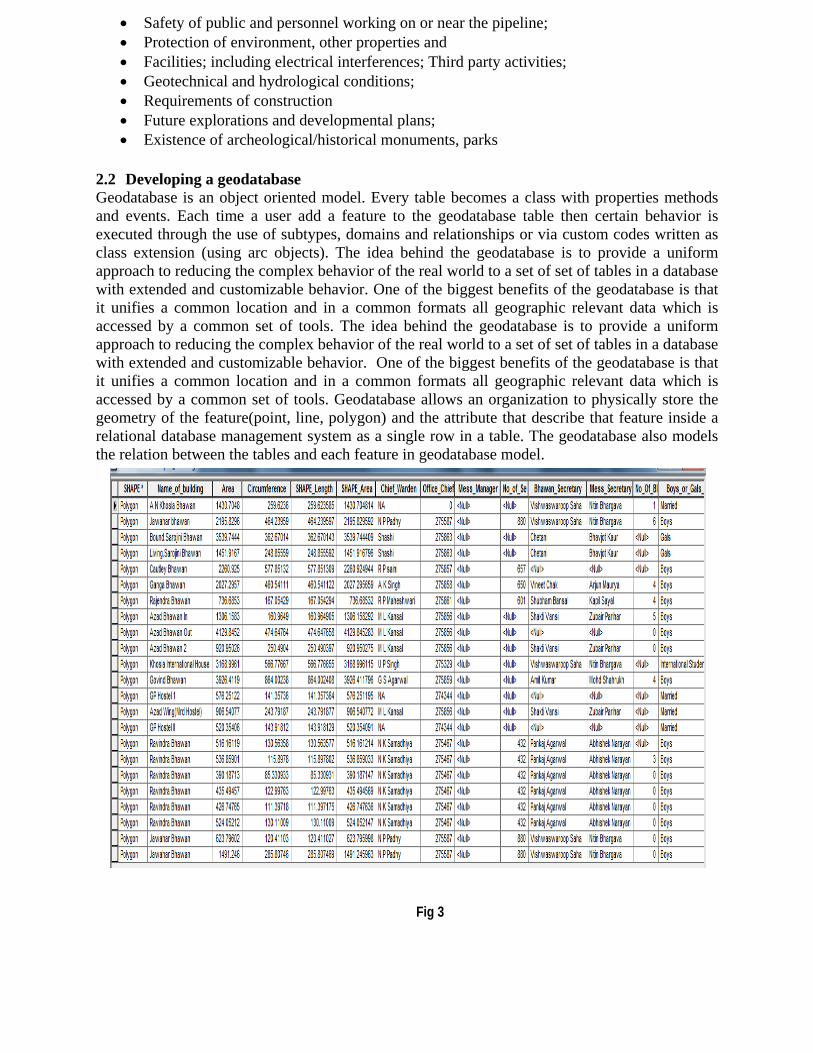
2. Approach and methodology The basic approach for gas pipeline route network analysis in IIT Roorkee campus was to get the campus area map, georeferencing of the map and after that digitization is completed for the area. Various features were drawn with the help of drawing tool such as campus buildings, departments, residential areas, road network. Several layers are defined. Attributes are assigned to each feature in the map which collected by field inspection and manually. These data includes the information about all the features drawn on the map such as the for the hostels, information about its physical area, perimeter, warden name, office telephone no., mess manger, no. of storey, girls/boys hostel. The geodatabase table can be edited furthermore and new information can be added or removed. The idea behind the geodatabase is to provide a uniform approach to reducing the complex behavior of the real world to a set of set of tables in a database with extended and customizable behavior In this case study the map which is used is made in year 1998, since then many new constructions have been developed in campus area. For accurate planning of gas pipeline we need to have information about those features. These features can be included with the help of google earth and ET geo wizard software. With the help of google earth new features can be digitized online and added through ET geo wizard. For example Rajiv Gandhi bhawan, new Kasturba and Radhakrishnan bhawan were initially not present in the map area. So these new constructions are imported through Google earth into the map. Because the map is georeferenced so these got the accurate positions on the map. All the layers are merged into one, so the criteria regarding the gas pipeline can be considered. In this case study we have developed three different layers of the pipeline, first one is the main pipeline which has the highest width and second which is the sub part of the main line, has somewhat low width, third pipeline has the lowest width to supply the gas in remote and inaccessible areas of the campus. While planning the gas pipeline route all the criteria has to be considered very carefully

Figure 1 Digitization of campus hostels
Figure 2 Digitization of campus residential area
2.1 Route selection Route selection shall take into account the design, construction, operation and maintenance of the pipeline taking the following into consideration:
Safety of public and personnel working on or near the pipeline;
Protection of environment, other properties and
Facilities; including electrical interferences; Third party activities;
Geotechnical and hydrological conditions;
Requirements of construction
Future explorations and developmental plans;
Existence of archeological/historical monuments, parks
2.2 Developing a geodatabase Geodatabase is an object oriented model. Every table becomes a class with properties methods and events. Each time a user add a feature to the geodatabase table then certain behavior is executed through the use of subtypes, domains and relationships or via custom codes written as class extension (using arc objects). The idea behind the geodatabase is to provide a uniform approach to reducing the complex behavior of the real world to a set of set of tables in a database with extended and customizable behavior. One of the biggest benefits of the geodatabase is that it unifies a common location and in a common formats all geographic relevant data which is accessed by a common set of tools. The idea behind the geodatabase is to provide a uniform approach to reducing the complex behavior of the real world to a set of set of tables in a database with extended and customizable behavior. One of the biggest benefits of the geodatabase is that it unifies a common location and in a common formats all geographic relevant data which is accessed by a common set of tools. Geodatabase allows an organization to physically store the geometry of the feature(point, line, polygon) and the attribute that describe that feature inside a relational database management system as a single row in a table. The geodatabase also models the relation between the tables and each feature in geodatabase model.
Fig 3
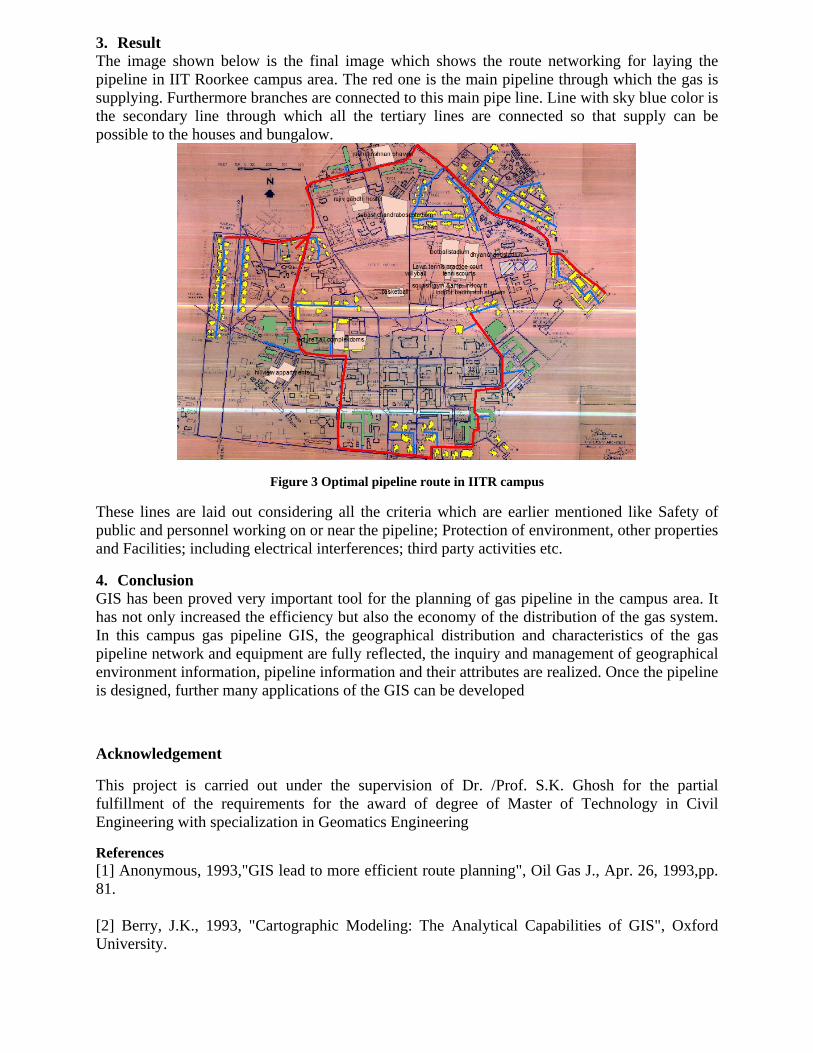
3. Result The image shown below is the final image which shows the route networking for laying the pipeline in IIT Roorkee campus area. The red one is the main pipeline through which the gas is supplying. Furthermore branches are connected to this main pipe line. Line with sky blue color is the secondary line through which all the tertiary lines are connected so that supply can be possible to the houses and bungalow.
Figure 3 Optimal pipeline route in IITR campus
These lines are laid out considering all the criteria which are earlier mentioned like Safety of public and personnel working on or near the pipeline; Protection of environment, other properties and Facilities; including electrical interferences; third party activities etc.
4. Conclusion GIS has been proved very important tool for the planning of gas pipeline in the campus area. It has not only increased the efficiency but also the economy of the distribution of the gas system. In this campus gas pipeline GIS, the geographical distribution and characteristics of the gas pipeline network and equipment are fully reflected, the inquiry and management of geographical environment information, pipeline information and their attributes are realized. Once the pipeline is designed, further many applications of the GIS can be developed
Acknowledgement
This project is carried out under the supervision of Dr. /Prof. S.K. Ghosh for the partial fulfillment of the requirements for the award of degree of Master of Technology in Civil Engineering with specialization in Geomatics Engineering
References [1] Anonymous, 1993,"GIS lead to more efficient route planning", Oil Gas J., Apr. 26, 1993,pp. 81.
[2] Berry, J.K., 1993, "Cartographic Modeling: The Analytical Capabilities of GIS", Oxford University.

[3] DeMers, M., 2002,"GIS Modeling in Raster”, New Mexico University, John Wily & Sons Inc.
[4] Douglas, D.H., 1994, "Least cost path in GIS Using accumulated cost surface and slope lines", Cartographica, Vol. 31, No. 3, pp. 37-51.
[5] Hicken, J. and Krumbach,Y., 1998, "Use of high resolution remote sensing for route selection", Environmental Remote Sensing Centre, University of Wisconsin Madison, Series ARC-UWM-004-97.
[6] Montemurro, D. and Gale, T., 1996,"GIS-based process helps TransCanada select best route for expansion line", Calgary, June 22, Oil & Gas Journal pp. 63-71.
[7] Naghibi, F., 2002, "Application GIS in Petroleum Industry", M.Sc. Research Seminar, Dept. of Surveying and Geomatics Eng., Eng. Faculty, University of Tehran.
[8] Shafiee, S., 2000, "Evaluation of Usabilities of Raster-Based GIS for Optimum Path Determination", MSc. Thesis, Dept. of Surveying and Geomatics Eng., Eng. Faculty University of Tehran.
[9] Sarkka, P. and Esko, L., 1999,"Optimal routing of pipeline", Helsinki, University of Technology, GIM, 6 Feb, pp. 6-9.
[10] Stefanakis, E. and Kavouras, M., 1995, "Determination of the Optimum Path on the Earth Surface", European Conference on Spatial Information Theory: A Theoretical Basis for GIS, Springer-Verlag, pp. 241-257
[11] Song Guiping, Bai Lianming, Chu Qiang,. Construction and Application of Gas Geographic Information System. Gas&Heat, 2010,30(2): B33~B36 (in Chinese)
[12] Zhang Dongmei, Wei Tongzhou. Realizing Interactive Control of Graphical Display on Web Browser. Journal of Shandong University of Architecture and Engineering, 2004,19(2):14~16 (in Chinese)
[13] Mo Shanjun, Feng Qimin, Wu Qinmin. Technology Implementation of The Valve-Turnoff Analysis for Gas Pipeline Network Accident in Arc Info Platform. Computer Applications and Software, 2007,24(2): 91~94 (in Chinese)
Web references http://webhelp.esri.com/arcgisserver/9.3/dotnet/index.htm#tutorial_na_service.htm
http://www.ipcc.ch
http://www.iangv.org
http://www.unep.org/geo
http://en.wikipedia.org
Brief Biography
Education Master of Technology at Indian Institute of Technology, Roorkee. From 2010 to current; Geomatics Engineering. Bachelor of Engineering at M.M.M Engineering College, Gorakhpur From 2006to2010; Electrical Engineering
Proficiency ArcGIS, Total Station Survey, Hand-held GPS Mapping.
Research Interests GIS, Remote Sensing
Languages Known English, Hindi