gis-based land suitability analysis integrating multi-criteria evaluation for the allocation of...
TRANSCRIPT

ORIGINAL ARTICLE
GIS-based land suitability analysis integrating multi-criteriaevaluation for the allocation of potential pollution sources
Ingrida Bagdanaviciut _e • Jurijus Valiunas
Received: 1 September 2011 / Accepted: 23 July 2012 / Published online: 12 August 2012
� Springer-Verlag 2012
Abstract The geological environment has been heavily
polluted by chemical substances over the past few decades.
Pollution sources located on the earth’s surface or under-
ground have affected the quality of the environment. A
significant amount of impact could be reduced if the allo-
cation of potential pollution sources was based on an
evaluation of environmental conditions. The main objec-
tive of this study was to develop a methodology for the
allocation of potential pollution sources by employing GIS
and multi-criteria evaluation techniques. This methodology
was applied to a study area located in the eastern part of
Lithuania. A GIS-based land suitability analysis was per-
formed after identifying 16 factors concerning the geo-
logical and socio-economic environment, which were
important for environmental protection, land use and spa-
tial planning. The environmental and socio-economic fac-
tors were divided into eliminating and limiting criteria.
Criteria maps based on the selected factors were compiled.
Areas delineated by eliminating criteria were identified as
unsuitable for development (according to national legisla-
tion). Limiting criteria were evaluated according to the
suitability level, which were determined in this study
considering the principles of sustainable development. The
relative importance of each criterion was assessed utilising
the Analytical Hierarchy Process (AHP). A land suitability
index (LSI) was calculated and the final result of the land
suitability analysis was summarized in three suitability
maps (environmental, socio-economic and composite).
Four suitability classes (unsuitable, least, moderately and
most suitable) for the allocation of potential pollution
sources in the study area were used, and the nine most
suitable candidate sites were selected according to the
proposed methodology.
Keywords Geological environment � Potential pollution
sources � Land suitability analysis � Multi-criteria
evaluation � AHP � GIS
Introduction
The geological environment, as an integral part of the
biosphere, has a direct impact on the human living envi-
ronment. On the other hand, the geological environment is
significantly affected by human activity. The geological
environment (soil, surface water and groundwater) has
been heavily polluted by chemical substances over the past
few decades (Juodkazis et al. 1998). Pollution sources
located on the earth’s surface or underground have affected
the quality of the environment, particularly the ground-
water, which is the main water supply source in Lithuania.
A significant amount of impact could be reduced if the
allocation of potential pollution sources was based on an
evaluation of the environmental conditions. An evaluation
of the geological environment typically considers the
principles of environmental protection and land use, which
are integrated into the concept of sustainable development
(WCED 1987; NSSD 2003). Sustainability principles are
important for the regulation of human activity, optimal use
of geological resources and the reduction of environmental
I. Bagdanaviciut _e (&)
Coastal Research and Planning Institute, Klaip _eda University,
H. Manto 84, 92294 Klaip _eda, Lithuania
e-mail: [email protected]; [email protected]
I. Bagdanaviciut _e � J. Valiunas
Institute of Geology and Geography, Nature Research Centre,
Sevcenkos 13, 03223 Vilnius, Lithuania
e-mail: [email protected]
123
Environ Earth Sci (2013) 68:1797–1812
DOI 10.1007/s12665-012-1869-7

impact. The application of sustainability principles requires
defining favourable and limiting factors concerning the
geological environment along with the development of
approaches for the evaluation and integration of complex
geological information into the land-use planning process.
The main objective of this study was to develop a
methodology of environmental evaluation for the alloca-
tion of potential pollution sources (permanent or tempo-
rary) employing GIS and multi-criteria evaluation
techniques and to also apply it to a study area located in the
eastern part of Lithuania.
The sources of environmental pollution are analysed in
terms of economic activity (industry, agriculture), the
accumulation of pollutants (landfills, repositories, farms)
and the type of pollutants (industrial, building materials)
(Juodkazis et al. 1998). In this study, pollution sources
were treated as the accumulation of pollutants (liquid and
solid waste landfills, repositories, farms, etc.). The largest
and most risky pollution sources are liquid and solid waste
landfills. Their negative impact on the environment has
been well investigated and described (Diliunas et al. 2004)
and is regulated by national and EU legislation (MERL
2000; Council Directive on the Landfill of Waste (99/31/
EC)).
During the past few decades, most of environmental
data were arranged in a map form that makes GIS one of
the best analytical tools to analyse environmental infor-
mation (Weerakoon 2002). Land suitability analysis
advanced by McHarg (1969) has, over the past 40 years,
become accepted as one of the most comprehensive
approaches in land use planning. Its basic purpose is to
determine the suitability of a given area for a particular
use (Murphy 2005). Multi-criteria Decision Making
(MCDM) methods were introduced to extend GIS ana-
lysing capabilities since MCDM methods are capable of
dealing with heterogeneous criteria that are both qualita-
tive and quantitative in nature (Jankowski 1995;
Malczewski 1999, 2004). MCDM integrated with GIS is
widely used for land suitability analysis (Siddiqui et al.
1996; Weerakoon 2002; Kontos et al. 2005; Simsek et al.
2006; Sener et al. 2006, 2010; Lamelas et al. 2007;
Delgado et al. 2008).
The present study describes environmental evaluation
methodology that was developed for the allocation of
potential pollution sources employing GIS-based land
suitability analysis and multi-criteria evaluation. Initially,
EU and national legislation regulating the establishment of
potential pollution sources (landfills) was analysed. GIS
was employed for data acquisition and analysis. GIS-based
land suitability analysis was performed after setting the
specific factors of the geological and socio-economic
environment which were important for environmental
protection, including land use and spatial planning.
Selected environmental and socio-economic factors were
divided into eliminating and limiting criteria. An area
delineated by eliminating criteria was identified as
unsuitable for development (according to national legisla-
tion and practical guidelines). Limiting criteria were eval-
uated according to the suitability conditions and their
scoring, which were determined considering the principles
of sustainable development. The relative importance of
selected factors was estimated using the Analytical Hier-
archy Process (AHP). The final result of the land suitability
analysis was compiled in three suitability maps for the
allocation of potential pollution sources in the study region.
Environmental and socio-economic factors were evaluated
separately using two different scenarios based either on
environmental or socio-economic factors. A final overall
suitability map for the allocation of the potential pollution
sources was compiled combining the output maps of the
two scenarios.
Study area
The methodology of the environmental evaluation was
applied to the Ignalina municipality located in the eastern
part of Lithuania (Fig. 1). The municipality has an area of
1,496 km2, the lowest population density in Lithuania
(13.4 inhabitants per sq.km) and a relatively high forestry
level (32.2 % of the total municipality area).
From a geological-tectonic point of view, the Ignalina
municipality is situated at a juncture of the Baltic Synec-
lise, Masurian-Belorussian anteclise and the Latvian saddle
(Valiunas et al. 2000). The crystalline basement and sedi-
mentary rock cover are faulted. The area is underlain by
Quaternary deposits of 90–120 m in average thickness,
ranging from 70 m in the south to 250 m along the buried
valleys. The system of Quaternary sediments has accu-
mulated large resources of fresh groundwater which are
widely used for the water supply. Surface sediments and
the relief of the study area were formed by glaciers and
their meltwaters. Glacial (till, sandy loam) and glacioflu-
vial (various grained sand with gravel) sediments are
predominant and widespread.
The groundwater resources extracted from the
Quaternary aquifers are the most widely used for both
centralized and individual water supplies in the study
area. Two centralized water supply well fields are located
in municipality area; the third one—Visaginas wellfield—
is located outside the municipality border, but its pro-
tection zone extends to the northern part of the munici-
pality. The predominant depth of the shallow groundwater
varies from 2 to 4 m, and is most often used for indi-
vidual water supply. Quaternary aquifers lying at different
depths (10–100 m) are mostly exploitable. Some
1798 Environ Earth Sci (2013) 68:1797–1812
123

individual wells in the central, north-western and western
parts of the study area are exploiting the Upper Devonian
terrigeneous aquifer.
According to the database of pollution sources of Lith-
uania (Sugalskien _e and Kanopien _e 2002) 224 pollution
sources were inventoried in the study area and classified
into three main groups: cattle breeding objects (86),
accumulation of pollutants (77, incl. 22 landfills) and
industrial objects (61). Since the landfills did not meet the
legal requirements of EU and national legislation, they
were closed during the past few years and waste is cur-
rently being transported outside the municipality.
Materials and methods
In this study, we use land suitability analysis integrating
GIS and MCDM methods to determine the optimum site
location for potential pollution sources. The aim of the land
suitability analysis is to determine the optimum site loca-
tion for certain types of activities while minimizing the
negative impact on the environment (Murphy 2005).
The methodology consists of the following steps:
1. Identification of factors having a significant effect on
land suitability for potential pollution sources and
development of a GIS database which includes spatial
information on the identified factors.
2. Reclassification of initial data to compile criteria maps
for further land suitability analysis.
3. Determination of a suitability level and scoring scale
based on principles of sustainable development and the
evaluation of criteria suitability.
4. Application of an analytic hierarchy process (AHP)
method for the assessment of the relative importance
(weights) of the criteria and sub-criteria.
5. Application of a simple additive weighting (SAW)
method for estimation of the land suitability index
(LSI).
6. Evaluation of land suitability according to environ-
mental and socio-economic criteria. Reclassification of
the LSI into land suitability classes and their repre-
sentation on land suitability maps.
7. Selection and evaluation of alternative sites.
The land suitability approach developed and used in this
study is demonstrated in the workflow scheme (Fig. 2).
Only those environmental and socio-economic factors
which were directly or indirectly related to the considered
economic activity were selected during the factor identifi-
cation process. Maplnfo 6.5 and ArcGIS 9.2 software were
used for data collection, conversion and analysis. Sixteen
Fig. 1 Location map of the study area
Environ Earth Sci (2013) 68:1797–1812 1799
123

input data layers were collected, representing information
on the geology, hydrogeology, hydrology and morphology
of the study area, as well as the social and economic
aspects of the considered activity, and were all integrated
into the GIS-based land suitability analysis. Data reclassi-
fication and objects’ buffering were performed to compile
the criteria maps.
The land suitability analysis required environmental and
socio-economic factors to be divided into eliminating and
limiting criteria. An area defined by eliminating criteria
was recognized as unsuitable for development according
to national legislation. Consequently, eliminating criteria
were excluded from further multi-criteria evaluation pro-
cess. An additional suitability evaluation was carried out on
the limiting criteria since their components had different
impacts on the natural environment. Each criteria map was
evaluated according to the suitability scale as determined in
respect to the land use being considered.
Multi-criteria evaluation has been performed employ-
ing EXPERT CHOICE software based on the AHP (Saaty
1980, 1996). AHP was applied to derive the relative
weights for a set of criteria and was based on three
principles: decomposition, comparative judgment and the
synthesis of priorities. The decomposition principle
requires a decision problem to be decomposed into a
hierarchy that captures the essential elements of a deci-
sion problem. By breaking down the problem into levels,
the decision maker can focus on smaller sets of decisions.
The principle of comparative judgment requires the
assessment of pairwise comparison presented in a ratio
matrix. The weights of the criteria were determined by
normalizing the eigenvector associated with the maximum
eigenvalue of the reciprocal ratio matrix (Malczewski
1999). The method employs an underlying scale with
values from 1 to 9 to rate the relative preferences of two
criteria (Table 1).
The AHP method includes a consistency ratio (CR)
index which indicates consistency of the judgments:
CR ¼ CI
RIð1Þ
where RI is random consistency index and CI the
consistency index defined as follows:
CI ¼ kmax � n
n� 1ð2Þ
where kmax is the maximum eigenvalue of the matrix and
n the number of compared elements.
Consistency ratio index values C0.10 indicate an ade-
quate evaluation of criteria and acceptable results, whereas
CR index \0.10 denotes the inconsistent judgment of a
matrix (Saaty 1980). In cases of inconsistency, the original
values in the pairwise comparison matrix have to be
revised. AHP comparative weights were integrated into
criteria maps as additional attribute data.
The SAW method was used to estimate the LSI
according to the following formula:
Vi ¼Xn
j¼1
wj � vij ð3Þ
where Vi is the suitability index for a given area i; wj is the
weight of criterion j; vij is the suitability score of area
i under criterion j and n is the total number of criteria.
Three suitability maps were compiled as the final output
of the land suitability analysis.
Fig. 2 Workflow of the land suitability analysis
1800 Environ Earth Sci (2013) 68:1797–1812
123

Results
Suitability conditions were determined and scoring per-
formed for the evaluation of factors’ suitability according
to the principles listed in Table 2. Environmental and
socio-economic factors were evaluated according to the
proposed suitability conditions and ranked by suitability
scores to compile two suitability maps. Environmental
factors were classified into the four following groups:
geological, hydrological/hydrogeological, morphological
and nature conservation (Table 3).
Geological criteria comprise two sub-criteria: top
soil vulnerability to pollution and surface sediments
permeability.
Top soil pollution potential. Soil composition deter-
mines the soil pollution potential to chemical pollution.
Higher amounts of clay particles in the soil increase
accumulation of heavy metals (Pb, Cd, Sn, etc.), which in
turn may have a negative impact on the environment.
According to the Lithuanian hygiene standard (MHRL
2003) sand/sandy loam were defined as soil of low pollu-
tion potential, whereas heavy loam/light clay and heavy
clay were defined as soils of moderate and high pollution
potential, respectively. A soil map (scale 1:300,000)
(Juodis and Jasinskas 1998) of the study area was reclas-
sified into three soil pollution potential classes (Fig. 3a)
determined by the Lithuanian hygiene standard (MHRL
2003) and evaluated according to the suitability scale
(Table 3). Soils of low pollution potential (clay particles
\30 %) were considered to be the most suitable for
potential pollution source location, while soils of high
pollution potential (clay particles[65 %) were considered
to be the least suitable.
Surface sediments permeability. The vulnerability of the
groundwater depends on the presence of a geological barrier
which can control the vertical movement of pollutants to the
groundwater level. The main requirement for a geological
barrier is low permeability (Dorhofer and Siebert 1997),
which depends on the genesis and lithological character of
the uppermost Quaternary deposits. The quaternary sedi-
ments of the study area (map scale 1: 50,000, Valiunas et al.
2000) were reclassified into four groups according to the
relative permeability described by hydraulic conductivity
(Holman et al. 2000) (Table 3; Fig. 3b). According to the
results published in different studies (Dobkevicius et al.
1995; Baltrunas et al. 1998; Holman et al. 2000), gravel and
gravelly sand are characterized by a very high permeability
(hydraulic conductivity [400 cm/day), whereas various
sand, silt/peat and glacial till/clay are defined by high
(100–400 cm/day), moderate (1–100 cm/day) and low
permeability (\1 cm/day), respectively. Various sands of
high and very high permeability were assessed as the least
suitable for the allocation of potential pollution sources,
while silt, till and clay of moderate and low permeability
were assumed to be the most suitable.
Hydrological/hydrogeological criteria comprise three
sub-criteria: shallow groundwater vulnerability, ground-
water sources and surface water protection.
Table 1 Scale for pairwise comparisons (Saaty 1980)
Intensity of importance Definition
1 Equal importance
2 Equal to moderate importance
3 Moderate importance
4 Moderate to strong importance
5 Strong importance
6 Strong to very strong importance
7 Very strong importance
8 Very to extreme importance
9 Extreme importance
Table 2 Suitability conditions and scoring of the environmental and socio-economic factors
Suitability
level
Suitability
score (vij)
Evaluation criteria
Environmental protection Economic Social
Most
suitable
2 No impact on the natural
environment
Natural resources are directly used for their
intended function and do not require
investments
No impact on the human living
environment and human health
Moderately
suitable
1 Slight impact on the natural
environment
Natural conditions require little investments
for the intended functions
Slight impact on the human
living environment and human
health
Least
suitable
-2 Significant impact the on
natural environment
Require large investments to assimilate the
area for the intended function and neutralize
the negative impact on the environment
Significant impact on the human
living environment and human
health
Unsuitable 0 Considerable impact on the
natural environment;
economic activity is not
recommended
Considerable economic losses is possible Considerable impact on the
human living environment;
health issues and risks for
humans
Environ Earth Sci (2013) 68:1797–1812 1801
123

Shallow groundwater vulnerability depends on the litho-
logical composition of the vadose zone and groundwater
depth. According to the methodology of a groundwater vul-
nerability assessment approved by a Geological survey of
Lithuania (Kanopien_e and Marcinkevicius 1995), the vul-
nerability of shallow groundwater is characterized by the time
of moisture migration to the groundwater level. A shallow
groundwater vulnerability map (scale 1:200,000) was reclas-
sified into three vulnerability classes according to the migra-
tion time of pollutants to the groundwater table (Kanopien_e
et al. 2004) (Table 3; Fig. 3c). Since shallow groundwater is
not protected from surface pollution throughout the entire
territory of Lithuania, only conditional categories of vulner-
ability are defined. A suitability classification of the migration
time of pollutants is provided in Table 3.
Protection of groundwater sources. Potential pollution
sources should not be located in approved wellfield pro-
tection zones and must not be adjacent to any groundwater
source, such as springs or groundwater wells since the
protection of exploited resources is essential for the pro-
tection of groundwater (GRL 2012). Two approved well-
field protection zones were considered as eliminating
criteria for the allocation of potential pollution sources
according to the legal requirements (Table 3; Fig. 3d).
Nevertheless, the Visaginas wellfield is located outside the
study area, but its protection zone extends to the northern
part of the municipality and was therefore taken into
consideration.
Protection of surface water The allocation of potential
pollution sources is prohibited in the buffer zones of lakes
Table 3 Environmental criteria integrated in the land suitability analysis and its suitability evaluation
Criteria Sub-criteria Component Attribute Suitability
conditions
Suitability
score (vij)
Environmental Geological
Top soil pollution
potential
High Mid-heavy clay, heavy clay LS -2
Moderate Mid-heavy loam, heavy loam, light clay MS 1
Low Sand, sandy loam, sandy light loam S 2
Surface sediments
permeability
Very high Gravel, sand and gravel, Holocene aeolian
sand and Pleistocene alluvial sand
LS -2
High Sand (except those identified above) LS -2
Moderate Silt, peat and Weichselian till S 2
Low Central Glacial till and glaciolacustrine clay S 2
Hydrological/hydrogeological
Shallow groundwater
vulnerability
Very high Migration time of pollutants to groundwater
table:
0–1 years
LS -2
High 1–2 years MS 1
Moderate 2–5 years S 2
5–7 years S 2
7–10 years S 2
Groundwater sources
protection
Wellfield protection
zones
E –
Surface water protection Lakes protection zone Distance to lake \500 m, 200 m E –
Rivers protection zone Distance to river \150 m E –
Morphologic
Slope gradient Flat \1 % S 2
Flat to gentle 1–2 % S 2
Gentle to moderate 2–5 % MS 1
Moderate to steep 5–10 % LS -2
Steep [10 % U 0
Conservation
Protected area Reserves, national and regional parks, Natura 2000 areas E –
Land use Forest E –
E eliminating, U unsuitable, LS least suitable, MS moderately suitable, S most suitable
1802 Environ Earth Sci (2013) 68:1797–1812
123
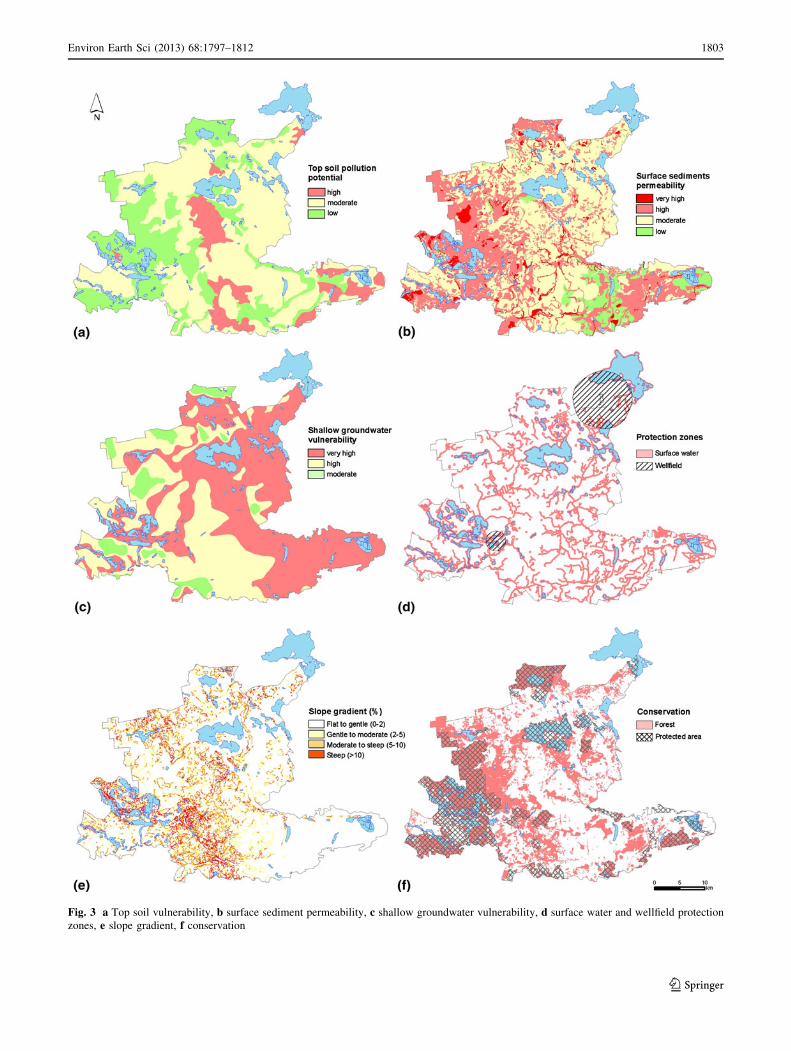
Fig. 3 a Top soil vulnerability, b surface sediment permeability, c shallow groundwater vulnerability, d surface water and wellfield protection
zones, e slope gradient, f conservation
Environ Earth Sci (2013) 68:1797–1812 1803
123
and rivers in order to avoid the penetration of pollutants.
Surface water bodies were derived from a topographic map
(1:10,000) and buffer zones were generated in a derivative
map (Table 3; Fig. 3d). The size of protection zones is
regulated by national legislation (MERL 2007) so buffer
zones with a size of 200 and 500 m were delineated for
lakes up to 200 ha, and for lakes larger than 200 ha,
respectively. The distances of 200 and 100 m were fixed
for the buffer zones of rivers having more than 50 km and
less than 50 km in length, respectively. The protection
zones of water bodies were assessed as eliminating criteria.
Morphological criteria were defined by slope gradient
to reflect slope erodibility. A digital elevation model
(DEM) was prepared employing ArcGIS 3D Analyst the
Triangular Irregular Network (TIN) on the basis of a
topographical map (1: 50,000). A slope map was derived
from the DEM of the study area and classified into five
classes based on slope erodibility potential (Table 3;
Fig. 3d). Flat to gentle slopes (0–2 %) were identified as
the most suitable areas for landfill location. Weakly
undulating plains and slopes of limited erosion potential
(2–5 %) were identified as moderately suitable. Steep
slopes occurring in the hilly relief and characterized by
high erodibility potential ([10 %) were classified as
unsuitable.
Conservation criteria included protected areas (nature
reserves, national and regional parks, Natura 2000 sites)
and all types of forest which were considered as elimi-
nating criteria and excluded the area from further assess-
ment according to legal requirements (GRL 2012)
(Table 3; Fig. 3d).
Socio-economic criteria included components related to
the quality of the human living environment (e.g. resi-
dential and recreational areas) and possible economic costs
(e.g. investments needed for area development and infra-
structure) (Table 4).
Geotechnical properties of sediments. The suitability of
the geological environment for engineering constructions
in Lithuania mainly depends on the distribution of fine- and
coarse-grained sediments and their physical–mechanical
properties (Buceviciut _e et al. 1995, 2004). The most
important parameter for the classification of sediments
considering their strength is the deformation module
(E) for biogenic soils and conic resistance (q) for cohesive
and non-cohesive soils. According to a summarized engi-
neering geology map of Lithuania, soils considering their
strength parameters were categorised into several classes:
biogenic viscous soils, highly compressible (E B 2 MPa);
cohesive soils, soft (q \ 1 MPa); firm (1–3), stiff (3–5) and
very stiff ([5); non-cohesive soils, soft (q B 2 MPa); firm
(2–6), stiff (6–10) and very stiff ([10). Quaternary sedi-
ments (map scale 1: 50, 000, Valiunas et al. 2000) were
classified into five classes according to the strength
parameter of soil and their suitability conditions for the
allocation of potential pollution sources were assessed
(Table 4; Fig 4a). Highly compressible organogenic soils
are unsuitable for any engineering construction. Stiff and
very stiff soils, being the best basement for engineering
construction, were recognized as the most suitable for the
location of pollution sources.
Protection of mineral resources All the deposits of
mineral resources are grouped according to the classifica-
tion of solid mineral resources of Lithuania (LGSME 1999)
by three criteria: extent of geological exploration, possi-
bilities of resource utilization and the economic value of a
resource. The protection status of mineral resources is
based on the extent of geological exploration, i.e. mineral
resources explored in detail, explored in general or prog-
nostic (detected or supposed). Explored deposits of mineral
resources were defined as eliminating criteria due to pro-
hibited engineering constructions in these areas (GRL
2012). Deposits and prognostic areas of mineral resources
were derived from a map of mineral deposits (map scale 1:
50,000, Valiunas et al. 2000) (Fig. 4b). Construction is not
recommended in the prognostic areas of mineral deposits
since these areas may be prospected, explored and prepared
for exploitation in the future. The prognostic areas of
mineral deposits were evaluated as the least suitable for the
allocation of potential pollution sources (Table 4).
Wind exposure was considered because potential pollu-
tion sources (landfills, farms) should not be exposed to
wind because of the odour effect, but it is not based on
legal restriction. According to long-term data, west and
southwest winds prevail (wind frequency 40 %) in the
study area (Lithuanian Hydrometeorological Service,
unpublished data). A wind exposure map (Fig. 4c) was
derived from the DEM. Zones exposed to west and
southwest winds and flat areas exposed to any wind
direction were given the lowest suitability score. Zones
exposed to winds from the northeast and north winds
(average wind frequency about 7 %) have been recognized
as the most suitable, while other zones were classified as
being moderately suitable (Table 4).
Accessibility to pollution sources was considered in the
context of waste transportation and response to an accident.
The pollution sources should be located at a place where it
can be reached by roads under all weather conditions. Three
zones having different distances from roads were selected
according to recommendations (MERL 2000), but it is not
strictly defined. Zones at a distance of 200 m from roads
were evaluated as the most suitable and distances of more
than 500 m were recognized as the least suitable for the
location of potential pollution sources (Table 4; Fig. 4d).
Land use Limitation of the distance from pollution
sources to residential homes depends on their hazardous-
ness and varies from 10 to 1,500 m (GRL 2012). For
1804 Environ Earth Sci (2013) 68:1797–1812
123

example, landfills of solid municipal waste cannot be
located closer than 500 m to a residential home and pro-
tection zones with corresponding buffers were generated
around the residential homes or settlements (Fig. 4e).
Protective zones and recreational areas were considered as
eliminating criteria following legal requirements (Table 4).
An AHP method was employed to calculate the relative
importance (weights) of criteria and sub-criteria. The
analytical hierarchical model developed in this study only
included the limiting sub-criteria (Fig. 5). The comparative
judgment in the AHP relied on a pairwise comparison
matrix, where each factor was rated against every other
factor using a scale of relative importance (1–9) proposed
by Saaty (1980) (Table 1). In the first level of the hierar-
chy, environmental and socio-economic criteria were rated.
The equal importance of environmental and socio-eco-
nomic criteria was assumed and equal weights (0.5) were
assigned. At the level of sub-criteria, environmental and
socio-economic criteria were evaluated separately to
determine local weights (wl) for each class (Table 5).
Pairwise comparison matrix was filled by importance val-
ues for each pair of sub-criteria. As an example, suppose
that sediments permeability (SP) is moderately preferred
over the soil vulnerability (SV) criteria, a score of 3. Since
comparison matrix is reciprocal, if criterion SP receives a
score of 3 relative to criterion SV, criterion SV should
receive a score of 1/3 when compared with criterion SP.
The same logic was used to complete the environmental
and socio-economic matrixes of pairwise comparisons.
Finally, sub-criteria weights obtained from the matrixes
were multiplied by criteria weights to obtain the global
weights (wg) of the hierarchy. Since the consistency ratio in
this study did not exceeded 0.1, the matrix was accepted as
consistent.
Since the main aim in locating a pollution source is
containment of the pollution, an understanding of the
geological composition and behaviour of the ground and
surface water of the study area is required (Dorhofer and
Siebert 1997; Proske et al. 2005). The sub-criteria of
groundwater vulnerability and surface sediment perme-
ability were assessed as criteria of major importance for
groundwater protection. Slope gradient, while being an
important limiting criterion in hilly areas possessed a minor
importance in the slightly hilly terrain of the study area.
The protection of mineral resources (controlled by national
legislation) was important from an economic viewpoint
Table 4 Socio-economic criteria integrated in the land suitability analysis and its suitability evaluation
Criteria Sub-criteria Component Attribute Suitability
conditions
Suitability
score (vij)
Socio-
economic
Economic
Geotechnical
properties
of soils
High
compressibility
Biogenical deposits U 0
Soft Alluvial, lacustrine organic sand, slope wash deposits LS -2
Firm Lacustrine clay and silt, morainic loam and sandy loam
(gt III bl), eolian and lacustrine various grained sand
MS 1
Stiff Morainic loam and sandy loam (gt III gr), alluvial fine
grained and silty sands, limnoglacial, fliuvioglacial
various grained sand
S 2
Very stiff Central Glacial till, alluvial coarse and medium coarse
sand, limnoglacial, fliuvioglacial gravel and gravely
sand
S 2
Protection of
mineral
resources
Prospected and explored mineral deposits E –
Prognostic areas of mineral deposits LS -2
Accessibility Roads Distance to road 0–200 m S 2
Distance to road 200–500 m MS 1
Distance to road [500 m LS -2
Social
Wind exposure Aspect Flat, W, SW LS -2
NW, E, SE, S MS 1
NE, N S 2
Land use Residential area Distance to settlements \500 m E –
Recreational area – E –
E eliminating, U unsuitable, LS least suitable, MS moderately suitable, S most suitable
Environ Earth Sci (2013) 68:1797–1812 1805
123

Fig. 4 a Geotechnical properties of soils, b mineral deposits, c wind exposure, d accessibility, e land use
1806 Environ Earth Sci (2013) 68:1797–1812
123

and was consequently assessed as a criterion of major
importance in the socio-economic class.
Comparative AHP weights were integrated into the
criteria maps as additional attribute data. Data analysis was
performed by combining environmental and socio-eco-
nomic criteria maps using Boolean logic—arithmetical
overlay. Using this operation, new spatial data and new
topology were created in the output layer. A LSI was
estimated employing the SAW method according to the
formula (3).
Land delineated by environmental and socio-economic
eliminating criteria was removed from the final suitability
maps. All polygons indicated by the LSI were classified
into four qualitative suitability classes: unsuitable, the
least, moderately and the most suitable. Polygons having a
LSI of 0 were recognized as unsuitable. The rest of the LSI
values ranged from -1 to 1 and were divided into 3 equal
intervals to obtain three suitability classes (Table 6). Two
land suitability maps for the allocation of potential pollu-
tion sources were compiled according to environmental
(Fig. 6a) and socio-economic scenarios (Fig. 6b).
In the environmental scenario, protected areas, forests,
surface waters and wellfield protection zones were recog-
nized as eliminating criteria for the allocation of pollution
sources according to the legal restrictions. Eliminated
zones were widespread in the western part of the study area
due to the high number of protected areas and extensive
forest and in the northern part due to the appearance of a
wellfield protection zone. Legally restricted zones elimi-
nated 68 % of the total municipality area. Unsuitable areas
covered approximately 1 % and coincided with area of
steep slopes ([10 %). Suitable land distribution coincided
Fig. 5 Analytical hierarchy model for the allocation of pollution sources and overall weights of the environmental and socio-economic criteria
Table 5 Comparison matrix and the significance weighting of the environmental and socio-economic criteria
Environmental wl = 0.5 SV SP GV SG Local weights (wl) Global weights (wg)
Soil vulnerability (SV) 1 1/3 1/3 3 0.156 0.078
Sediments permeability (SP) 3 1 1 4 0.377 0.188
Groundwater vulnerability (GV) 3 1 1 5 0.395 0.197
Slope gradient (SG) 1/3 1/4 1/5 1 0.073 0.037
Socio-economic wl = 0.5 GP MR WE A Local weights (wl) Global weights (wg)
Geotechnical properties (GP) 1 1/3 3 3 0.244 0.122
Mineral resources (MR) 3 1 6 5 0.573 0.286
Wind exposure (WE) 1/3 1/6 1 1 0.089 0.045
Accessibility (A) 1/3 1/5 1 1 0.094 0.047
CR = 0.03
CR = 0.01
Table 6 Classification of the
study area according to
suitability level
Suitability level Land suitability
index (LSI)
Area (%) Land suitability
index (LSI)
Area (%)
Environmental
criteria
Socio-economic
criteria (%)
Overall
criteria
Eliminating – 68 72 – 95.5
Unsuitable 0 1 4 0 0.8
Least suitable -1 to (-0.33) 5 1 -2 to (-0.67) 0.2
Moderate suitable -0.33 to 0.34 15 21 -0.67 to 0.66 2.5
Most suitable 0.34–1 11 2 0.66–2 1
Environ Earth Sci (2013) 68:1797–1812 1807
123

Fig. 6 Land suitability map for the allocation of potential pollution sources in the study area based on a environmental criteria, b socio-
economic criteria
1808 Environ Earth Sci (2013) 68:1797–1812
123

with low-permeability sediments where the migration time
of pollutants is more than 1 year (Table 6; Fig. 6a).
Prospected mineral deposits, along with residential and
recreational areas, were assessed as eliminating criteria in
the socio-economic scenario. Eliminated areas were evenly
distributed in the study area due to the widespread resi-
dential areas. Legally restricted zones covered 72 % of the
total municipality area (Table 6). Biogenical sediments
were assessed as unsuitable due to their poor geotechnical
properties and covered more than 4 % of the study area.
Suitable areas were mainly distributed in the central part of
the municipality and coincided with stiff and very stiff soil
distribution (Fig. 6b).
The final overall suitability map integrated the envi-
ronmental and socio-economic scenario maps (Fig. 7). The
two maps were overlaid and the LSI values of both maps
were added. Approximately 8,000 polygons with different
LSI values, ranging from -2 to 2, were obtained after
processing the data. The final LSI values and correspond-
ing polygons were classified into four suitability classes
(Table 6). An additional 27 % of area was removed
from the environmental suitability map considering the
eliminating socio-economic criteria. Nevertheless, distance
to a residential area can be reduced depending on the type
of pollution sources, and the total area delineated by the
eliminating socio-economic criteria can be considerably
reduced. Approximately 90 % of the total municipality
area in the composite land suitability map was defined by
eliminating criteria. Suitable areas were concentrated in the
central part of the municipality, and only 3 % of the total
area was defined as suitable and could be recommended for
further investigation to allocate potential pollution sources
in the analysed municipality.
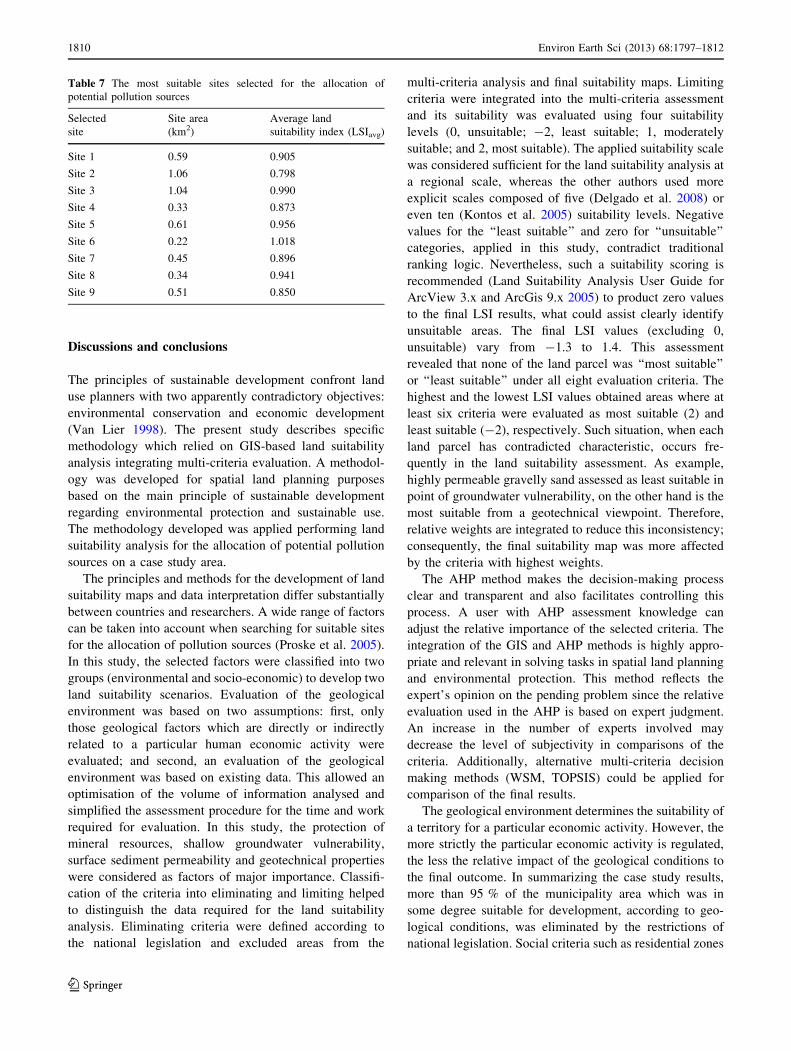
Nine parcels of land with an area larger than 0.2 km2
were selected as the most suitable for the allocation of
potential pollution sources (Table 7; Fig. 7). Each land
parcel was an aggregation of tiny polygons (from 172 to 48
each), with different LSI values. To determine the most
suitable sites, an average LSIavg was estimated for each
parcel. According to the LSI result the most suitable are
site 6 (1.018), site 3 (0.990) and site 5 (0.956), but site 3
has the largest area in comparing with others, what makes
it more suitable for the allocation of the large pollution
sources.
Fig. 7 Composite land suitability map for the allocation of potential pollution sources in the study area
Environ Earth Sci (2013) 68:1797–1812 1809
123
Discussions and conclusions
The principles of sustainable development confront land
use planners with two apparently contradictory objectives:
environmental conservation and economic development
(Van Lier 1998). The present study describes specific
methodology which relied on GIS-based land suitability
analysis integrating multi-criteria evaluation. A methodol-
ogy was developed for spatial land planning purposes
based on the main principle of sustainable development
regarding environmental protection and sustainable use.
The methodology developed was applied performing land
suitability analysis for the allocation of potential pollution
sources on a case study area.
The principles and methods for the development of land
suitability maps and data interpretation differ substantially
between countries and researchers. A wide range of factors
can be taken into account when searching for suitable sites
for the allocation of pollution sources (Proske et al. 2005).
In this study, the selected factors were classified into two
groups (environmental and socio-economic) to develop two
land suitability scenarios. Evaluation of the geological
environment was based on two assumptions: first, only
those geological factors which are directly or indirectly
related to a particular human economic activity were
evaluated; and second, an evaluation of the geological
environment was based on existing data. This allowed an
optimisation of the volume of information analysed and
simplified the assessment procedure for the time and work
required for evaluation. In this study, the protection of
mineral resources, shallow groundwater vulnerability,
surface sediment permeability and geotechnical properties
were considered as factors of major importance. Classifi-
cation of the criteria into eliminating and limiting helped
to distinguish the data required for the land suitability
analysis. Eliminating criteria were defined according to
the national legislation and excluded areas from the
multi-criteria analysis and final suitability maps. Limiting
criteria were integrated into the multi-criteria assessment
and its suitability was evaluated using four suitability
levels (0, unsuitable; -2, least suitable; 1, moderately
suitable; and 2, most suitable). The applied suitability scale
was considered sufficient for the land suitability analysis at
a regional scale, whereas the other authors used more
explicit scales composed of five (Delgado et al. 2008) or
even ten (Kontos et al. 2005) suitability levels. Negative
values for the ‘‘least suitable’’ and zero for ‘‘unsuitable’’
categories, applied in this study, contradict traditional
ranking logic. Nevertheless, such a suitability scoring is
recommended (Land Suitability Analysis User Guide for
ArcView 3.x and ArcGis 9.x 2005) to product zero values
to the final LSI results, what could assist clearly identify
unsuitable areas. The final LSI values (excluding 0,
unsuitable) vary from -1.3 to 1.4. This assessment
revealed that none of the land parcel was ‘‘most suitable’’
or ‘‘least suitable’’ under all eight evaluation criteria. The
highest and the lowest LSI values obtained areas where at
least six criteria were evaluated as most suitable (2) and
least suitable (-2), respectively. Such situation, when each
land parcel has contradicted characteristic, occurs fre-
quently in the land suitability assessment. As example,
highly permeable gravelly sand assessed as least suitable in
point of groundwater vulnerability, on the other hand is the
most suitable from a geotechnical viewpoint. Therefore,
relative weights are integrated to reduce this inconsistency;
consequently, the final suitability map was more affected
by the criteria with highest weights.
The AHP method makes the decision-making process
clear and transparent and also facilitates controlling this
process. A user with AHP assessment knowledge can
adjust the relative importance of the selected criteria. The
integration of the GIS and AHP methods is highly appro-
priate and relevant in solving tasks in spatial land planning
and environmental protection. This method reflects the
expert’s opinion on the pending problem since the relative
evaluation used in the AHP is based on expert judgment.
An increase in the number of experts involved may
decrease the level of subjectivity in comparisons of the
criteria. Additionally, alternative multi-criteria decision
making methods (WSM, TOPSIS) could be applied for
comparison of the final results.
The geological environment determines the suitability of
a territory for a particular economic activity. However, the
more strictly the particular economic activity is regulated,
the less the relative impact of the geological conditions to
the final outcome. In summarizing the case study results,
more than 95 % of the municipality area which was in
some degree suitable for development, according to geo-
logical conditions, was eliminated by the restrictions of
national legislation. Social criteria such as residential zones
Table 7 The most suitable sites selected for the allocation of
potential pollution sources
Selected
site
Site area
(km2)
Average land
suitability index (LSIavg)
Site 1 0.59 0.905
Site 2 1.06 0.798
Site 3 1.04 0.990
Site 4 0.33 0.873
Site 5 0.61 0.956
Site 6 0.22 1.018
Site 7 0.45 0.896
Site 8 0.34 0.941
Site 9 0.51 0.850
1810 Environ Earth Sci (2013) 68:1797–1812
123
eliminated 70 % of the analysed area. The area influenced
by social eliminating criteria may potentially increase in
municipalities with a higher population density, where
distribution of residential homes is more extensive, but on
the other hand, if population is concentrated in towns the
amount of the eliminating area could be even less. Socio-
economic criteria should be revised in each particular case
according to legal requirements and considering the type
and size of the pollution sources.
The accuracy and detail of the geological data collected
on the final land suitability maps were determined by the
scale and quality of the data used for the map compilation
(Proske et al. 2005). Criteria maps at a scale of 1: 50,000
were considered as appropriate for a land suitability anal-
ysis at the municipality scale. Criteria maps of different
scales were analysed in this study due to the lack of geo-
logical data at the desirable scale and consequently could
result in a lower accuracy of the final suitability maps.
Land suitability mapping can only be used as an initial step
in spatial planning, since actual suitability can only be
judged on the basis of a detailed investigation (Dorhofer
and Siebert 1997; Proske et al. 2005).
The proposed methodology can be applied for the entire
territory of Lithuania to fulfil environmental protection
tasks to minimize pollution effects: site selection for
landfills, temporary storage of waste or objects potentially
related to groundwater and soil pollution. Additionally, the
methodology developed could be applied for an assessment
of the hazardousness of already existing pollution sources.
Classified and assessed environmental criteria could be
applied in land suitability analyses in areas with similar
geological composition and hydrogeological conditions.
Additional criteria could be added or removed from the
suitability analysis as required. The methodology devel-
oped for the evaluation of a geological environment using
GIS and the multi-criteria decision-making method as well
as workflow designed in this study could be useful in
numerous spatial planning problems related to different
land usage (e.g. recreational, industrial). The compilation
of suitability maps possessing land suitability information
are a good example of the integration of complex geolog-
ical information into spatial planning process.
Acknowledgments This study was the subject of a Ph.D. thesis
prepared at the Institute of Geology and Geography and partially
supported by the State Studies Foundation of Lithuania. The authors
are grateful to Dr. Darius Daunys and two reviewers for their valuable
comments, which considerably improved the manuscript.
References
Baltrunas V, Diliunas J, Kadunas V, Valiunas J (1998) Environmental
geology and geochemistry in Lithuania. Geologija 26:5–26 (in
Lithuanian)
Buceviciut _e S, Marcinkevicius V, Dansevicien _e D (1995) Engineer-
ing geology map of Lithuania scale 1: 500,000. Geological
survey of Lithuania, Vilnius
Buceviciut _e S, Gadeikis S, Dundulis K, Ignatavicius V, Marcinkev-
icius V (2004) Engineering geology map of Lithuania scale 1:
1,000,000. In: Baltrunas J (ed) Evolution of Earth and its
resources. Vilnius
Council Directive on the Landfill of Waste (99/31/EC) Official
Journal L 182, 16/07/1999: 0001–0073
Delgado OB, Mendoza M, Granados EL, Geneletti D (2008) Analysis
of land suitability for the sitting of inter-municipal landfills in the
Cuitzeo Lake Basin, Mexico. J Environ Manage 28:1137–
1146
Diliunas J, Bajorinas V, Cyzius G, Jagminas E, Jurevicius A,
Kaminskas M, Karvelien _e D (2004) Groundwater technogenesis
features. In: Baltrunas J (ed) Evolution of Earth and its
resources. Vilnius, pp 481–514 (in Lithuanian)
Dobkevicius M, Klizas P, Piliciauskas V, Plankis M (1995) Field
measurements of filtration in aeration zone. Geologijos akiraciai
1:57–62 (in Lithuanian)
Dorhofer G, Siebert H (1997) The search for landfill sites—
requirements and implementation in Lower Saxony, Germany.
Environ Geol 35:55–65
GRL (2012) Government of the republic of Lithuania. Special
condition of land and forest use. Official Gazette No. 80–4168
(in Lithuanian)
Holman IP, Palmer RC, Leonavciute N (2000) Using soil and
Quaternary geological information to assess the intrinsic
groundwater vulnerability of shallow aquifers: an example from
Lithuania. Hydrogeol J 8:636–645
Jankowski P (1995) Integrating geographical information systems and
multiple criteria decision making methods. Int J Geogr Inform
Syst 9(3):251–273
Juodis J, Jasinskas J (1998) Soil map of Lithuania scale 1:300,000.
National land planning institute, Vilnius
Juodkazis V, Kanopien _e R, Sugalskien _e J (1998) Pollution sources of
geological. Geologijos akiraciai 2(30):45–54 (in Lithuanian)
Kanopien _e R, Marcinkevicius V (1995) Methodology of groundwatervulnerability assessment and mapping techniques. Geol sci-
ence achievements—nature conservation. Vilnius 44–46 (in
Lithuanian)
Kanopien _e R, Dansevicien _e D, Urbanovic E (2004) Shallow ground-
water vulnerability assessment and mapping in Lithuania (scale
1:200,000). Lithuanian Geological Survey under the Ministry of
Environment, Vilnius (in Lithuanian)
Kontos TD, Komilis DP, Halvadakis CP (2005) Siting MSW landfills
with a spatial multiple criteria analysis methodology. Waste
Manage (Oxford) 25:818–832
Lamelas MT, Marinoni O, Hoppe A, de la Riva J (2007) Suitability
analysis for sand and gravel extraction site location in the
context of a sustainable development in the surroundings of
Zaragoza (Spain). Environ Geol 55(8):1673–1686. doi:10.1007/
s00254-007-1116-955-65
Land Suitability Analysis User Guide for ArcView 3.x and ArcGis 9.x
(2005) NC Division of coastal management, center for geo-
graphic information and analysis. http://dcm2.enr.state.nc.us/
planning/user_guide_lsa2005.pdf
LGSME (1999) Lithuanian geological survey under the ministry of
environment. Classification of solid mineral resources of Lith-
uania. Official Gazette No.81-247 (in Lithuanian)
Malczewski J (1999) GIS and multicriteria decision analysis. John
Wiley and Sons, New York
Malczewski J (2004) GIS-based land-use suitability analysis: a
critical overview. Progress Planning 62(1):3–65
McHarg IL (1969) Design with nature. Natural History Press,
New York
Environ Earth Sci (2013) 68:1797–1812 1811
123

MERL (2000) Ministry of environment of the republic of Lithuania.
Regulation of construction, operation, closure, and monitoring
after closure of solid wastes landfills Official Gazette No.
96-3051 (in Lithuanian)
MERL (2007) Ministry of environment of the republic of Lithuania.
Description for the determination of Surface Water Body
Protection Zones. Official Gazette No. 23-892 (in Lithuanian)
MHRL (2003) Ministry of health of the republic of Lithuania.
Lithuanian hygiene standard HN 60:2004, maximum allowable
concentration of hazardous substances in soil. Official Gazette
No. 25-1019 (in Lithuanian)
Murphy MD (2005) Landscape architecture theory: an evolving body
of thought. Waveland Pr Inc, Long Growe
NSSD (2003) National strategy for sustainable development. Official
Gazette No. 22-652 (in Lithuanian)
Proske H, Vlcko J, Rosenbaum MS, Dorn M, Culshaw M, Marker B
(2005) Special purpose mapping for waste disposal sites. Bull
Eng Geol Environ 64(1):1–54
Saaty TL (1980) The Analytic hierarchy process. McGraw-Hill, New
York
Saaty TL (1996) Multicriteria decision-making: the analytic hierarchy
process. RWS Publications, Pittsburgh
Sener B, Lutfi Suzen M, Doyuran V (2006) Landfill site selection by
using geographic information systems. Environ Geol 49:376–388
Sener S, Sener E, Karaguzel R (2010) Solid waste disposal site
selection with GIS and AHP methodology: a case study in
Senirkent-Uluborlu Ispart) Basin, Turkey. Environ Monit Assess
173(1–4):533–554. doi:10.1007/s10661-010-1403-x
Siddiqui MZ, Everett JW, Vieux BE (1996) Landfill sitting using
geographic information systems: a demonstration. J Environ Eng
122:515–523
Simsek C, Kincal C, Gunduz O (2006) A solid waste disposal site
selection procedure based on groundwater vulnerability map-
ping. Environ Geol 49:620–633
Sugalskien _e J, Kanopien _e R (2002) Inventory of pollution sources.
Annual report 2001. Geological survey of Lithuania, Vilnius
Valiunas J, Guobyt _e R, Jonynas J, Sliaupa A, Vaitkevicien _e J (2000)
Scientific report. Evaluation of geological potential and ecogeo-
logical features of Ignalina municipality and digital ecogeolog-
ical maps compilation (scale M 1:50,000). Institute of geology,
Vilnius (in Lithuanian)
Van Lier HN (1998) The role of land-use planning in sustainable rural
systems. Landscape Urban Plan 41:83–91
WCED (1978) World commission on environment and development.
Our common future. Oxford University Press, Oxford
Weerakoon KGPK (2002) Integration of GIS based suitability
analysis and multi criteria evaluation for urban land use
planning; contribution from the analytic hierarchy process.
23rd Asian Conference on Remote Sensing. ACRS Urban
Planning, Kathmandu
1812 Environ Earth Sci (2013) 68:1797–1812
123