ghg emissions comparison between ev and biofuels
TRANSCRIPT

GHG Emissions Comparison
Between EV and Biofuels
Steffen Mueller, PhDPrincipal Economist
Stefan Unnasch Managing Director
Life Cycle Associates
May 2020

Challenge in Understanding GHG Emissions
• EVs have zero direct emissions
• Ethanol is a biogenic fuel using short-cycle carbon
• Emission comparisons need to be made on a life cycle basis
• Wide range of resource mixes and vehicle efficiency parameters affects comparison
2

GHG Emissions Metric
• The unit to quantify the GHG emissions of a liquid fuel is generally stated as the mass of carbon dioxide equivalent (including carbon dioxide, nitrous oxide, and methane) emitted per energy unit of fuel.
• The common unit of this carbon intensity (CI) is gCO2e/MJ. The diagram below details the life cycle emissions modeling boundaries for corn ethanol.
• For EV vehicles we calculate the life cycle emissions in gCO2e/MJ by using EER (Energy Economy Ratio) which allows to represent the electricity on a gasoline mileage equivalent basis. This is the methodology employed in the California LCFS market.
3

Life Cycle Boundaries of Corn Ethanol Production
4
Agricultural Inputs
Corn Farming
Corn Transport
iLUC
Ethanol Production
Ethanol Transport
Ethanol
Nutrients
DGS + Syrup + Corn Oil
Credit
Natural Gas
PowerFuelFeed

Comparison of Life Cycle GHG Emissions for Ethanol from Different Feedstocks Compared to Gasoline
Source: Michael Wang 2019; Argonne National Laboratory Transportation Group; Developer of the GREET Life Cycle Model 5
Well to Wheel Emissions WTW Gasoline
95 gCO2/MJ
Corn Ethanol57 gCO2/MJ
Stover Ethanol8 gCO2/MJ

Life Cycle Boundaries of Electric Power to EVs
6
NuclearFuel Oil
Coal
Transmission
SolarWind
Renewables
Electricity
Natural Gas Power
GenerationFeed
Solar/Wind

Electric Generation Mix
• Midwest is dominated by nuclear, coal, gas
7
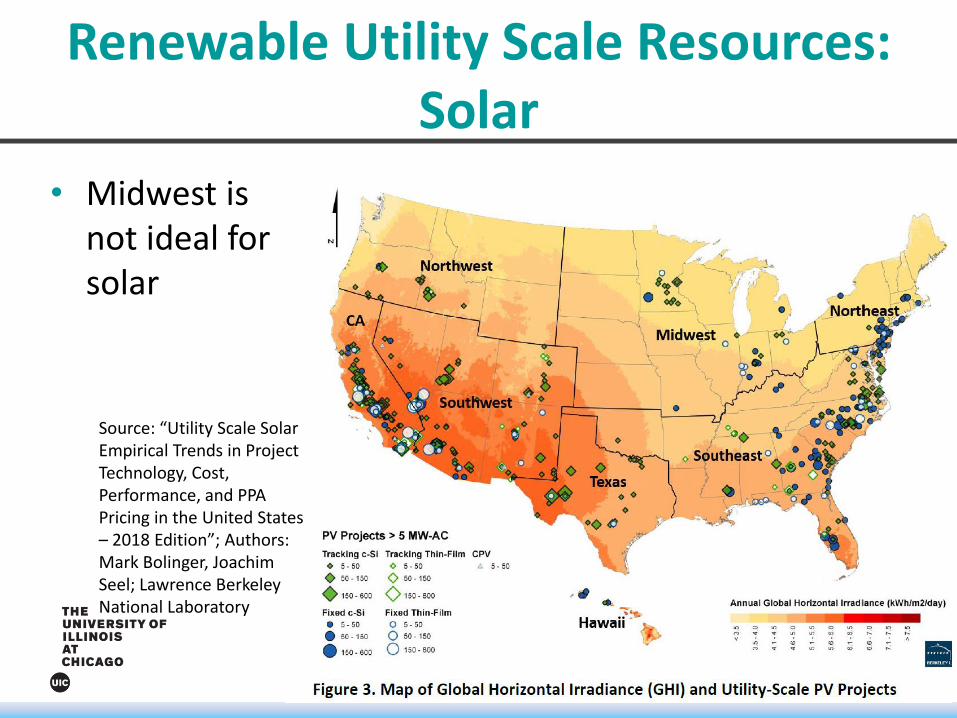
• Midwest is not ideal for solar
8
Renewable Utility Scale Resources: Solar
Source: “Utility Scale Solar Empirical Trends in Project Technology, Cost, Performance, and PPA Pricing in the United States – 2018 Edition”; Authors: Mark Bolinger, Joachim Seel; Lawrence Berkeley National Laboratory

• Within Corn Belt, only the western part of the corn belt provides wind resources
9
Renewable Utility Scale Resources: Wind

Electric Vehicles
10
• EV Vehicle Life Cycle GHG emissions depend on the Resource Mix and Emissions Rates of the Electricity Grid
• Emissions of Key Midwestern States (lbs/MWh):
MO: 1,712 IL: 818 IA: 1,077IN: 1,748KY 1,835MN 1,003SRMW 1,676
CA 422

eGrid Electricity Regions
• Example: SRMW Grid covers large regions of Missouri, Illinois, and Southern Iowa
11

Study Details• We modeled life cycle greenhouse gas emissions with different
parameterization of the US Department of Energy GREET model• We considered different ethanol fueled vehicle: E15 (15% ethanol by
volume), High Octane Fuel (HOF), E25 (25% ethanol by volume), E85 (85% ethanol by volume, Plug-in Hybrid Electric Vehicle (PHEV) fueled with E85.
• We considered different EV efficiencies during winter vs summer driving
• We considered different utility grid regions: CA vs. Midwest• We considered different carbon intensity values for ethanol:
o Current corn ethanol in GREET (57gCO2/MJ)o USDA forward looking corn carbon intensity (48 gCO2/MJ)o Corn stover cellulosic ethanol value in GREET (8gCO2/MJ)
12

Study Details
Assumptions behind the Delineation and Marginality of the Electricity Grid are very important and substantially drive the modeling results!• MW LCFS
o EV, E15, E85 PHEVo State Average Generation Mixo Utility Average Mix
• This Studyo EV, E15, HOF, E85 PHEV, Summer/Wintero Regional Generation Mixo Marginal Power Generation
13

Energy Economy Ratio
Energy Economy
• VISION2015
• NAS Transitions Report
• ANL C2G Analysis
• MTE (EPA and NHTSA Midterm Evaluation
• EPA Fuel Economy Guide
• CA ARB
• 1.5 kW Winter space heat
14

EV vs Biofuels: California Electric Utility Charging
• For California EV is the cleaner option
15

EV vs Biofuels: California Electric Utility Charging
• But Cellulosic Stover Ethanol is Competitive with EVs even in California
16

In Midwest: Ethanol is the Cleaner Fuel Option• In Winter Driving Conditions: E15, HOF, E85 and PHEV cleaner
than EV• In Summer Driving Conditions: HOF, E85, PHEV are cleaner than
EV and PHEV with high ethanol blends• PHEV vehicles on E85 have the added advantage of making use of
limited battery resources and providing space heating from IC engine.
17
EV vs Biofuels: Midwest Electric Utility Charging

2017 US Department of Agriculture Study on GHG Emissions of Corn Ethanol
• USDA report, titled “A Life-Cycle Analysis of the Greenhouse Gas Emissions of Corn-Based Ethanol,” finds that greenhouse gas (GHG) emissions associated with producing corn-based ethanol in the United States are about 43 percent lower than gasoline
• “GHG profile of corn ethanol will be almost 50 percent lower than gasoline in 2022 if current trends in corn yields, process fuel switching, and improvements in trucking fuel efficiency continue”o Note: This would result in 47.5 gCO2e/MJ
18
Analysis relies heavily on and cites repeatedly:J. Dunn, Z. Qin, S. Mueller, H-Y. Kwon, M. Wander, M. Wang ; Carbon Calculator for Land Use Change from Biofuels Production (CCLUB) Manual; October 07, 2016;https://greet.es.anl.gov/publication-cclub-manual

EV vs. Biofuels: Using latest USDA Life Cycle Data for Ethanol with Efficiency Improvements during Ag and Biorefining
• All higher ethanol blends (greater than E15) are cleaner than EVs
19

Socio-Economic-EnvironmentalConsiderations
20

Battery Production: Lithium and Cobalt Considerations
McKinsey Consulting “Lithium and cobalt: A tale of two commodities”; June 2018 Report https://www.mckinsey.com/industries/metals-and-mining/our-insights/lithium-and-cobalt-a-tale-of-two-commodities:• “More than 95 percent of the world’s lithium supply occurs as a
primary product in the form of brines or hard-rock ores, with a global production footprint including Australia, China, and Latin America.”
• “Conversely, less than 10 percent of cobalt supply occurs as a primary product, with the remainder produced as a by-product of primarily copper and nickel mines and more than 65 percent of global production concentrated in the Democratic Republic of the Congo (DRC). “
• “Clearly, cobalt represents the most pressing challenge, and users will need to look at their battery R&D to find diversifying technologies that will avoid the potentially supply-constrained raw material. This strategy is already taking place, with the development of the NMC 811 battery and initiatives to use even less cobalt in future batteries. “
21

Battery Production: Lithium and Cobalt Considerations
The Guardian Wed 18 Dec 2019 03.00 EST ’How the race for cobalt risks turning it from miracle metal to deadly chemical’• “If the prophets of technology are to be believed, the best hope for solving
the climate crisis is ever more efficient batteries. But the race to produce enough materials for this energy-storage revolution is creating a host of other environmental problems, as cobalt-producing nations like the Democratic Republic of the Congo, Zambia and Cuba are discovering.”
• “Lung disease and heart failure have been linked to high levels of this element, while the mines that produce it are blamed for devastated landscapes, water pollution, contaminated crops and a loss of soil fertility. Scientists are also investigating a possible link to cancer.”
22

Shift of Emission to Non Urban Areas
23
“Urban Use of Electric Vehicles rather than Conventional Vehicles typically moves the emissions (and, exposure and health impacts) to more rural locations

Shift of Emission to Non Urban Areas
• “For the first time at such a large scale, vehicle emissions are being transferred to power plants, potentially yielding dramatic exposure reduction.”
• “In some but not all cases, this transfer of emissions is expected to improve overall public health. However, this shift also transfers impacts to nonusers of the urban EVs, including potentially to low-income rural populations.”
• “With Conventional Vehicles, urban residents produce emissions and also bear the impacts (though causing within-urban distributional impacts).”
24

Shift to Rural Areas
• Midwest power plants in rural areas as well
25

Environmental Equity Implications
26
https://www.dw.com/en/electric-cars-low-earners-may-never-get-to-drive-one/a-50517095
9/20/19
https://www.sierraclub.org/sites/www.sierraclub.org/files/blog/EV%20Policy%20Toolkit.pdf
Joint Report by Sierra Club and Plug In America Promotes EV Vehicles but sees barriers for low income families.Model State & Local Policies to Accelerate Electric Vehicle Adoption POLICY TOOLKITVersion 2.0 June 2018;

Near Term EV Emissions Savings Only in Higher Income Neighborhoods
Income: EVs may potentially face an Environmental Justice problem: EV proponents promote vehicles based on tailpipe emissions benefits (often ignoring power plant emissions) but EV adoption in low income neighborhoods may be slower. Clean liquid fuels will benefit these neighborhoods.
Race: Our air quality modeling has shown that Chicago-area minority populations are over-proportionally exposed to pollutants in the proximity of expressway systems. Ethanol blends which reduce emissions will benefit minority populations
Presented studies are posted on the UIC Bioenergy Website
http://www.erc.uic.edu/biofuels-bioenergy/research27

Global Impacts: EVs Will be Coal Cars in Many Regions
• Reuters July 11, 2019: “TOKYO (Reuters) - Japanese utilities will rely on the return of coal-fired power plants from maintenance to meet peak electricity demand this summer, highlighting the country’s dependence on the more polluting fuel instead of natural gas.
• Coal-power stations capable of producing 10,437 megawatts (MW) of electricity will be fired up in the next few weeks, a Reuters survey of the companies shows.
28

Environmental Benefits of Ethanol Blends Compared to EVs
• We compared the greenhouse gas emissions from Electric Vehicles (EVs) to vehicles fueled by various ethanol-gasoline blends (E15, HOF, E85, PHEV E85). The study focused on a central Midwest Electricity Grid Region.
• Battery only EVs are not the only low emission solution:o We find that given the Midwestern electricity grid infrastructure ethanol
blends (rather than EVs) in many areas provide the larger greenhouse gas reductions across all studied ethanol blends.
o Plug-in electric hybrids (PHEV) fueled with E85 make best use of a limited battery resource (smaller battery needed, engine for space heating).
o In California, corn-based cellulosic ethanol provides the same emissions reductions benefits as EVs.
• For battery only EVs several trade offs exist: o Higher levels of battery production with global environmental impactso Transfer of emissions to rural areaso Transfer of emissions to low income neighborhoods within citieso Globally, in many countries EV vehicles will be “coal cars”
29

For Further Questions
30
Stefan Unnasch | Managing Director | Life Cycle Associates, LLC O: +1.650.461.9048 [email protected] | Follow us on LinkedIn
Steffen Mueller, PhD
Principal Economist
Energy Resources Center
The University of Illinois at Chicago
1309 South Halsted Street
Chicago, IL 60607
(312) 316-3498